When Does Vegetation Establish on Gravel Bars? Observations and Modeling in the Alpine Rhine River
 Francesco Caponi
 Aurélie Koch
 Walter Bertoldi
 David F. Vetsch1
  Annunziato Siviglia
- 1Laboratory of Hydraulics, Hydrology and Glaciology (VAW), ETH Zurich, Zurich, Switzerland
- 2Department of Civil, Environmental and Mechanical Engineering, University of Trento, Trento, Italy
Predicting when riparian vegetation establishes on river bars is crucial to estimate how morphology and ecology of gravel bed rivers respond to anthropogenic or climatic changes. However, the characteristic timescale required for vegetation establishment on gravel bars remains poorly investigated. The Windows of Opportunity (WoO) concept provides an ideal framework for estimating such timescale by analyzing time series of disturbance periods following seed dispersal. Here we present the results of a study conducted in a 41 km long reach of the Alpine Rhine river characterized by the presence of alternate gravel bars, which show differences in morphological activity and vegetated areas. We mapped the time evolution of vegetation cover between 1996 and 2017 by using aerial images and related vegetation occurrence to bar topography. Observations show that vegetation mainly colonized bar surfaces between 2005 and 2008, enduring on bars that showed less morphological activity. Only few patches, which were removed by downstream bar migration, were observed on bars that experienced significant morphological changes. This allowed us to identify conditions that were more favorable to vegetation recruitment and growth. To explain the vegetation pattern observed along the whole reach, we developed a simple modeling framework based on the WoO concept including the effects of flow variability on seed dispersal and seedling recruitment and survival. Model applications demonstrate that vegetation successfully establishes on bare areas if plants can withstand hydrodynamic disturbances for about 85 days after seed dispersal. We also identified timing and location of successful recruitment events and discussed how they are linked to bar morphology, seed dispersal, and riverbed morphodynamics. This study provides a first attempt to quantify the WoO in a gravel bed river with alternate bars, representing a step toward the development of quantitative tools for predicting river morphological trajectories.
1. Introduction
Predicting riparian vegetation establishment along river corridors is crucial to understand the impact of anthropic and climatic changes on river morphological trajectories. A number of studies in the last decades has highlighted that vegetation can easily grow and encroach river channels as a result of changes in flood frequency and magnitude (Osterkamp et al., 1998; Merritt and Cooper, 2000; Surian et al., 2015; Kui et al., 2017), sediment supply regime (Gran et al., 2015), and hydro-climatic conditions (Räpple et al., 2017). When established, riparian vegetation displays high resistance to disturbances, leading to a different biogeomorphic state (Corenblit et al., 2016; Serlet et al., 2018). The interaction between riparian vegetation and river morphology is controlled by several interrelated processes (Gurnell et al., 2012), acting on different timescales, and represented by the time required by vegetation to colonize bare sediments and the time required by the geomorphic processes to rework the riverbed (Paola, 2001). Quantification of these timescales represents a challenging but essential task to improve our ability to predict river morphological trajectories.
Factors controlling vegetation establishment have been long studied. Flow variability affects seed dispersal, germination, and early plant growth and survival (see Vesipa et al., 2017, for a recent review). Seeds and vegetative fragments are collected and transported by water along the river, and deposited over bare areas and river margins as water level recedes (Cunnings et al., 2016). On sufficiently moist substrates, seeds can germinate within a few hours (or days) (Karrenberg et al., 2002), mostly depending on their abundance, fluctuations in soil moisture (Guilloy-Froget et al., 2002), and sediment properties (Meier and Hauer, 2010). Growth and survival of seedlings then depends on how they respond to, and are adapted to cope with, flooding (Garssen et al., 2015). Long periods of inundation can inhibit plant growth limiting plant photosynthetic activity by submerging plant's canopy (Politti et al., 2018) and by depleting oxygen in the root zone (Friedman and Auble, 1999). Droughts can cause mortality by reducing soil moisture and pore water availability for root uptake (e.g., Mahoney and Rood, 1998; Johnson, 2000; Francis et al., 2005). In addition, flow erosion and sediment deposition during floods can cause uprooting and burial (e.g., Edmaier et al., 2011; Pasquale et al., 2014; Bywater-Reyes et al., 2015; Bankhead et al., 2017).
A range of quantitative models were developed to explore the effect of these processes on vegetation establishment. For instance, cottonwood recruitment was extensively studied by using the “box recruitment model” originally proposed by Mahoney and Rood (1998), which defined a successful recruitment band as a combination of root growth rate, water table receding rate, and seed dispersal period. This was extended to account for multiple species (Dixon and Turner, 2006), for their effect on population dynamics (Douhovnikoff et al., 2005), and to study the impact of flow regime alteration on vegetation population (Braatne et al., 2007). Transition between vegetated to bare states was also analyzed by means of a stochastic approach coupling flow variability, sediment transport, and vegetation dynamics (Bertagni et al., 2018). More ecologically comprehensive models (e.g., Benjankar et al., 2011, 2014) including different plant life stages were developed and used for predicting vegetation dynamics over decades and among a variety of environmental conditions (Garćıa-Arias et al., 2013). However, the co-occurrence of numerous processes influencing vegetation establishment and the wide spatial-temporal scales involved often hinder the underlying physical and biological thresholds responsible for successful vegetation establishment, limiting their quantification.
The Window of Opportunity (WoO) concept proposed by Balke et al. (2011) provides a valuable and simple modeling framework to study the timescale needed for early vegetation establishment in disturbance-driven systems. The model identifies three fundamental thresholds that vegetation has to exceed to successfully establish. Each threshold is expressed as a period of time needed for the vegetation to develop a specific resistance, as a function of plant's age. First, seeds need a sufficiently long time without inundation for germinating (WoO1; Balke et al., 2014). Second, small seedlings require a period of time to grow a substantial root system able to anchor them to the substrate (WoO2) and resist uprooting by flow drag (Type I uprooting, Edmaier et al., 2011). In this phase, seedlings also develop the capacity to withstand a period of inundation of up to tens of days. Then, seedlings require sufficient time to grow a root system able to withstand sediment transport and substrate erosion, which is the main cause of uprooting (Type II uprooting, Edmaier et al., 2011) (WoO3). The length of these three WoOs has been so far defined by means of laboratory experiments and field data (Balke et al., 2015) or derived from image-based observations (Hu et al., 2015). However, these estimates are limited to salt marshes in tidal systems and, to the best of our knowledge, analogous studies for riparian vegetation in gravel bed rivers have not been yet carried out.
In this study, we aim at identifying the physical and biological processes governing vegetation establishment and quantifying the timescale, in terms of WoO, required by plants to successfully colonize a bare area. We investigated a reach of the Alpine Rhine river (Figure 1) that displays an alternate sequence of gravel bars with different morphological activity (Adami et al., 2016). Observations showed that vegetation successfully established on the more stable bars, but not on others, providing an ideal case to quantify the WoO and how it is controlled by riverbed morphology (Koch, 2017). A series of aerial images covering a 41 km long reach of the Alpine Rhine in the period 1996-2017 were combined with topographical and hydrological data to provide an accurate database relating vegetation occurrence to riverbed elevation and flow regime. This allowed to explore the conditions favorable for vegetation establishment and to disentangle the role of different disturbances over more than two decades. To quantify the WoO length that explained the observed vegetation establishment pattern, we developed a simple modeling framework that includes the key effects of the flow regime on seed dispersal, recruitment, and seedling survival. By training the model on the time period where we first observed vegetation colonization in bare areas, we were able to estimate the WoO length and the likely location and timing of successful vegetation recruitment events. When hydrodynamic disturbances dominate, the model demonstrated that vegetation needs to surpass a minimum time period for successfully colonizing gravel bars, which depends on the balance between disturbance and resistance factors. In line with previous studies (e.g., Garćıa-Arias et al., 2013; Rivaes et al., 2015), our modeling approach can help developing predictive tools at support of river managers in the face of increasing antrophic pressures (Ward et al., 2002) and weather pattern changes (Tonkin et al., 2019).
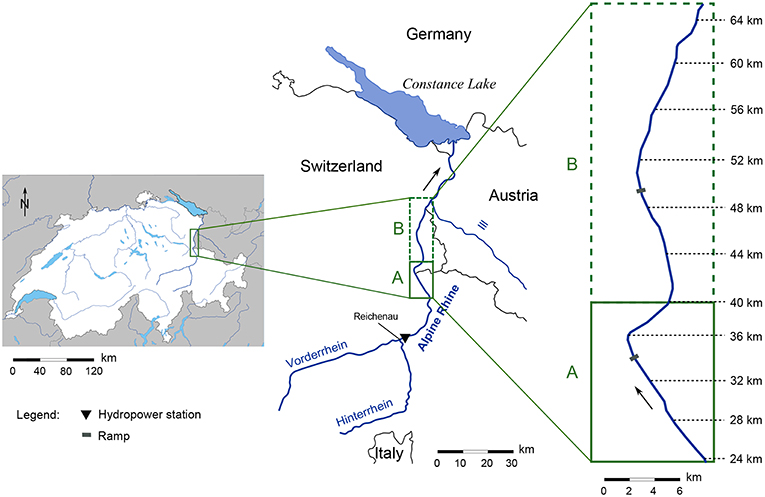
Figure 1. Map of the Alpine Rhine river and the studied reach between Landquart (Switzerland) and the Ill river confluence. The reach can be divided into two sub-reaches, A and B, which have different alternate bar morphology. Maps were obtained from d-maps.com and SwissTopo (2018). Distances along the reach are reported following the official Rhine mileage.
2. Study Area
The Alpine Rhine river is a 90 km long reach of the Rhine River located on the eastern side of Switzerland, from Reichenau to Lake Constance (Figure 1). It delineates the boundary between Switzerland, Liechtenstein, and Austria on about 1/3 of its length. The catchment area is 6,123 km2 and the main tributaries are the Plessure, the Landquart, and the Ill rivers. The flow regime is pluvionival characterized by snow-melt in spring and summer and with larger floods most likely occurring from August to October. The Alpine Rhine was channelized into straight reaches from the mid-nineteenth century to the 1970s. About 29 106 m3 of gravel were mined between 1936 and 1990 (Hunziker, 2015). Four artificial block ramps were constructed after 1972 to reduce bed erosion. In 1962 a hydropower station was built in Reichenau. The hydropower production regulates the discharge and affects the low flow regime (Adami et al., 2016). The analysis of discharge measurements recorded at Diepoldsau Rietbrucke, Switzerland, upstream from lake Constance, showed that the Alpine Rhine river is significantly impacted by hydropeaking (Carolli et al., 2015), with base flow discharges varying by about 70–80 m3/s (Adami et al., 2016).
We focused our study on the 41.7 km river reach between Landquart (km 23.3 of the Alpine Rhine, Landquart's drainage area: 618 km2) and the Ill river confluence (km 65.0, Ill's drainage area: 1,281 km2; see Figure 1). No other relevant tributary is present along the study reach. The river has a trapezoidal cross section, with a base width that increases from 85 m in the upstream part up to 106 m downstream. No floodplain is present and levees prevent any planform change. Bed material is primarily composed by gravel, with a median grain size ranging between 60 mm upstream and 20 mm downstream (Hunziker, 2015). Longitudinal bed slope decreases along the reach, from 2.9 to 1.3 m/km. The morphology is characterized by a series of ~80 alternate bars. Based on the results of a previous study carried out by Adami et al. (2016), we subdivided the reach into two sub-reaches: reach A (from km 23.3 to km 40), and reach B (from km 40 to km 65; see Figure 1). The 24 bars in reach A show a wavelength ranging between 1,200 and 1,700 m and are mostly steady (non-migrating), displaying a cumulative bar migration over the period 1999-2010 smaller than one river width. On the contrary, the bars (about 50) in reach B are much shorter, with a wavelength from 700 to 1,000 m showing a significant downstream migration of up to a whole wavelength in 10 years. Bar height varies (range between 2.6 to 4.1 m) locally along the reach due to the presence of ramps and channel bends (Adami et al., 2016), showing an average decreasing trend from reach A to reach B.
In our study site, vegetation growing on the alternate bars is mainly composed by Salicacae species such as Salix alba, Salix elaeagnos, and Populus nigra (surveyed in 2015 from km 35.3 to 38.4 by local authorities, Nemos, 2015), which are typical species found in gravel-bed rivers in temperate regions (e.g., Karrenberg et al., 2002; Gurnell et al., 2012; Politti et al., 2018).
3. Materials and Methods
Our analysis is divided into two main parts. First, we analyzed a series of aerial images from 1996 to 2017 of the whole reach to identify the spatial and temporal extent of the vegetation cover on the alternate bars. Second, we developed a simple model based on the WoO framework with the aim to quantify the length of the WoO required for vegetation establishment on bar surfaces and to predict location and timing of successful recruitment events.
3.1. Vegetation Classification by Aerial Image Analysis
We mapped the vegetation cover on the bars by using 8 high-resolution images (Table 1). Five orthoimages were provided by the project Geodata for Swiss Education (https://geovite.ethz.ch) and were georeferenced to the Swiss Grid projection CH1903+. The aerial images of 1996 and 1998 (Hunziker, 2015) and the WorldView satellite image (WorldView-2, 2017) were adjusted to fit the Swiss Grid projection. Image analysis was carried out using the software (QGIS, 2016) visualizing the images at a 1:1,000 scale. Exposed bars were manually classified into four different classes: (i) bare gravel; (ii) pioneer vegetation, represented by areas of sparsely growing, patchy vegetation, mixed with areas of gravel; (iii) dense vegetation, when vegetation completely covered the bar surface; and (iv) undefined zones, where it was not possible to assign any of the previous classes, e.g., areas covered by bridges or shadows. Such classification did not distinguish between woody, non-woody, and herbaceous vegetation but it was solely based on plant canopy density visible from aerial images. Vegetation occupation was calculated as the ratio between the vegetation area (as pioneer and dense vegetation classes) and the total bar area. The latter was quantified choosing the image with the lowest flow, i.e., with the maximum exposed area (Q = 102 m3/s, orthophoto of 2014) and was assumed constant over time.
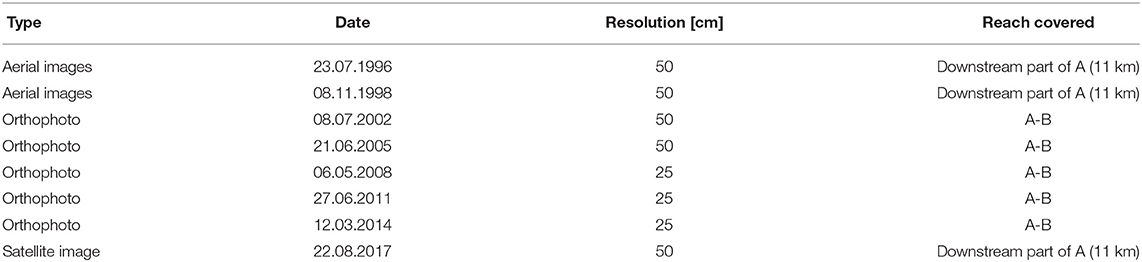
Table 1. List and characteristics of the imagery used in the analysis.
3.2. Bar Topography and Vegetation Elevation Distribution
Location of vegetated areas were coupled with 3D bed elevation data obtained from two topographic surveys of cross sections spacing 200 m, measured in 2005 and 2007 (Meisser Vermessungenen AG, 2007; Adami et al., 2016), and a digital elevation model (DEM) with a resolution of 2 m obtained by a lidar flight in 2014, which surveyed the emergent part of the bars (https://geovite.ethz.ch). Cross sections were used to characterize the bed morphology at the time we observed diffuse vegetation recruitment. On each cross section we identified the top of the bar surface (ToB) as the highest elevation of the bar, and we also estimated the minimum elevation of vegetation (MEV) as the lowest elevation where we observed vegetation. This point on the cross section represents the vegetated location most affected by flow disturbances and therefore will be used as the calibration metric for the model. DEM data were used to compute bed elevation frequency distributions and the associated vegetation distributions. DEM data were detrended by subtracting the average water surface elevation, as measured on the DEM itself, and corresponding approximately to a discharge of about 200 m3/s.
3.3. Discharge Time Series
We used hourly data for the period 1996-2018 of the gauging station Bangs in Voralberg (Austria) (Figure 2), located just upstream to the confluence with the Ill River (Figure 1). During the analyzed period the maximum recorded flood peak occurred on 17/06/2016 (Figure 2), and corresponded to nearly 30 years return period discharge (Qt = 30yr = 1825m3/s). The reach averaged value of the discharge at which the full cross section is expected to actively transport bed material as bed load is QFT = 650 m3/s (Adami et al., 2016). Discharges showed significant oscillations due to hydropeaking, as also reported by Carolli et al. (2015) at the gauging station in Diepoldsau Rietbrucke.
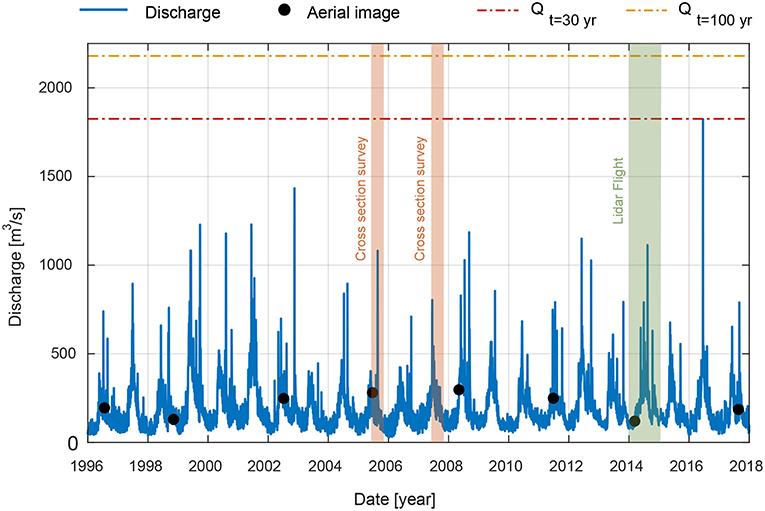
Figure 2. Discharge record measured at Bangs station (Austria) between 1996 and 2017. Dashed-dotted horizontal red and orange lines indicate the discharges with a return period of 30-years (Qt=30yr) and 100-years (Qt=100yr), respectively. Black dots represent the acquisition dates of the imagery. The time span in which cross sections were surveyed and the Lidar flight (for DEM) was conducted is also reported.
3.4. Water Surface Elevation Time Series
To quantify the time series of flow disturbances for each cross section, we transformed the discharge record in water surface elevation (WSE) obtained running fixed bed numerical simulations with the one-dimensional (1D) model BASEMENT (Vetsch et al., 2017). This allowed associating a WSE to each discharge given a cross section topography. The model solves the Saint-Venant equations for fluid and uses the Manning-Strickler approach for estimating the global flow resistance. We characterized the main channel and the bar surface with a roughness coefficient, Ks = 34 m1/3s−1, while a value of 25 m1/3s−1 was attributed to the river banks and the levees (Zarn, 2008). The vegetation growing on the bar surface was not taken into account for the roughness estimation, as it occupied only a mimimal fraction of the area when recruitment occurred. Normal flow was imposed as upstream boundary condition and a step-wise hydrograph (from Q = 1 to Q = 2, 500 m3/s) was simulated. The time between consecutive steps in the hydrograph was long enough to ensure the establishment of steady water surface elevation along the whole reach. Two different sets of water surface elevation—discharge (WSE-Q) relationships were derived, considering the cross sections data surveyed in 2005 and 2007, respectively. Between 2005 and 2007, morphological changes were considered to be negligible.
3.5. Vegetation Establishment Model
We developed a simple model for predicting vegetation establishment on (bare) bar surfaces following seed dispersal based on the WoO framework (Balke et al., 2011). The model explicitly accounts for the effect of flow variability, in terms of time series of water surface elevations, on seed dispersal and vegetation survival. During receding phase of floods, seeds are deposited on bare substrates and start growing. Young seedlings survival depends on the rate at which they increase their resistance to disturbance (flooding) and on the frequency and magnitude of the disturbance. For each point along a cross section, we compare the time series of disturbance against plant resistance. When the disturbance is smaller than the resistance vegetation can successfully establish, while it dies off otherwise. Figure 3 shows a schematic representation of the model processes with examples of successful (P1) and unsuccessful (P2) recruitment events.
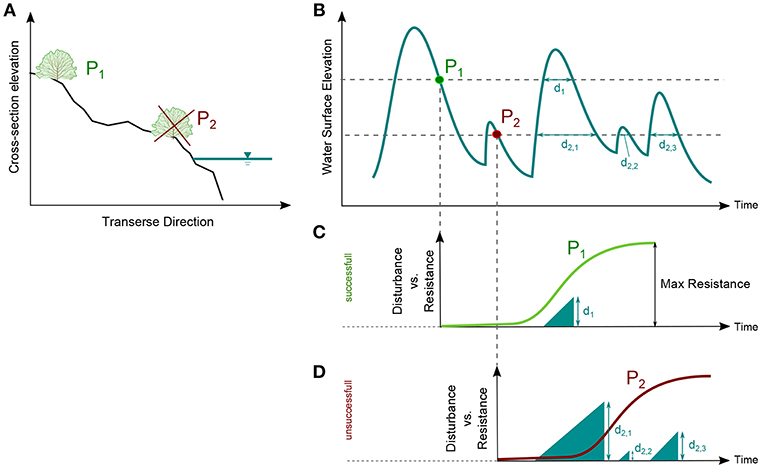
Figure 3. Schematic representation of the vegetation establishment model. P1 and P2 represent seed dispersal events occurring at different elevations. Location and timing of dispersal determine the disturbance time series that seedlings have to withstand for surviving. (A) Example of a cross section with two potential sites of vegetation establishment (P1 and P2); (B) Water surface elevation time series and dispersal events of P1 and P2; (C) Example of successful and (D) unsuccessful vegetation recruitment.
3.5.1. Seeds Dispersal
We considered that seeds dispersal can occur only within a defined dispersal window (DW), assumed to correspond to the warmer months, between April and October. We considered that seeds availability is unlimited, at each elevation above the water surface and during the whole DW. A seed dispersal event was defined as a point in time (evaluated at hourly scale) with lower water surface elevation than the previous point (Balke et al., 2014). Thus, the elevation at which vegetation can establish was represented by the water elevation of the previous point in time.
3.5.2. Plant Resistance Definition
In the most simple version of the WoO approach, plants die as soon as they are inundated in a time window of a fixed amount of days starting from the seed deposition on the riverbed (representing the length of the WoO1). This means plant resistance is 0 during the WoO1 and then suddenly increases to the maximum value. Here we considered that, as seeds deposited and germinated, they start increasing their resistance to disturbance. We assumed that vegetation resistance increases over time following a logistic law (e.g., Camporeale and Ridolfi, 2006), in the form:
where R [h] represents the resistance of vegetation of age a to consecutive inundation hours, Rmax [h] (carrying capacity of the logistic function) is the maximum resistance, and σ [h−1] is the rate at which vegetation increases its resistance. We assumed that vegetation can increase its resistance only during the growing season (GS), from April 1st to October 1st, when vegetative activity is boosted by warmer temperatures (Karrenberg et al., 2002). The length of the growing season was chosen according to previous studies, and it is typical for Salicacae sp. in temperate environments (Cooper et al., 1999; Karrenberg et al., 2002; Douhovnikoff et al., 2005). We used a logistic model because it is interestingly appealing for an interpretation in WoO terms. The initial low growth rate, typical of logistic functions, mimics the germination process, when vegetation has almost no resistance to any disturbance. An increase in resistance properties is expected after germination when the plant has successfully anchored to the ground with roots and has established a connection with the water table for water supply. The resistance then increases with age up to a maximum value, represented by the carrying capacity of the logistic model Rmax, with a rate σ that depends on various factors and is strongly dependent on plant growth rate (Francis et al., 2005). The maximum resistance that vegetation can exhibit may also vary among species, across environments, and depends as well on specific plant traits. Salicacae sp. are generally inundation-stress tolerant (Karrenberg et al., 2002). Adult plants have been reported to even survive inundation periods of about one growing season (Friedman and Auble, 1999; Glenz et al., 2006). Then, for a defined set of model parameters, we can interpret the logistic increase of the resistance as the sum of a WoO1 (the first part with a very low overall resistance) and a WoO2 (the second part, approaching the maximum resistance).
3.5.3. Disturbance Definition
Starting from the WSE-Q relationships, for each cross section, the disturbance time series at a given elevation point (see points P1 and P2 in Figure 3A) was defined as the sum of the consecutive hours of submergence (d1 for point P1 and d2, 1, d2, 2, and d2, 3 for point P2 in Figure 3B) and it is therefore represented by a linear increase (full triangles in Figures 3C,D). With this approach, we consider only disturbances related to inundation and uprooting caused by direct shear stress. The model does not consider sediment transport and bed adjustment, therefore excluding the uprooting caused by bed scour or plant burial.
3.5.4. Model Calibration
To calibrate the model we considered the period between 2005 and 2008, which was particularly favorable for vegetation recruitment. We selected all the bars along reach A and B that experienced a transition from bare state in 2005 to vegetated state in 2008 (Table 2). We neglected bars where vegetation was already present, even sparsely, prior the time period analyzed. In such cases, plants may influence the overall vegetation dynamics by altering seed dispersal process, providing vegetative fragments and favoring clonal spread which are not included in the model we developed (Dixon and Turner, 2006). We performed the calibration considering different bar cross sections subsets. We first used a subset of 8 bar cross sections, including all bars in reach A, and validated the model with those of reach B. This allows to test the reliability of the calibration results and its robustness considering bars with different morphology and sediment dynamics. To cross-validate the model calibration, we then calibrated the model by using 6 subsets, each composed by 4 cross sections randomly chosen including both cross sections from reach A and B.
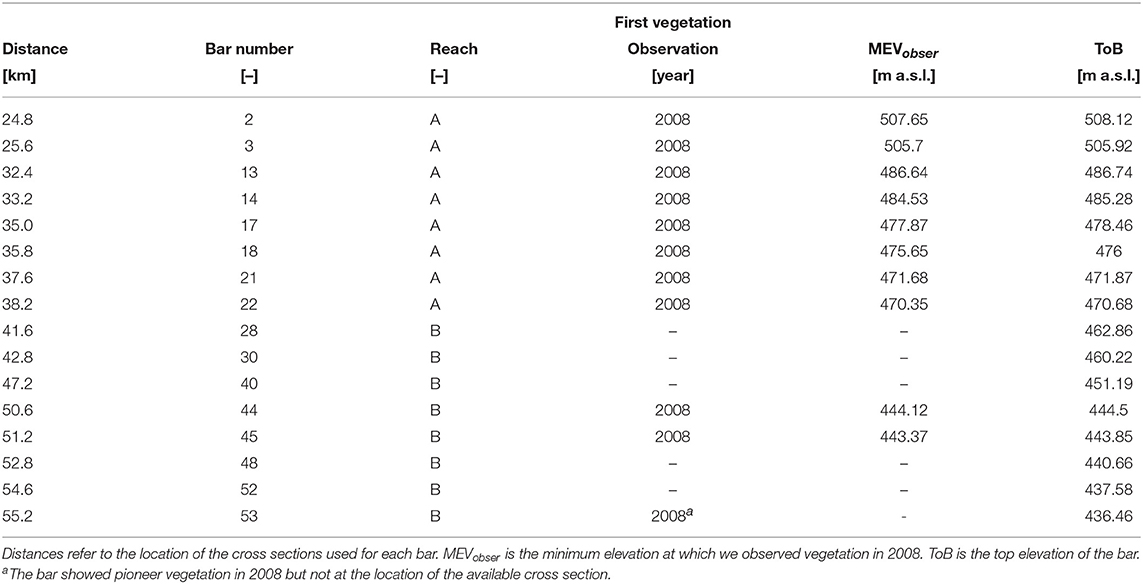
Table 2. Target bars used for model calibration and validation.
In the proposed model, disturbances are directly related to the time series of water surface levels. This means that points at lower bed elevations will be inundated for a longer period, possibly exceeding plant resistance. Here we hypothesized that the most limiting factor for vegetation establishment was the inundation frequency and magnitude. Therefore, the minimum elevation at which vegetation established (MEV) gives a simple parameter to calibrate the resistance function (Equation 1), as it represents the location at which the disturbance is maximum and below which vegetation cannot survive. In Equation (1), we fixed the maximum resistance Rmax (i.e., the longest continuous inundation period that the plant can sustain without dying) to 60 days, following Dixon and Turner (2006). A similar value (85 days) was also proposed by Friedman and Auble (1999) for box elder (see Glenz et al., 2006 for a review). The initial value of the resistance (which has to be greater than zero to allow for numerical integration of Equation 1) was set to 1 h, meaning that vegetation can resist 1 h of inundation right after dispersal before dying. The only calibration parameter is then the growth rate σ, which we varied in the range {0, 0.005}h−1. This range spans from vegetation that has no resistance (σ = 0 h−1) to vegetation that reaches the maximum resistance within one growing season, i.e., about 200 days (σ = 0.005 h−1). Then, for each value of σ, we compared the MEV observed along the bar cross section after the recruitment period in 2008 (MEVobser) with the MEV predicted by the model between 2005 and 2008 (MEVpred). Finally, we computed the average and the standard deviation among the cross sections analyzed for each growth rate and chose the optimal as the one which minimized the difference between MEVobser and MEVpred. To quantify the MEVpred, we ran the model along each elevation point of the exposed part of the bar cross section, selecting the minimum elevation at which the model predicted successful vegetation establishment, which occurs whether the resistance is greater than the disturbance during the whole period of time (2005–2008).
Due to lack of data on dispersal phenology in our study site, we tested two possible DWs: (i) from April 1st to October 1st, which coincides with the growing season; and (ii) from May 1st to August 1st (typical windows for Salicacae sp. (Guilloy-Froget et al., 2002; Karrenberg et al., 2002; Merritt and Wohl, 2002). We excluded from the analysis the DW in 2007 and early 2008, because the image resolution would not allow for the recognition of small seedlings (less than 1 year of age) that might have successfully colonized the bar a few months before image acquisition (in May, 2008, see Table 1).
4. Results
4.1. Observations
4.1.1. Vegetation Time Evolution
During the period 1996-2013, stable vegetation was observed only in reach A, where bar shape and exposed area did not change significantly. Therefore, vegetation occupation was calculated only for reach A where we observed an overall increase of the bar area covered by vegetation (pioneer and dense classes in Figure 4). Vegetation recruitment (transition from bare bed to pioneer vegetation) mainly occurred between 2005 and 2008. Correspondingly, the bar area occupied by pioneer vegetation has significantly increased between 2005 and 2011, from 2% to nearly 13%. Afterwards, the pioneer vegetation has decreased, to 5% in 2017. The dense vegetation class occupied about 4% of the bar area in 1996 and reached 19% in 2017. As a consequence, the total vegetation increased from 8.5% to nearly 23%, between 2005 and 2011, remaining almost constant in 2014 (22.7%) and 2017 (23.4%). The undefined area class ranged between 1 and 3% in the whole period, depending on the image quality, and therefore it does not alter significantly the results of the observations.
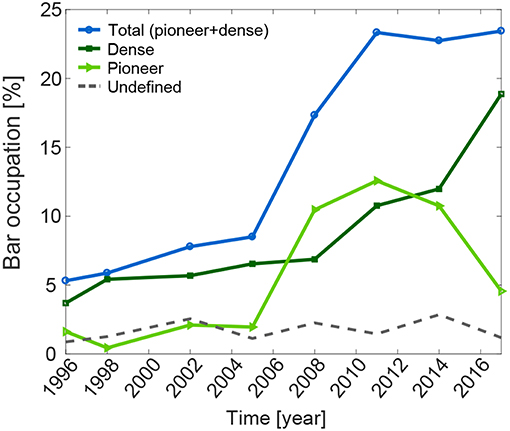
Figure 4. Temporal evolution of vegetation bar occupation as a proportion of the total bar area. Three classes are represented: pioneer and dense vegetation, and undefined zones.
The decrease of pioneer vegetation from 2011 was accompanied by an increase of dense vegetation, mostly because of an increase in vegetation density within the pioneer areas. Figure 5 shows an example on how the pioneer and dense vegetation classes have been identified for the bar at km 32.4. Most of the area classified as pioneer in 2011 developed into dense vegetated area by 2017.
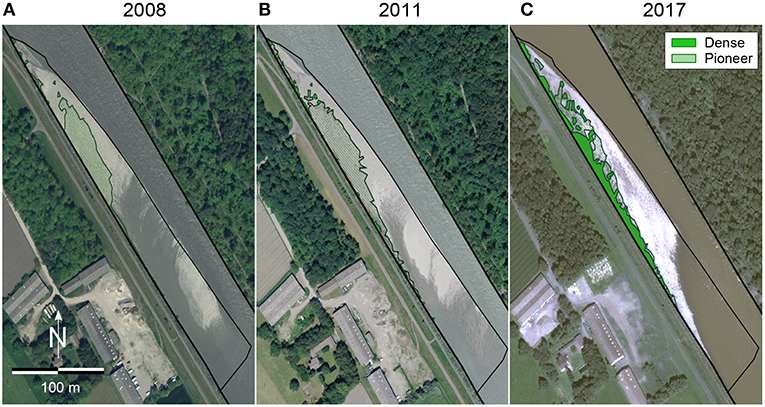
Figure 5. Example of vegetation establishment on bar at km 32.4 in reach A (see location in Figure 1). Pioneer vegetation was mapped for the first time in 2008 (A), gradually expanded in 2011 (B), and was partly transformed in dense vegetation by 2017 (C). Flow direction is from bottom to top.
Along reach B vegetation did not established, because of the larger morphological activity and the substantial downstream bar migration. The only exceptions are two bars located at km 50.6 and 51.2 (see Figure 6), where pioneer vegetation was observed in 2008, but subsequently removed by downstream bar migration between 2008 and 2011.
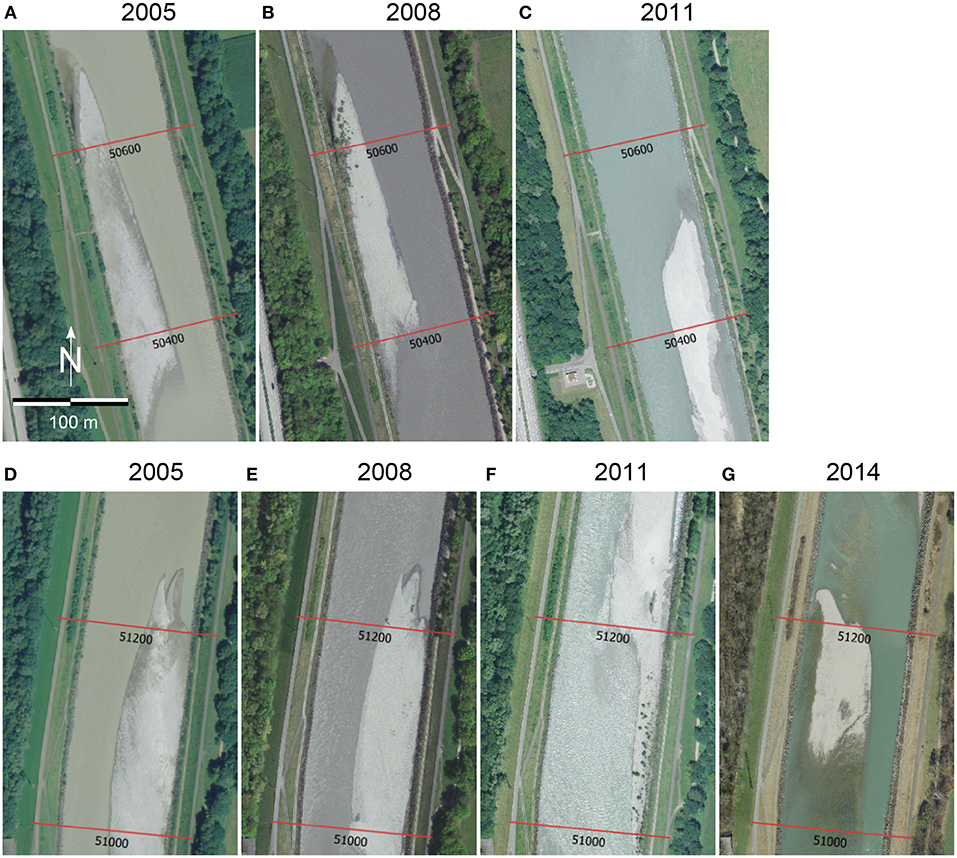
Figure 6. Example of vegetation establishment on two bars in reach B. Bar at km 50.60 developed some sparse vegetation in 2008 (A,B), but it was then removed before 2011 because of large downstream migration (C). Similarly, at km 51.20 the bar developed sparse vegetation from 2005 to 2008 (D,E), which persisted till 2011 despite bar migration (F), but was completely removed in the period 2011-2014 (G). Cross section locations are indicated with red continuous lines. Flow direction is from bottom to top.
4.1.2. Vegetation Spatial Evolution
In the whole studied period (1996-2017), reach A showed a consistent vegetation establishment on most of the bars, although with significant variability (Figure 7). Two bars (at km 27.8 and 36.4) showed no vegetation, probably due to artificial removal. The presence of sharp bends and one ramp affected vegetation recruitment, modifying bar shape, and dynamics. The bar at km 29.8 recorded the maximum value of vegetation occupation reaching almost 65% in 2017. We observed that recruitment occurred at a similar time along the whole reach. Between 2005 and 2011, the total vegetation occupation increased significantly in all vegetated bars, with a similar rate of change among all the bars. This result resembles the aggregated value found in bar occupation shown in Figure 4, in correspondence of the marked increase in pioneer vegetation class area.
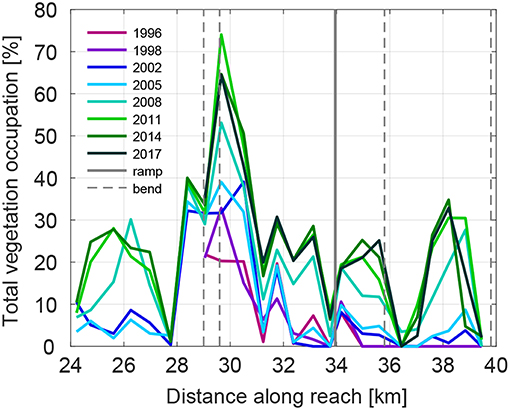
Figure 7. Longitudinal distribution of the total vegetation occupation as proportion of the total exposed area, for reach A. Distances along the reach represent the official Alpine Rhine mileage (see Figure 1). The presence of ramps and channel bends are reported with solid and dashed gray lines, respectively.
At the bar scale, we found that vegetation established up to the top of the bars. This demonstrates that water scarcity is not a limiting factor in this environment. Disturbance caused by flooding is the main driver of vegetation recruitment and establishment success. Figure 8A reports the bed elevation frequency distribution of the emerged bars in reach A. Vegetation starts developing for elevations higher than 0 m, i.e. immediately above the low flow water surface level. However, only for elevations higher than 1 m vegetation occupies a significant proportion of the area. The overall distribution shows two peaks, likely caused by the presence of two different bar forms, characterized by an elevation of 0.5 and 1 m, respectively. For comparison, Figure 8B shows the frequency distribution of the bed elevation for the bars located in the upstream part of reach B (until km 52.80). Here the frequency distribution of the emergent bars surface is much more peaked, with most of the area characterized by a relatively low bed elevation (≤ 0.5 m) and only a small fraction at higher elevation.
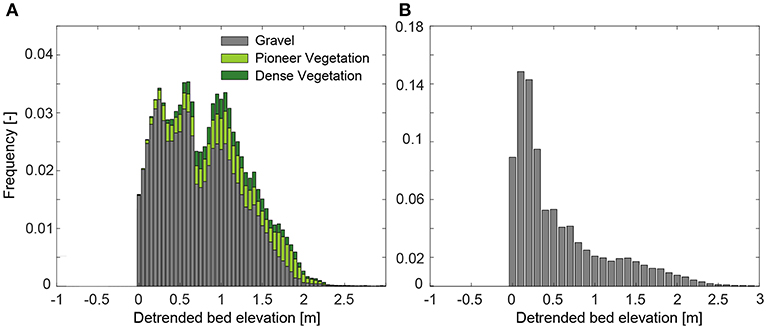
Figure 8. Frequency distribution of the bed elevation for the gravel, pioneer, and dense vegetation classes for vegetated bars in reach A (A) and for bare bars in reach B (B). A detrended bed elevation of 0 m corresponds to the water surface elevation as in 2014 estimated from the DEM.
Figure 9 reports the minimum elevation where we observed vegetation at the end of the recruitment period (MEVobser) and the ToB for a selection of bar cross sections (Table 2). The comparison between MEVobser and ToB gives an indication about the portion of the bar that was colonized by vegetation. The results confirm that vegetation was able to colonize the bars up to the top, and show that the ToB significantly varies along the reach. Bars that showed vegetation are higher than those that remained bare, which is particularly clear when looking at the ToB in reach B (from km 41.6 to 55.2, in Figure 9). Bars at km 35.8 and 37.6 show a ToB smaller than the average for the reach A, likely because they are located right downstream a sharp channel bend (see river profile in Figure 1). This may support the findings shown in Figure 8A where we observed the presence of two peaks of the bed elevation frequency distribution for the bars along reach A.
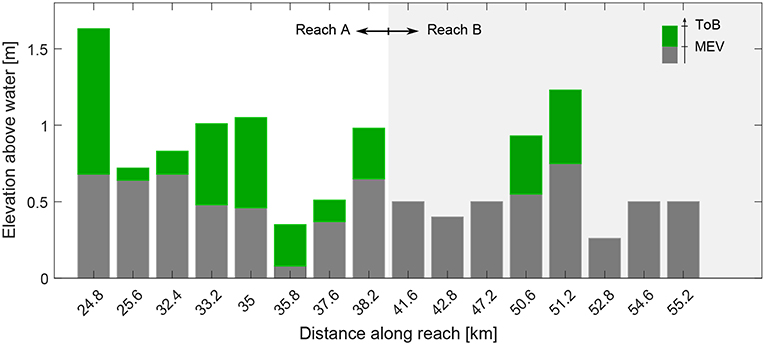
Figure 9. Minimum elevation at which vegetation was observed in 2008 (MEV) and top bar elevation (ToB). These values were calculated along the cross sections and for the selection of bars given in Table 2. Elevations are reported with respect to the average water level of the day when the image was taken in 2008.
4.2. Modeling
4.2.1. Model Calibration
Figure 10A shows the difference between the MEV predicted by the model (i.e., MEVpred) during the recruitment period (2005-2008) and the MEV observed in 2008 as a function of different growth rates, σ (Equation 1), considering a set of 8 bar cross sections along reach A. The calculation was carried out for two different dispersal windows. The best model prediction (MEVpred − MEVobser = 0) was obtained with a σ of about 0.001 [h−1]. As expected, the MEVpred decreases as the growth rate increases. Vegetation that increases its resistance faster (higher value of σ) is able to resist longer inundation periods during germination, which are indeed expected at lower elevations. On the other hand, a growth rate equal to 0 corresponds to vegetation that cannot withstand any disturbance. Therefore, the MEVpred for σ = 0 represents the bar elevation that was inundated only once between 2005 and 2008. The effect of different DWs length on the optimal growth rate can be observed by comparing the two thick lines (mean value) in Figure 10A. Both the DWs tested (April-September and May-July), were potentially suitable for vegetation to establish during the studied period. The minimum difference between the MEVpred and MEVobser was obtained for the same σ value. The standard deviation (shaded areas in Figure 10A) increases with σ until σ = 0.0017 [h−1] (standard deviation = 0.2 m) and stays constant for larger σ.
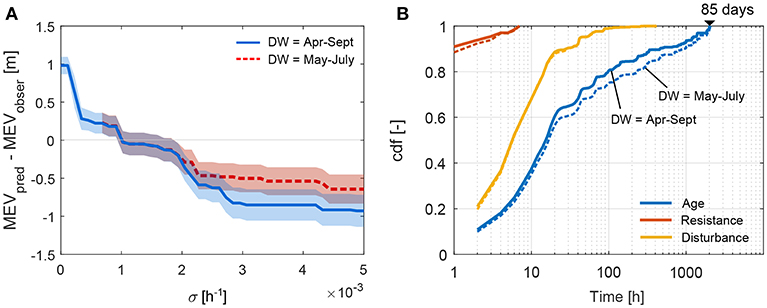
Figure 10. Results of the model calibration. (A) Difference between the minimum elevation at which the model predicts vegetation (MEVpred) and the observed value (MEVobser) for different growth rates, σ (Equation 1). Lines (solid and dashed) indicate the mean value of the MEV averaged over the cross sections analyzed and the light colored shade the standard deviation. (B) Cumulative density distribution of the age and relative resistance (Equation 1) of vegetation that did not establish (unsuccessful recruitment events). The disturbance (inundation duration) that caused plant mortality is also reported. Here solid lines indicate results obtained with a dispersal window (DW) between April and September, while dashed lines refer to a DW between May and July.
Model results were also analyzed for vegetation growing at locations that resulted not suitable during the recruitment period. Figure 10B shows the empirical cumulative frequency distribution of the vegetation at the time when the disturbance exceeded the plant's resistance. Vegetation died within 85 days (about 2,000 h) from the dispersal (age distribution in Figure 10B). By comparing the resistance that vegetation could build up within 85 days (red line in Figure 10B), calculated with σ = 0.001 h−1, with the inundations that caused plant mortality (orange line in Figure 10B), we observe that 90% of the inundation events lasted at least nearly 20 h. This corresponds to more than double than the resistance reached by the vegetation. The results show a similar trend regardless of the choice of the dispersal window.
4.2.2. Model Validation
Figure 11 shows the difference between MEV and ToB, considering both the model results (MEVcal) and the observation (MEVobser). Here, values greater than 0 represent locations that lie above the top of the bar and thus not available for vegetation recruitment. The left side of Figure 11 shows the comparison for the points we used to calibrate the model, with predictions of the vegetation occurrence reproducing the observations with an error lower than 0.2 m. Interestingly, MEVcal well matches MEVobser also for two migrating bars along reach B where vegetation was observed (Figure 6). Moreover, MEVcal is larger than 0 for all the other bars in reach B where we did not observed successful vegetation recruitment, meaning that the exposed bar area is not sufficiently high to permit vegetation colonization.
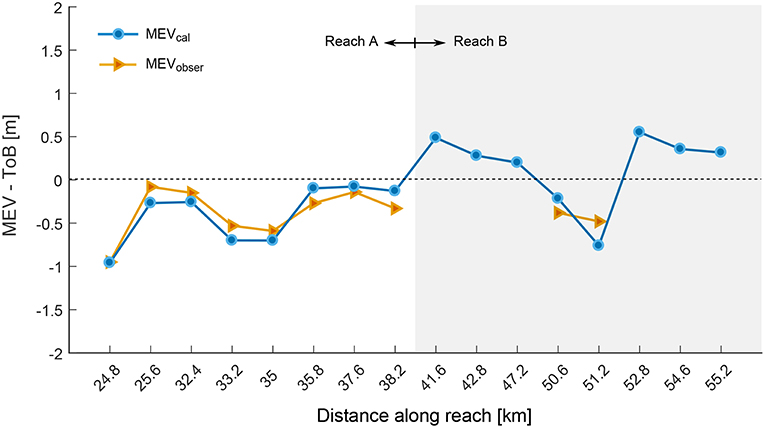
Figure 11. Results of the model validation. The minimum elevation at which the calibrated model predicts vegetation establishment (MEVcal) is compared with the MEVobser for a series of cross sections along the reach. Bars in the reach A were used for calibrating the model.
The timing and location of successful recruitment events, according to the calibrated model, are shown in Figure 12. In 2005, only one successful event occurred, during the falling limb of the flood in August with a peak discharge of 1,100 m3/s. Only for the bar at 38.2 km such flood resulted not suitable for recruitment. In 2006, most of the events occurred between May and July, thus during the shortest DW tested. Interestingly, the MEVcal (lowest green points in Figure 12) was identified in 2006 in all the bars, meaning that the lowest part of the bar could be colonized by vegetation only in 2006. On the other hand, the highest portion of the bars was colonized only during the 2005 for bars at 24.8, 33.2, 35, and 51.2 km because water level was not able to completely inundate the bars in 2006. This indicates that the vegetation pattern observed in 2008 resulted from a combination of two main dispersal events, one in 2005 and one in 2006.
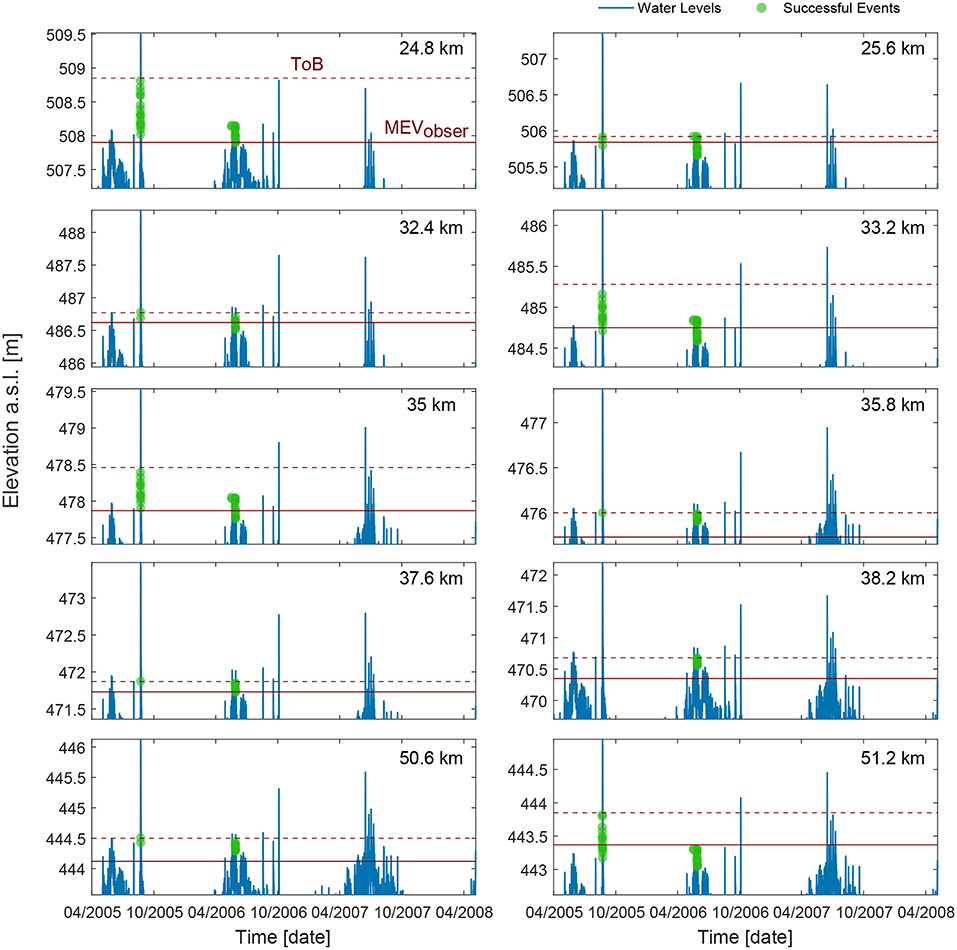
Figure 12. Timing and location of successful recruitment events calculated by the model. Water level for the recruitment period is shown with blue line for each cross section. The minimum elevation where we observed vegetation in 2008 (MEVobserv) is depicted with a solid horizontal line, while the top of the bar (ToB) with a dashed line.
5. Discussion
5.1. Timescale of Vegetation Establishment and Windows of Opportunity
The timescale that allows vegetation to successfully establish over bare areas is hard to estimate owing to presence of multiple inter-dependencies among biotic and abiotic factors controlling seed dispersal, germination and seedling growth and survival. The Window of Opportunity model (Balke et al., 2011) represents a valuable framework to study characteristics timescales required by vegetation to colonize a bare substrate. Our study indicates that vegetation that survived about 85 days from seed dispersal successfully developed on the more stable bars of the Alpine Rhine river (Figure 10B). In term of WoO, such time frame can be interpreted as the period of time that vegetation required to build a sufficient resistance for surviving inundation. Our results show that in most cases vegetation needed to develop a rather small resistance to inundation (only a few hours compared to the maximum value of 60 days) to survive the disturbance, while most of the vegetation that was not able to successfully establish already died within 24 h. This indicates that our estimate of the WoO length is mostly controlled by the length of the WoO1, when plants have small or no resistance to inundation. The chances of successful recruitment significantly increase when vegetation can cope with submergence up to 7 consecutive hours, i.e., after about 85 days in our model (Figure 10B). The consecutive days of submergence, which we used as a measure for disturbance, can be considered as a proxy of plant mortality by anoxia, occurring as a result of the disconnection of plant photosynthetic organs with atmosphere and consequent lack of oxygen for respiration (Politti et al., 2018), and by the uprooting by flow drag (Edmaier et al., 2011), where seedlings are dislodged as root anchoring fails to balance with drag forces exerted by the flow. A similar approach has been proposed by Hu et al. (2015) for predicting the establishment of salt marshes, where a threshold on excess shear stresses was used for the identification of the WoO instead. A number of studies has indicated that vegetation after the first growing season is already able to cope with anoxic conditions (see Politti et al., 2018, for a review about Salicacae sp.) and hydrodynamic disturbances causing uprooting (Bywater-Reyes et al., 2015; Bankhead et al., 2017). Our estimate for successful vegetation establishment indicates even a shorter time period (85 days) needed for plant to outgrowth and cope with such disturbances, pointing out the great capability of pioneer species to colonize heavily disturbed environments such as gravel bars.
The timescale for vegetation establishment and its related WoO length is strongly dependent on the disturbance applied and the specific traits that the plants develop to cope with such disturbance. Vegetation recruitment and survival during early growth phases has been largely reported to be threatened by droughts (e.g., Mahoney and Rood, 1998; Johnson, 2000), which is not included in our WoO estimate. Their effect on vegetation distribution is particularly evident along elevation gradients in river bars (Camporeale and Ridolfi, 2006). Vegetation often distributes in a relatively narrow range of elevations above the water table, mainly due to the combined effects of floods, able to remove plants at low elevation by uprooting, and droughts, limiting the water available to plant roots at high elevation that fail to elongate fast enough to keep pace with receding water table during germination (e.g., Mahoney and Rood, 1998; Johnson, 2000). However, this pattern has not been observed in our study site, where vegetation has always colonized the highest part of the bars, with pioneer (less dense) vegetation buffering zones between adult vegetation and gravel, bare areas (Figure 7). A similar pattern has been previously observed by Bertoldi et al. (2011) analyzing vegetation height class distributions along the Tagliamento river. The presence of vegetation at the top of the bars suggests that vegetation establishment was most likely not limited by scarcity of water but rather by the frequency and the duration of the inundations that followed seed arrival. The presence of short frequent water level fluctuations (i.e., hydropeaking), particularly relevant at low flow, may have limited vegetation expansion at lower elevations. We found that vegetation that did not survive during the recruitment period mostly died within a few hours from seed dispersal, likely related to frequent water level oscillations. The hydropeaking has been found to alter vegetation dynamics in rivers at different life stages, often hampering recruitment and early plant growth (Bejarano et al., 2018). In addition, seedling mortality by desiccation might be also hampered in alluvial gravel bars because of the presence of a thick layer of coarse sediments on the bar surface that help to retain pore water and to maintain a moist substrate, fundamental during seed germination and early vegetation growth (Meier and Hauer, 2010).
The morphodynamic disturbance is one of the most limiting factor for vegetation establishment in river bars, altering the timescale required to vegetation for colonizing a bare area (Gilvear and Willby, 2006). Although we did not include the WoO3, which explicitly accounts for sediment disturbances such as burial and substrate erosion, the analysis of bar cross sections (Figure 13) clearly shows that most of the bars underwent only little morphological changes (less than 0.1 m) between 2005 and 2007, when vegetation recruitment occurred. The maximum discharge measured in such time period (Q = 803 m3/s) is lower than the fully transporting discharge (Q=829 m3/s) estimated by Adami et al. (2016) for the same river reach, meaning that sediment transport likely concentrates in the deepest part of the channel. This indicates that sediment dynamics might have played a minor role in vegetation recruitment, and thus in the quantification of the WoO length.
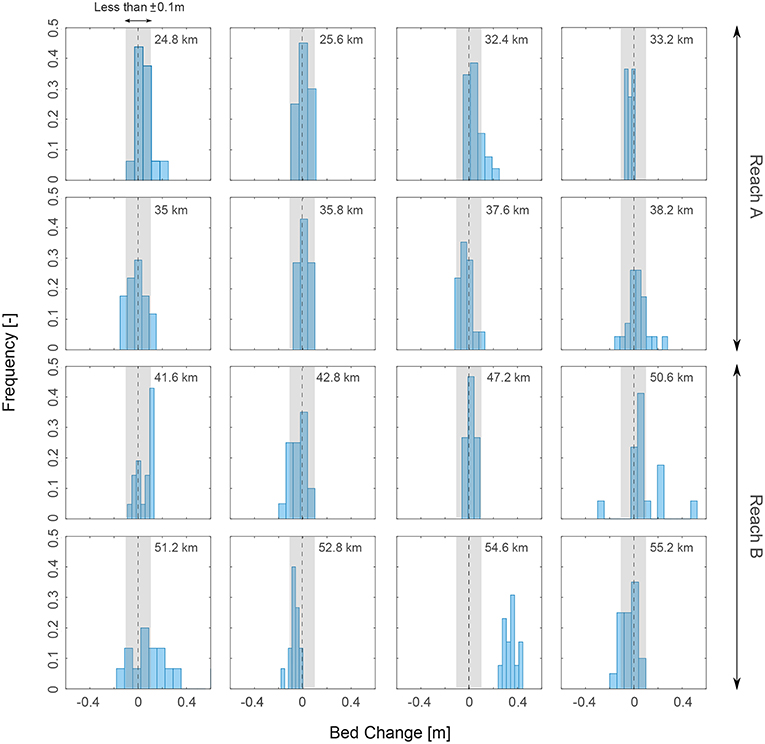
Figure 13. Frequency distribution of the bed level change occurred between 2005 and 2007. Erosion and deposition of the bar surfaces were mostly limited in a range of ±10 cm (gray area). In this analysis, we only accounted for the exposed part of the bar observed in 2008 for the bars listed in Table 2.
Seed dispersal timing can be also an important factor in vegetation establishment and its relative timescale when seeds or vegetative fragments are transported via water flow (hydrocory) (Nilsson et al., 2010). Seed dispersal has been hypothesized to already set the template for vegetation distribution at later succession stages determining the elevations at which seeds deposit and germinate (Merritt and Wohl, 2002; Mouw et al., 2013; Fraaije et al., 2015b). Our results show that within 5 years (2005-2011) vegetation was able to colonize a large portion of the bar surface and remained constant in the following years (Figure 4). This may indicate that the bar surface area possibly suitable for vegetation growth has been already occupied during the early phase of succession (geomorphic phase, Corenblit et al., 2007), which later converted into more mature vegetation stage. Our results show that the portion of bar colonized by vegetation depends on the elevation and can occur as a result of multiple dispersal windows. We have tested different dispersal windows for the recruitment period 2005-2008 and we found that a reduction of the DW did not influence the elevation on the bar at which vegetation established (Figure 10). Different DWs, however, could be relevant in the identification of the recruitment year. According to our model, successful recruitment in 2005 is only possible assuming a DW that extends until August (Figure 12). The occurrence of the flood in August hampered vegetation recruitment that could have occurred before in the season but also provided fresh moist substrate for vegetation colonization afterwards. The effect of moderate floods (such as the one occurred in August) on triggering extensive vegetation recruitment and encroachment, and the absence of subsequent big floods in the following years, has been already documented (e.g., Bertoldi et al., 2011; Räpple et al., 2017). In addition, riparian species can exhibit strong plasticity in dispersal strategy (Karrenberg et al., 2002) providing seeds also outside the DW between May and July (e.g., Guilloy-Froget et al., 2002). The timing of floods with respect to the dispersal window can undoubtedly affect vegetation establishment, and it can be increasingly important in the face of a shift of flood peaks occurrence because of climate change (Blöschl et al., 2017).
5.2. Bar Morphology Controls on Vegetation Establishment
Our findings clearly indicate that the bar morphology significantly influenced vegetation establishment along the Alpine Rhine river. During 2005 through 2017, vegetation has constantly increased (Figure 4) along the reach A, occupying almost 30% of the total bar surface in 2017. Conversely, along the reach B vegetation was absent and only two bars displayed vegetation in 2008. Bars along reach A are more stable, characterized by little migration rate, while bars along reach B are characterized by larger migration rates estimated about 1,000 m in the period 1999-2010 (Adami et al., 2016). Steady bars are often longer and higher than migrating bars (Jaballah et al., 2015; Adami et al., 2016; Serlet et al., 2018; Jourdain, C. et al., 2018), even tough Adami et al. (2016) found that bar height significantly varies along the Alpine Rhine river depending on local conditions, such as the presence of ramps or bends. We suggest that there are two degrees of control of bar morphodynamics on vegetation establishment. First, bar height controls the elevation at which seeds can be deposited on bar surface after dispersal, which is fundamental for determining the disturbance regime that vegetation would undergo in later succession stages. This can be observed by looking at the ToB (Figure 9) along the reach that show, on average, a decrease in the downstream direction and a rather higher value for bars that develop vegetation than those that remained bare. In addition, the location suitable for vegetation development according to our results (Figure 11) on bars that did not show vegetation during the recruitment period would lie between 0.2 to 0.5 m above the ToB. Second, bar morphodynamics set a strong limitation on vegetation survival due to erosion and deposition process causing plant uprooting and burial. Our results indicate that more stable (steady) bars are more prone to vegetation colonization due to higher elevations (see Figure 8), which favor successful recruitment, and less morphodynamic activity (Figure 13) reducing the probability of small seedlings to die by uprooting and burial. This is in line with the findings of Wintenberger et al. (2015, 2019). Migrating bars that are high enough to let seeds to settle, germinate and grow during the first years of development, can still undergo significant morphodynamic changes that can easily uproot or bury young seedlings and limit vegetation establishment. A number of studies has recently demonstrated that after channel stabilization and a reduction in bar mobility vegetation can easily colonize barren areas that would have been inaccessible due to frequent bed reworking (e.g., Corenblit et al., 2016; Serlet et al., 2018). These two degrees of control can be observed looking at the images in Figure 6 reporting the evolution of two migrating bars that showed vegetation at the end of the recruitment period. Here the bar height seems to be sufficient for vegetation recruitment and to guarantee a sufficiently long WoO for vegetation establishment (Figure 11). In both cases, vegetation is removed during bar migration that imposes an additional disturbance to the system, which is not included in our model (WoO3). Interestingly, some plants growing close to the riverbank remained in 2011 on bar at about km 51.2 (Figure 6B) but they were uprooted by bar migration occurred between 2011 and 2014. This would suggest that vegetation, with an age between 1 to 3 years, were not able to initiate any biogeomorphic feedback (Hortobágyi et al., 2017) able to stabilize the bar.
5.3. Potential and Limitations of the Modeling Approach
The modeling framework proposed in this study provided a valuable tool to quantitatively investigate the timescale needed for plant establishment in alternate bars in a gravel bed river. When properly calibrated, the model can be used to predict fundamental thresholds that vegetation has to surpass to cope with hydrodynamic disturbances such as waterlogging and type I of uprooting. Here we focused on early succession phases, namely seed dispersal, seedling recruitment, early growth and survival, as they represent the most vulnerable periods for vegetation to establish (Fraaije et al., 2015a). The model was thus not intended for simulating stand dynamics in later succession stages where the effect of co-occurrence of multiple species competing for resources may be dominant, which calls for more sophisticated ecological models (e.g., Benjankar et al., 2011).
To better understand the generality of the approach, some limitations have to be considered. First, we assumed that vegetation resistance increases with plant age following a logistic function (Equation 1). Although logistic growth is widely adopted for describing population dynamics in riverine environment (e.g., Camporeale and Ridolfi, 2006), the relation between plant resistance to inundation and plant age shall be considered in the light of the multiple adaptations and strategies adopted by riparian plant species to withstand disturbance (Garssen et al., 2015). Vegetation resistance can be associated to greater above ground biomass or plant height, as a mechanism to easily emerge from water, but also to different tissue properties and dormancy strategies. We also considered a constant growth rate in the logistic function. Despite the ability of the model to correctly reproduce the vegetation pattern observed, our model could be improved considering a growth rate that varies with species, level of disturbance, and specific plant traits (Francis et al., 2005; Hortobágyi et al., 2017). In this study, we mostly referred to Salicacae sp., as they represent the most abundant species in our study site, but other species exhibit very similar survival strategies to flooding and growth performance (Glenz et al., 2006).
Second, due to the limited number of observations used for calibrating the model, estimation of the WoO length could have been bias by the hydro-morphological conditions specific of our study site. However, the cross-validation of the model calibration performed with different subset of cross sections showed a variation in the growth rate estimate (σ) in the range [0.0008, 0.0016]. We found that such differences in σ did not change the statistics of the unsuccessful events (shown in Figure 10B), from which we estimated the length of the WoO of about 85 days. The subsets used contained both bar cross sections in reach A and B (see Table 2), thus including bars with different morphology, disturbance regime, and sediment dynamics. Furthermore, the data used for calibration, although limited in number, was specifically retrieved for disentangling the role of the hydrodynamic disturbance on the WoO1 and WoO2 estimates. The effects of riverbed changes (Figure 13) and other forms of recruitment on vegetation establishment were in fact assumed to be negligible in the calibration period.
Finally, our approach can be extended to account for the WoO3, including cases when sediment dynamics became significant. The effect of the morphodynamic disturbance can be incorporated by defining a proper resistance (and growth) function, in addition to Equation (1). As observed for migrating bars, uprooting can play a major role for determining vegetation establishment and a correct estimation of the WoO cannot prevaricate the inclusion of such effect. The length of the WoO3 is strongly associated to the plant root growth (Balke et al., 2011) and the ability of roots to securely anchor the plant to the ground avoiding uprooting of Type II (Edmaier et al., 2011) in rivers. The root distribution has been proposed to change the threshold for vegetation uprooting (Caponi and Siviglia, 2018), that in turn can strongly alter gravel bed river morphodynamics. River morphological trajectories should be considered in combination with both timescales of vegetation establishment and riverbed changes. Additional disturbances such as mortality by droughts, which can be an important cause for seedling mortality (e.g., Johnson, 2000; Braatne et al., 2007), could be also included.
6. Conclusion
We investigated the vegetation dynamics between 1996 and 2017 along a 41.7 km long reach of the Alpine Rhine river characterized by an alternate sequence of gravel bars. By analyzing aerial images, we observed a strong increase in vegetation cover between 2005 and 2011, with vegetation covering almost 30% of the total bar surfaces in 2017. We found that bar height had a fundamental control on vegetation establishment, both providing suitable areas for seeds to deposit and determining the disturbance regime that vegetation will undergo. To interpret the results obtained from the observations, we developed a model based on the Window of Opportunity (WoO) concept that searches for the minimum duration of time needed for vegetation establishment on (bare) gravel bar. Our results indicate that vegetation has to surpass a WoO of about 85 days to successfully colonize bare areas on stable (steady) bars, where morphodynamic disturbance is limited. Such estimate represents the time required for plants to withstand hydrodynamic disturbances, which resulted from the competition between plant growth rate and inundation frequency and magnitude. To the best of our knowledge, this represents the first attempt to quantify the characteristic timescale required for vegetation establishment in WoO terms in a gravel bed river. However, we found that bar morphodynamics adds a further control on vegetation survival that can predominate over disturbance driven by long submersion periods, especially along migrating bars where plants are significantly threaten by burial and uprooting. We were able to identify and predict the timing and location likely timing and locations of successful recruitment events and how these can relate with bar morphology, seed dispersal dynamics, and morphodynamics processes. The present results can have significant implications on the prediction of the co-evolution between vegetation and river morphology and on the development of quantitative tools for the prediction of river morphological trajectories.
Data Availability
The raw data supporting the conclusions of this manuscript will be made available by the authors, without undue reservation, to any qualified researcher.
Author Contributions
FC, WB, and AS contributed conception and design of the study. FC and AK performed research. FC wrote the first draft of the manuscript. AS and DV generated funding and provided the data. All authors contributed to manuscript revision, read and approved the submitted version.
Funding
This study was mainly funded by the Swiss National Science Foundation (grant 159813).
Conflict of Interest Statement
The authors declare that the research was conducted in the absence of any commercial or financial relationships that could be construed as a potential conflict of interest.
Acknowledgments
The authors would like to thank the institution for maintenance of the Alpine Rhine works of the canton St. Gallen (Rheinunternehmen) for providing cross sectional data.
References
Adami, L., Bertoldi, W., and Zolezzi, G. (2016). Multidecadal dynamics of alternate bars in the Alpine Rhine River. Water Resour. Res. 52, 8938–8955. doi: 10.1002/2015WR018228
Balke, T., Bouma, T. J., Horstman, E. M., Webb, E. L., Erftemeijer, P. L. A., and Herman, P. M. J. (2011). Windows of opportunity: thresholds to mangrove seedling establishment on tidal flats. Mar. Ecol. Prog. Ser. 440, 1–9. doi: 10.3354/meps09364
Balke, T., Herman, P. M. J., and Bouma, T. J. (2014). Critical transitions in disturbance-driven ecosystems: identifying Windows of Opportunity for recovery. J. Ecol. 102, 700–708. doi: 10.1111/1365-2745.12241
Balke, T., Swales, A., Lovelock, C. E., Herman, P. M. J., and Bouma, T. J. (2015). Limits to seaward expansion of mangroves: translating physical disturbance mechanisms into seedling survival gradients. J. Exp. Mar. Biol. Ecol. 467, 16–25. doi: 10.1016/j.jembe.2015.02.015
Bankhead, N. L., Thomas, R. E., and Simon, A. (2017). A combined field, laboratory and numerical study of the forces applied to, and the potential for removal of, bar top vegetation in a braided river. Earth Surface Process. Landforms 42, 439–459. doi: 10.1002/esp.3997
Bejarano, M. D., Jansson, R., and Nilsson, C. (2018). The effects of hydropeaking on riverine plants: a review. Biol. Rev. 93, 658–673. doi: 10.1111/brv.12362
Benjankar, R., Burke, M., Yager, E., Tonina, D., Egger, G., Rood, S. B., et al. (2014). Development of a spatially-distributed hydroecological model to simulate cottonwood seedling recruitment along rivers. J. Environ. Manage. 145, 277–288. doi: 10.1016/j.jenvman.2014.06.027
Benjankar, R., Egger, G., Jorde, K., Goodwin, P., and Glenn, N. F. (2011). Dynamic floodplain vegetation model development for the kootenai river, usa. J. Environ. Manage. 92, 3058–3070. doi: 10.1016/j.jenvman.2011.07.017
Bertagni, M. B., Perona, P., and Camporeale, C. (2018). Parametric transitions between bare and vegetated states in water-driven patterns. Proc. Natl. Acad. Sci. U.S.A. 115:201721765. doi: 10.1073/pnas.1721765115
Bertoldi, W., Gurnell, A. M., and Drake, N. A. (2011). The topographic signature of vegetation development along a braided river: Results of a combined analysis of airborne lidar, color air photographs, and ground measurements. Water Resour. Res. 47, 1–13. doi: 10.1029/2010WR010319
Blöschl, G., Hall, J., Parajka, J., Perdigão, R. A., Merz, B., Arheimer, B., et al. (2017). Changing climate shifts timing of european floods. Science 357, 588–590. doi: 10.1126/science.aan2506
Braatne, J. H., Jamieson, R., Gill, K. M., and Rood, S. B. (2007). Instream flows and the decline of riparian cottonwoods along the yakima river, washington, usa. River Res. Appl. 23, 247–267. doi: 10.1002/rra.978
Bywater-Reyes, S., Wilcox, A. C., Stella, J. C., and Lightbody, A. F. (2015). Flow and scour constraints on uprooting of pioneer woody seedlings. Water Resour. Res. 51, 9190–9206. doi: 10.1002/2014WR016641
Camporeale, C., and Ridolfi, L. (2006). Riparian vegetation distribution induced by river flow variability: a stochastic approach. Water Resour. Res. 42. doi: 10.1029/2006WR004933
Caponi, F., and Siviglia, A. (2018). Numerical modeling of plant root controls on gravel bed river morphodynamics. Geophys. Res. Lett. 45, 9013–9023. doi: 10.1029/2018GL078696
Carolli, M., Vanzo, D., Siviglia, A., Zolezzi, G., Bruno, M. C., and Alfredsen, K. (2015). A simple procedure for the assessment of hydropeaking flow alterations applied to several european streams. Aquat. Sci. 77, 639–653. doi: 10.1007/s00027-015-0408-5
Cooper, D. J., Merritt, D. M., Andersen, D. C., and Chimner, R. A. (1999). Factors controlling the establishment of Fremont cottonwood seedlings on the upper Green River, USA. Regul. Rivers Res. Manage. 15, 419–440. doi: 10.1002/(SICI)1099-1646(199909/10)15:5h419::AID-RRR555i3.0.CO;2-Y
Corenblit, D., Steiger, J., Charrier, G., Darrozes, J., Garófano-Gómez, V., Garreau, A., et al. (2016). Populus nigra L. establishment and fluvial landform construction: biogeomorphic dynamics within a channelized river. Earth Surface Process Landforms 41, 1276–1292. doi: 10.1002/esp.3954
Corenblit, D., Tabacchi, E., Steiger, J., and Gurnell, A. M. (2007). Reciprocal interactions and adjustments between fluvial landforms and vegetation dynamics in river corridors: a review of complementary approaches. Earth Sci. Rev. 84, 56–86. doi: 10.1016/j.earscirev.2007.05.004
Cunnings, A., Johnson, E., and Martin, Y. (2016). Fluvial seed dispersal of riparian trees: transport and depositional processes. Earth Surface Process. Landforms 41, 615–625. doi: 10.1002/esp.3850
Dixon, M. D., and Turner, M. G. (2006). Simulated recruitment of riparian trees and shrubs under natural and regulated flow regimes on the Wisconsin River, USA. River Res. Appl. 22, 1057–1083. doi: 10.1002/rra.948
Douhovnikoff, V., McBride, J. R., and Dodd, R. S. (2005). Salix exigua clonal growth and population dynamics in relation to disturbance regime variation. Ecology 86, 446–452. doi: 10.1890/04-0257
Edmaier, K., Burlando, P., and Perona, P. (2011). Mechanisms of vegetation uprooting by flow in alluvial non-cohesive sediment. Hydrol. Earth Syst. Sci. 15, 1615–1627. doi: 10.5194/hess-15-1615-2011
Fraaije, R. G., ter Braak, C. J., Verduyn, B., Breeman, L. B., Verhoeven, J. T., and Soons, M. B. (2015a). Early plant recruitment stages set the template for the development of vegetation patterns along a hydrological gradient. Funct. Ecol. 29, 971–980. doi: 10.1111/1365-2435.12441
Fraaije, R. G. A., ter Braak, C. J. F., Verduyn, B., Verhoeven, J. T. A., and Soons, M. B. (2015b). Dispersal versus environmental filtering in a dynamic system: drivers of vegetation patterns and diversity along stream riparian gradients. J. Ecol. 103, 1634–1646. doi: 10.1111/1365-2745.12460
Francis, R. A., Gurnell, A. M., Petts, G. E., and Edwards, P. J. (2005). Survival and growth responses of Populus nigra, Salix elaeagnos and Alnus incana cuttings to varying levels of hydric stress. For. Ecol. Manage. 210, 291–301. doi: 10.1016/j.foreco.2005.02.045
Friedman, J. M., and Auble, G. T. (1999). Mortality of riparian box elder from sediment mobilization and extended inundation. Regul. Rivers Res. Manage. 15, 463–476.
García-Arias, A., Francés, F., Ferreira, T., Egger, G., Martínez-Capel, F., Garófano-Gómez, V., et al. (2013). Implementing a dynamic riparian vegetation model in three european river systems. Ecohydrology 6, 635–651. doi: 10.1002/eco.1331
Garssen, A. G., Baattrup-Pedersen, A., Voesenek, L. A. C. J., Verhoeven, J. T. A., and Soons, M. B. (2015). Riparian plant community responses to increased flooding: a meta-analysis. Global Change Biol. 21, 2881–2890. doi: 10.1111/gcb.12921
Gilvear, D., and Willby, N. (2006). Channel dynamics and geomorphic variability as controls on gravel bar vegetation; River Tummel, Scotland. River Res. Appl. 22, 457–474. doi: 10.1002/rra.917
Glenz, C., Schlaepfer, R., Iorgulescu, I., and Kienast, F. (2006). Flooding tolerance of Central European tree and shrub species. For. Ecol. Manage. 235, 1–13. doi: 10.1016/j.foreco.2006.05.065
Gran, K. B., Tal, M., and Wartman, E. D. (2015). Co-evolution of riparian vegetation and channel dynamics in an aggrading braided river system, Mount Pinatubo, Philippines. Earth Surface Process. Landforms 40, 1101–1115. doi: 10.1002/esp.3699
Guilloy-Froget, H., Muller, E., Barsoum, N., and Hughes, F. M. M. (2002). Dispersal, germination, and survival of Populus nigra L. (Salicaceae) in changing hydrologic conditions. Wetlands 22, 478–488. doi: 10.1672/0277-5212(2002)022[0478:DGASOP]2.0.CO;2
Gurnell, A. M., Bertoldi, W., and Corenblit, D. (2012). Changing river channels: the roles of hydrological processes, plants and pioneer fluvial landforms in humid temperate, mixed load, gravel bed rivers. Earth Sci. Rev. 111, 129–141. doi: 10.1016/j.earscirev.2011.11.005
Hortobágyi, B., Corenblit, D., Steiger, J., and Peiry, J. L. (2017). Niche construction within riparian corridors. Part I: exploring biogeomorphic feedback windows of three pioneer riparian species (Allier River, France). Geomorphology 305, 94–111. doi: 10.1016/j.geomorph.2017.08.048
Hu, Z., Van Belzen, J., Van Der Wal, D., Balke, T., Wang, Z. B., Stive, M., et al. (2015). Windows of opportunity for salt marsh vegetation establishment on bare tidal flats: the importance of temporal and spatial variability in hydrodynamic forcing. J. Geophys. Res. G Biogeosci. 120, 1450–1469. doi: 10.1002/2014JG002870
Hunziker, R, Z. B. P. (2015). Einfluss von Vegetation auf Kiesbänken auf den Hochwasserspiegel im Alpenrhein. Technical report, Tiefbauamt St. Gallen, Rheinunternehmen, St. Gallen.
Jaballah, M., Camenen, B., Pénard, L., and Paquier, A. (2015). Alternate bar development in an alpine river following engineering works. Adv. Water Resour. 81, 103–113. doi: 10.1016/j.advwatres.2015.03.003
Johnson, W. C. (2000). Tree recruitment and survival in rivers: influence of hydrological process. Hydrol. Process. 14, 3051–3074. doi: 10.1002/1099-1085(200011/12)14:16/17h3051::AID-HYP134i3.0.CO;2-1
Jourdain, C., Claude, N., Antoine, G., Tassi, P., and Cordier, F. (2018). Influence of flood regime on riparian vegetation dynamics in rivers with alternate bars. E3S Web Conf. 40:02025. doi: 10.1051/e3sconf/20184002025
Karrenberg, S., Edwards, P. J., and Kollmann, J. (2002). The life history of Saliacaceae living in the active zone of floodplains. Freshw. Biol. 47, 733–748. doi: 10.1046/j.1365-2427.2002.00894.x
Koch, A. (2017). Vegetation Pattern Evolution on the Alternate Bars in the Alpine Rhine River: Image Analysis and Numerical Modelling (Master's thesis). Zurich: ETH Zurich.
Kui, L., Stella, J. C., Shafroth, P. B., House, P. K., and Wilcox, A. C. (2017). The long-term legacy of geomorphic and riparian vegetation feedbacks on the dammed Bill Williams River, Arizona, USA. Ecohydrology 10:e1839. doi: 10.1002/eco.1839
Mahoney, J. M., and Rood, S. B. (1998). Streamflow requirements for cottonwood seedling recruitment—An integrative model. Wetlands 18, 634–645.
Meier, C. I., and Hauer, F. R. (2010). Strong effect of coarse surface layer on moisture within gravel bars: results from an outdoor experiment. Water Resour. Res. 46, 1–10. doi: 10.1029/2008WR007250
Merritt, D., and Cooper, D. (2000). Riparian vegetation and channel change in response to river regulation: a comparative study of regulated and unregulated streams in the Green River Basin, USA. Regul. Rivers Res. Manage. 16, 543–564. doi: 10.1002/1099-1646(200011/12)16:6<543::AID-RRR590>3.0.CO;2-N
Merritt, D. M., and Wohl, E. E. (2002). Processes governing hydrochory along rivers: hydraulics, hydrology, and dispersal phenology. Ecol. Appl. 12, 1071–1087. doi: 10.1890/1051-0761(2002)012[1071:PGHARH]2.0.CO;2
Mouw, J., Chaffin, J., Whited, D., Hauer, F., Matson, P., and Stanford, J. (2013). Recruitment and successional dynamics diversify the shifting habitat mosaic of an alaskan floodplain. River Res. Appl. 29, 671–685. doi: 10.1002/rra.2569
Nemos (2015). Vegetationskartierung Kiesbänke Alpenrhein, Balzers fl und Wartau sg. Technical report.
Nilsson, C., Brown, R. L., Jansson, R., and Merritt, D. M. (2010). The role of hydrochory in structuring riparian and wetland vegetation. Biol. Rev. 85, 837–858. doi: 10.1111/j.1469-185X.2010.00129.x
Osterkamp, W., Scott, M. L., and Auble, G. T. (1998). Downstream effects of dams on channel geometry and bottomland vegetation: regional patterns in the great plains. Wetlands 18, 619–633.
Paola, C. (2001). Modelling Stream Braiding Over a Range of Scales. New Zealand Hydrological Society. Retrieved from the University of Minnesota Digital Conservancy. Available online at: http://hdl.handle.net/11299/164368.
Pasquale, N., Perona, P., Francis, R., and Burlando, P. (2014). Above-ground and below-ground Salix dynamics in response to river processes. Hydrol. Process. 28, 5189–5203. doi: 10.1002/hyp.9993
Politti, E., Bertoldi, W., Gurnell, A., and Henshaw, A. (2018). Feedbacks between the riparian Salicaceae and hydrogeomorphic processes: a quantitative review. Earth Sci. Rev. 176, 147–165. doi: 10.1016/j.earscirev.2017.07.018
Räpple, B., Piégay, H., Stella, J. C., and Mercier, D. (2017). What drives riparian vegetation encroachment in braided river channels at patch to reach scales? Insights from annual airborne surveys (Drôme River, SE France, 2005-2011). Ecohydrology 2017:e1886. doi: 10.1002/eco.1886
Rivaes, R., Rodríguez-González, P. M., Albuquerque, A., Pinheiro, A. N., Egger, G., and Ferreira, M. T. (2015). Reducing river regulation effects on riparian vegetation using flushing flow regimes. Ecol. Eng. 81, 428–438. doi: 10.1016/j.ecoleng.2015.04.059
Serlet, A. J., Gurnell, A. M., Zolezzi, G., Wharton, G., Belleudy, P., and Jourdain, C. (2018). Biomorphodynamics of alternate bars in a channelized, regulated river: An integrated historical and modelling analysis. Earth Surface Process. Landforms. 43, 1739–1756. doi: 10.1002/esp.4349
Surian, N., Barban, M., Ziliani, L., Monegato, G., Bertoldi, W., and Comiti, F. (2015). Vegetation turnover in a braided river: frequency and effectiveness of floods of different magnitude. Earth Surface Process. Landforms 40, 542–558. doi: 10.1002/esp.3660
Tonkin, J. D., Poff, N. L., Bond, N. R., Horne, A., Merritt, D. M., Reynolds, L. V., et al. (2019). Prepare river ecosystems for an uncertain future. Nature 570, 301–303. doi: 10.1038/d41586-019-01877-1
Vesipa, R., Camporeale, C., and Ridolfi, L. (2017). Effect of river flow fluctuations on riparian vegetation dynamics: processes and models. Adv. Water Resour. 110, 29–50. doi: 10.1016/j.advwatres.2017.09.028
Vetsch, D., Siviglia, A., Ehrbar, D., Facchini, M., Kammerer, S., Koch, A., et al. (2017). System Manuals of BASEMENT, Version 2.7. Laboratory of Hydraulics, Glaciology and Hydrology (VAW); Zurich: ETH Zurich.
Ward, J., Tockner, K., Uehlinger, U., and Malard, F. (2002). Understanding natural patterns and processes in river corridors as the basis for effective river restoration. Regul. Rivers Res. Manage. 17, 311–323. doi: 10.1002/rrr.646.abs
Wintenberger, C., Rodrigues, S., Greulich, S., Bréhéret, J., Jugé, P., Tal, M., et al. (2019). Control of non-migrating bar morphodynamics on survival of populus nigra seedlings during floods. Wetlands 39, 275–290. doi: 10.1007/s13157-018-1121-7
Wintenberger, C. L., Rodrigues, S., Villar, M., and Bréhéret, J.-G. (2015). Fluvial islands: first stage of development from nonmigrating (forced) bars and woody-vegetation interactions. Geomorphology 246, 305–320. doi: 10.1016/j.geomorph.2015.06.026
Keywords: riparian vegetation, gravel-bed rivers, alternate bar, windows of opportunity, Alpine Rhine
Citation: Caponi F, Koch A, Bertoldi W, Vetsch DF and Siviglia A (2019) When Does Vegetation Establish on Gravel Bars? Observations and Modeling in the Alpine Rhine River. Front. Environ. Sci. 7:124. doi: 10.3389/fenvs.2019.00124
Received: 23 May 2019; Accepted: 12 August 2019;
Published: 28 August 2019.
Edited by:
Paolo Perona, University of Edinburgh, United KingdomReviewed by:
Valentina Bau', University of Edinburgh, United KingdomTeresa Ferreira, University of Lisbon, Portugal
Copyright © 2019 Caponi, Koch, Bertoldi, Vetsch and Siviglia. This is an open-access article distributed under the terms of the Creative Commons Attribution License (CC BY). The use, distribution or reproduction in other forums is permitted, provided the original author(s) and the copyright owner(s) are credited and that the original publication in this journal is cited, in accordance with accepted academic practice. No use, distribution or reproduction is permitted which does not comply with these terms.
*Correspondence: Francesco Caponi, caponi@vaw.baug.ethz.ch