Monarch Habitat as a Component of Multifunctional Landscape Restoration Using Continuous Riparian Buffers
 Darius Semmens
 Zachary Ancona
- U.S. Geological Survey, Geosciences and Environmental Change Science Center, Denver, CO, United States
Stabilizing the eastern, migratory population of monarch butterflies (Danaus plexippus) is expected to require substantial habitat restoration on agricultural land in their core breeding area, the Upper Midwestern United States. Previous research has considered the potential to utilize marginal land for this purpose because of its low productivity, erodible soils, and high nutrient input requirements. This strategy has strong potential for restoring milkweed (Asclepias spp.), but may be limited in terms of its ability to generate additional biophysical, and socioeconomic benefits for local communities. Here we explore the possibility of restoring milkweed via the creation of continuous riparian buffer strips around rivers and streams throughout the region. We use a GIS-based analysis to consider the potential of several different buffer-width scenarios to meet milkweed restoration targets. We further estimate the ability of these habitat areas to provide additional functionality in the form of crop pollination and water quality regulation across the entire region. Finally, we conduct a cost-benefit analysis comparing the conservative economic value of these ecosystem services with the lost value of crops for each scenario. Results suggest that riparian buffers could be used to meet 10–43% of the total milkweed restoration target of 1.3 billion new stems with moderate management. The value of water quality and pollination benefits provided by buffers is estimated to exceed costs only for our narrowest buffer scenario, with a cost-benefit ratio of 1:2. Larger buffer widths provide more milkweed, but costs to farmers exceed the benefits we were able to quantify. The restoration of narrow multifunctional riparian corridors thus has the potential to be a win-win scenario, adding milkweed stems while also providing a variety of other valuable benefits. This suggests the potential to leverage monarch habitat restoration efforts for the benefit of a wider variety of species and broader coalition of beneficiaries.
Introduction
The migration of monarch butterflies throughout eastern North America is celebrated across the continent, from festivals to back yards to school yards. Americans have expressed a one-time willingness to pay of US$ 4.78–6.64 billion for monarch conservation via a national survey (Diffendorfer et al., 2014), and Mexicans and Canadians are willing to pay at the same rate, adjusted for income (Haefele et al., 2018). Despite their importance to people, however, the monarch population progressively declined over 2 decades to its lowest recorded level in 2014 (Vidal and Rendón-Salinas, 2014) and despite a subsequent rebound it remains at an elevated risk of extinction (Semmens et al., 2016). A population target of 6-ha occupied by overwintering monarchs in Mexico, the easiest way to monitor the size of this population, has been suggested as a near-term conservation goal (Pollinator Health Task Force, 2015), which would reduce the extinction risk over 10–20 years by more than 50% (Semmens et al., 2016).
Habitat loss, particularly the loss of milkweed species that developing monarch larvae require for food, due to changing agricultural practices in the U.S. is thought to be an important cause of monarch population declines (Pleasants and Oberhauser, 2013; Flockhart et al., 2015; Oberhauser et al., 2017; Pleasants, 2017; Saunders et al., 2017; Thogmartin et al., 2017b) among many other contributing factors (Ries et al., 2015; Inamine et al., 2016; Thogmartin et al., 2017a). An estimated 1.3–1.6 billion milkweed stems must be restored to the Upper Midwestern landscape to meet the 6-ha conservation goal (Pleasants, 2017; Thogmartin et al., 2017a). A geospatial analysis conducted to explore milkweed restoration scenarios found it impossible to reach this target without participation from the agricultural sector, which occupies 77% of all potential monarch habitat in the Upper Midwest (Thogmartin et al., 2017a). All non-agricultural sectors combined could accommodate up to 62% of the 1.3 billion stem milkweed target, necessitating at least 500 million stems on agricultural land. Thogmartin et al. (2017a) suggested restoring this number of stems could be accomplished by retiring the least productive farmland and/or through changes in agricultural practices that may allow the persistence of milkweed.
Marginal farmland is commonly associated with steeper slopes, highly erodible soils, and/or the need for substantial amounts of fertilizer to maintain crop yields (Kang et al., 2013), all of which can increase sediment and nutrient loading into waterways. By purchasing conservation easements on these lands via the Conservation Reserve Program (CRP), taxpayers receive benefits in return, such as improvements to downstream water quality and habitat for wildlife (Dunn et al., 1993). Johnson et al. (2016) found that the value of these easements for reducing flood damages, improving water and air quality, and contributing to greenhouse gas mitigation exceeded the cost of CRP payments to farmers by a factor of 1.3 to 4.9. If, however, the primary objective of conservation investments was to maximize benefits to the public, then it is likely that alternative sites would also be considered. In addition to quantifying the costs and benefits of conserving the least valuable agricultural land, it is worth considering the costs and benefits of conserving the most valuable land in terms of its ability to provide benefits to the public.
The most important or valuable source areas for the provision of ecosystem services have not yet been systematically investigated via comprehensive, quantitative mapping. Numerous studies, however, suggest that riparian corridors are among the most important source areas in terrestrial landscapes. Riparian corridors are generally defined as the stream channel between the low- and high-water marks plus the terrestrial landscape above the high-water mark where vegetation may be influenced by elevated water tables or extreme flooding and by the ability of the soils to hold water (Naiman et al., 1993). Riparian corridors have long been recognized as hosting an unusually diverse array of species and environmental processes and have been characterized as the most diverse, dynamic, and complex biophysical habitats on the terrestrial portion of the planet (Naiman et al., 1993; Naiman and Decamps, 1997). They directly regulate the flow of water, sediment, and nutrients from land areas to oceans (Aufdenkampe et al., 2011), and between surface waters, and groundwater aquifers (Goodrich et al., 2018). Riparian corridors are also the interfaces between aquatic and terrestrial ecosystems, providing highly dynamic and connected habitats to a wide array of species (Gregory et al., 1991), including wild pollinators, which are also experiencing severe population declines (Colla and Packer, 2008; Cameron et al., 2011; Cole et al., 2015). This diversity, coupled with the aesthetic amenities found along rivers and streams, also make riparian corridors an important resource for cultural ecosystem services such as recreation (Loomis et al., 2000; Sherrouse et al., 2014; Darvill and Lindo, 2015).
Despite the abundance of ecosystem services produced by riparian corridors, we found no studies that have attempted to quantify them at a regional, landscape scale. A likely reason for this is that the processes and functions producing many riparian ecosystem services operate at small spatial scales, making them difficult to model with accuracy over large areas. For example, Tomer et al. (2013, 2015) demonstrated how process-based, watershed-scale modeling can be used to anticipate reductions in nutrient loading into waterways from a variety of conservation practices, including grassed waterways, nutrient-removal wetlands, saturated buffers, and others. Their work utilized sub-meter digital elevation models (DEMs) derived from light detection and ranging (LIDAR) data, soil data from the Natural Resources Conservation Service (NRCS) Web Soil Survey, and detailed agricultural boundaries with crop rotation information on a field basis (Tomer et al., 2013). At a landscape scale these high-resolution datasets are not available and sophisticated process-based modeling is not practical. Some services, however, are amenable to generalization, such as water quality regulation and the pollination of food crops. The use of riparian buffers to regulate water quality has been a best management practice in agricultural landscapes for decades and numerous studies have quantified performance measures (e.g., Osborne and Kovacic, 1993). Similarly, crop yield increases associated with proximity to natural habitat, and wild pollinators have been documented for a variety of crop species (Garibaldi et al., 2013).
The large body of knowledge on the benefits of naturally vegetated riparian corridors has led to growing interest in policy options that would result in more uniform implementation of this best management practice (Fremier et al., 2015; Merrill, 2015; González et al., 2017). In November of 2017, Minnesota implemented a riparian buffer regulation, the first statewide regulation in the U.S. that mandated natural vegetation within 50 feet (15.24 m) of public waters (MNBWSR, 2019). Many other states have implemented or are considering a variety of buffer protection policies in selected sensitive watersheds, primarily focused on water quality improvement (Gene et al., 2019). Analyses of the costs and benefits of landscape-scale riparian restoration activities are thus needed to inform the political debate about specific policy options.
We explore the question of whether it can be cost effective to retire productive farmland adjacent to rivers and streams in the pursuit of milkweed restoration goals. We use a landscape-scale geospatial analysis of the U.S. Upper Midwest to consider three buffer-width scenarios that could be implemented throughout the region. For each, we identify how much natural vegetation currently exists within the buffer zone and how much milkweed could be added. We further quantify and value a partial set of ecosystem services provided by the habitat scenarios and compare that value with the cost of giving up agricultural production within the buffer zone. We discuss strengths and limitations of the approach and identify opportunities for further research.
Materials and Methods
Study Area
The study area consists of Iowa, Minnesota, Michigan, and Wisconsin in their entirety along with the northern portions of Ohio, Indiana, and Illinois in the Upper Midwest region of the United States (Figure 1). The total land area for the study area is ~846,000 km2 with 353,000 km2 of cropland. Based on the Cropland Data Layer (CDL), corn (47%) and soybeans (38%) are the primary crops produced in this area, comprising ~85% of agricultural land in production throughout the region (USDA/NASS, 2015). The next largest agricultural commodity grown in this area accounts for 7.5% of the total land area and those crops are alfalfa (6%), and hay (1.5%). The 67 remaining crops accounted for in the CDL comprise just 7.5% of the total land area in agricultural production. The study area represents the agricultural heartland of the U.S. but it is also the primary summer breeding range of monarch butterflies. It is within this region that Pleasants (2017) estimated the potential monarch support capacity (milkweed) loss has been 71% over the last 20 years, and residents have indicated a collective willingness to pay of ~US$45 million per year for monarch habitat restoration (Semmens et al., 2018).
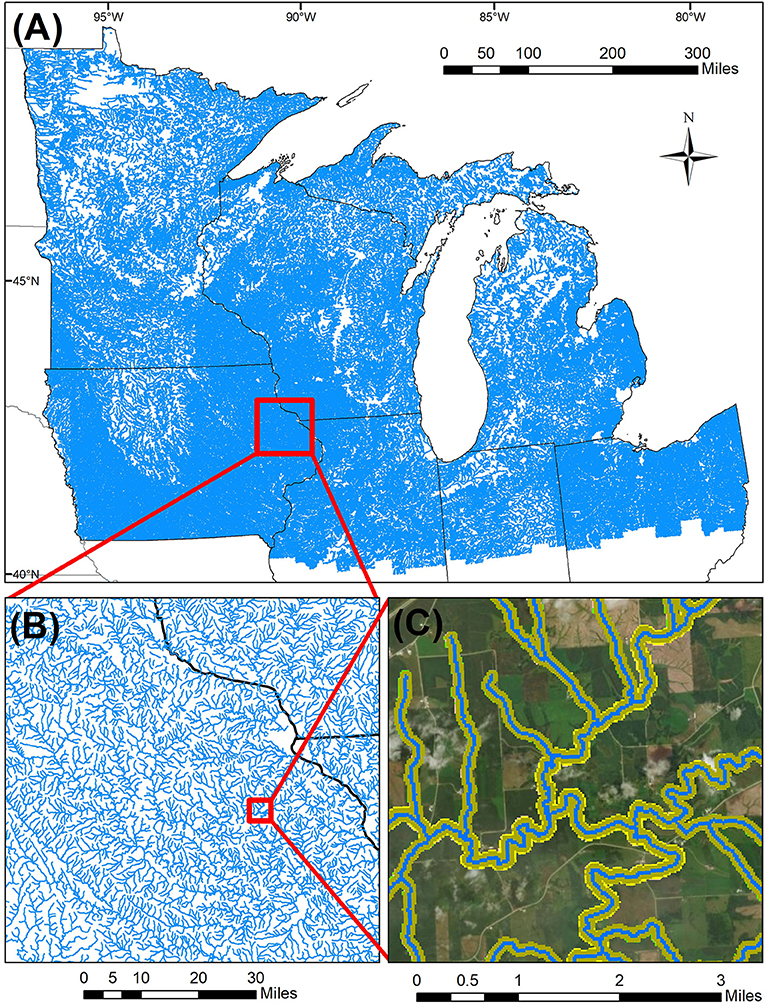
Figure 1. Study area consisting of Minnesota, Iowa, Wisconsin and Michigan along with the northern regions of Illinois, Indiana and Ohio with a National Hydrography Dataset (NHDPlusV2) overlay (A). Eastern Iowa (B) zoomed in for visualization of NHD flowline complexity. Satellite image (C) with the three continuous riparian buffer scenarios overlaid (Blue: 30-m, Yellow: Variable-Width, Green: 100-m).
Scenario Development
We developed three scenarios representing the restoration of natural vegetation along riparian corridors of different widths along perennial and intermittent streams. Our first scenario used 30-m buffers on each side of the waterways. The second scenario used 100-m buffers (200-m total). The third used a variable-width buffer, which included an 80-m first order stream buffer, a 100-m second order stream buffer, and a 120-m buffer for streams with orders of three to five. These scenarios were selected to represent a range of different buffer widths described in previous studies of their effectiveness at sediment and nutrient trapping, although beyond 30 m trapping levels do not increase substantially (Lyons et al., 2000; Mayer et al., 2007; Tiwari et al., 2016). The amount of land available for milkweed and pollinator habitat restoration under each scenario was a driving force in creating the larger buffer scenarios.
To create geospatial representations of the buffer zones for each scenario, we used the National Hydrography Dataset PLUS Version 2, which excludes ephemeral streams (McKay et al., 2012). We subset the NHD to include only waterways with stream orders ranging from 1 to 5. This subset of the NHD was selected after an examination showed that when stream order got above 5 the river width tended to be >30 m, making our analysis with the 30-m CDL difficult to accomplish because NHD does not include a width attribute for streams. Once we had this subset of the NHD perennial and intermittent streams, we created buffers by running the ArcGIS Buffer Tool for our three different buffer-width scenarios.
Intersection of CDL and Buffer Zones
Using the newly created riparian buffers, we extracted areas in the CDL that were contained within the buffer areas under each of the three scenarios to determine the total hectares of different crop and land-cover types using ArcGIS. The CDL for this region consists of 91 land-cover types where 22 of the classes correspond to aquaculture, open water, developed-open space, developed-low intensity, developed-medium intensity, developed high-intensity, barren lands (e.g., gravel pits), deciduous forest, evergreen forest, mixed forest, shrubland, grassland/pasture, woody wetlands, herbaceous wetlands, and long-lived orchard crops (e.g., apples, cherries, peaches, grapes, pears, plums, Christmas trees, and other tree crops). These classes were excluded from the buffer analysis since they were already natural areas, could not sustain a milkweed population, or were long-lived crops that would not be practical to retire. The remaining 69 classes relate to a specific crop type, with 8 classes relating to a double crop of two different crop types. The buffer zone was comprised of 63% natural vegetation (deciduous forest, evergreen forest, mixed forest, shrubland, woody wetlands, and herbaceous wetlands) for the 30-m scenario, which indicates that most streams in the region already have some form of buffer.
Milkweed Restoration Potential
We used three different levels of milkweed density within riparian buffers to estimate the number of plants that could potentially be added throughout the region, with milkweed densities derived from Thogmartin et al. (2017a). The first level is based on the existing milkweed density of non-prairie grassland at 7.64 stems per hectare and is intended to represent conditions typical of pasture and agricultural grassland, which receive occasional spot treatment to remove milkweed. The second level of 151.65 milkweed stems per hectare is based on densities estimated for CRP lands with persistently wet soils, which are typical of riparian wetlands. The third level is based on CRP lands with dry soils that are estimated to support an average of 277.1 milkweed stems per hectare. Our scenarios only consider the conversion of current agricultural land within the buffer zone, which Thogmartin et al. (2017a) estimated could support an average density of 277.1 milkweed stems per hectare. The range of milkweed potential we consider is thus intended to represent the possibility that milkweed densities in riparian buffers could vary widely by landowner, from enthusiastic planting to continued spot treatment, and as a function of specific site characteristics such as soil type and moisture content, the encroachment of woody vegetation, herbicide drift, and/or other factors. We did not formally take into account soil composition when estimating milkweed restoration potential because no quantitative relationships have been established. Bowles et al. (2015) noted that well-drained sites on fine-textured, Wisconsinan-aged glacial soils found commonly throughout our study area would enhance the establishment and growth of milkweed, but quantitative estimates of milkweed density across multiple soil types were not available.
Sediment and Nutrient Removal
Upland Areas and Headwater Reduction
Riparian buffer strips are a common best management practice (BMP) in agricultural settings because they filter and trap sediment and nutrients from surface runoff before it enters streams. They are limited, however, because they can only filter runoff flowing overland laterally into streams; they cannot filter channelized flow. Our calculations thus necessitated estimating the fraction of the landscape contributing flow laterally into perennial and intermittent streams and thus subject to water quality improvement from riparian buffer strips. To make this estimate, we started by delineating all watersheds with pour points (outlets) located at the transition to 6th order streams or higher. This represented the maximum potential area that could be serviced by riparian buffers in our analysis, but it needed to be reduced to account for headwater areas contributing flow directly into the origination point of the NHD streams. We then selected one representative watershed for each state and delineated all the headwater watersheds upstream from the upstream end of each 1st-order stream (Figure 2). Given the number of 1st-order streams in the study area it was not feasible to do this for all watersheds, so we used the sampled percentages of our representative watersheds occupied by headwater watersheds in each state to reduce the potential area to which riparian buffers could provide sediment and nutrient retention benefits. Representative watersheds for each state were selected based on their average size relative to other watersheds in the state and had to have sufficient relief such that the stream network could be delineated cleanly from the DEM. Estimates of upland and headwater areas are presented in Table 1.
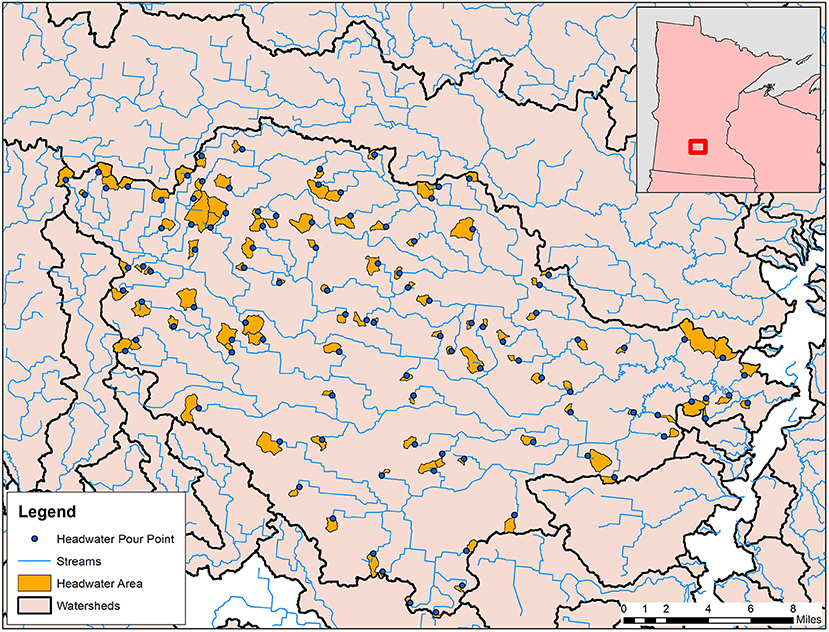
Figure 2. Headwater area analysis for Minnesota utilizing NHD flowlines within a select watershed. Blue dots represent the pour points placed to model the fraction of the watershed comprised of headwater areas not subject to filtration by riparian buffers.
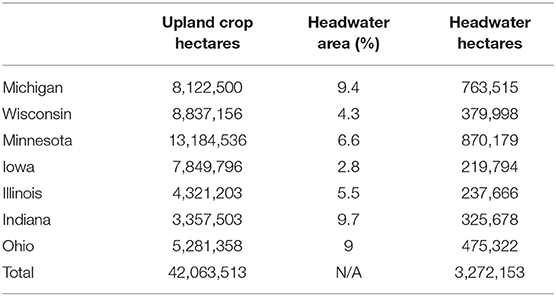
Table 1. Upland crop hectares with headwater percentage and area reduction.
Drainage Tiles
Subsurface drainage through drainage tiles is a major source of nutrient pollution throughout the study area, and one that is not well-mediated by riparian buffers (Osborne and Kovacic, 1993). The lack of information available on the precise locations and extent of drainage tiles on agricultural land (Ruark et al., 2009) make it difficult to quantify their specific impacts, necessitating a more generalized approach. Using historic estimates provided by the United States Department of Agriculture (USDA) combined with a GIS analysis conducted by Sugg (2007) we were able to estimate of the percentage of agricultural land that uses subsurface drainage for each state within our study area (Table 2). We used these percentages to reduce the total amount of sediment eroded from upland areas that could potentially be filtered by riparian buffers, assuming that the water needed to transport that sediment to streams is drained away below ground. It is unlikely that all subsurface drainage in the region falls within the portion of the landscape subject to filtration by our buffer scenarios, making this a highly conservative reduction of the potential sediment retention benefits.
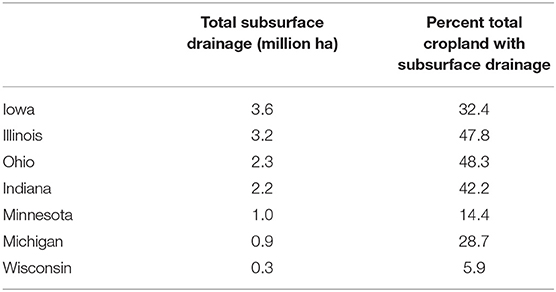
Table 2. Drainage tile percentages by state (Sugg, 2007).
Sediment Erosion and Trapping Efficiencies
We applied an average erosion rate of 7.21 metric tons per hectare per year (3.22 tons per acre per year) on agricultural land, which USDA-NRCS (2018) estimates to be representative for this region. A more thorough model-based analysis of erosion accounting for slope, soil type, and management factors was not practical due to the size of the study area, consistency and resolution of available data, and difficulty of delineating the specific areas with potential to benefit from sediment trapping by riparian buffers (as described in section Upland areas and headwater reduction). The average erosion rate was applied to the total area of agricultural land subject to filtration by riparian buffers, following the above described reductions for headwater areas and subsurface drainage. We assume that the resulting total sediment yield is currently making its way into rivers and streams and is thus available to be trapped by riparian buffer strips.
We surveyed published sediment trapping efficiencies for riparian buffer strips to derive the value used in our analysis (Table 3). Sediment trapping by riparian buffers is highly dependent on soil type, slope, land use, and other factors which creates discrepancies across studies for filtering capabilities (Hawes and Smith, 2005). From the selected studies and reviews, we used the lowest reported value for sediment trapping efficiency where buffer width was similar: a trapping efficiency of 61% (Meyer et al., 1995) was applied to sediment originating upslope from and thus subject to filtering by a buffer. For agricultural land converted directly to buffer, we did not assume a 100% trapping efficiency but rather applied a value of 97%, consistent with the observed performance of buffers at filtering upslope sediment in several studies (Yuan et al., 2009). These rates were applied uniformly throughout the entire region following the area reductions described in sections Upland areas and headwater reduction and Drainage tiles. Existing natural areas present in the buffer scenarios were also taken into account for the sediment trapping they currently provide by further reducing the total sediment from upland areas by an additional 63% to align with our estimate of existing natural areas within the 30-m buffer zone.
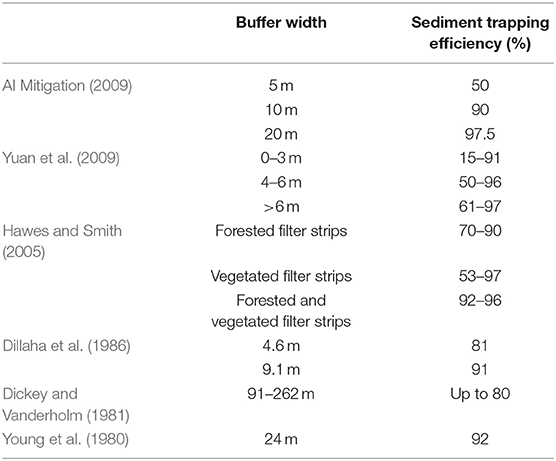
Table 3. Buffer characteristics from multiple studies on width, composition, and trapping efficiency.
Valuing Water Quality Regulation by Buffers
The USDA Economic Research Service estimated that for each avoided metric ton of eroded soil entering waterways there are US$2.51 in benefits for the corn belt states (Iowa, Illinois, Indiana, Ohio) and $4.25 for the lake states (Minnesota, Wisconsin, Michigan) (Hansen and Ribaudo, 2008). These estimates were based on September 2008 US dollars and were adjusted for inflation using U.S. Bureau of Labor Statistics' (BLS) Consumer Price Index (CPI) Inflation Calculator (BLS, 2015) to September 2016 US dollar equivalents of $2.78 and $4.68, respectively, to correspond with our crop and pollination values. All subsequent values presented in this paper are 2016 US dollar equivalents. These estimated values include the benefits of water-quality improvements to irrigation ditch, canal, and road drainage ditch maintenance, municipal water treatment, avoided agricultural flood damages, marine fisheries, freshwater fisheries, industrial water use, steam power-plants, and soil productivity. To the extent that nutrient and sediment effects on benefits are correlated, The Hansen and Ribaudo (2008) benefit estimates include effects of nutrients. Nutrient sorption in sediment is common, making it difficult to distinguish willingness to pay for water quality improvements resulting from sediment vs. nutrient reductions. Hansen and Ribaudo (2008) acknowledge that monetary values derived from their data are likely to be lower-bound estimates and although they lack precision for small-scale value estimates, the values are thought to be detailed enough for national and regional estimates. Such applications have been conducted for the Prairie Pothole region of the north central U.S. (Gascoigne et al., 2011) and to the state of Iowa (Zhou et al., 2009) to evaluate scenarios of land use and conservation practices, respectively.
Pollinator Benefits
Expanding natural vegetation along riparian corridors is expected to enhance habitat heterogeneity and ecological connectivity, creating suitable conditions for wild pollinators that can increase agricultural yields for certain crops. Cole et al. (2015), for example, found that riparian buffers supported a greater diversity of insect pollinators than adjacent grassy fields, and that insect abundance increased with buffer width. To quantify this benefit, we needed to estimate three things: the average yield increase for pollinator-dependent crops due to wild pollinators, how far wild pollinators travel from areas of natural vegetation (foraging distance), and how much pollination effectiveness is likely to decline with distance from natural habitat. The average value of crop yield increases from wild pollinators was derived from Kleijn et al. (2015) who synthesized data from 90 studies globally to derive the average contribution of $3,251/ha to the production of 20 pollinator-dependent crops. We estimated the maximum foraging distance to be ~2,400-m (~1.5 miles) from a list of the 12 most effective wild bee pollinator species in Pennsylvania (McGlynn, 2009) by taking the average of the midpoint of flight/forage distances for each species and rounding down (Table 4).
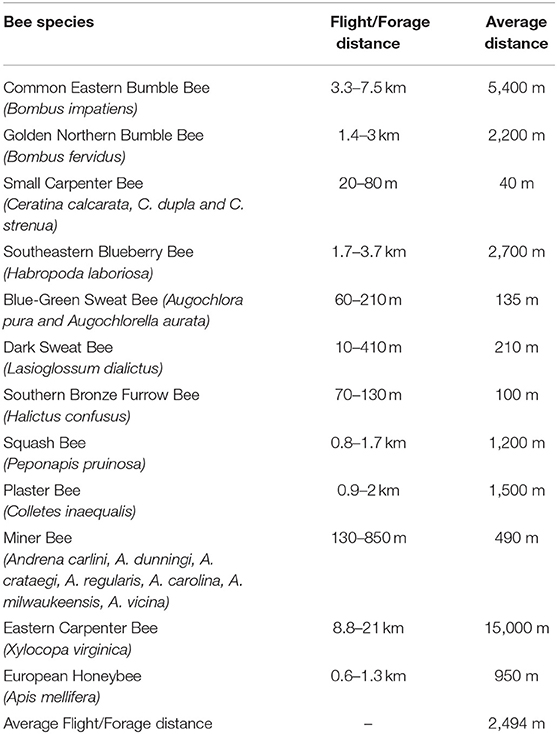
Table 4. Bee species, flight/foraging distances (McGlynn, 2009).
A GIS analysis determined that all pollinator-dependent crops in the study area (apples, blueberries, canola, cantaloupes, cherries, cranberries, dry beans, eggplants, flaxseed, gourds, peaches, pears, peas, plums, pumpkins, squash, sunflowers, tomatoes, and watermelons) are located within 2,400 m of at least one pixel of natural land cover. To estimate the value of restoring additional pollinator habitat conservatively, we assumed that provision of pollination services decreases exponentially with distance from natural habitat. We applied an exponential decay function (e−0.003x) to the value of pollination such that it decreased from $3,251/ha adjacent to natural areas down to $0 beyond 2,400 m. We then calculated the area of pollinator-dependent crops within 14 distance bands up to 2,400 m from the baseline natural vegetation (including existing CRP leases) as well as the expanded natural vegetation under each buffer scenario. This analysis is limited by the 30-m cell size of the CDL, so we created our distance bands as multiples of 30 m (Table 5), using the “expand” tool in ArcGIS. For each buffer distance we intersected the buffered natural vegetation with the pollinator-dependent crop extent, using raster calculator to identify the overlapping cells, and recording their area. To account for the conversion of existing crops to natural area, we subtracted the area of pollinator-dependent crops converted to buffer from the first distance band of the baseline for each scenario so that we only consider the additional pollination value for the remaining crops. These two steps yielded the distribution of pollinator-dependent crop area falling within each distance band from the existing and expanded natural vegetation associated with each scenario. To estimate the value associated with each scenario, we multiplied the value ($/ha) at the midpoint of each distance band by the area of pollinator-dependent crops in that band (ha) to first compute the existing value of wild pollinators to pollinator-dependent crops. We then calculated the total value associated with each scenario and subtracted the existing value to get the value added as a result of the new buffer area. This process accounts for the increase in pollination value as natural area shifts closer to pollinator-dependent crops rather than providing access to new crops.
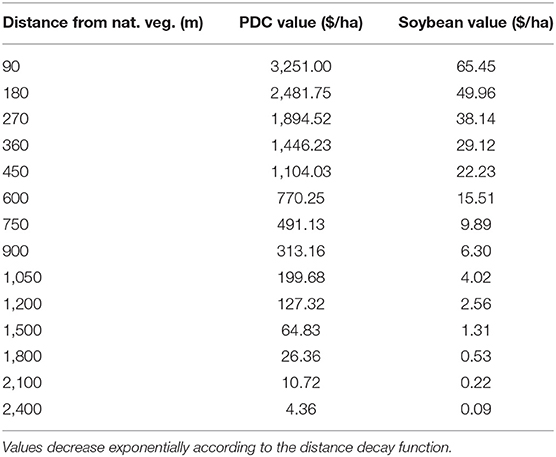
Table 5. Value of pollination benefits per hectare of pollinator-dependent crops (PDC) and soybeans within 90-m distance bands from natural vegetation.
This process was repeated for soybeans, which are primarily self-pollinated but can benefit from insect pollination. Numerous studies have documented visitation of soybean flowers by wild pollinators (Rust et al., 1980; Milfont et al., 2013; Gill and O'Neal, 2015; Monasterolo et al., 2015; Wheelock et al., 2016) and yield increases resulting from pollinators (Erickson, 1975; Erickson et al., 1978; Chiari et al., 2005; Milfont et al., 2013; Santos et al., 2013; Blettler et al., 2018). Of these, only Erickson (1975) quantified yield increases from wild pollinators within the study area, finding an average yield increase of ~5% in open, untreated plots relative to plots treated with insecticide throughout the flowering period. Considerably higher yield increases have been observed in association with managed honey bees (Apis mellifera), but these increases vary widely with weather and soybean variety (Blettler et al., 2018). Wheelock et al. (2016) describe the limitations of using yield increases from studies that focus on honey bees because they comprise a small percentage of the pollinator community found in the primary soybean region of our study. We used the 5% yield increase from Erickson (1975) together with the average yield and price of soybeans (in 2016 US$) within the study area to estimate the maximum value for soybean yield increases provided by wild pollinators. This maximum value was decreased exponentially over 2,400 m to estimate the total value of increased soybean yield associated with each scenario following the same procedures described above for pollinator-dependent crops. Due to the uncertainty of how pollinators may contribute to soybean yields, the value of pollinator-dependent crop and soybean yield increases are kept separate so the soybean value can be excluded easily from the final cost-benefit analysis.
Lost Crop Estimates and Cost-Benefit Analysis
In addition to benefits from restoring habitat and ecological function at a landscape scale, there is also an important cost to private landowners, namely the lost profit from crops currently grown within the buffer zone. An understanding of this cost relative to the value of benefits is needed to inform the debate over viable policy options involving riparian buffers. We used data from the USDA that reports average yields and prices on crops grown in the states throughout our study area (USDA/NASS, 2016). Using this average yield and price information we were able to estimate the value of each specific crop and thus the total value of lost crops within each of our three buffer scenarios (Supplementary Table 1). Some crops in the CDL do not have corresponding yield and price information for every state, in which case neighboring state prices and yields were used. In addition, specific crop classes had no yield and price information, such as other crops, miscellaneous vegetables and fruits, fallow/idle cropland, sod/grass seed, clover/wildflowers, herbs, and vetch. These classes are included in the overall analysis but are not reflected in the crop-loss estimates.
The gross value of lost crops overestimates their value to farmers who incur considerable costs in bringing crops to harvest. The net profit margin from farming varies as a function of farm size, crops grown, and other factors. MacDonald et al. (2006) reported profit margins on U.S. farms ranging from −24.8 to 16.4% depending on annual farm sales. A large majority of small family-owned farms in the U.S. have an operating profit margin of <10 percent and these farms make up more than 50% of the total land operated for farming purposes (Hoppe, 2017). In the interest of being conservative in our estimates, we elected to apply a profit margin of 10% to the total value of all crops grown within the buffer zones of our three scenarios. This allows for the possibility that yields are higher adjacent to rivers and streams, perhaps due to fertile floodplain soils. We do not consider the cost of planting or maintaining the natural vegetation, including milkweed, associated with our buffer scenarios, which would be broadly similar for any monarch habitat restoration occurring on agricultural land. If habitat establishment costs were to be included, our expectation is that first year cost-benefit ratios would be very low, but would approach our estimates in the long-term as buffer vegetation becomes fully established.
Results
Milkweed Potential
Our GIS analysis of riparian buffer scenarios throughout the Upper Midwest shows that buffer width and management style create a large range in the number of milkweed stems that can be supported. Between 238 million and 1.02 billion stems can be added with the restoration of riparian buffers if densities typical of upland native prairie can be attained (Table 6). This would meet between 50 and 200% of the milkweed restoration target Thogmartin et al. (2017a) estimated would be needed from the agricultural sector, assuming maximum restoration on non-agricultural lands. In contrast, if the buffers are managed as agricultural grassland then just 6.6 to 28.1 million stems may be possible. Due to the highly variable soil and moisture conditions within the riparian zone and uncertainty about landowner willingness to accept milkweed, an intermediate density associated with wet CRP land may be more realistic. This would add 130 to 559 million stems, meeting 25–100% of the milkweed target for the agricultural sector, depending on buffer width. These results only estimate the amount of milkweed that could be added on the land converted from agriculture to natural vegetation under each scenario.
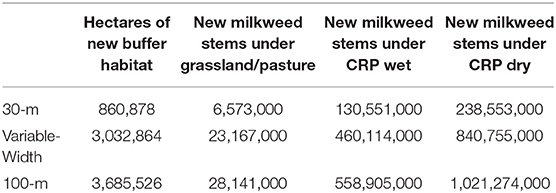
Table 6. Estimates of milkweed restoration potential using three management styles (CRP dry, 277.1 stems/ha; CRP wet, 151.65 stems/ha; and grassland/pasture, 7.64 stems/ha) for each of the three buffer-width scenarios.
Water Quality Benefits
We estimated the total amount of sediment eroded from agricultural lands annually in each state that are subject to filtration and sediment retention by riparian buffers (Table 7). The estimated amount and value of sediment trapped by each buffer scenario (Table 8) indicate that the 30-m buffer scenario could produce $302M in avoided costs as a result of water quality improvements. The variable width and 100-m scenarios are only marginally better, producing $356 and $371M in water quality benefits, respectively. These increases result from the retirement of larger land areas rather than the greater trapping efficiency of wider buffers.
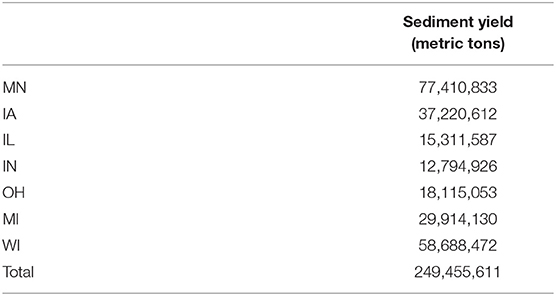
Table 7. Estimated current annual production of sediment on lands subject to filtration by riparian buffers.
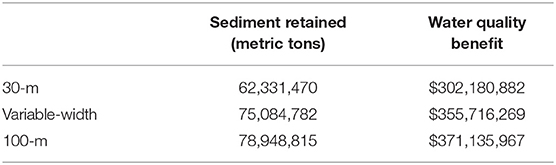
Table 8. Estimated retention of sediment under different buffer scenarios and associated values of improved water quality.
Pollination Benefits
Pollinator-dependent crops could benefit from increased pollination and higher yields, regardless of whether or not they are presently relying on pollination services from managed honey bees (Garibaldi et al., 2013; Kleijn et al., 2015). The results of our pollination analysis are presented in Table 9. The 30-m scenario resulted in ~$102 million of increased crop yields. The variable-width and 100-m scenarios add far more natural habitat on the landscape but at the expense of existing crops and do not result in pollinator access to additional crops, resulting in $50.6 and $54.8 million in increased crop yields, respectively.
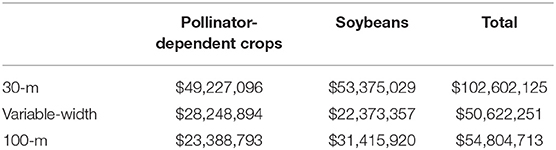
Table 9. Summary of estimated pollination value for each buffer scenario.
Crop-Loss Estimates and Cost-Benefit Analysis
The estimated value of lost agricultural production resulting from the conversion of cropland to natural habitat is presented in Table 10 for each scenario. We include two measures of crop loss, the gross annual crop value (average yield/hectare × hectares × price), and the net cost to farmers less inputs (seed, fertilizer, fuel, etc.) assuming a uniform 10% profit margin. A comparison of costs with the aggregated benefits is presented in Table 11 (state-specific costs and benefits are available at doi: 10.5066/P9DV375U). The 30-m scenario results in ~$205M in annual lost profits for the landowners across all crop types, but the benefits (water quality and pollination) are approximately twice that amount. The variable-width and 100-m scenarios are more expensive to implement and benefit gains are less substantial, resulting in cost-benefit ratios below 1. These results are relatively insensitive to the value of yield increases from soybeans. If this value is excluded entirely, the cost-benefit ratio for the 30-m scenario only drops to 1.72. Again, these estimates neglect the initial cost of restoring natural vegetation, which would certainly drive the cost-benefit ratio below 1 for all scenarios during the first year but would be similar to restoration costs on any tilled agricultural land regardless of its productivity.
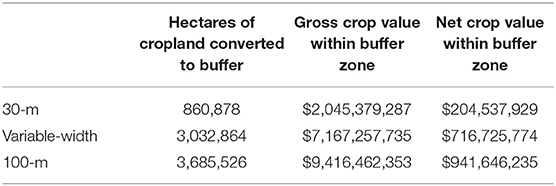
Table 10. Area of existing crops converted to natural vegetation under each scenario and associated gross and net value annually.
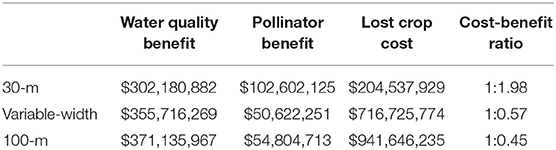
Table 11. Summary of final benefits and costs in 2016 U.S. dollars per year.
Discussion
We have estimated the potential contribution of the retirement of agriculture and restoration of natural vegetation along riparian corridors throughout the Upper Midwestern U.S. toward achieving milkweed restoration goals. Our estimates indicate the possibility of adding between 6.6M and 1B new milkweed stems depending on the width of the buffers and the type of management they receive. This large potential range is because milkweed counts have never been conducted specifically within riparian corridors and there is uncertainty about the potential of these corridors to serve as host habitat. Several studies, however, have documented the presence of both common milkweed (Asclepias syriaca) and swamp milkweed (Asclepias incarnata) in riparian corridors within the study area (Paine and Ribic, 2002; Goebel et al., 2003; Benson et al., 2006) and the seeds of other milkweed species have been shown to have high buoyancy and viability after extended contact with water (Edwards et al., 1994) suggesting the potential for hydrochory (seed dispersal by water). The wide range of moisture conditions, vegetative composition, and frequency of disturbance within riparian corridors may increase the number of stems and variety of milkweed species likely to be present, but also makes it difficult to assign one value for milkweed stem density representative of a region as large as the Upper Midwest.
Under our smallest, 30-m buffer scenario with moderate management for milkweed, ~10% of the overall monarch habitat restoration goal, and 25% of the contribution from the agricultural sector can be met. For comparison, Thogmartin et al. (2017a) estimated that roadside milkweed density could be increased to meet ~15.6% of the overall monarch habitat restoration goal. The 500M stem goal for the agricultural sector can be met entirely by the retirement of marginal farmland and restoration of native prairie, but this strategy is unlikely to provide an equivalent magnitude and diversity of benefits as the potential gain from restoring a combination of marginal land and riparian corridors throughout the region. The fact that riparian buffers alone may produce up to 6.6M milkweed stems may make them a desirable component in the broader mix of restoration efforts.
We conducted an extensive geospatial analysis to value a subset of the ecosystem services provided by riparian buffers and investigate how they compare to the lost value of crops currently grown within the buffer zone. In the 30-m scenario, the annual value of benefits provided by the buffers is US$405M, approximately double the lost crop value of US$205M, but for larger buffer widths the cost increases outweigh the additional benefits. Our cost-benefit calculations do not account for initial restoration costs, the time required for buffer vegetation to become fully established, or changing commodity prices over time. As such, our cost-benefit ratios reflect a static snapshot of selected potential benefits at some point in the future once vegetation is established relative to the current annual opportunity costs to farmers. Restoration costs and establishment times for prairie vegetation on agricultural land would have to be considered carefully prior to any policy implementation.
Empirical parameters obtained at the field and small watershed scale can overestimate the performance of best management practices when applied at larger spatial scales (Liu et al., 2017), so we used conservative numbers for service provisioning and the associated value of benefits. In addition, although the impact of sediment and nutrients on a variety of ecosystem services is incorporated into our valuation of water quality benefits, we were not able to quantify many other services known to be provided by riparian buffers because of a lack of data and models that could be defensibly applied at a regional scale. We were thus unable to account for the value of enhancements to scenic amenities in rural landscapes, flood mitigation to cities and towns, carbon sequestration, recovery of threatened and endangered species, wildlife viewing and hunting opportunities, and other services within the region and downstream. A more complete accounting of these benefits could further increase the return on investments in habitat restoration adjacent to rivers and streams.
There are also potential disservices associated with restoring corridors of natural vegetation throughout agricultural landscapes. It is possible that the large-scale reintroduction of intact riparian habitat could create shelter and dispersal corridors for agricultural pest species (Maisonneuve and Rioux, 2001; Zhang et al., 2007), which could impose an additional cost on farmers that we have not attempted to account for in the present analysis. Such disservices, however, are likely to be outweighed by the cumulative benefits of creating contiguous habitat to species that provide natural control of crop pests (Landis et al., 2000; Marshall and Moonen, 2002; Zhang et al., 2007), and other desired terrestrial and aquatic species, which include ~70% of the region's threatened and endangered species that rely to some extent on these habitats (USFWS, 2019). Stewart et al. (2001), for example, found that streams dominated by riparian corridors without gaps and with less fragmentation of natural vegetation have healthier fish and macroinvertebrate communities and a greater density of fish for recreational fisheries.
Our approach to estimating pollination benefits implicitly assumes that wild pollinators will recolonize new buffer areas in sufficient numbers to provide the modeled service. However, it may take some time for this to occur and other factors may come into play. Koh et al. (2016) showed the Upper Midwest to have the lowest abundance of wild bees and greatest negative trend in their abundance relative to other regions in the U.S. Continued indiscriminate utilization of neonicotinoid seed treatments, particularly in soybeans, could perpetuate wild pollinator declines (Tooker et al., 2017), and negate the benefits associated with creating new pollinator habitat. Similarly, herbicide drift can impact the diversity of field-edge vegetation (de Snoo and Van der Poll, 1999), flowering in selected species, and arthropod abundance (Egan et al., 2014), though some herbicide use can be managed to avoid damage to milkweed and monarch larvae (Lizotte-Hall and Hartzler, 2019). Olaya-Arenas and Kaplan (2019) document 14 pesticides−4 insecticides, 4 herbicides, 6 fungicides—on milkweed leaves in northwest Indiana suggesting monarch caterpillars consume a diversity of agricultural chemicals, but the lethal or sublethal impacts of this exposure remain unknown. Without careful management these factors may limit both the potential availability of nectar resources for pollinators as well as the density of milkweed in riparian buffers.
Due to data and resolution limitations, we only quantified benefits resulting from increasing natural vegetation around the 1:100,000-scale perennial and intermittent streams within the NHD dataset; ephemeral headwater stream channels were excluded from the analysis, but could be major sources of sediment, and nutrients if not similarly protected. Some of these ephemeral headwater channels are presently buffered with natural vegetation, but we were unable to quantify their extent. Buffering these areas with natural vegetation could add to the potential for milkweed restoration and increase pollination and water quality benefits, among many others. With higher resolution topographic and land-cover information it would be possible, and prudent, to expand our analyses to include these areas. Numerous studies have shown that headwater streams account for a substantial fraction of stream-channel length in the U.S. and are crucial to ecological and biophysical functioning and attendant ecosystem services (Lowe and Likens, 2005; Alexander et al., 2007; Creed et al., 2017; Wohl, 2017).
Conclusions
Retiring agricultural land and restoring habitat along riparian corridors could significantly increase the availability of milkweed for monarchs throughout the Upper Midwest. This highly connected habitat is also widely distributed throughout the region and could serve as movement/migration corridors for monarchs and many other species of conservation concern. The habitat could further provide a variety of other valuable benefits throughout the region that are twice their cost in terms of lost agricultural production for a 30-m buffer width. Numerous additional benefits could not be quantified but may further increase the return on investment in riparian buffers. Gustafsson et al. (2015) observed that the monarch has been a powerful communication vehicle and a potent ally in environmental politics. These factors all suggest the strong potential to leverage monarch restoration goals, and the popular momentum for meeting them, toward the restoration of a multifunctional landscape that benefits a wider range of species, people, and communities.
Data Availability
The official data release for this study are published on ScienceBase at doi: 10.5066/P9DV375U.
Author Contributions
DS designed the project. ZA conducted the analyses. DS and ZA jointly drafted the manuscript.
Funding
This work was supported by the U.S. Geological Survey, Land Change Science Program.
Conflict of Interest Statement
The authors declare that the research was conducted in the absence of any commercial or financial relationships that could be construed as a potential conflict of interest.
The handling editor declared a past co-authorship with one of the authors DS.
Acknowledgments
We would like to thank Laura Norman and two reviewers for their thoughtful comments on this manuscript. Any use of trade, product, or firm names are for descriptive purposes only and does not imply endorsement by the U.S. Government.
Supplementary Material
The Supplementary Material for this article can be found online at: https://www.frontiersin.org/articles/10.3389/fenvs.2019.00126/full#supplementary-material
References
AI Mitigation (2009). Vegetative Buffer Strips: A Proven Field Mitigation Measure to Reduce Pesticide Runoff from Agricultural Fields. European Crop Protection Association. Available online at: https://abe.ufl.edu/faculty/carpena/files/pdf/software/vfsmod/VFS_Flyer_07_09_09__FINAL.pdf (accessed February 11, 2019).
Alexander, R. B., Boyer, E. W., Smith, R. A., Schwarz, G. E., and Moore, R. B. (2007). The role of headwater streams in downstream water quality. J. Am. Water Resour. Assoc. 43, 41–59. doi: 10.1111/j.1752-1688.2007.00005.x
Aufdenkampe, A. K., Mayorga, E., Raymond, P. A., Melack, J. M., Doney, S. C., Alin, S. R., et al. (2011). Riverine coupling of biogeochemical cycles between land, oceans, and atmosphere. Front. Ecol. Environ. 9, 53–60. doi: 10.1890/100014
Benson, T. J., Dinsmore, J. J., and Hohman, W. L. (2006). Changes in land cover and breeding bird populations with restoration of riparian habitats in east-central Iowa. J. Iowa Acad. Sci. 113, 10–16. Available online at: https://scholarworks.uni.edu/jias/vol113/iss1/4
Blettler, D. C., Fagundez, G. A., and Caviglia, O. P. (2018). Contribution of honeybees to soybean yield. Apidologie 49, 101–111. doi: 10.1007/s13592-017-0532-4
BLS (2015). Bureau of Labor Statistics, Consumer Price Index Inflation Calculator. Available online at: https://www.bls.gov/data/inflation_calculator.htm (accessed February 25, 2019).
Bowles, M. L., McBride, J. L., and Bell, T. J. (2015). Long-term processes affecting restoration and viability of the federal threatened Mead's milkweed (Asclepias meadii). Ecosphere 6, 1–22. doi: 10.1890/ES14-00240.1
Cameron, S. A., Lozier, J. D., Strange, J. P., Koch, J. B., Cordes, N., Solter, L. F., et al. (2011). Patterns of widespread decline in North American bumble bees. Proc. Natl. Acad. Sci. U.S.A. 108, 662–667. doi: 10.1073/pnas.1014743108
Chiari, C. W., Toledo, V. A., Ruvolo-Takasusuki, M. C., Oliveira, A. J., Sakaguti, E. S., and Attencia, V. M. (2005). Pollination of soybean (Glycine max L. Merril) by honeybees (Apis mellifera L.). Braz. Arch. Biol. Tech. 48, 31–36. doi: 10.1590/S1516-89132005000100005
Cole, L. J., Brocklehurst, S., Robertson, D., Harrison, W., and McCracken, D. I. (2015). Riparian buffer strips: their role in the conservation of insect pollinators in intensive grassland systems. Agr. Ecosyst. Environ. 211, 207–220. doi: 10.1016/j.agee.2015.06.012
Colla, S. R., and Packer, L. (2008). Evidence for decline in eastern North American bumblebees (Hymenoptera: Apidae), with special focus on Bombus affinis Cresson. Biodivers. Conserv. 17, 1379–1391. doi: 10.1007/s10531-008-9340-5
Creed, I. F., Lane, C. R., Serran, J. N., Alexander, L. C., Basu, N. B., Calhoun, A. J., et al. (2017). Enhancing protection for vulnerable waters. Nat. Geosci. 10, 809–815. doi: 10.1038/ngeo3041
Darvill, R., and Lindo, Z. (2015). The inclusion of stakeholders and cultural ecosystem services in land management trade-off decisions using an ecosystem services approach. Landscape Ecol. 31, 533–545. doi: 10.1007/s10980-015-0260-y
de Snoo, G. R., and Van der Poll, R. J. (1999). Effect of herbicide drift on adjacent boundary vegetation. Agric. Ecosyst. Environ. 73, 1–6. doi: 10.1016/S0167-8809(99)00008-0
Dickey, E. C., and Vanderholm, D. H. (1981). Vegetative filter treatment of livestock feedlot runoff. J. Environ. Qual. 10, 279–284. doi: 10.2134/jeq1981.00472425001000030005x
Diffendorfer, J. E., Loomis, J. B., Ries, L., Oberhauser, K., Lopez-Hoffman, L., Semmens, D., et al. (2014). National valuation of monarch butterflies indicates an untapped potential for incentive-based conservation. Conserv. Lett. 7, 253–262. doi: 10.1111/conl.12065
Dillaha, T. A., Sherrard, J. H., and Lee, D. (1986). Long-term effectiveness and maintenance of vegetative filter strips. Virgin. Water Resour. Res. Center Bull. No. 153. Available online at: https://vtechworks.lib.vt.edu/bitstream/handle/10919/46593/WRRC_Bull_153.pdf?sequence=1
Dunn, C. P., Stearns, F., Guntenspergen, G. R., and Sharpe, D. M. (1993). Ecological benefits of the conservation reserve program. Conserv. Biol. 7, 132–139. doi: 10.1046/j.1523-1739.1993.07010132.x
Edwards, A. L., Wyatt, R., and Sharitz, R. R. (1994). Seed buoyancy and viability of the wetland milkweed Asclepias perennis and an upland milkweed, Asclepias exaltata. B. Torrey Bot. Club. 121, 160–169. doi: 10.2307/2997168
Egan, J. F., Bohnenblust, E., Goslee, S., Mortensen, D., and Tooker, J. (2014). Herbicide drift can affect plant and arthropod communities. Agric. Ecosyst. Environ. 185, 77–87. doi: 10.1016/j.agee.2013.12.017
Erickson, E. H. (1975). Effect of honey bees on yield of three soybean cultivators. Crop Sci. 15. 84–86. doi: 10.2135/cropsci1975.0011183X001500010025x
Erickson, E. H., Berger, G. A., Shannon, J. G., and Robins, J. M. (1978). Honey bee pollination increases soybean yields in the mississippi delta region of Arkansas and Missouri. J. Econ. Entomol. 71, 601–603. doi: 10.1093/jee/71.4.601
Flockhart, T., Pichancourt, J. B., Norris, R., and Martin, T. G. (2015). Unraveling the annual cycle in a migratory animal: breeding-season habitat loss drives population declines of monarch butterflies. J. Anim. Ecol. 84, 155–165. doi: 10.1111/1365-2656.12253
Fremier, A. K., Kiparsky, M., Gmur, S., Aycrigg, J., Craig, R. K., Svancara, L. K., et al. (2015). A riparian conservation network for ecological resilience. Biol. Conserv. 191, 29–37. doi: 10.1016/j.biocon.2015.06.029
Garibaldi, L. A., Steffan-Dewenter, I., Winfree, R., Aizen, M. A., Bommarco, R., Cunningham, S. A., et al. (2013). Wild pollinators enhance fruit set of crops regardless of honey bee abundance. Science 339, 1608–1611. doi: 10.1126/science.1230200
Gascoigne, W. R., Hoag, D., Koontz, L., Tangen, B. A., Shaffer, T. L., and Gleason, R. A. (2011). Valuing ecosystem and economic services across land-use scenarios in the Prairie Pothole Region of the Dakotas, USA. Ecol. Econ. 70, 1715–1725. doi: 10.1016/j.ecolecon.2011.04.010
Gene, S. M., Hoekstra, P. F., Hannam, C., White, M., Truman, C., Hanson, M. L., et al. (2019). The role of vegetated buffers in agriculture and their regulation across Canada and the United States. J. Environ. Manage. 243, 12–21. doi: 10.1016/j.jenvman.2019.05.003
Gill, K. A., and O'Neal, M. E. (2015). Survey of soybean insect pollinators: community identification and sampling method analysis. Environ. Entomol. 44, 488–498. doi: 10.1093/ee/nvv001
Goebel, P. C., Hix, D. M., and Semko-Duncan, M. E. (2003). Identifying reference conditions for riparian areas of Ohio. Ohio Agricultural Research and Development Center. Special Circular 192.
González, E., Felipe-Lucia, M. R., Bourgeois, B., Boz, B., Nilsson, C., Palmer, G., et al. (2017). Integrative conservation of riparian zones. Biol. Conserv. 211, 20–29. doi: 10.1016/j.biocon.2016.10.035
Goodrich, D. C., Kepner, W. G., Levick, L. R., and Wigington Jr, P. J. (2018). Southwestern intermittent and ephemeral stream connectivity. J. Am. Water Resour. Assoc. 54, 400–422. doi: 10.1111/1752-1688.12636
Gregory, S. V., Swanson, F. J., McKee, W. A., and Cummins, K. W. (1991). An ecosystem perspective of riparian zones. BioScience 41, 540–551. doi: 10.2307/1311607
Gustafsson, K. M., Agrawal, A. A., Lewenstein, B. V., and Wolf, S. A. (2015). The monarch butterfly through time and space: the social construction of an icon. BioScience 65, 612–622. doi: 10.1093/biosci/biv045
Haefele, M. A., Loomis, J. B., Merideth, R., Lien, A., Semmens, D. J., Dubovsky, J., et al. (2018). Willingness to pay for conservation of transborder migratory species: a case study of the Mexican free-tailed bat in the United States and Mexico. Environ. Manage. 62, 229–240. doi: 10.1007/s00267-018-1046-1
Hansen, L., and Ribaudo, M. (2008). Economic Measures of Soil Conservation Benefits: Regional Values for Policy Assessment. USDA-ERS, TB-1922. Available online at: https://ageconsearch.umn.edu/record/184312/files/tb1922.pdf (accessed February 26, 2019).
Hawes, E., and Smith, M. (2005). Riparian Buffer Zones: Functions and Recommended Widths. Yale School of Forestry and Environmental Studies. Available online at: http://www.eightmileriver.org/resources/digital_library/appendicies/09c3_Riparian%20Buffer%20Science_YALE.pdf (accessed February 5, 2019).
Hoppe, R. (2017). America's Diverse Family Farms: 2017 Edition. USDA-ERS. EIB-185. Available online at: https://www.ers.usda.gov/webdocs/publications/86198/eib-185.pdf (accessed February 26, 2019).
Inamine, H., Ellner, S. P., Spring, J. P., and Agrawal, A. A. (2016). Linking the continental migratory cycle of the monarch butterfly to understand its population decline. Oikos. 125, 1081–1091. doi: 10.1111/oik.03196
Johnson, K. A., Dalzell, B. J., Donahue, M., Gourevitch, J., Johnson, D. L., Karlovits, G. S., et al. (2016). Conservation reserve program (CRP) lands provide ecosystem service benefits that exceed land rental payment costs. Ecosyst. Serv. 18, 175–185. doi: 10.1016/j.ecoser.2016.03.004
Kang, S., Post, W. M., Nichols, J. A., Wang, D., West, T. O., Bandaru, V., et al. (2013). Marginal lands: concept, assessment and management. J. Agricul. Sci. 5:129. doi: 10.5539/jas.v5n5p129
Kleijn, D., Winfree, R., Bartomeus, I., Carvalheiro, L.G., Henry, M., Isaacs, R., et al. (2015). Delivery of crop pollination services is an insufficient argument for wild pollinator conservation. Nat. Commun. 6:7414. doi: 10.1038/ncomms8414
Koh, I., Lonsdorf, E. V., Williams, N. M., Brittain, C., Isaacs, R., Gibbs, J., et al. (2016). Modeling the status, trends, and impacts of wild bee abundance in the United States. Proc. Natl. Acad. Sci. U.S.A. 113, 140–145. doi: 10.1073/pnas.1517685113
Landis, D. A., Wratten, S. D., and Gurr, G. M. (2000). Habitat management to conserve natural enemies of arthropod pests in agriculture. Annu. Rev. Entomol. 45, 175–201. doi: 10.1146/annurev.ento.45.1.175
Liu, Y., Engel, B. A., Flanagan, D. C., Gitau, M. W., McMillan, S. K., and Chaubey, I. (2017). A review on effectiveness of best management practices in improving hydrology and water quality: needs and opportunities. Sci. Total Environ. 601, 580–593. doi: 10.1016/j.scitotenv.2017.05.212
Lizotte-Hall, S. E., and Hartzler, R. G. (2019). Effect of postemergence fomesafen application on common milkweed (Asclepias syriaca) growth and utilization by monarchs (Danaus plexippus). Crop Prot. 116, 121–125. doi: 10.1016/j.cropro.2018.10.018
Loomis, J., Kent, P., Strange, L., Fausch, K., and Covich, A. (2000). Measuring the total economic value of restoring ecosystem services in an impaired river basin: results from a contingent valuation survey. Ecol. Econ. 33, 103–117. doi: 10.1016/S0921-8009(99)00131-7
Lowe, W. H., and Likens, G. E. (2005). Moving headwater streams to the head of the class. BioScience. 55, 196–197. doi: 10.1641/0006-3568(2005)055[0196:MHSTTH]2.0.CO;2
Lyons, J., Thimble, S.W., and Paine, L. (2000). Grass versus trees: managing riparian areas to benefit streams of central north America. J. Am. Water Resour. Assoc. 36, 919–930. doi: 10.1111/j.1752-1688.2000.tb04317.x
MacDonald, J., Hoppe, R., and Banker, D. (2006). Growing Farm Size and the Distribution of Farm Payments. USDA-ERS. EB-6. Available online at: https://www.ers.usda.gov/webdocs/publications/42916/29520_eb6_002.pdf?v=41326 (accessed February 14, 2019).
Maisonneuve, C., and Rioux, S. (2001). Importance of riparian habitats for small mammal and herpetofaunal communities in agricultural landscapes of southern Québec. Agric. Ecosyst. Environ. 83, 165–175. doi: 10.1016/S0167-8809(00)00259-0
Marshall, E. J. P., and Moonen, A. C. (2002). Field margins in northern Europe: their functions and interactions with agriculture. Aric. Ecosyst. Environ. 89, 5–21. doi: 10.1016/S0167-8809(01)00315-2
Mayer, P. M., Reynolds, S. K., McCutchen, M. D., and Canfield, T. J. (2007). Meta-analysis of nitrogen removal in riparian buffers. J. Environ. Qual. 36, 1172–1180. doi: 10.2134/jeq2006.0462
McGlynn, E. (2009). Native Bee Benefits: How to Increase Native Bee Pollination on Your Farm in Several Simple Steps. USDA Natural Resources Conservation Service. Available online at: https://www.nrcs.usda.gov/Internet/FSE_DOCUMENTS/stelprdb1143636.pdf (accessed February 27, 2019).
McKay, L., Bondelid, T., Dewald, T., Johnston, J., Moore, R., and Rea, A. (2012). NHDPlus Version 2: User Guide. Availablre online at: https://s3.amazonaws.com/nhdplus/NHDPlusV21/Documentation/NHDPlusV2_User_Guide.pdf (accessed February 6, 2019).
Merrill, M. (2015). Riparian buffers: the lack of buffer protection policies and recommendations to expand protection. J. Envtl. L. Litig. 31, 65–86. Available online at: http://hdl.handle.net/1794/19860
Meyer, L. D., Dabney, S. M., and Harman, W. C. (1995). Sediment trapping effectiveness of stiff-grass hedges. Trans ASABE. 38, 809–815. doi: 10.13031/2013.27895
Milfont, M. O., Rocha, E., Lima, A. N., and Freitas, B. (2013). Higher soybean production using honeybee and wild pollinators, a sustainable alternative to pesticides and autopollination. Environ. Chem. Lett. 11, 335–341. doi: 10.1007/s10311-013-0412-8
MNBWSR (2019). Minnesota Buffer Law. Minnesota Board of Water and Soil Resources. Available online at: https://bwsr.state.mn.us/minnesota-buffer-law (accessed June 28, 2019).
Monasterolo, M., Musicante, M. L., Valladares, G. R., and Salvo, A. (2015). Soybean crops may benefit from forest pollinators. Agric. Ecosyst. Environ. 202, 217–222. doi: 10.1016/j.agee.2015.01.012
Naiman, R. J., and Decamps, H. (1997). The ecology of interfaces: riparian zones. Annu. Rev. Ecol. Evol. Syst. 28, 621–658. doi: 10.1146/annurev.ecolsys.28.1.621
Naiman, R. J., Decamps, H., and Pollock, M. (1993). The role of riparian corridors in maintaining regional biodiversity. Ecol. Appl. 3, 209–212. doi: 10.2307/1941822
Oberhauser, K., Wiederholt, R., Diffendorfer, J.E., Semmens, D., Ries, L., Thogmartin, W.E., et al. (2017). A trans-national monarch butterfly population model and implication for regional conservation priorities. Ecol. Entomol. 42, 51–60. doi: 10.1111/een.12351
Olaya-Arenas, P. A., and Kaplan, I. (2019). Quantifying pesticide exposure risk for monarch caterpillars on milkweeds bordering agricultural land. Front. Ecol. Evolut. 7:223. doi: 10.3389/fevo.2019.00223
Osborne, L., and Kovacic, D. (1993). Riparian vegetated buffer strips in water-quality restoration and stream management. Freshwater Biol. 29, 243–258. doi: 10.1111/j.1365-2427.1993.tb00761.x
Paine, L. K., and Ribic, C. A. (2002). Comparison of riparian plant communities under four land management systems in southwestern Wisconsin. Agric. Ecosyst. Environ. 92, 93–105. doi: 10.1016/S0167-8809(01)00269-9
Pleasants, J. (2017). Milkweed restoration in the Midwest for monarch butterfly recovery: estimates of milkweeds lost, milkweeds remaining and milkweeds that must be added to increase the monarch population. Insect Conserv. Diversity 10, 42–53. doi: 10.1111/icad.12198
Pleasants, J. M., and Oberhauser, K. S. (2013). Milkweed loss in agricultural fields because of herbicide use: effect on the monarch butterfly population. Insect Conserv. Diversity 6, 135–144. doi: 10.1111/j.1752-4598.2012.00196.x
Pollinator Health Task Force (2015). National Strategy to Promote the Health of Honey Bees and Other Pollinators. Available online at: https://obamawhitehouse.archives.gov/sites/default/files/microsites/ostp/Pollinator%20Health%20Strategy%202015.pdf (accessed March 8, 2019).
Ries, L., Taron, D. J., and Rendón-Salinas, E. (2015). The disconnect between summer and winter monarch trends for the eastern migratory population: possible links to differing drivers. Ann. Entomol. Soc. Am. 108, 691–699. doi: 10.1093/aesa/sav055
Ruark, M. D., Panuska, J. C., and Cooley, E. T. (2009). Tile Drainage in Wisconsin: Understanding and Locating Tile Drainage Systems. Fact Sheet No. 1. University of Wisconsin: Discovery Farms. Available online at: https://fyi.extension.wisc.edu/drainage/files/2012/06/Understanding-and-Locating-Tile-Drain-Systems-Update.pdf (accessed February 11, 2019).
Rust, R. W., Mason, C. E., and Erickson, E. H. (1980). Wild bees on soybeans, glycine max. Environ. Entomol. 9, 230–232. doi: 10.1093/ee/9.2.230
Santos, E., Mendoza, Y., Vera, M., Carrasco-Letelier, L., Díaz, S., and Invernizzi, C. (2013). Aumento en la producción de semillas de soja (Glycine max) empleando abejas melíferas (Apis mellifera). Agrociencia Uruguay 17, 81–90. Available online at: http://www.scielo.edu.uy/scielo.php?pid=S2301-15482013000100009&script=sci_arttext&tlng=en
Saunders, S. P., Ries, L., Oberhauser, K. S., Thogmartin, W. E., and Zipkin, E. F. (2017). Local and cross-seasonal associations of climate and land use with abundance of monarch butterflies Danaus plexippus. Ecography 41, 278–290. doi: 10.1111/ecog.02719
Semmens, B. X., Semmens, D. J., Thogmartin, W. E., Wiederholt, R., López-Hoffman, L., Diffendorfer, J. E., et al. (2016). Quasi-extinction risk and population targets for the Eastern, migratory population of monarch butterflies (Danaus plexippus). Sci. Rep. 6:23265. doi: 10.1038/srep23265
Semmens, D. J., Diffendorfer, J. E., Bagstad, K. J., Wiederholt, R., Oberhauser, K., Ries, L., et al. (2018). Quantifying ecosystem service flows at multiple scales across the range of a long-distance migratory species. Ecosyst. Serv. 31, 255–264. doi: 10.1016/j.ecoser.2017.12.002
Sherrouse, B. C., Semmens, D. J., and Clement, J. M. (2014). An application of social values for ecosystem services (SolVES) to three national forests in colorado and wyoming. Ecol. Indic. 36, 68–79. doi: 10.1016/j.ecolind.2013.07.008
Stewart, J.S., Wang, L., Lyons, J., Horwatich, J.A., and Bannerman, R. (2001). Influences of watershed, riparian-corridor, and reach-scale characteristics on aquatic biota in agricultural watersheds. J. Am. Water Resour. Assoc. 37, 1475–1487. doi: 10.1111/j.1752-1688.2001.tb03654.x
Sugg, Z. (2007). Assessing U.S. Farm Drainage: Can GIS Lead to Better Estimates of Subsurface Drainage Extent. World Resources Institute. Available online at: https://www.wri.org/publication/assessing-us-farm-drainage (accessed February 27, 2019).
Thogmartin, W. E., López-Hoffman, L., Rohweder, J., Diffendorfer, J., Drum, R., Semmens, D., et al. (2017a). Restoring monarch butterfly habitat in the Midwestern US:‘all hands on deck’. Environ. Res. Lett. 12:7. doi: 10.1088/1748-9326/aa7637
Thogmartin, W. E., Wiederholt, R., Oberhauser, K., Drum, R. G., Diffendorfer, J. E., Altizer, S., et al. (2017b). Monarch butterfly population decline in North America: identifying the threatening processes. R. Soc. Open Sci. 4:9. doi: 10.1098/rsos.170760
Tiwari, T., Lundstrom, J., Kuglerova, L., Laudon, H., Ohman, K., and Agren, A.M. (2016). Cost of riparian buffer zones: a comparison of hydrologically adapted site-specific riparian buffers with traditional fixed widths. Water Resour. Res. 52, 1056–1069. doi: 10.1002/2015WR018014
Tomer, M. D., Porter, S. A., Boomer, K. M. B., James, D. E., Kostel, J. A., Helmers, M. J., et al. (2015). Agricultural conservation planning framework: 1. developing multipractice watershed planning scenarios and assessing nutrient reduction potential. J. Environ. Qual. 44, 754–767. doi: 10.2134/jeq2014.09.0386
Tomer, M. D., Porter, S. A., James, D. E., Boomer, K. M. B., Kostel, J. A., and McLellan, E. (2013). Combining precision conservation technologies into a flexible framework to facilitate agricultural watershed planning. J. Soil Water Conserv. 68, 113A−120A. doi: 10.2489/jswc.68.5.113A
Tooker, J. F., Douglas, M. R., and Krupke, C. H. (2017). Neonicotinoid seed treatments: limitations and compatibility with integrated pest management. Agric. Environ. Lett. 2:170026. doi: 10.2134/ael2017.08.0026
USDA/NASS (2015). Cropland Data Layer 2015 - National Download. Available online at: https://www.nass.usda.gov/Research_and_Science/Cropland/Release/index.php (accessed February 28, 2019).
USDA/NASS (2016). Quick Stats Crop Prices by State. USDA National Agricultural Statistics Service. Available online at: https://quickstats.nass.usda.gov/ (accessed February 8, 2019).
USDA-NRCS (2018). Summary Report: 2015 National Resources Inventory, Natural Resources Conservation Service, Washington, DC, and Center for Survey Statistics and Methodology, Iowa State University, Ames, Iowa. Available online at: https://www.nrcs.usda.gov/Internet/FSE_DOCUMENTS/nrcseprd1422028.pdf (accessed March 7, 2019).
USFWS (2019). Endangered, Threatened, Proposed and Candidate Species in the Upper Midwest (Region 3). U.S. Fish and Wildlife Service. Availabe online at: https://www.fws.gov/midwest/endangered/lists/e_th_pr.html (accessed February 25, 2019).
Vidal, O., and Rendón-Salinas, E. (2014). Dynamics and trends of overwintering colonies of the monarch butterfly in Mexico. Biol. Conserv. 180, 165–175. doi: 10.1016/j.biocon.2014.09.041
Wheelock, M. J., Rey, K. P., and O'Neal, M. E. (2016). Defining the insect pollinator community found in iowa corn and soybean fields: implications for pollinator conservation. Environ. Entomol. 45, 1099–1106. doi: 10.1093/ee/nvw087
Wohl, E. (2017). The significance of small streams. Front. Earth Sci. 11, 447–456. doi: 10.1007/s11707-017-0647-y
Young, R. A., Huntrods, T., and Anderson, W. (1980). Effectiveness of vegetated buffer strips in controlling pollution from feedlot runoff. J. Environ. Qual. 9, 483–487. doi: 10.2134/jeq1980.00472425000900030032x
Yuan, Y., Bingner, R. L., and Locke, M. A. (2009). A review of effectiveness of vegetative buffers on sediment trapping in agricultural areas. Ecohydrology 2, 321–336. doi: 10.1002/eco.82
Zhang, W., Ricketts, T. H., Kremen, C., Carney, K., and Swinton, S. M. (2007). Ecosystem services and dis-services to agriculture. Ecol. Econ. 64, 253–260. doi: 10.1016/j.ecolecon.2007.02.024
Keywords: ecosystem services, water quality, pollination, wild pollinators, geospatial analysis, monarch butterfly
Citation: Semmens D and Ancona Z (2019) Monarch Habitat as a Component of Multifunctional Landscape Restoration Using Continuous Riparian Buffers. Front. Environ. Sci. 7:126. doi: 10.3389/fenvs.2019.00126
Received: 08 March 2019; Accepted: 16 August 2019;
Published: 30 August 2019.
Edited by:
Ryan G. Drum, United States Fish and Wildlife Service (USFWS), United StatesReviewed by:
Steven Bradbury, Iowa State University, United StatesDouglas Landis, Michigan State University, United States
Copyright © 2019 Semmens and Ancona. This is an open-access article distributed under the terms of the Creative Commons Attribution License (CC BY). The use, distribution or reproduction in other forums is permitted, provided the original author(s) and the copyright owner(s) are credited and that the original publication in this journal is cited, in accordance with accepted academic practice. No use, distribution or reproduction is permitted which does not comply with these terms.
*Correspondence: Darius Semmens, dsemmens@usgs.gov