Nitrogen and Phosphorus Additions Alter the Abundance of Phosphorus-Solubilizing Bacteria and Phosphatase Activity in Grassland Soils
 Meike Widdig1
  Per-M. Schleuss1
  Alfons R. Weig2
  Alexander Guhr1
  Lori A. Biederman3
  Elizabeth T. Borer4 Michael J. Crawley5
  Kevin P. Kirkman6
  Eric W. Seabloom4 Peter D. Wragg7
  Marie Spohn1*
- 1Department of Soil Biogeochemistry and Soil Ecology, University of Bayreuth, Bayreuth, Germany
- 2Keylab for Genomics and Bioinformatics, University Bayreuth, Bayreuth, Germany
- 3Department of Ecology, Evolution and Organismal Biology, Iowa State University, Ames, IA, United States
- 4Department of Ecology, Evolution, and Behavior, University of Minnesota, St. Paul, MN, United States
- 5Department of Life Sciences, Imperial College London, Silwood Park, Ascot, United Kingdom
- 6School of Life Sciences, University of KwaZulu-Natal, Pietermaritzburg, South Africa
- 7Department of Forest Resources, University of Minnesota, St. Paul, MN, United States
Microorganisms mobilize phosphorus (P) in soil by solubilizing bound inorganic P from soil minerals and by mineralizing organic P via phosphatase enzymes. Nitrogen (N) inputs are predicted to increase through human activities and shift plants to be more P limited, increasing the importance of P mobilization processes for plant nutrition. We studied how the relative abundance of P-solubilizing bacteria (PSB), PSB community composition, and phosphatase activity respond to N and P addition (+N, +P, +NP) in grassland soils spanning large biogeographic gradients. The studied soils are located in South Africa, USA, and UK and part of a globally coordinated nutrient addition experiment. We show that the abundance of PSB in the topsoil was reduced by −18% in the N and by −41% in the NP treatment compared to the control. In contrast, phosphatase activity was significantly higher in the N treatment than in the control across all soils. Soil C:P ratio, sand content, pH, and water-extractable P together explained 71% of the variance of the abundance of PSB across all study sites and all treatments. Further, the community of PSB in the N and NP addition treatment differed significantly from the control. Taken together, this study shows that N addition reduced the relative abundance of PSB, altered the PSB community, and increased phosphatase activity, whereas P addition had no impact. Increasing atmospheric N deposition may therefore increase mineralization of organic P and decrease solubilization of bound inorganic P, possibly inducing a switch in the dominant P mobilization processes from P solubilization to P mineralization.
Introduction
The availability of reactive nitrogen (N) has strongly increased during the last century through anthropogenic activities (Schlesinger, 2009) and is not paralleled by a similar increase in phosphorus (P) inputs to terrestrial ecosystems (Peñuelas et al., 2013). This imbalance between N and P inputs might shift plant productivity in grasslands toward P limitation (Elser et al., 2007). Therefore, it is important to understand processes of microbial P mobilization such as mineralization of organic P and solubilization of bound inorganic P, which maintain plant P nutrition. A key knowledge gap is the role that N supply plays in P mobilization processes and how N affects the community composition of P-solubilizing bacteria (PSB).
Plants and microorganisms mineralize organic P through the release of phosphatase enzymes that catalyze the hydrolysis of organic P, and turn organic P into inorganic P, which can be taken up by plants. The production of phosphatase enzymes depends on soil organic matter content, soil pH, plant and microbial nutrient demand, and, in particular, on N availability (Olander and Vitousek, 2000; Sinsabaugh et al., 2008). Hence, N addition often increases phosphatase activity (Marklein and Houlton, 2012; Heuck et al., 2018). In contrast, inorganic P addition can reduce phosphatase activity in soils because organisms stop producing phosphatase when supplied with inorganic P (Olander and Vitousek, 2000; Sinsabaugh et al., 2008; Marklein and Houlton, 2012).
Soil P solubilization is defined as the mobilization of inorganic P bound to soil minerals, of which most are apatites, leading to a release of plant available P into the soil solution (Hinsinger, 2001; Walpola and Yoon, 2012). Different mechanisms for P solubilization are known, which include the release of protons, chelation, exchange reactions, and production of various acids (Jones and Oburger, 2011; Walpola and Yoon, 2012). One of the main processes of P solubilization is acidification through the release of protons, which can be accelerated by plant and microorganisms (Hinsinger, 2001; Jones and Oburger, 2011). Furthermore, plants, and microorganisms can stimulate P dissolution by the release of organic acids, exopolysaccharides, and siderophores (Reid et al., 1985; Yi et al., 2008; Jones and Oburger, 2011).
Both P mineralization and P solubilization likely underlie stoichiometric constraints, because microbes need N and organic C to produce phosphatases. Further they need organic compounds as a C source to produce acids and exopolysaccharides that solubilize P (Spohn, 2016). Moreover, the production of these compounds requires N for transcription and translation. Yet, the effect of N and P availability on P solubilization and the abundance of PSB has rarely been studied (Mander et al., 2012; Lepleux et al., 2013; Nicolitch et al., 2016). In a temperate beech forest, PSB were significantly more abundant in nutrient-poor than in nutrient-rich soils (Nicolitch et al., 2016), and PSB were significantly more abundant in unfertilized soils than in soils fertilized with P in three long-term grassland fertilizer trials in New Zealand (Mander et al., 2012). These studies suggest that the abundance of PSB is enhanced in nutrient-poor soils and suppressed by P addition, however, it is not clear yet how increasing N supply with and without P influences the abundance of PSB. Since N addition might increase P demand and N is required for the production of solubilizing compounds, we expect an increase of PSB under N addition. While it has frequently been reported that N and P addition can shift the overall microbial community composition (Fierer et al., 2012; Leff et al., 2015; Schleuss et al., 2019), few studies have been conducted with regard to PSB communities. Several bacterial genera such as Pseudomonas, Burkholderia, Bacillus, Enterobacter, Erwinia, Serratia, Acinetobacter, and Rhizobium are able to solubilize P (Rodriguez and Fraga, 1999). Under nutrient deficiency, PSB belonging to the genera Collimonas, Burkholderia, and Kitasatospora were more abundant than under high nutrient supply (Nicolitch et al., 2016). Furthermore, long-term P fertilization altered the abundance of Actinobacteria, Pseudomonadaceae, and Moraxellaceae (Mander et al., 2012). However, little is known about PSB community changes under single and combined N and P addition.
Here, we use a standardized nutrient-addition experiment at six grassland sites in South Africa, the USA, and the UK to investigate the effects of N and P additions on P mobilization in soil. Specifically, we used a dual approach investigating indicators of P solubilization from minerals (abundance of PSB) and P mineralization from organic matter (phosphatase activity). We studied how single and combined addition of N and P affects the relative abundance of PSB, community composition of PSB, and phosphatase activity. We hypothesized that (i) P addition decreases the relative abundance of PSB and phosphatase activity (ii) N addition increases the relative abundance of PSB and phosphatase activity, and (iii) N, P, and NP additions alter the community composition of PSB.
Materials and Methods
Sampling Sites and Experimental Design
We sampled soil at six grassland sites located in South Africa, the USA, and the UK (Table 1 and Supplement A) belonging to a globally replicated experiment (Nutrient Network, Borer et al., 2014). The sites were chosen because they span large biogeographical gradients (Tables 1, 2) and represent some of the major types of grasslands that exist globally. To understand interactions between N and P supply and to test whether P availability influences P mobilization processes, we analyzed not only effects of N addition, but also independent and interactive effects of N and P addition. We sampled the soil in four different treatments, namely control, +N, +P, and +NP. Nutrients were applied annually to the experimental plots at the beginning of the growing season: 10 g m−2 yr−1 as time-release urea [(NH2)2CO], and 10 g m−2 yr−1 as triple-super phosphate [Ca(H2PO4)2], and the nutrient addition treatment had been in place for at least 7 years at the time of sampling (2017). The added amount of N and especially P in our study is higher than current levels of atmospheric deposition based on two reasons. First, to identify differences between the control and the treatments, the nutrient additions needed to be significantly larger than current atmospheric deposition. Second, the nutrient addition treatments needed to be high enough to identify changes in a field experiment against a background that changes due to heterogeneity in soil properties. The experimental design is a randomized block design and each treatment was applied to 5 × 5 m plots and replicated three times at each site. Further details of the experimental design are explained in Borer et al. (2014).
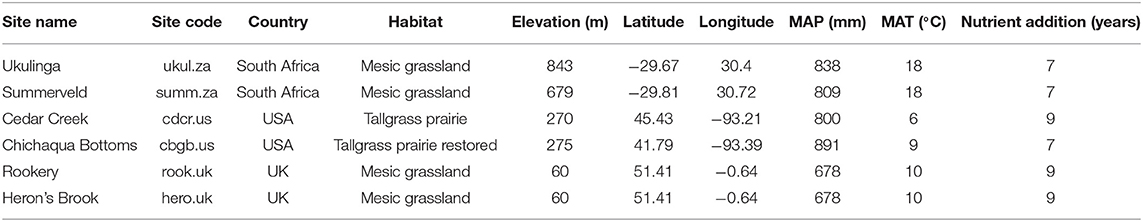
Table 1. Site name, site code, country, habitat, elevation, latitude, longitude, mean annual precipitation (MAP), mean annual temperature (MAT), and the duration of the nutrient addition treatments of the six grassland sites.
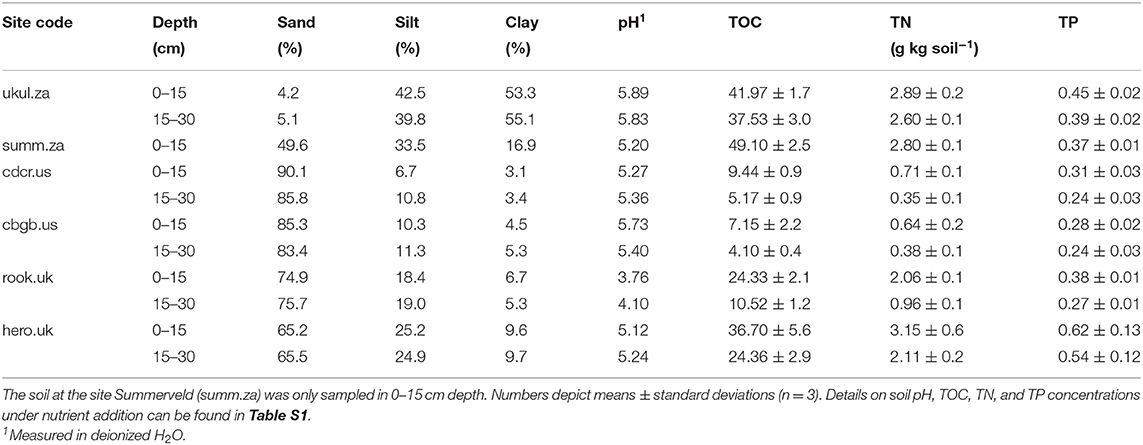
Table 2. Soil texture, pH, total organic carbon (TOC), total nitrogen (TN), and total phosphorus (TP) in 0–15 cm and 15–30 cm depth in the soils of the control treatment at the six sites.
Sampling and Sample Preparation
At all sites, samples were collected at the end of the vegetation period in 2017 (February in South Africa, September in the USA, and October in the UK). Soil samples were collected from two depth increments (0–15 cm, 15–30 cm, both located in the A horizon of each soil), except for Summerveld (summ.za), where only the first depth increment was sampled because the soil was very shallow. Six soil samples were taken per plot using a 3.5 cm diameter soil corer, and the samples were combined into one mixed sample per plot. Samples were shipped to the University of Bayreuth within 1 week after sampling. Soils were sieved (<2 mm) and stones and roots were removed. To determine water content and water holding capacity, an aliquot of the samples was weighted, soaked with water, drained for 24 h in a sand bath and weighted again before and after drying at 105°C. After sieving, water holding capacity was adjusted to 60% and samples were pre-incubated for 1 week at 15°C for subsequent measurements (i.e., soil water extracts, and phosphatase activity). Samples for total C, N, and P concentration analyses were dried at 60°C and subsequently milled using a ball mill.
Soil Chemical Parameters
Soil pH was measured in deionized water in a soil:water ratio of 1:2.5. Soil samples were dried at 60°C and milled before measuring total organic C (TOC) and total N (TN) using an element analyzer (Vario Max Elementar, Hanau, Germany) and total P (TP) using ICP-OES (Vista-Pro radial, Varian) after a pressure digestion in aqua regia. Dissolved organic carbon (DOC), dissolved nitrogen (DN), and dissolved inorganic phosphorus (DIP) were extracted from 20 g of soil (dry-mass equivalent) in 80 ml deionized water by shaking for 1 h. Subsequently, the extracts were passed through 0.45 μm cellulose acetate filters and quantified (TOC, TN: TOC:TN Analyzer, multi N/C 2100, Jena Analytics, Germany, and DIP: UV 1800, Shimadzu). Adsorbed P (Bray-1 P) was extracted from 4 g of soil (dry-mass equivalent) in 40 ml Bray-1 solution (0.03 M NH4F−0.025 M HCl) (Bray and Kurtz, 1945) and was determined colorimetrically by a multi-plate reader (Infinite® 200 PRO, TECAN), using the molybdenum blue method (Murphy and Riley, 1962). Total organic phosphorus (TOP) was determined by the ignition method according to Saunders and Williams (1955) modified by Walker and Adams (1958). An aliquot of each sample was ignited at 550°C in a muffle furnace. Both ignited and non-ignited aliquots were extracted in 0.5 M H2SO4 for 16 h on a horizontal shaker followed by centrifugation at 1,500 × g for 15 min. TOP was calculated as the difference between ignited and non-ignited samples. Phosphorus fractions were measured according to the Hedley fractionation (Hedley et al., 1982) modified by Tiessen and Moir (2007). Dried soil samples of the control were milled and 0.5 g soil and 30 ml deionized water were shaken for 16 h on an overhead shaker and centrifuged at 4,100 × g for 15 min. Inorganic P in water extracts was measured colorimetrically by a multi-plate reader using the molybdenum blue method. The remaining soil was subsequently extracted in 30 ml 0.5 M NaHCO3 (labile P), followed by an extraction with 30 ml 0.1 M NaOH (occluded P), and 30 ml 1 M HCl (apatite P). Total P of NaHCO3, NaOH, and HCl extracts were measured using ICP-OES. Residual P was calculated by subtracting all P fractions from TP.
Soil Microbial Biomass C and Microbial Community Composition
Microbial biomass C was determined using the chloroform fumigation-extraction method (Vance et al., 1987). Each soil sample was split into two samples, of which one was fumigated. Fumigated and non-fumigated samples were extracted in 0.5 M K2SO4 in a ratio of 1:5 (soil:extractant, m/v). Total C was measured by a TOC:TN Analyzer (multi N/C 2100, Analytik Jena, Jena, Germany). To calculate the concentration of microbial biomass C, the concentration of C in the non-fumigated sample was subtracted from the one in the fumigated sample and multiplied by a conversion factor of 2.22 (Jenkinson et al., 2004).
For analysis of microbial community composition, DNA was extracted from 250 to 500 mg soil samples using the Nucleo-Spin Soil' kit (No. 740780, Macherey-Nagel) as described in Heuck et al. (2015). Automated ribosomal intergenic spacer analysis (ARISA; Fisher and Triplett, 1999) was adopted to analyze bacterial and fungal communities in parallel as follows: Ribosomal intergenic spacers/internal transcribed sequences were PCR-amplified in two separate reactions using bacteria-specific primers (ITSF and ITSReub; Cardinale et al., 2004) and fungi-specific primers (ITS1F-Z and ITS2; White et al., 1990; Weig et al., 2013), respectively. Five nanogram metagenomic DNA was used in a 12.5 ml PCR volume as previously described (Weig et al., 2013). The ITSF forward primer was labeled with fluorescent dye BMN-6 and the ITS1F-Z forward primer was labeled with fluorescent dye BMN-5 (Biomers, Ulm, Germany). Bacterial and fungal ARISA PCR products were separated independently on the FragmentAnalyzer capillary electrophoresis instrument (Agilent, Waldbronn, Germany) equipped with a long capillary array (55 cm). Two microliter of ARISA PCR products were used for the double-stranded DNA kit DNF-910 (Agilent) and separated on the FragmentAnalyzer using default specifications defined in the DNF-910 method file accompanying the instrument. The electropherograms of each sample were manually inspected using the Prosize software (v3, Agilent) and a peak table including size of fragments and peak intensity (RFU) was exported for further analyses. For statistical analyses of the ARISA data, only fragments between 200 and 1,000 bp in size were selected and analyzed by the Primer7 software (v 7.0.13, Primer-E Ltd.). PCR fragment profiles were compared between samples by the shape of cumulative frequency curves independently for bacterial and fungal ITS amplification products: A matrix of the peak table (size in bp vs. peak intensity/RFU) for all samples was imported in Primer 7 for bacterial and fungal data, respectively. Each sample was then standardized to its own total value (total RFU) and a cumulative profile (adding standardized peak values along ascending fragment size) was calculated for each sample. Finally, a resemblance matrix was calculated from the cumulative profile matrix using Manhattan distance (implemented in Primer 7) as resemblance measure. Differences between microbial community signatures of different samples and sites were tested by ANOSIM (One-way-analysis of similarities with 999 permutations).
Relative Abundance of P-Solubilizing Bacteria
To determine the relative abundance of PSB, 0.5 g of soil from the topsoil was mixed with 49.5 ml of sterile water and shaken for 45 min. The relative abundance of PSB is the proportion of colony-forming units (CFU, colonies that grow on the medium) able to solubilize P divided by the total number of CFU multiplied by 100. The soil suspension was diluted by a factor of either 1,000 or 10,000 according to cell density assessed in pre-experiments. An aliquot of the soil suspension was added to an agar plate containing Pikovskaya (PVK) medium [10 g glucose, 5 g hydroxyapatite, 0.5 g (NH4)2SO4, 0.2 g NaCl, 0.1 g 7 H2O, 0.2 g KCl, 0.5 g yeast extract, 0.002 g H2O, 0.002 g 7 H2O, and 15 g agar per liter (Pikovskaya, 1948)]. Plates were incubated for 7 days at 20°C before colonies were counted. At least 100 colony-forming units (CFU) per soil sample were screened. If CFU are able to solubilize P from the hydroxyapatite in the medium, a clear zone (halo) around the CFU becomes visible. If a halo with a diameter > 1 mm was visible around a CFU, the isolate was classified as a strong PSB. If a CFU produced a halo < 1 mm it was classified as weak PSB. However, it has to be taken into account that the condition in our physiological assay favored fast-growing bacteria. Thus, we might underestimate the P solubilization of slow-growing bacteria.
Sequencing of P-Solubilizing Bacteria and Processing of Sequence Data
Colonies of PSB were selected for sequencing and picked from the agar plate using sterile toothpicks. Genomic DNA of the bacterial colonies was extracted using the “NucleoMag 96 Tissue” kit (No. 744300, Macherey-Nagel) on a KingFisher liquid handling platform (Thermo Scientific). Genomic DNA was diluted 100-fold with nuclease free water and 16S fragments covering variable regions (V5–V8) were amplified using primers 799F (Chelius and Triplett, 2001) and 1391R (Walker and Pace, 2007). PCR products were purified using the “NucleoMag 96 PCR” cleanup kit (No. 744100, Macherey-Nagel) on a KingFisher liquid handling platform. PCR products were sequenced (Sanger sequencing, GATC Biotech) using primer 799F. Sequence data were analyzed in Geneious sequence analysis software (v. 11; Biomatters Ltd.). The sequences were searched for PCR primer sequences (799F and 1391R) and for low quality bases, which were excluded from sequence database searches. Fragment size after quality trimming was ~580 bp, some fragments with high quality in most parts were shorter. Sequence similarity searches were conducted against the nr/nt nucleotide database at NCBI as well as the 16S sequences of the “NCBI RefSeq Targeted Loci Project”. 16S sequence alignments were calculated by MAFFT (v. 7.388, Geneious plugin; Katoh and Standley, 2013). Sequences were aligned in phylogenetic trees, which were edited using Evolview (He et al., 2016). In total, 903 PSB isolates were sequenced and used for further analyses. The list of the 20 best matching sequence hits for each isolate was uploaded into PRIMER 7 (Clarke and Gorley, 2015), standardized, cumulated, and clustered. Isolates, which had a consensus of more than 99% in the cluster analysis, were considered as identical isolates. After identification of identical isolates, a “consensus name” was assigned for each isolate cluster according to Peršoh et al. (2010) called operational taxonomic unit (OTU) in the following. For OTU assignment, we chose a taxonomic level that unified all names under which the 20 best matching sequences with a consensus ≥ 97% to the respective isolate sequence were deposited. To this end, the name of the lowest common rank in the nomenclatural hierarchy was chosen (Peršoh et al., 2010). Names for OTU assignment were used as indicated in the NCBI database, although recently so-called environmental bacteria of the genus Burkholderia have been transferred to the genus Paraburkholderia (Dobritsa and Samadpour, 2016). Analyses of similarities (ANOSIM) based on the number of OTUs grouped by taxon were conducted in PRIMER 7 to check first, if sites have a significant effect on PSB community and second, if treatments have a significant effect on PSB community.
Phosphatase Activity
Phosphatase activity was determined using the fluorogenic substrate 4-methylumbelliferyl-phosphate following German et al. (2011) and Herold et al. (2014). To this end, 1 g of moist soil was mixed with 50 ml of sterile water and shaken for 20 min. Four replicates of the soil homogenates were pipetted into black polystyrene 96-well microplates and substrate solution was added. Microplates were covered and pre-incubated in the dark at 15°C for 30 min and measured fluorometrically after 0, 60, 120, and 180 min with 360 nm excitation and 460 nm emission filters (Herold et al., 2014) using a microplate reader (Infinite® 200 PRO, TECAN). Enzyme activities were calculated according to German et al. (2011), except that we used the slope of net fluorescence over time to calculate enzyme activities. Fluorescence values were corrected for quenching of the soil, fluorescence of the substrate, and fluorescence of the homogenate. Since we added a substrate to our samples, potential enzyme activities were measured. Each time we mention enzyme activities, potential enzyme activities are meant.
Statistics
To test whether differences between the treatments at one site and in one soil depth increment were statistically significant, ANOVA followed by Tukey post-hoc test (p < 0.05) for multiple comparisons was used, if residuals were normally distributed (tested with Shapiro-Wilks test, p > 0.05) and variances were homogenous (tested with Levene test, p > 0.05). If necessary, data were log-, or square root-transformed and retested.
To show the element concentrations and the P fractions of the different sites, we first normalized element and P fraction data of all sites (TOC, TN, TP, TOC:TN ratio, TOC:TP ratio, TN:TP ratio, DOC, DN, DIP, DOC:DN ratio, TOP, Bray-1 P, water-extractable P, labile P, occluded P, apatite P, residual P, and soil pH) and calculated an Euclidean distance matrix in PRIMER 7 (Clarke and Gorley, 2015) with 999 permutations before non-metric multi-dimensional scaling (nMDS) was perfomed. The nMDS plot was overlaid by circles whose sizes reflect values of the TOC:TP ratios of all soils and with vectors of the Pearson correlations of the variables, where the arrows show in the direction of the highest correlation with the variables. Finally, one-way-ANOSIM with 999 permutations was used to test, if nutrient concentrations significantly differ by site.
To test the effects of nutrient addition on relative PSB abundance and phosphatase activity across all sites, a linear mixed-effects model as implemented in the R package nlme (Pinheiro et al., 2018) was used. This approach was chosen because it allows to show treatment effects among a set of sites spanning large biogeographical gradients. Treatment was set as fixed factor and random intercepts were included for sites to adjust for variability among them.
Finally, to examine the effects of climate and soil physical and chemical parameters as predictors for the relative abundance of PSB at site level, multi-model selection according to Grueber et al. (2011) was done to assess the relative importance of a range of covarying factors. The global model was fitted with random intercepts for treatments at each site to adjust for variations caused by them. Explanatory variables included in the global model were TOC, TN, TP, soil TOC:TN ratio, soil TOC:TP ratio, soil TN:TP ratio, DOC, DN, DIP, Bray-1 P, TOP, water-extractable P, labile P, occluded P, apatite P, residual P, pH, sand, MAT, and MAP. Silt and clay content were tested as explanatory variables in the model as well, but sand content obtained a greater model fit (R2 and p-value) after multi-model selection. Prior to analysis, input variables were standardized using the arm function within arm R library (Gelman et al., 2018). A full submodel set was generated with the dredge function in MuMIn R library (Barton, 2018). The models within the top four AICc (AIC corrected for small sample size) units of the model with the lowest AICc were averaged using the model.avg function of the MuMIn R library. The term “importance” represents the relativized sum of the AIC weights summed across all the models in which the parameter appears and can range between 0 (parameter has no explanatory weight) and 1 (parameter is present in all top models). The model variables with a relative variable importance of 1 were selected to fit an optimal linear mixed-effects model containing the most important variables, of which R2 and p-value were calculated. The model R2 was calculated as the conditional R2 according to Nakagawa and Schielzeth (2013), and the model p-value was obtained by likelihood ratio test of the full model with the effect in question against the model without the effect in question. All statistical analyses were done using R version 3.3.1 (R Core Team, 2018).
Results
Site Characteristics and Soil Chemical Parameters
The analyzed sites span broad biogeographic gradients that could control P dynamics. Mean annual temperature ranged from 6°C at Cedar Creek (cdcr.us) to 18°C at Ukulinga and Summerveld (ukul.za, summ.za), mean annual precipitation ranged from 678 mm at Rookery (rook.uk) to 891 mm at Chichaqua Bottoms (cbgb.us) (Table 1), and pH values in the topsoil controls ranged from 3.8 at Rookery (rook.uk) to 5.9 at Ukulinga (ukul.za) (Table 2). In addition, soil texture was diverse, ranging from sand at Cedar Creek (cdcr.us) to silty clay at Ukulinga (ukul.za, Table 2). Further, there was a pronounced gradient of TOC and TN concentrations across all sites (Table 2). Mean TOC concentrations in the topsoil control reached from 7 g kg soil−1 at Chichaqua Bottoms (cbgb.us) to 49 g kg soil−1 at Summerveld (summ.za) and mean TN concentrations from 0.5 g kg soil−1 at Chichaqua Bottoms (cbgb.us) to 3.7 g kg soil−1 at Herons Brook (hero.uk). In the control, TOC and TN in both depth increments were highest in the soils in South Africa and significantly lower in the soils in UK (−44 and −25%, respectively) and the USA (−85 and −81%, respectively) (Table 2). Mean TP concentrations in the topsoil control ranged between 0.28 g kg−1 in Chichaqua Bottoms (cbgb.us) and 0.62 g kg−1 in Heron's Brook (hero.uk, Table 2). The soils in UK contained the highest TP concentrations in the control in both depth increments, followed by the soils in South Africa (−11%) and in the USA (−41%). Topsoil TOC:TP ratios in the controls ranged from 40 in the soils from Chichaqua Bottoms (cbgb.us) to 359 in the soils from Summerveld (summ.za, Figure S1) and topsoil TN:TP ratios in the control soils ranged from 3.4 in Chichaqua Bottoms (cbgb.us) to 17.4 in Summerveld (summ.za).
P fractions varied among the sites as well. For instance, apatite P was below 1 % of TP in the soils in South Africa, amounted to 3-5% in the soils in the UK, and to 14–22% of TP in the soils in the USA (Figure S2). DOC, DN, and DIP formed a pronounced gradient among all soils as well (Table 3). Mean DOC concentrations in the topsoil control ranged from 15 mg kg soil−1 in Cedar Creek (cdcr.us) to 115 mg kg soil−1 in Ukulinga (ukul.za) and mean DN concentrations were lowest in Cedar Creek (cdcr.us, 3 mg kg soil−1) and highest in Rookery (rook.uk, 14 mg kg soil−1) compared to the other sites (Table 3). The resembled element concentrations and P fractions of all sites were significantly different from each other (Figure S1).
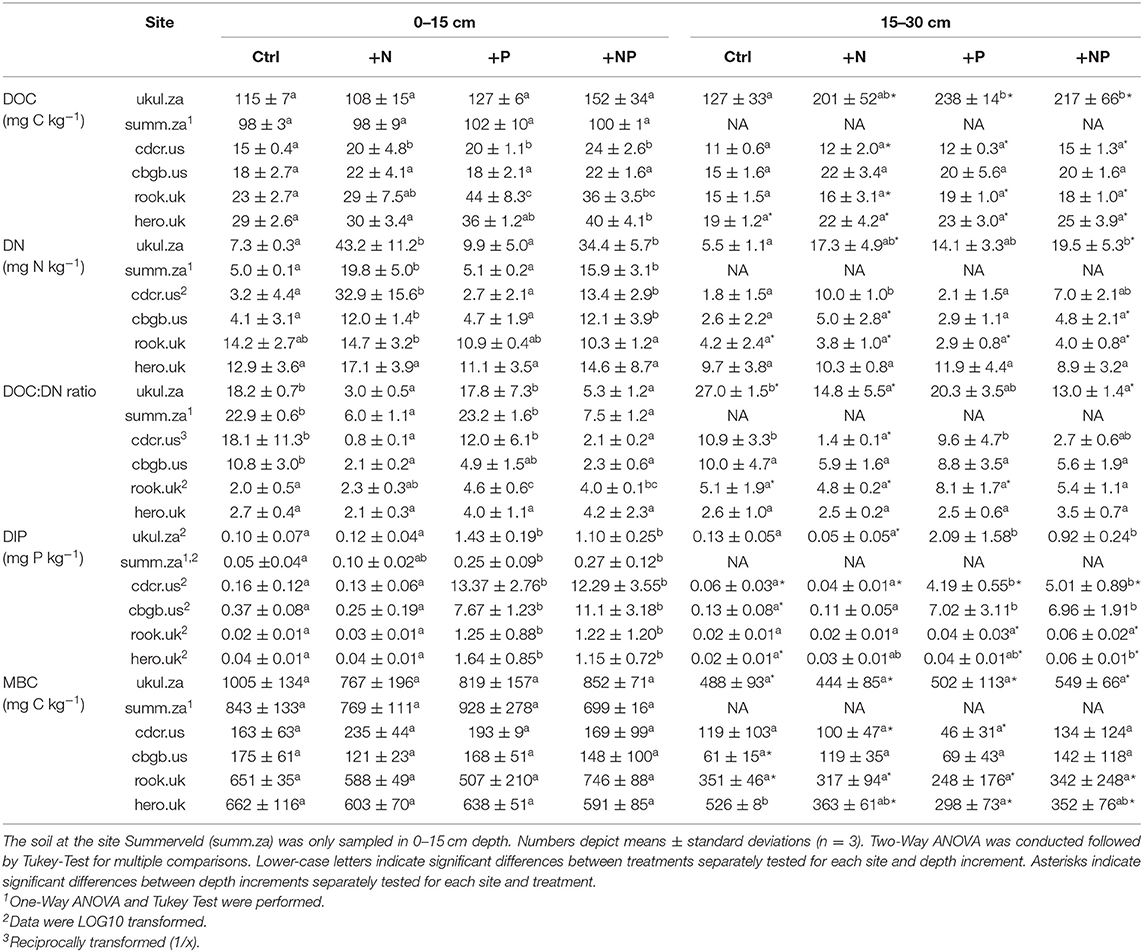
Table 3. Dissolved organic carbon (DOC), dissolved nitrogen (DN), dissolved inorganic phosphorus (DIP), and microbial biomass carbon (MBC) in 0-15 and 15–30 cm depth in the sampled soils.
Treatment Effects on Soil pH and Element Concentrations
Addition of N and NP did not significantly decrease soil pH in most soils. Only at Cedar Creek (cdcr.us), soil pH decreased significantly in response to N addition in the topsoil and due to N and NP addition in the second soil depth increment (Table S1).
Despite high amounts of N and P added, TOC, and TN concentrations did not change significantly with nutrient addition (an exception was the topsoil at Rookery (rook.uk), where N addition increased TN concentrations compared to NP addition and at Ukulinga (ukul.za), where NP addition increased TN concentrations compared to control, Table S1). Addition of P and NP significantly increased topsoil TP concentrations in Ukulinga (ukul.za), Chichaqua Bottoms (cbgb.us), and Rookery (rook.uk, Table S1). Mean TOC:TP ratios in the control soils of all sites were 147.0 and P addition reduced mean TOC:TP ratios to 96.0 (Figure S1). Topsoil TN:TP ratios in all treatments ranged between 1.9 and 18.8 (Table S1) and topsoil DN:DIP ratios in all treatments ranged even between 0.2 and 1604.6 (Table 3). In the NP treatment, TN:TP ratios ranged between 2.5 and 9.8 (Table S1), and DN:DIP ratios ranged between 1.2 and 236.5 (Table 3). Addition of N, P, and NP significantly increased topsoil DOC concentrations at Cedar Creek (cdcr.us), P and NP addition increased topsoil DOC concentrations at Rookery (rook.uk), and NP addition increased topsoil DOC concentrations at Heron's Brook (hero.uk) compared to control (Table 3). N and NP addition also raised DN concentrations compared to control and P addition in the topsoil at all sites except of Rookery (rook.uk) and Heron's Brook (hero.uk, Table 3). On average, N and NP addition raised DN concentrations across all soils by +164 and +106%, respectively, compared to the soils that did not receive N (Table 3). In the topsoils, P and NP additions significantly increased DIP concentrations compared to control and N addition at all sites (Table 3).
Soil Microbial Biomass C and Microbial Community Composition
The mean topsoil control concentration of microbial biomass C varied widely between 163 mg kg soil−1 in Cedar Creek (cdcr.us) and 1,005 mg kg soil−1 in Ukulinga (ukul.za, Table 3). The microbial biomass C concentrations were significantly lower in soils of the American sites compared to the concentrations in the soils of South Africa and the UK. Topsoil microbial biomass C did not vary significantly among treatments at each of the sites (p > 0.05, Table 3). The bacterial and fungal community did not differ significantly between treatments in either depth increment among each site (data not shown) and at all sites (p > 0.05, Figure S3). The bacterial community composition was significantly different at each of the six sites, except for the sites Cedar Creek (cdcr.us) and Rookery (rook.uk), which did not differ in their bacterial community composition (Figure S4a). The fungal community composition at each site was significantly different from each other (Figure S4b).
Relative Abundance of P-Solubilizing Bacteria
Across all sites, the relative abundance of PSB in the topsoil was significantly lower in the N (−18%) and NP treatment (−41%) than in the control (Figure 1A) according to the estimated model predictors of the linear mixed-effects model. In the second depth increment, the relative abundance of PSB in the NP treatment was also significantly lower (−60%) than in the control (Figure 1B).
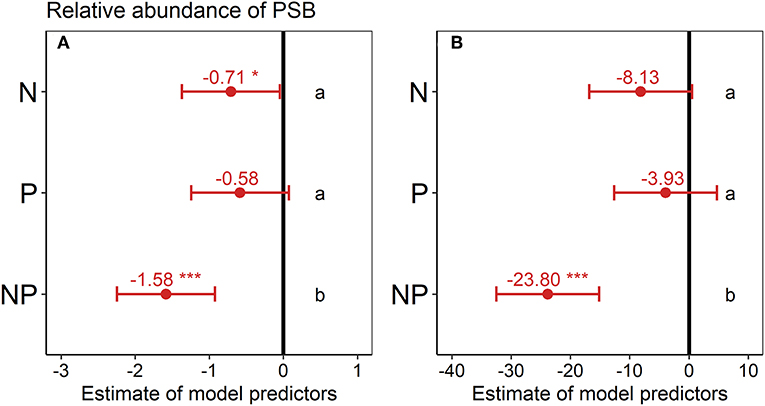
Figure 1. Effect of nutrient addition (N, P, NP) on the relative abundance of phosphorus-solubilizing bacteria (PSB) across all six sites in (A) 0–15 cm depth and (B) 15–30 cm depth. A linear mixed-effects model was calculated with treatment as fixed factor and random intercepts for sites. Points represent the mean value of the model predictor while error bars represent the range of 95% confidence intervals. Predictors are considered significant, if error bars do not overlap with zero, indicated with asterisks. The vertical intercept (position zero) corresponds to the control. Significant differences between treatments are indicated by lower-case letters at the right side of the subplot.
Site level-differences in the relative abundance of PSB were more pronounced than treatment effects on the relative abundance of PSB (Figure 2). The South African site Summerveld showed the highest relative abundance of PSB with 31% of all CFU being PSB, whereas the site Rookery in the UK showed the lowest relative abundance of PSB with 4 % in the topsoil (Figure S5 and Table S3). Mean numbers of CFUs ranged from 5.6 × 10⁴ to 8.9 × 10⁶ per g soil (Table S3). Considering the sites separately, the relative abundance of PSB did not differ significantly between the treatments, except for the sites Cedar Creek (cdcr.us) and Summerveld (summ.za, Figures S5b,d). The tendency of decreased topsoil PSB abundance under NP addition was similar at all sites. However, differences between nutrient addition treatments were mostly not significant at single site level, mainly because of high standard deviations. After multi-model selection, we found that at site level, soil TOC:TP ratio, percentage of sand, pH, and water-extractable P significantly predicted the variance of the relative abundance of PSB in the topsoil with an R2 of 0.71 (p < 0.01, Figure 2A and Table S2). A model based only on the control treatments with the same variables, predicted the variance of the relative PSB abundance with an R2 of 0.83 (all variables were significant, p = 0.012, Figure 2B and Table S2).
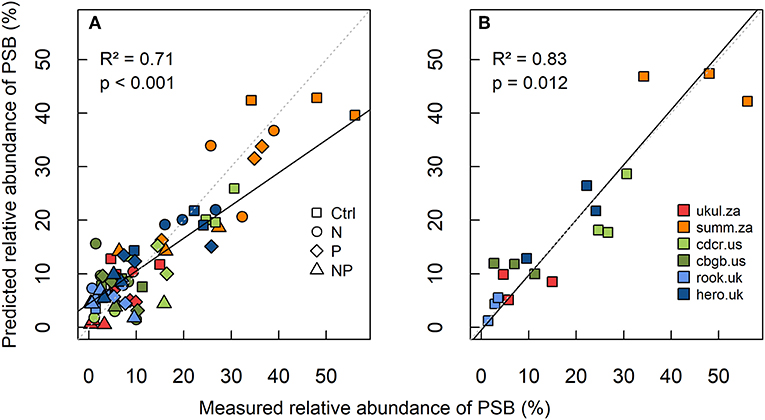
Figure 2. Linear mixed-effects model of (A) relative abundance of phosphorus-solubilizing bacteria (PSB) in all treatments, and (B) relative abundance of PSB in the control at all six grassland sites in 0–15 cm depth. Measured relative abundance of PSB is shown on the x-axis and predicted relative abundance of PSB (best model predictors: total organic carbon-to-total phosphorus ratio, sand content, soil pH, and water extractable phosphorus, Table S2) is shown on the y-axis. The linear mixed-effects model was calculated after multi-model selection. R2 was calculated as conditional R2 according to Nakagawa and Schielzeth (2013), the standard line is dashed (intercept = 0, slope = 1), and the fitted line of the model is solid.
Community Composition and Activity of P-Solubilizing Bacteria
The 903 sequenced PSB belonged to four phyla (Proteobacteria, Firmicutes, Bacteroidetes, Actinobacteria) and eight different classes (Actinobacteria, Alphaproteobacteria, Bacilli, Betaproteobacteria, Chitinophagia, Flavobacteriia, Gammaproteobacteria, Sphingobacteriia). Pseudomonas and Enterobacterales were present in all soils (Figure 3). The sequenced colonies were assigned to 146 OTUs and the most abundant OTUs were Pseudomonas (56 OTUs), Enterobacterales (50 OTUs), and Paenibacillus (14 OTUs).
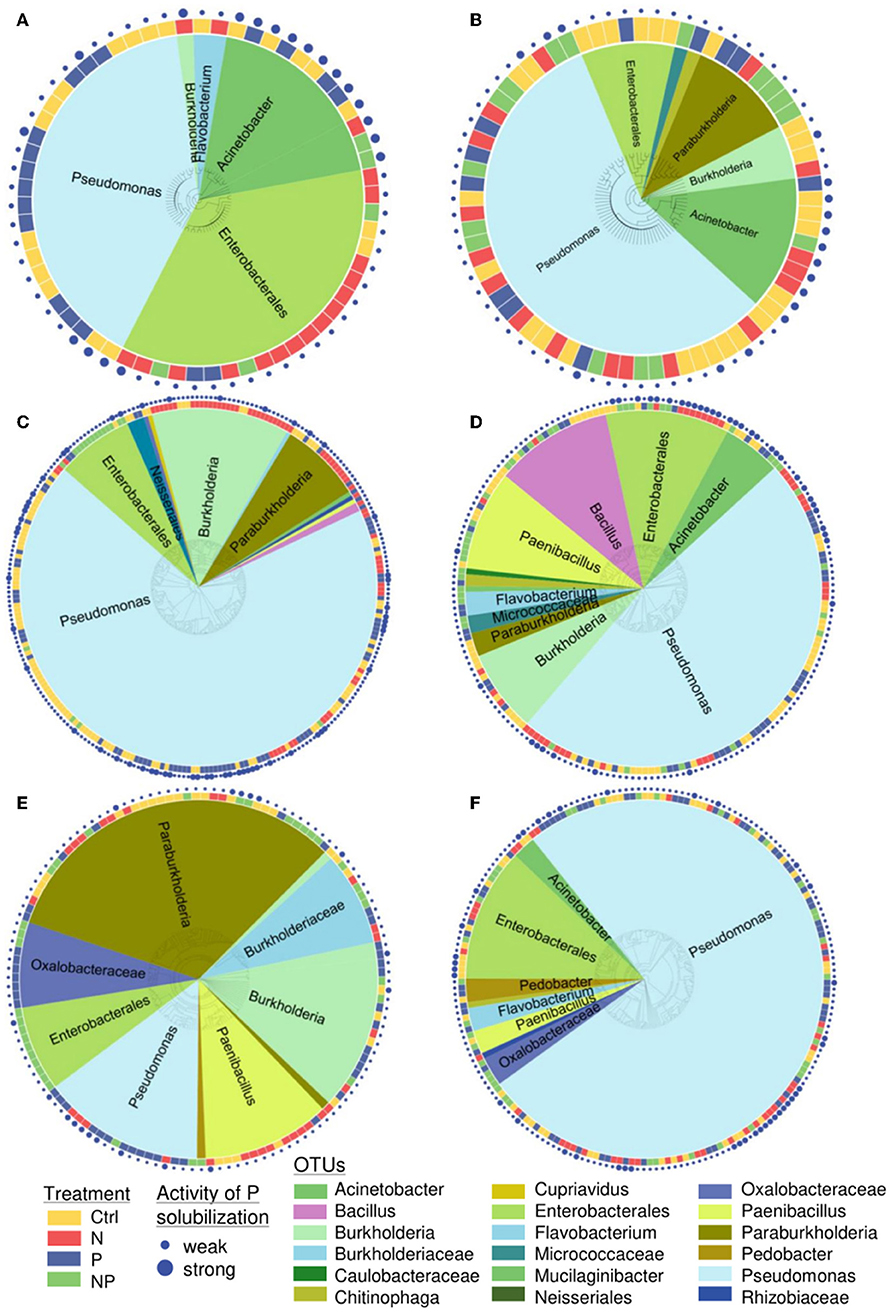
Figure 3. Phylogenetic tree of all sequenced phosphorus-solubilizing bacteria at the site (A) Ukulinga (ukul.za), (B) Summerveld (summ.za), (C) Cedar Creek (cdcr.us), (D) Chichaqua Bottoms (cbgb.us), (E) Rookery (rook.uk), and (F) Heron's Brook (hero.uk) in 0–15 cm soil depth. At least 100 colony-forming units per sample were screened. Colors around the tree indicate the nutrient addition treatments. Colors inside the tree show the assigned name (OTU). The size of the dots around the tree indicates the activity of P solubilization (weak or strong).
The PSB communities at all sites were significantly different from each other (p < 0.05, occurrence of OTUs of different taxa was tested), except for the sites Summerveld (summ.za) and Chichaqua Bottoms (cbgb.us) as well as Cedar Creek (cdcr.us) and Heron's Brook (hero.uk) that were not different from each other (Figure 4A). Across all sites, the PSB community in the N and NP treatment was significantly different from the community in the control and P treatment (p = 0.002) (Figure 4B). The soils of the control and P treatment contained more different Pseudomonas OTUs than the soils of the N and NP treatments and the number of different Enterobacterales OTUs was higher in soils of the N and NP treatments than in the soils of the control and P treatment (Figure 4B).
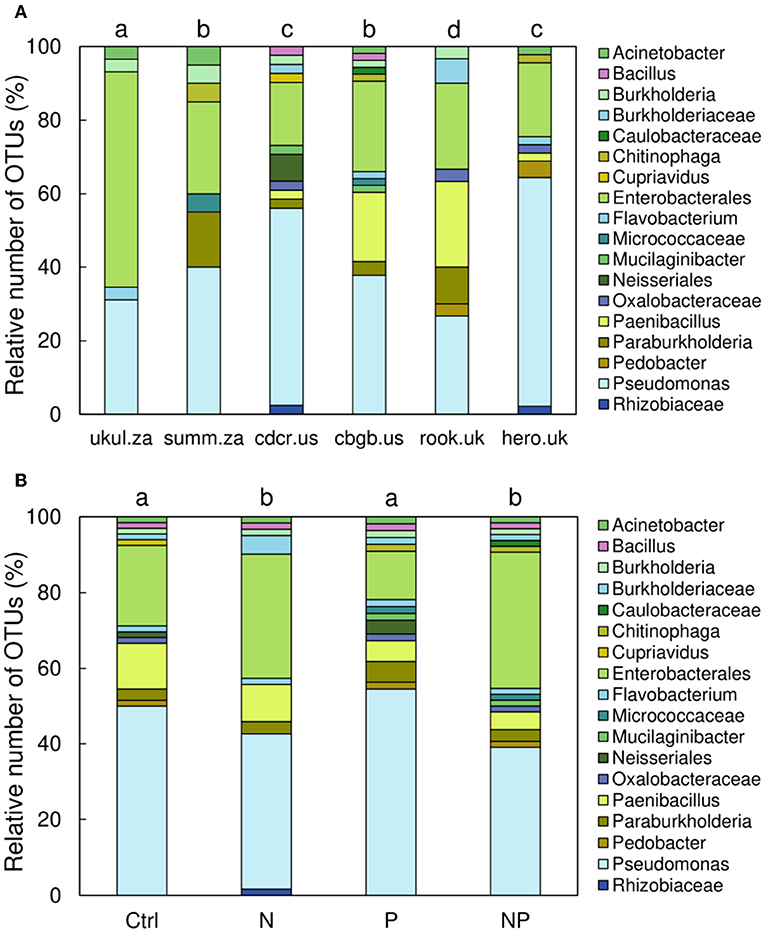
Figure 4. Relative number of operational taxonomic units (OTUs) of phosphorus-solubilizing bacteria in 0–15 cm soil depth sorted by (A) sites and (B) treatments. Different letters indicate significant differences (p < 0.05) among sites (A) and among treatments (B).
Between 16 and 24% of all PSB at the different sites were classified as strong P solubilizers according to their halo size. The proportions of PSB that were classified as strong solubilizers across all sites differed among treatments, with the greatest proportion (25%) in the control, 21% in both the N and P treatment, and 18% in the NP treatment.
Phosphatase Activity
Phosphatase activity in the N treatment was significantly higher (+17%) than in the control across all six topsoils (Figure 5A), according to the estimated model predictor of the linear mixed-effects model. Phosphatase activity also tended to be higher in the NP treatment (+ 9%) than in the control in the topsoil, but this difference was not statistically significant. Similarly, in the P treatment, phosphatase activity tended to be lower (−4%) than in the control in the topsoil, albeit the differences were not statistically significant. In the second depth increment, the differences in phosphatase activity between treatments and control were not statistically significant (Figure 5B).
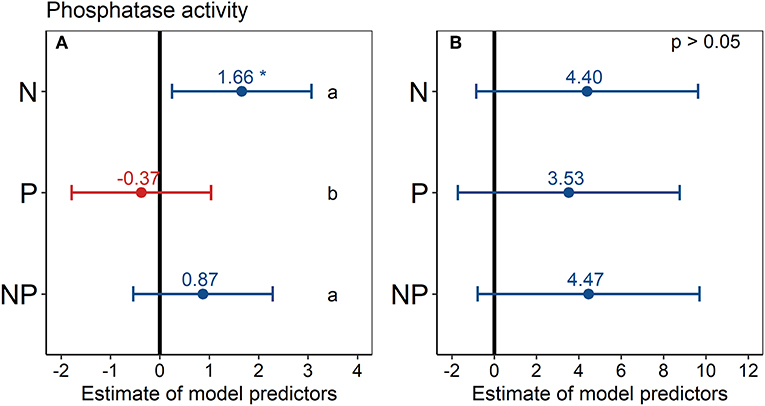
Figure 5. Effect of nutrient addition (N, P, NP) on soil phosphatase activity across all six sites in (A) 0–15 cm depth and (B) 15–30 cm depth. A linear mixed-effects model was calculated with treatment as fixed factor and random intercepts for sites. Points represent the mean value of the model predictor while error bars represent the range of 95% confidence intervals. Predictors are considered significant, if error bars do not overlap with zero, indicated with asterisks. The vertical intercept (position zero) corresponds to the control. Significant differences between treatments (N, P, and NP) are indicated by lower-case letters at the right side of the subplot.
Considering the sites separately, phosphatase activity did not differ significantly among the treatments at any site and in any depth increment (Figure S6), mainly because of high standard deviations. However, a tendency of increased phosphatase activity under N addition was visible at most sites. Phosphatase activity in the control treatment ranged from 17 nmol g−1 h−1 at Chichaqua Bottoms (cbgb.us) to 352 nmol g−1 h−1 at Summerveld (summ.za) across all sites and depth increments (Figure S6). Comparing the mean controls, the soils in the USA had the lowest phosphatase activities of all six soils (Figure S6). The specific phosphatase activity (phosphatase activity per microbial biomass C) showed no significant difference (p > 0.05) among treatments (data not shown).
Discussion
Here we found that N addition led to a significant decrease in the abundance of PSB (Figure 1). Furthermore, N addition in combination with P addition decreased the abundance of PSB even further, but when P was added alone, the abundance of PSB was not affected. Addition of N and NP changed the PSB community composition relative to the control and the P addition treatment (Figure 4). Furthermore, N addition significantly increased soil phosphatase activity across all topsoils and P addition tended to decrease phosphatase activity, albeit not significantly (Figure 5).
Relative Abundance and Activity of P-solubilizing Bacteria
Our observation that the relative abundance of PSB was significantly lower in the N and NP treatments than in the control across all six topsoils (Figure 1) indicates that N availability may affect the functional traits of the microbial community since a reduced abundance of PSB might also result in a decreased P solubilization. Microbes that can solubilize P may have an advantage under nutrient-poor conditions, leading to an increase in their relative abundance. The reason for this might be that microorganisms adapted to N- and NP-rich soil do not invest organic C and N into processes of nutrient acquisition, and thus have more energy left for growth and other fitness-related processes such as defense or the formation of symbiosis. Similar functional adaptions of microbial communities to nutrient availability have been described before (Calvaruso et al., 2007; Mander et al., 2012; Lepleux et al., 2013; Nicolitch et al., 2016). For example, in the rhizosphere of a temperate beech forest, it has been shown that P solubilization efficacy was lower in nutrient-rich soils than in soils with low nutrient availability (Nicolitch et al., 2016). The finding that N and NP addition decreased the relative abundance of PSB is against our hypothesis that PSB need N for the processes to produce organic acids and exopolysaccharides that solubilize P. In contrast, PSB are likely sensitive to soil nutrient conditions, and their abundance decreases under elevated nutrient availability, suggesting that they are poor competitors when N and NP availability is high.
We found that the total number of strong PSB was lowest under NP addition (−28% in comparison to control), suggesting that the ability to strongly solubilize P is rewarding under low-nutrient conditions, but not when N and P availability is high. Our results build on a previous study of a beech forest in France, reporting that the percentage of strong P solubilizers was significantly lower in nutrient-rich soils than in nutrient-poor soils (Nicolitch et al., 2016). Taken together, our results show that across a wide range of soil biotic and abiotic conditions, NP addition not only reduces the relative abundance of PSB but also the abundance of PSB with a specifically high capacity to solubilize P from minerals.
One reason why P addition alone did not significantly reduce the relative abundance of PSB compared to the control (Figure 1) might be that PSB do not only contribute to weathering of apatite but also to weathering of other minerals, leading to mobilization of K, Mg, Ca, and Fe (Hinsinger, 2001). Thus, even though the ability to mobilize P might not be beneficial in soils with high P availability, PSB might remain competitive in a high P environment since they can also mobilize other nutrients. In addition it could be that weathering is a side-effect of other metabolic processes that do not fulfill the primary function of mobilizing nutrients. This is supported by studies showing that the abundance of PSB was not related to levels of total and available P in Canadian cropland and pasture soils (Kucey, 1983), and in Irish agricultural soils (Browne et al., 2009). Still, it also needs to be considered that the amount of P added in our study (100 kg P ha−1 yr−1) may have been too small to cause significant changes in the relative abundance of PSB. Mander et al. (2012) reported a reduced abundance of PSB caused by additions as high as 367 kg P ha−1 yr−1 in a New Zealand pasture. Taken together, P addition did not reduce the relative abundance of PSB, which contrasts our hypothesis.
Our finding that the relative abundance of PSB in the control across all sites ranged from 2.6% in Rookery (rook.uk) to 46% in Summerveld (summ.za) of all colonies matches with previous studies that found abundances of PSB of 0.5% (Kucey, 1983) and between 47 and 53% (Browne et al., 2009). We found that the abundance of PSB across all sites was mostly affected by the TOC:TP ratio, sand content, soil pH, and water-extractable P content of the soils (Figure 2).The high relative abundance of PSB in Summerveld (summ.za) can thus largely be explained by the high TOC:TP ratios (Figure S1) and low concentrations of water-extractable P (Figure S2) found at this site compared to the other sites. We did not find a direct effect of P addition on the abundance of PSB, but our results (Table S2) indicate that the P concentration relative to the TOC concentration affects the abundance of PSB and the explanatory value of TOC:TP ratios for PSB abundance across all sites was higher compared to TN:TP ratios. The reason for this might be that a main mechanism of P solubilization is the production of organic acid anions (Jones and Oburger, 2011), and microbes need organic C to build and to release them. In addition, C addition has been shown to enhance P solubilization in laboratory studies (Hameeda et al., 2006; Patel et al., 2008), and a positive correlation between the soil TOC:TP ratio and the relative abundance of PSB was found by Mander et al. (2012). The sand content was positively correlated with the relative abundance of PSB (Table S2). The reason for this might be that across our sites, the sand content was correlated with low nutrient concentrations (TOC, TN, TP, DOC, DN) and those conditions favored the abundance of PSB. Further, PSB increased with soil pH (Table S2), in agreement with Mander et al. (2012), likely because the ability of PSB to release protons only results in P solubilization in alkaline to moderately acid soils, but much less in acid soils (Hinsinger, 2001). Furthermore, the relative abundance of PSB was negatively related to water-extractable P (easily-available P) in our model (Table S2). In lab studies, P solubilization was also suppressed by very high levels of easily-available P in the cultivation medium (Goldstein, 1986; Chabot et al., 1998).
Community Composition of P-solubilizing Bacteria
Our finding that the OTU Pseudomonas, Enterobacterales, Acinetobacter, Burkholderia, Paraburkholderia, Bacillus, and Paenibacillus were both present and highly abundant in most samples (Figure 3) corroborates previous studies reporting that these bacterial groups are able to solubilize P (Oliveira et al., 2009; Lepleux et al., 2013; Liu et al., 2015). Pseudomonas was one of the most abundant and most diverse OTU. They are known to efficiently contribute to P solubilization because many Pseudomonas species can oxidize glucose to gluconic acid in the periplasm and release it into soil (Goldstein, 2007).
In addition to the decreased relative abundance of PSB under N and NP addition, we found a significant change in PSB community composition due to N and NP addition as hypothesized (Figure 4). For the whole bacterial community, it was already shown that N addition shifted the community composition in grassland soils (Ramirez et al., 2010; Fierer et al., 2012; Leff et al., 2015). Against our hypothesis, P addition did not change the PSB community composition confirming studies showing that the bacterial community was less responsive to P addition than to N addition (Coolon et al., 2013; Pan et al., 2014). However, to our knowledge, there is no previous study describing shifts in the PSB community and general PSB community pattern under N and NP addition in grasslands.
The addition of N and NP lowered the number of Pseudomonas OTUs and increased the number of Enterobacterales OTUs. Our results indicate that certain Pseudomonas OTUs are hampered by N and NP addition and seem to be better adapted to nutrient-poorer conditions. This agrees with studies reporting that the abundance and diversity of Pseudomonads was higher on a nutrient-poor than on nutrient-rich medium (Aagot et al., 2001) and that most PSB were Pseudomonads in non-fertilized soils (Mander et al., 2012). A reason for the higher number of Enterobacterales than Pseudomonas OTUs under N and NP addition could be that they respond differently to changing amounts and composition of root exudates as can be expected by the reported strong changes in plant community composition in response to the nutrient additions (Rengel and Marschner, 2005; Badri and Vivanco, 2009; Harpole et al., 2017). This speculation is based on the observation that Enterobacterales and Pseudomonads prefer different substrates: Enterobacterales prefer amino acid glycine, while Pseudomonas prefer sugars (Goldfarb et al., 2011). We screened for PSB with a culture-dependent approach using PVK medium, which is commonly used to determine the abundance of PSB (Mehta and Nautiyal, 2001) but discriminates against non-cultivable microorganisms. Currently, there are no metagenomics approaches available for determining the abundance of PSB since many processes are involved in P solubilization, which makes it impossible to determine PSB by targeting one specific gene. However, the sequenced PSB reflect the dominant taxa found in the same grassland soils (Leff et al., 2015). Further, previous studies showed the PSB isolated based on culture-dependent screening techniques were representative for the total bacterial community as analyzed by pyrosequencing (Nicolitch et al., 2016). Besides bacteria, plants, and fungi also contribute to P solubilization by the release of protons, organic acids and other chelating agents (Hinsinger, 2001; Jones and Oburger, 2011). However, in this study we focused on the abundance of P-solubilizing bacteria, since between 1 and 50% of soil bacteria (Kucey et al., 1989) can be classified at PSB, whereas only 0.1–3% of soil fungi (Banik and Dey, 1982; Kucey, 1983) can be classified as P-solubilizing fungi. However, rates of P solubilization by bacteria and fungi on single species level can be similar (e.g., Vazquez et al., 2000).
Phosphatase Activity
Our result that phosphatase activity was significantly higher under N addition in the topsoil than in the control (Figure 5) indicates that microorganisms and plants invested into the production of phosphatases when provided with additional N, suggesting that increased N availability might increase P demand. This is in accordance with a meta-analysis showing that plants and microbes invest into P acquisition, if N availability increases (Marklein and Houlton, 2012). This might allow them to maintain their biomass stoichiometry despite changes in element availability in their environment (Spohn, 2016). In addition, increased N availability likely facilitates the production of phosphatases, since phosphatases contain large amounts of N that is lost for the organisms when phosphatases are released into the soil. Our finding is in accordance with our hypothesis and with previous studies, reporting an increase in phosphatase activity in response to N addition (Olander and Vitousek, 2000; Marklein and Houlton, 2012; Margalef et al., 2017).
Phosphatase activity was likely lower in the P than in the N addition treatment because plants and microbes reduce the production of phosphatases when provided with inorganic P (Oshima et al., 1996). Yet, contrary to our hypothesis, phosphatase activity was not significantly reduced in the P addition treatment compared to the control (Figure 5). Our results are counter to the findings of a meta-analysis (Marklein and Houlton, 2012) and further studies showing that inorganic P addition inhibits phosphatase activities in soil (Olander and Vitousek, 2000; Moscatelli et al., 2005). However, the absence of a suppressive effect of P addition on phosphatases has also been reported (Schneider et al., 2001; Allison and Vitousek, 2005; Criquet and Braud, 2008). An explanation for the less pronounced decrease in phosphatase activity due to P addition could be that microbial phosphatase activity is also controlled by microbial need for C, and thus rather depends on C than on P availability (Spohn and Kuzyakov, 2013; Heuck et al., 2015). Further, depending on the type of nutrient limitation of the plants, P and especially NP addition can increase aboveground net primary productivity (Elser et al., 2007), and thus increase organic matter inputs to soil making it more rewarding for microorganisms to mineralize organic P.
Conclusions
Taken together, our study indicates that N addition to soil strongly affects P mobilization processes in grassland soils. Our results suggest that microorganisms invest preferentially into mobilizing organic P in response to high N inputs to soil. In contrast, under N-poor conditions, the microbial community has a high capacity to mobilize P from inorganic sources as indicated by a high abundance of PSB. Consequently, increased atmospheric N deposition may decrease solubilization of bound inorganic P and increase mineralization of organic P. These findings have important implications for element cycling because they indicate that high chronic N inputs could induce a shift from P mobilization from minerals to increased recycling of organically bound P in grassland soils.
Data Availability Statement
The partial 16S rDNA sequences of the 903 colonies were deposited in GenBank (https://www.ncbi.nlm.nih.gov/genbank/) under the accession numbers MK488507-MK489408.
Author Contributions
MS conceived the idea. MW, P-MS, and MS designed methodology and planned the analyses. LB, EB, MC, KK, ES, and PW maintained the nutrient addition experiments. MW, P-MS, and MS collected the samples. MW, P-MS, AW, AG, and MS analyzed the data. MW and MS led the writing of the manuscript. All authors contributed to the study and gave final approval for publication.
Conflict of Interest
The authors declare that the research was conducted in the absence of any commercial or financial relationships that could be construed as a potential conflict of interest.
Acknowledgments
MS thanks the German Research Foundation for funding this study through the Emmy Noether-program (grant SP1389/6-1). Coordination and data management of the Nutrient Network have been supported by funding to EB and ES from the National Science Foundation Research Coordination Network (NSF-DEB-1042132) and Long Term Ecological Research (NSF-DEB-1234162 to Cedar Creek LTER) programs, and the Institute on the Environment (DG-0001-13). This publication was funded by the German Research Foundation (DFG) and the University of Bayreuth in the funding programme Open Access Publishing. We thank Anita Gössner, Uwe Hell, Renate Krauss, Ralf Mertel, and Karin Söllner for technical assistance and thank the chemical analytics (CAN) of the Bayreuth Center of Ecological and Environmental Research (BayCEER) for performing parts of the chemical analyses and the Keylab for Genomics and Bioinformatics of the BayCEER for sequencing the PSB and for the bacterial and fungal community analyses (ARISA).
Supplementary Material
The Supplementary Material for this article can be found online at: https://www.frontiersin.org/articles/10.3389/fenvs.2019.00185/full#supplementary-material
References
Aagot, N., Nybroe, O., Nielsen, P., and Johnsen, K. (2001). An altered Pseudomonas diversity is recovered from soil by using nutrient-poor Pseudomonas-selective soil extract media. Appl. Environ. Microbiol. 67, 5233–5239. doi: 10.1128/AEM.67.11.5233-5239.2001
Allison, S. D., and Vitousek, P. M. (2005). Responses of extracellular enzymes to simple and complex nutrient inputs. Soil Biol. Biochem. 37, 937–944. doi: 10.1016/j.soilbio.2004.09.014
Badri, D. V., and Vivanco, J. M. (2009). Regulation and function of root exudates. Plant Cell Environ. 32, 666–681. doi: 10.1111/j.1365-3040.2009.01926.x
Banik, S., and Dey, B. K. (1982). Available phosphate content of an alluvial soil as influenced by inoculation of some isolated phosphate-solubilizing micro-organisms. Plant Soil 69, 353–364.
Borer, E. T., Harpole, W. S., Adler, P. B., Lind, E. M., Orrock, J. L., Seabloom, E. W., et al. (2014). Finding generality in ecology: a model for globally distributed experiments. Methods Ecol. Evol. 5, 65–73. doi: 10.1111/2041-210X.12125
Bray, R. H., and Kurtz, L. T. (1945). Determination of total, organic, and available forms of phosphorus in soils. Soil Sci. 95, 39–46. doi: 10.1097/00010694-194501000-00006
Browne, P., Rice, O., Miller, S. H., Burke, J., Dowling, D. N., Morrissey, J. P., et al. (2009). Superior inorganic phosphate solubilization is linked to phylogeny within the Pseudomonas fluorescens complex. Appl. Soil Ecol. 43, 131–138. doi: 10.1016/j.apsoil.2009.06.010
Calvaruso, C. M., Turpault, P., Leclerc, E., and Frey-Klett, P. (2007). Impact of ectomycorrhizosphere on the functional diversity of soil bacterial and fungal communities from a forest stand in relation to nutrient mobilization processes. Microb. Ecol. 54, 567–577. doi: 10.1007/s00248-007-9260-z
Cardinale, M., Brusetti, L., Quatrini, P., Borin, S., Puglia, A. M., Rizzi, A., et al. (2004). Comparison of different primer sets for use in automated ribosomal intergenic spacer analysis of complex bacterial communities. Appl. Environ. Microbiol. 70, 6147–6156. doi: 10.1128/AEM.70.10.6147-6156.2004
Chabot, R., Beauchamp, C. J., Kloepper, J. W., and Antoun, H. (1998). Effect of phosphorus on root colonization and growth promotion of maize by bioluminescent mutants of phosphate-solubilizing Rhizobium leguminosarum biovar phaseoli. Soil Biol. Biochem. 30, 1615–1618. doi: 10.1016/S0038-0717(98)00054-6
Chelius, M. K., and Triplett, E. W. (2001). The diversity of archaea and bacteria in association with the roots of Zea mays L. Microb. Ecol. 41, 252–263. doi: 10.1007/s002480000087
Coolon, J. D., Jones, K. L., Todd, T. C., Blair, J. M., and Herman, M. A. (2013). Long-term nitrogen amendment alters the diversity and assemblage of soil bacterial communities in tallgrass prairie. PLoS ONE 8:e67884. doi: 10.1371/journal.pone.0067884
Criquet, S., and Braud, A. (2008). Effects of organic and mineral amendments on available P and phosphatase activities in a degraded Mediterranean soil under short-term incubation experiment. Soil Tillage Res. 98, 164–174. doi: 10.1016/j.still.2007.11.001
Dobritsa, A. P., and Samadpour, M. (2016). Transfer of eleven species of the genus Burkholderia to the genus Paraburkholderia and proposal of Caballeronia gen. nov. to accommodate twelve species of the genera Burkholderia and Paraburkholderia. Int. J Syst. Evolut. Microbiol. 66, 2836–2846. doi: 10.1099/ijsem.0.001065
Elser, J. J., Bracken, M. E. S., Cleland, E. E., Gruner, D. S., Harpole, W. S., Hillebrand, H., et al. (2007). Global analysis of nitrogen and phosphorus limitation of primary producers in freshwater, marine and terrestrial ecosystems. Ecol. Lett. 10, 1135–1142. doi: 10.1111/j.1461-0248.2007.01113.x
Fierer, N., Lauber, C. L., Ramirez, K. S., Zaneveld, J., Bradford, M. A., and Knight, R. (2012). Comparative metagenomic, phylogenetic and physiological analyses of soil microbial communities across nitrogen gradients. ISME J. 6, 1007–1017. doi: 10.1038/ismej.2011.159
Fisher, M. M., and Triplett, E. W. (1999). Automated approach for ribosomal intergenic spacer analysis of microbial diversity and its application to freshwater bacterial communities. Appl. Environ. Microbiol. 65, 4630–4636.
Gelman, A.Y, Su, S., Yajima, M., Hill, J., Pittau, M. G., and Dorie, V. (2018). arm: data analysis using regression and multilevel/hierarchical models. R Package Version 1.10–11.
German, D. P., Weintraub, M. N., Grandy, A. S., Lauber, C. L., Rinkes, Z. L., and Allison, S. D. (2011). Optimization of hydrolytic and oxidative enzyme methods for ecosystem studies. Soil Biol. Biochem. 43, 1387–1397. doi: 10.1016/j.soilbio.2011.03.017
Goldfarb, K. C., Karaoz, U., Hanson, C. A., Santee, C. A., Bradford, M. A., Treseder, K. K., et al. (2011). Differential growth responses of soil bacterial taxa to carbon substrates of varying chemical recalcitrance. Front. Microbiol. 2:94. doi: 10.3389/fmicb.2011.00094
Goldstein, A. H. (1986). Bacterial solubilization of mineral phosphates: Historical perspective and future prospects. Am. J. Alternat. Agricul. 1, 51–57. doi: 10.1017/S0889189300000886
Goldstein, A. H. (2007). “Future trends in research on microbial phosphate solubilization: one hundred years of insolubility,” in First International Meeting on Microbial Phosphate Solubilization. Developments in Plant and Soil Sciences, eds E. Velázquez and C. Rodríguez-Barrueco (Dordrecht: Springer). doi: 10.1007/978-1-4020-5765-6_11
Grueber, C. E., Nakagawa, S., Laws, R. J., and Jamieson, I. G. (2011). Multimodel inference in ecology and evolution: challenges and solutions. J. Evol. Biol. 24, 699–711. doi: 10.1111/j.1420-9101.2010.02210.x
Hameeda, B. Y., Harish Kumar Reddy, R. O. P., Kumar, G. N., and Reddy, G. (2006). Effect of carbon substrates on rock phosphate solubilization by bacteria from composts and macrofauna. Curr. Microbiol. 53, 298–302. doi: 10.1007/s00284-006-0004-y
Harpole, W. S., Sullivan, L. L., Lind, E. M., Firn, J., Adler, P. B., Borer, E. T., et al. (2017). Out of the shadows: multiple nutrient limitations drive relationships among biomass, light and plant diversity. Funct. Ecol. 31, 1839–1846. doi: 10.1111/1365-2435.12967
He, Z., Zhang, H., Gao, S., Lercher, M. J., Chen, W. H., and Hu, S. (2016). Evolview v2: an online visualization and management tool for customized and annotated phylogenetic trees. Nucleic Acids Res. 44, W236–W241. doi: 10.1093/nar/gkw370
Hedley, M. J., Stewart, J. W. B., and Chauhan, B. S. (1982). Changes in inorganic and organic soil phosphorus fractions by cultivation practices and by laboratory incubations. Soil Sci. Soc. Am. J. 46, 970–976. doi: 10.2136/sssaj1982.03615995004600050017x
Herold, N., Schöning, I., Berner, D., Haslwimmer, H., Kandeler, E., Michalzik, B., et al. (2014). Vertical gradients of potential enzyme activities in soil profiles of European beech, Norway spruce and Scots pine dominated forest sites. Pedobiologia 57, 181–189. doi: 10.1016/j.pedobi.2014.03.003
Heuck, C., Smolka, G., Whalen, E. D., Frey, S., Gundersen, P., Moldan, F., et al. (2018). Effects of long-term nitrogen addition on phosphorus cycling in organic soil horizons of temperate forests. Biogeochemistry 39:378. doi: 10.1007/s10533-018-0511-5
Heuck, C., Weig, A., and Spohn, M. (2015). Soil microbial biomass C:N:P stoichiometry and microbial use of organic phosphorus. Soil Biol. Biochem. 85, 119–129. doi: 10.1016/j.soilbio.2015.02.029
Hinsinger, P. (2001). Bioavailability of soil inorganic P in the rhizosphere as affected by root-induced chemical changes: a review. Plant Soil 237, 173–195. doi: 10.1023/A:1013351617532
Jenkinson, D. S., Brookes, P. C., and Powlson, D. S. (2004). Measuring soil microbial biomass. Soil Biol. Biochem. 36, 5–7. doi: 10.1016/j.soilbio.2003.10.002
Jones, D. L., and Oburger, E. (2011). “Solubilization of phosphorus by soil microorganisms,” in Phosphorus in Action. Biological Processes in Soil Phosphorus Cycling, eds E. K. Bünemann, A. Oberson, and E. Frossard (Berlin; Heidelberg: Springer), 169–198. doi: 10.1007/978-3-642-15271-9_7
Katoh, K., and Standley, D. M. (2013). MAFFT multiple sequence alignment software version 7: improvements in performance and usability. Mol Biol Evol. 30, 772–780. doi: 10.1093/molbev/mst010
Kucey, R. M. N. (1983). Phosphate-solubilizing bacteria and fungi in various cultivated and virgin alberta soils. Can. J. Soil Sci. 63, 671–678. doi: 10.4141/cjss83-068
Kucey, R. M. N., Janzen, H. H., and Leggett, M. E. (1989). Microbially mediated increases in plant-available phosphorus. Adv. Agronomy 42, 199–228 doi: 10.1016/S0065-2113(08)60525-8
Leff, J. W., Jones, S. E., Prober, S. M., Barberán, A., Borer, E. T., Firn, J. L., et al. (2015). Consistent responses of soil microbial communities to elevated nutrient inputs in grasslands across the globe. Proc. Natl. Acad. Sci. U.S.A. 112, 10967–10972. doi: 10.1073/pnas.1508382112
Lepleux, C., Uroz, S., Collignon, C. J., Churin, L. M., Turpault, P., and Frey-Klett, P. (2013). A short-term mineral amendment impacts the mineral weathering bacterial communities in an acidic forest soil. Res. Microbiol. 164, 729–739. doi: 10.1016/j.resmic.2013.03.022
Liu, Z., Li, Y. C., Zhang, S., Fu, Y., Fan, X., Patel, J. S., et al. (2015). Characterization of phosphate-solubilizing bacteria isolated from calcareous soils. Appl. Soil Ecol. 96, 217–224. doi: 10.1016/j.apsoil.2015.08.003
Mander, C., Wakelin, S., Young, S., Condron, L., and O'Callaghan, M. (2012). Incidence and diversity of phosphate-solubilising bacteria are linked to phosphorus status in grassland soils. Soil Biol. Biochem. 44, 93–101. doi: 10.1016/j.soilbio.2011.09.009
Margalef, O., Sardans, J., Fernández-Martínez, M., Molowny-Horas, R., Janssens, I. A., Ciais, P., et al. (2017). Global patterns of phosphatase activity in natural soils. Sci. Rep. 7:1337. doi: 10.1038/s41598-017-01418-8
Marklein, A. R., and Houlton, B. Z. (2012). Nitrogen inputs accelerate phosphorus cycling rates across a wide variety of terrestrial ecosystems. N. Phytol. 193, 696–704. doi: 10.1111/j.1469-8137.2011.03967.x
Mehta, S., and Nautiyal, C. S. (2001). An efficient method for qualitative screening of phosphate-solubilizing bacteria. Curr. Microbiol. 43, 51–56. doi: 10.1007/s002840010259
Moscatelli, M. C., Lagomarsino, A., Angelis, P. D., and Grego, S. (2005). Seasonality of soil biological properties in a poplar plantation growing under elevated atmospheric CO2. Appl. Soil Ecol. 30, 162–173. doi: 10.1016/j.apsoil.2005.02.008
Murphy, J., and Riley, J. P. (1962). A modified single solution method for the determination of phosphate in natural waters. Anal. Chim. Acta 27, 31–36. doi: 10.1016/S0003-2670(00)88444-5
Nakagawa, S., and Schielzeth, H. (2013). A general and simple method for obtaining R2 from generalized linear mixed-effects models. Methods Ecol. Evol. 4, 133–142. doi: 10.1111/j.2041-210x.2012.00261.x
Nicolitch, O., Colin, Y. M., Turpault, P., and Uroz, S. (2016). Soil type determines the distribution of nutrient mobilizing bacterial communities in the rhizosphere of beech trees. Soil Biol. Biochem. 103, 429–445. doi: 10.1016/j.soilbio.2016.09.018
Olander, L. P., and Vitousek, P. M. (2000). Regulation of soil phosphatase and chitinase activity by N and P availability. Biogeochemistry 49, 175–190. doi: 10.1023/A:1006316117817
Oliveira, C. A., Alves, M. C., Marriel, I. E., Gomes, E. A., Scotti, M. R., and Sá, M. H. (2009). Phosphate solubilizing microorganisms isolated from rhizosphere of maize cultivated in an oxisol of the Brazilian Cerrado Biome. Soil Biol. Biochem. 41, 1782–1787. doi: 10.1016/j.soilbio.2008.01.012
Oshima, Y., Ogawa, N., and Harashima, S. (1996). Regulation of phosphatase synthesis in Saccharomyces cerevisiae- a review. Gene 179, 171–177. doi: 10.1016/S0378-1119(96)00425-8
Pan, Y., Cassman, N., de Hollander, M., Mendes, L. W., Korevaar, H., Geerts, R. H. E. M., et al. (2014). Impact of long-term N, P, K, and NPK fertilization on the composition and potential functions of the bacterial community in grassland soil. FEMS Microbiol. Ecol. 90, 195–205. doi: 10.1111/1574-6941.12384
Patel, D. K., Archana, G., and Kumar, G. N. (2008). Variation in the nature of organic acid secretion and mineral phosphate solubilization by Citrobacter sp. DHRSS in the presence of different sugars. Curr. Microbiol. 56, 168–174. doi: 10.1007/s00284-007-9053-0
Peñuelas, J., Poulter, B., Sardans, J., Ciais, P. M., van der Velde Bopp, L., et al. (2013). Human-induced nitrogen-phosphorus imbalances alter natural and managed ecosystems across the globe. Nat. Commun. 4:2934. doi: 10.1038/ncomms3934
Peršoh, D., Melcher, M., Flessa, F., and Rambold, G. (2010). First fungal community analyses of endophytic ascomycetes associated with Viscum album ssp. austriacum and its host Pinus sylvestris. Fungal Biol. 114, 585–596. doi: 10.1016/j.funbio.2010.04.009
Pikovskaya, R. I. (1948). Mobilization of phosphorus in soil in connection with the vital activity of some microbial species. Mikrobiologiya 17, 362–370.
Pinheiro, J., Bates, D., DebRoy, S., and Sarkar, D. R Core Team (2018). nlme: Linear and Nonlinear Mixed Effects Models. R Package Version, 3.1–137.
R Core Team (2018). R: A Language and Environment for Statistical Computing. Vienna: R Foundation for Statistical Computing. Available online at: URL http://www.R-project.org/
Ramirez, K. S., Lauber, C. L., Knight, R., Bradford, M. A., and Fierer, N. (2010). Consistent effects of nitrogen fertilization on soil bacterial communities in contrasting systems. Ecology 91, 3463–3470. doi: 10.1890/10-0426.1
Reid, R. K., Reid, C. P. P., and Szaniszlo, P. J. (1985). Effects of synthetic and microbially produced chelates on the diffusion of iron and phosphorus to a simulated root in soil. Biol. Fertility Soils 1, 45–52. doi: 10.1007/BF00710970
Rengel, Z., and Marschner, P. (2005). Nutrient availability and management in the rhizosphere: exploiting genotypic differences. N. Phytol. 168, 305–312. doi: 10.1111/j.1469-8137.2005.01558.x
Rodriguez, H., and Fraga, R. (1999). Phosphate solubilizing bacteria and their role in plant growth promotion. Biotechnol. Adv. 17, 319–339. doi: 10.1016/S0734-9750(99)00014-2
Saunders, W. M. H., and Williams, E. G. (1955). Observations on the determination of total organic phosphorus in soils. J. Soil Sci. 6, 254–267. doi: 10.1111/j.1365-2389.1955.tb00849.x
Schlesinger, W. H. (2009). On the fate of anthropogenic nitrogen. Proc. Natl. Acad. Sci. U.S.A. 106, 203–208. doi: 10.1073/pnas.0810193105
Schleuss, P.-M., Widdig, M., Heintz-Buschart, A., Guhr, A., Martin, S., Kirkman, K., et al. (2019). Stoichiometric controls of soil carbon and nitrogen cycling after long-term nitrogen and phosphorus addition in a mesic grassland in South Africa. Soil Biol. Biochem. 135, 294–303. doi: 10.1016/j.soilbio.2019.05.018
Schneider, K. M., Turrion, B., Grierson, P., and Gallardo, J. (2001). Phosphatase activity, microbial phosphorus, and fine root growth in forest soils in the Sierra de Gata, western central Spain. Biol. Fertility Soils 34, 151–155. doi: 10.1007/s003740100387
Sinsabaugh, R. L., Lauber, C. L., Weintraub, M. N., Ahmed, B., Allison, S. D., Crenshaw, C., et al. (2008). Stoichiometry of soil enzyme activity at global scale. Ecol. Lett. 11, 1252–1264. doi: 10.1111/j.1461-0248.2008.01245.x
Spohn, M. (2016). Element cycling as driven by stoichiometric homeostasis of soil microorganisms. Basic Appl. Ecol. 17, 471–478. doi: 10.1016/j.baae.2016.05.003
Spohn, M., and Kuzyakov, Y. (2013). Phosphorus mineralization can be driven by microbial need for carbon. Soil Biol. Biochem. 61, 69–75. doi: 10.1016/j.soilbio.2013.02.013
Tiessen, H., and Moir, J. O. (2007). “Characterization of available P by sequential extraction,” in Soil Sampling and Methods of Analysis, eds M. R. Carter and E. G. Gregorich (Boca Raton, FL: Taylor & Francis Group), 293–306.
Vance, E. D., Brookes, P. C., and Jenkinson, D. S. (1987). An extraction method for measuring soil microbial biomass C. Soil Biol. Biochem. 19, 703–707. doi: 10.1016/0038-0717(87)90052-6
Vazquez, P., Holguin, G., Puente, M. E., Lopez-Cortes, A., and Bashan, Y. (2000). Phosphate-solubilizing microorganisms associated with the rhizosphere of mangroves in a semiarid coastal lagoon. Biol. Fertility Soils 30, 460–468. doi: 10.1007/s003740050024
Walker, J. J., and Pace, N. R. (2007). Phylogenetic composition of Rocky Mountain endolithic microbial ecosystems. Appl. Environ. Microbiol. 73, 3497–3504. doi: 10.1128/AEM.02656-06
Walker, T. W., and Adams, A. F. R. (1958). Studies on soil organic matter: I. Influence of phosphorus content of parent materials on accumulations of carbon, nitrogen, sulfur, and organic phosphorus in grassland soils. Soil Sci. 85, 307–318. doi: 10.1097/00010694-195806000-00004
Walpola, B. C., and Yoon, M. H. (2012). Prospectus of phosphate solubilizing microorganisms and phosphorus availability in agricultural soils: a review. Afr. J. Microbiol. Res. 6, 6600–6605. doi: 10.5897/AJMR12.889
Weig, A. R., Peršoh, D., Werner, S., Betzlbacher, A., and Rambold, G. (2013). Diagnostic assessment of mycodiversity in environmental samples by fungal ITS1 rDNA length polymorphism. Mycol. Progr. 12, 719–725. doi: 10.1007/s11557-012-0883-1
White, T. J., Bruns, T., Lee, S., and Taylor, J. (1990). “Amplification and direct sequencing of fungal ribosomal RNA genes for phylogenetics,” in PCR Protocols: A Guide to Methods and Applications, eds M. A. Innis, D. H. Gelfand, J. J. Sninsky, and T. J. White (San Diego, CA: Academic Press), 315–322.
Keywords: enzyme activity, nitrogen fertilization, Nutrient Network (NutNet), phosphate solubilization, phosphorus cycling, phosphorus mineralization, phosphorus mobilization
Citation: Widdig M, Schleuss P-M, Weig AR, Guhr A, Biederman LA, Borer ET, Crawley MJ, Kirkman KP, Seabloom EW, Wragg PD and Spohn M (2019) Nitrogen and Phosphorus Additions Alter the Abundance of Phosphorus-Solubilizing Bacteria and Phosphatase Activity in Grassland Soils. Front. Environ. Sci. 7:185. doi: 10.3389/fenvs.2019.00185
Received: 02 August 2019; Accepted: 05 November 2019;
Published: 26 November 2019.
Edited by:
Hannes Schmidt, University of Vienna, AustriaReviewed by:
Birgit Wild, Stockholm University, SwedenLucia Fuchslueger, University of Antwerp, Belgium
Copyright © 2019 Widdig, Schleuss, Weig, Guhr, Biederman, Borer, Crawley, Kirkman, Seabloom, Wragg and Spohn. This is an open-access article distributed under the terms of the Creative Commons Attribution License (CC BY). The use, distribution or reproduction in other forums is permitted, provided the original author(s) and the copyright owner(s) are credited and that the original publication in this journal is cited, in accordance with accepted academic practice. No use, distribution or reproduction is permitted which does not comply with these terms.
*Correspondence: Marie Spohn, marie.spohn@uni-bayreuth.de