 Varun Tiwari1
 Mir A. Matin1*
 Faisal M. Qamer1
 Walter Lee Ellenburg2
 Birendra Bajracharya1
 Krishna Vadrevu3
 Begum Rabeya Rushi4
 Waheedullah Yusafi1
- 1International Centre for Integrated Mountain Development, Kathmandu, Nepal
- 2Earth System Science Center, University of Alabama, Huntsville, AL, United States
- 3NASA Marshall Space Flight Center, Hunstville, AL, United States
- 4ENSCO, Inc., Falls Church, VA, United States
Wheat is cultivated on more than 2.7 million hectares in Afghanistan annually, yet the country is dependent on imports to meet domestic demand. The timely estimation of domestic wheat production is highly critical to address any potential food security issues and has been identified as a priority by the Ministry of Agriculture Irrigation and Livestock (MAIL). In this study, we developed a system for in-season mapping of wheat crop area based on both optical (Sentinel-2) and synthetic aperture radar (SAR, Sentinel-1) data to support estimation of wheat cultivated area for management and food security planning. Utilizing a 2010 Food and Agriculture Organization (FAO) cropland mask, wheat sown area for 2017 was mapped integrating decision trees and machine learning algorithms in the Google Earth Engine cloud platform. Information from provincial crop calendars in addition to training and validation data from field-based surveys, and high-resolution Digitalglobe and Airbus Pleiades images were used for classification and validation. The total irrigated and rainfed wheat area were estimated as 912,525 and 562,611 ha, respectively for 2017. Province-wise accuracy assessments show the maximum accuracy of irrigated (IR) and rainfed (RF) wheat across provinces was 98.76 and 99%, respectively, whereas the minimum accuracy was found to be 48% (IR) and 73% (RF). The lower accuracy is attributed to the unavailability of reference data, cloud cover in the satellite images and overlap of spectral reflectance of wheat with other crops, especially in the opium poppy growing provinces. While the method is designed to provide estimation at different stages of the growing season, the best accuracy is achieved at the end of harvest using time-series satellite data for the whole season. The approach followed in the study can be used to generate wheat area maps for other years to aid in food security planning and policy decisions.
Introduction
The agricultural sector in Afghanistan supports the livelihoods of nearly three-quarters of the total population and contributes nearly 28% to the Gross Domestic Product (GDP) (Muradi and Boz, 2018). Thus, agricultural growth is vital for driving the country's economy and for ensuring national food security (World Bank, 2014). Wheat is the most important crop in Afghanistan, followed by rice, barley, and cotton. Most cereal crops are utilized for self-consumption. Wheat is prominent in all of the major farming systems prevailing in the country and cultivated in every province. It dominates the total cultivated cereal area estimated as 2.7 to 3 million hectares. Despite being the dominant cereal crop in Afghanistan, the production of wheat fails to fulfill the internal demand. About 1 million tons (equivalent to 25% of internal demand) of wheat are imported annually to meet internal requirements (Martínez and Gilabert, 2009). This makes Afghanistan one of the leading importers of wheat in the world. Afghanistan imports wheat mainly from Turkmenistan and Pakistan, two of its neighboring countries. Timely and effective management and estimation of wheat production in Afghanistan are therefore of high importance for overall food security. It can help in managing local food demand and provide stability for social security (Tilman et al., 2011). It can also support decision-makers in national-level planning for formulation and implementation of policies related to food procurement, pricing, import-export, transportation and storage, advance planning, etc. (United Nations, 2013; Pham et al., 2017).
Limited work has been done in the past for wheat area estimation by utilizing a conventional ground-based sampling approach which only provides a qualitative assessment. In 2016, the Food and Agriculture Organization (FAO) carried out rice mapping using sentinel data in a few provinces of Afghanistan (Latham, 2017; Haworth et al., 2018). Similarly, the United Nations Office of Drugs and Crime (UNODC), a pro-active organization working in opium poppy monitoring using high-resolution satellite images, conduct annual assessments of opium poppy sown areas (Simms and Waine, 2016; Avetisyan, 2017). Concerning wheat sown area mapping, some qualitative assessments have been done in the past by the USDA (United States Department of Agriculture) using NDVI (Normalized Difference Vegetation Index) anomalies (Shahriar et al., 2014; Baker, 2015). Currently, the Ministry of Agriculture Irrigation and Livestock (MAIL), Afghanistan is undertaking yearly qualitative assessments of wheat sown area using ground sample data (crop cut survey) and some conventional remote sensing based techniques, i.e., mainly based on visual interpretation of satellite images (UN FAO, 2016). Recently, donor agencies like the United States Agency for International Development (USAID) have shown interest in food security management in Afghanistan. They have started projects, such as the Grain Research and Innovation (GRAIN) and the Kandahar Food Zone (KFZ), funded by USAID, started working in crop area mapping and health monitoring to support livelihoods in Afghanistan (USAID, 2017). Currently, no operational system exists in Afghanistan to provide a rapid assessment of wheat sown area which is essential to support the food security management.
Developing an operational system for wheat sown area assessment for Afghanistan is challenging despite the availability of several methods based on remote sensing. The major challenges include security concerns for collecting the reference data from the ground, small field sizes, cloudy optical imagery, low internet bandwidth for satellite data downloads, and limited computing infrastructure for data processing and analysis. Despite these challenges, through collaborative efforts with MAIL and other organizations in Afghanistan, we present a detailed study that develops a map of wheat sown areas utilizing advanced satellite remote sensing techniques which can be used to address food security planning and management in the country.
Crop type mapping using optical and SAR remote sensing techniques have been attempted by several researchers globally (Inglada et al., 2015). Optical remote sensing approaches use spectral-temporal profiles to identify seasonal thresholds of phenological characteristics to separate different crop types (Foerster et al., 2012). The acquisition time of the image is critical to identify seasonal thresholds and distinguish different crop types. Although spectral-temporal profiles based on seasonal thresholds require less ground sample points and provide good accuracy, they fail to classify crops having similar phenology. Specific to classification algorithms, machine learning classifiers, such as Random Forest (RF), Support Vector Machine (SVM), Artificial Neural Network (ANN), etc. require systematic sampling approaches and a large number of accurate ground data for training the classification model (Camps-Valls et al., 2003; Murmu and Biswas, 2015; Tatsumi et al., 2015). Poor field level data can result in underfitting or over-fitting of the classification model and result in overestimation or underestimation of the classification results (Liakos et al., 2018). Although optical data have shown potential in the identification of crop types, the data is not reliable under cloudy conditions. Alternatively, Synthetic Aperture Radar (SAR) is an emerging technique in crop mapping (Oguro et al., 2001). SAR utilizes the temporal backscatter (physical) response of a crop and, along with machine learning techniques, can be effectively used for crop mapping and monitoring (Sonobe et al., 2014; Tamiminia et al., 2015; Gao et al., 2018). Recent studies utilize coarse to fine resolution satellite imagery for crop type mapping (Wardlow and Egbert, 2010). Some of the well-known approaches for crop type mapping using different sensors and resolutions are listed in Table 1.
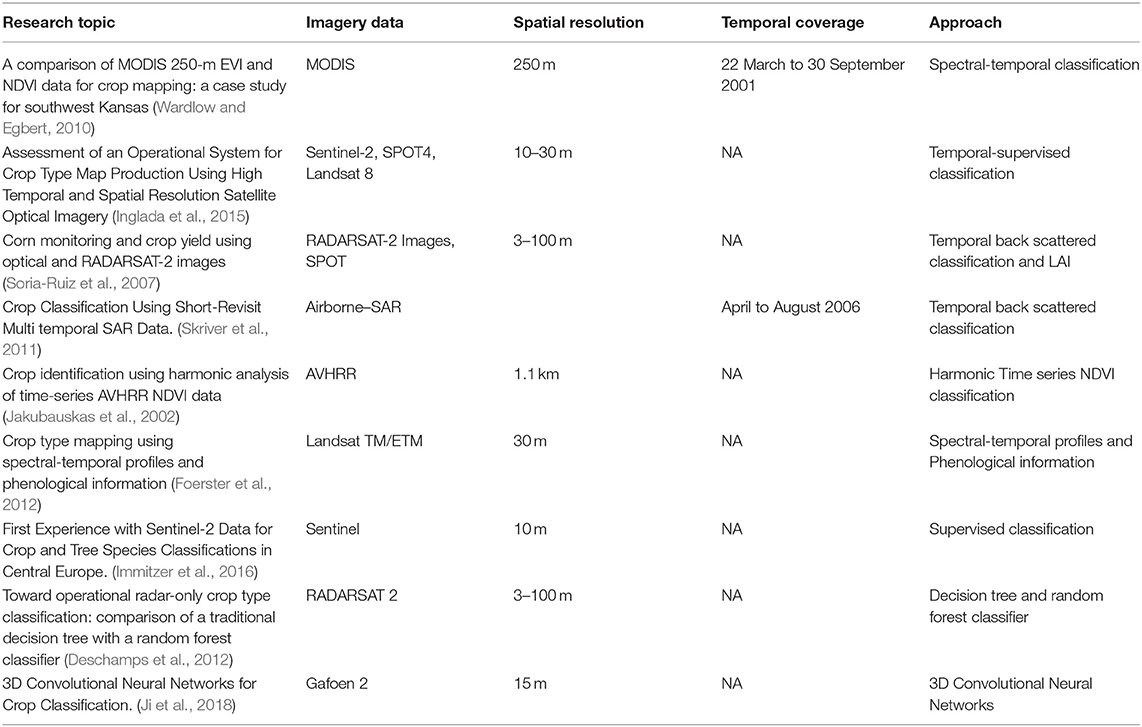
Table 1. Crop mapping approaches.
In this study, we developed a system for in-season wheat sown area mapping by harnessing the power of multisensory remote sensing imagery (optical and SAR) and cloud computing (GEE) techniques (Dong et al., 2016; Gorelick et al., 2017). The system is designed keeping in mind the challenges in Afghanistan and provides the capacity for operationalization. The system can provide independent and evidence-based information on the status of annual crops at the province level. Ingesting field data at regular intervals for different seasons in the system will lead to higher accuracy in crop area estimates at the province level.
Methods and Materials
Study Area
The study area (Figure 1) covers the whole of Afghanistan (34° 32′ and 38° 1′ 32.16″ N latitude and 69° 9′ and 38° 20′ 49.92″ E. longitude). The Hindu Kush mountain range divides the country into three very different geographic regions: (a) The central highlands, characterized by dry hot summers and very cold winters; (b) the southern plateau consist of sandy deserts with arable lands along the rivers; (c) the northern plains, which are highly fertile and include most of the land under agriculture. The total area of the country is 652,230 sq km with a population of 34.9 million. Agricultural lands represent 58% of the country with most designated as permanent pasture (48%), leaving only 11.8% as arable land (CIA, 2019). Total arable land is 6.5 million hectares of which 3.1 million ha is irrigated and 3.4 million ha is rainfed (FAO, 2010). Wheat, rice, barley, and maize are the main cereal crops grown in the country, with wheat accounting for 80.2% of total cereal production. Thus, wheat is the most important crop for the food security of the country (Ahmad, 2018). However, other than cereals, fruits, vegetables, and opium poppy are also important crops. The average area under different crops are: wheat−2.2 million hectares; rice−0.13 million hectares; barley−0.19 million hectares; maize−0.145 million hectares; pulses−0.102 million hectares; fruits−0.295 million hectares; vegetables−0.104 million hectares; (Rashid, 1997); opium poppy−0.216 million hectares (Avetisyan, 2017).
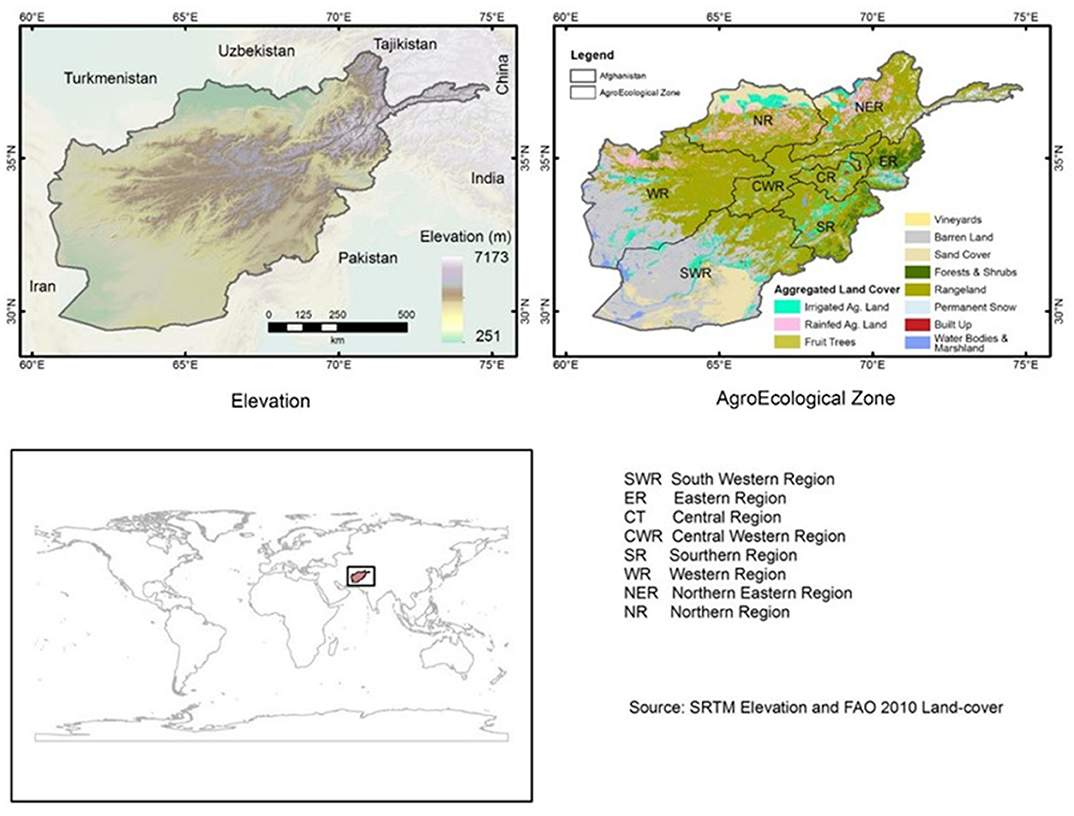
Figure 1. Study area.
Dataset Used
Satellite and Other Data
This study used Sentinel 1 SAR and Sentinel 2 multispectral optical satellite images as the main data sources (Table 2). For the wheat area classification, bands B4 (Red), B8 (NIR), and B11 (SWIR) from the S2 were used; whereas the VV (Vertically transmit Vertically receive) Polarization band was utilized from the Sentinel 1 data. High-resolution images from Digitalglobe and Airbus Company (Pleiades) were also used for collecting reference data for training and validation.
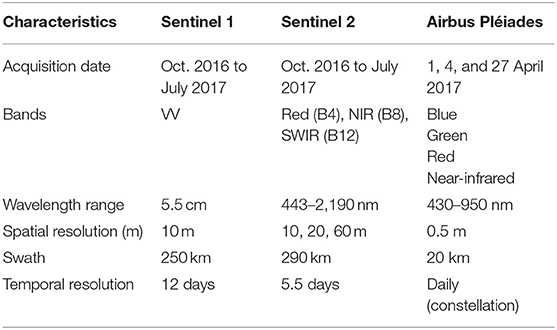
Table 2. Satellite data specification.
Apart from satellite datasets, agriculture mask (irrigated and rainfed) from the Afghanistan 2010 land cover (FAO, 2010) was used to aid in crop mapping. The land cover maps (Figure 1) have eleven land cover classes viz. irrigated agricultural land, rainfed agricultural land, fruit trees, vineyards, barren land, sand cover, forests and shrubs, rangeland, permanent snow, built up, and water bodies and marshland (FAO, 2010).
Reference Data
Reference data were collected from various sources for training and validation of the classification model. The field survey was conducted by professionals from MAIL to collect samples from the crop field. A random sampling approach was utilized for the collection of the field data/sample points. During the collection of samples, the location of the crop field together with field multi-direction photographs for different crops were collected. The second set of reference data were collected by MAIL during a crop cutting survey that covered 17 provinces. Most of the reference data collected through field and crop cut survey were mainly from wheat fields. Very few samples were collected from non-wheat crops, such as vegetable farms, orchards, and vineyards. Samples for other crops were generated through visual interpretation by relevant experts and using earlier land cover maps and time-series images.
The reference data obtained through field and crop cutting survey covered only 25 out of 34 provinces. For the remaining 10 provinces, samples were generated from high-resolution images through visual interpretation and analysis of NDVI time-series for the current and previous years. Google Earth images and Digital Globe high-resolution images acquired during October 2016–June 2017 were used for the interpretation. Overall 16,383 reference? points from wheat (4,797) and non-wheat (11,586) class were collected. Out of which 70%, i.e., 11,468 samples were used for training and 30%, i.e., 4,915 samples were utilized for validation (discussed in the validation section).
For Helmand province, a set of reference data were received from the United Nations Office of Drug Control (UNODC) for opium poppy fields. Additional reference data were collected through visual interpretation of Airbus Pleiades images. The distribution of reference data and sources are shown in Figure 2.
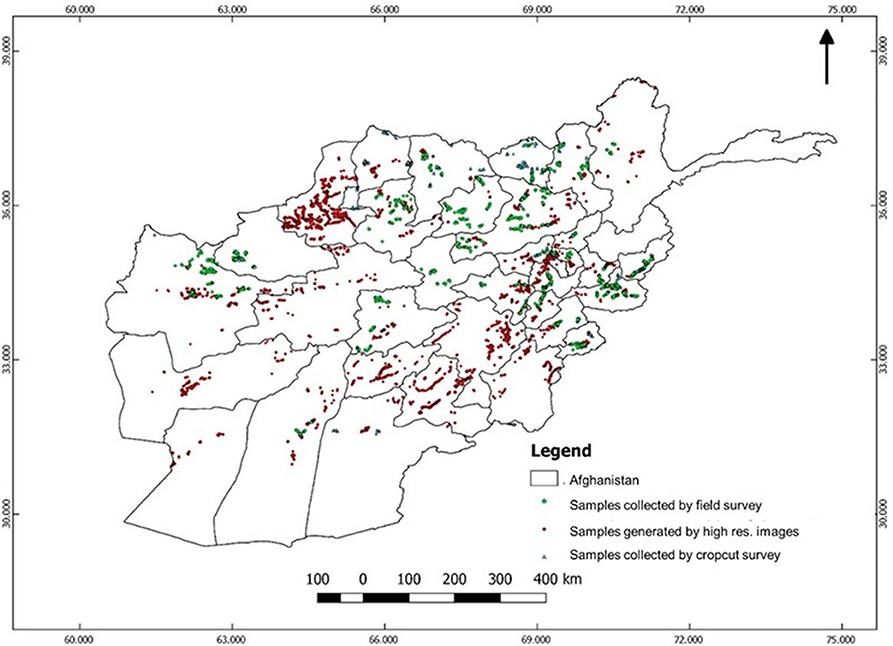
Figure 2. Distribution of reference data.
Crop Phenology and Crop Calendar
The goal of the classification algorithm was to distinguish the phenology of wheat from other crop types and land cover. Land surface phenology (LSP) refers to the timing of different life-cycle stages of plants (Martínez and Gilabert, 2009). The study of LSP is important to understand vegetation-growth pattern changes (Myneni et al., 1997; Fisher and Mustard, 2007). Satellite-based analysis of LSP addresses the development patterns in photosynthetic biomass by way of derived vegetation indices (Ahl et al., 2006), such as the normalized difference vegetation index (NDVI), the enhanced vegetation index (EVI), and a two-band enhanced vegetation index (White et al., 1997; Zhang et al., 2003, 2014; Piao et al., 2006). Phenology is measured commonly by (i) onset of greening, (ii) onset of senescence, (iii) peak development during the growing period, and (iv) the length of the growing season (Hudson and Keatley, 2010). Various methods have been used for the assessment of phenology including threshold, derivative, smoothing, and model-based methods (Hudson and Keatley, 2010). Among these, the threshold-based method is the simplest and is used by many researchers. In the threshold-based method, the values of VI are plotted against time of year and single values are chosen to define different stages of phenology (Karlsen et al., 2006) though the method for specifying the threshold varies. Some authors use single arbitrary thresholds, e.g., 0.17 (Fischer, 1994), 0.09 (Markon et al., 1995), and 0.099 (Lloyd, 1990), whereas some authors use threshold specifiers like the long-term average (Karlsen et al., 2006) or % peak amplitude of VI (Jonsson and Eklundh, 2002). In this study we have used NDVI for training samples to determine the thresholds (see section Wheat Area Mapping Using Optical Images).
Afghanistan has diverse topographic and climatic conditions resulting in wide variability in growing seasons across the entire landscape. Knowledge of the growing season is important for the acquisition of satellite data. The crop calendar is a tool that provides information on the sowing, growing and harvesting stages of crops (in our case, wheat). The crop calendar information can also be used for crop type mapping using the satellite data. Broad crop calendars at a province-level were provided by MAIL; these were compiled in 2012. Because of the variability in climate/weather and other factors, there can be a shift in the timing of sowing and harvest of wheat over the years. The calendars (Figure 3) were utilized as a starting point to characterize the timing of phenological stages of wheat.
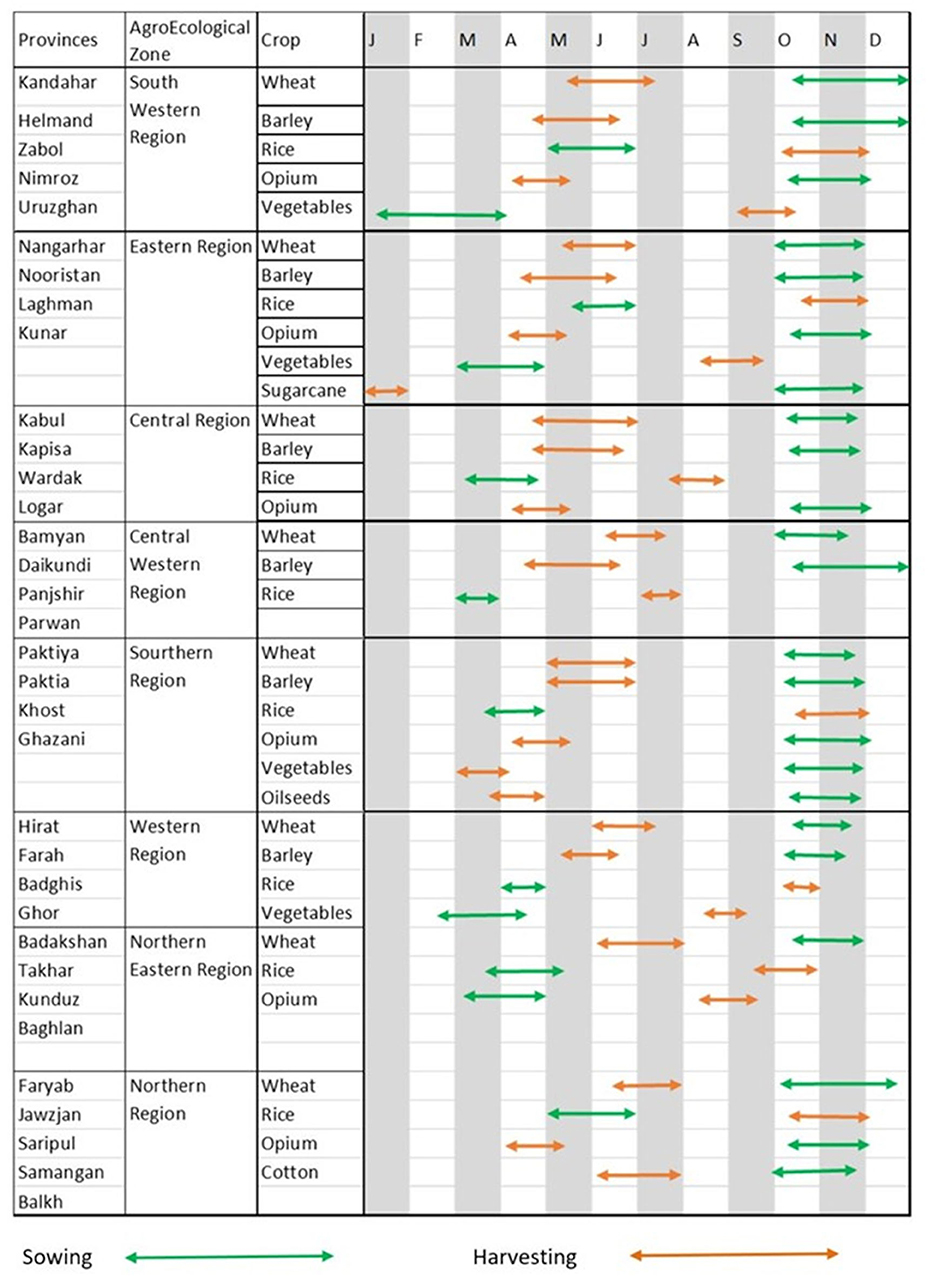
Figure 3. Cropping Calendar by Agro-Ecological Zones for major crops.
Study Methodology
In this study, optical and SAR data were utilized in two steps in the process of mapping wheat areas. The flowchart of the detailed methodology is shown in Figure 4. The description of the methodology is given in the following sections.
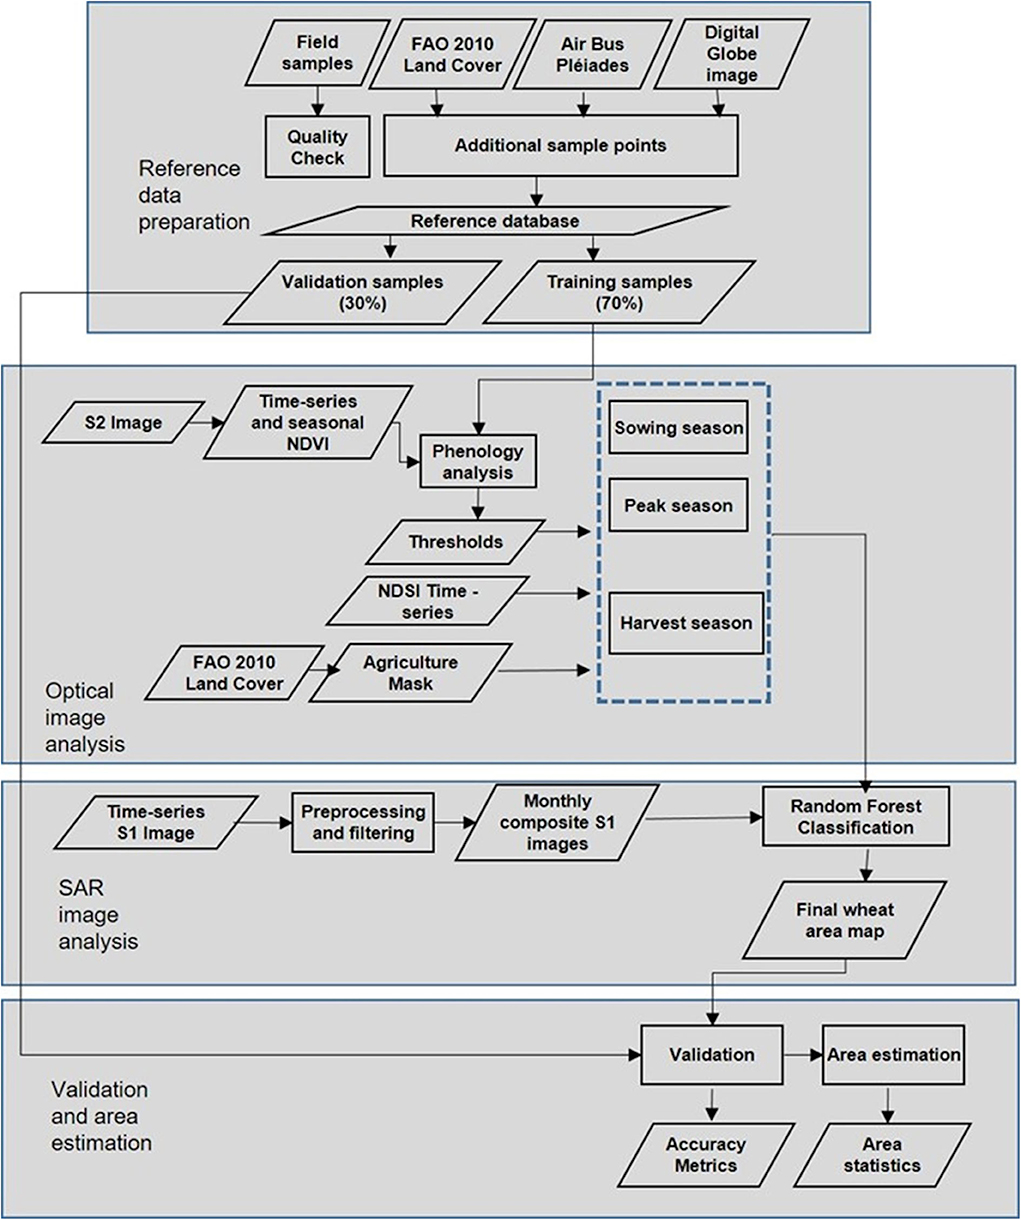
Figure 4. Flow chart for wheat area mapping and estimation.
Reference Data Preparation
In the first step, reference data collected from wheat and other crops for 34 provinces of Afghanistan were subjected to quality check. This is because some of the sample points collected by the field staff were not always inside the crop fields. Accordingly, adjustments were made to correct the location based on three criteria: (a) direction and orientation of the field photographs; (b) phenological characteristics of the crop; and (c) visual interpretation through high-resolution Google Earth images. For each province, the reference points were merged and divided randomly into two categories, i.e., training and validation samples; 70% of the samples were used for training and the remaining 30% for validation.
Wheat Area Mapping Using Optical Images
The wheat mapping was done at the provincial level. Optical Sentinel-2A Level 1-C (top-of-atmosphere) satellite images with <30% cloud cover from November 2016–July 2017 were used for the analysis. The data were preprocessed to remove clouds/bad pixels. The cloud masking utilizes Sentinel-2 Band QA60, a quality flag band, to identify and mask out flagged cloud and cirrus pixels. After that, the median-compositing function was used on the cloud-masked Sentinel-2 images to generate a per-pixel median composite of each of the multi-spectral bands and the indices for every province (Hird et al., 2017).
NDVI is an effective means to characterize these growth patterns during the crop cycle (Menenti et al., 1993). Using randomly collected training samples and the seasonal composite of sentinel 2 images, NDVI thresholds were identified to separate the wheat from other crops during sowing, peak and harvest time at the provincial level. NDVI thresholds were identified for different seasons (sowing, peak and harvest) and were different for each province. The difference in the NDVI thresholds for different provinces is mainly because of the shift in the phenological cycle (early and late sowing) of wheat and other crops.
The Normalized Difference Soil Index (NDSI; Equation 2) values were used as an additional metric to separate the wheat from fallow land during peak season. The NDSI is preferred because it is sensitive to canopy structure (Jin et al., 2016) and is very effective in separating bare soil from other features like water and sparse vegetation.
To define the thresholds for separating the wheat from other crops, the minimum and maximum values of NDVI were calculated for wheat using the training samples. The separation was done as below:
The NDVI threshold derived for 2016–2017 were specifically derived on the basis of collected ground sample points from the field. The NDVI threshold values depend on various factors, such as: (i) whether it is a dry year or wet year; (ii) whether there has been early or late sowing of the crop; and (iii) atmospheric conditions at the time of data acquisition. Hence, the NDVI thresholds are specific to the 2016–2017 growing season. However, Equations (3)–(5) can be utilized for deriving the NDVI thresholds for other years if field sample points for that particular year are available.
Refinement of the Wheat Map Using SAR Data
Compared to the other crops, wheat has a different cropping calendar and growth patterns (Figure 3), except for barley, some vegetables and opium poppy have growth patterns similar to wheat. Due to the similarity in cropping season and growth pattern, it was difficult to accurately separate barley, opium poppy and some vegetables using Sentinel 2 data despite having a 5-days temporal resolution. This is because of the limited availability of cloud-free images which makes it difficult to utilize the image of a specific time (where wheat can be separated from other overlapping crops). To overcome this limitation, the wheat area map obtained from the optical image analysis was further refined using Sentinel-1 SAR data. SAR sensors have all-weather capability to acquire images and are sensitive to plant structure; however, to use the SAR (S1) based classification alone would require much more sample data for all the crops. The initial separation of crops using optical data enabled the use of SAR for only separating the wheat from crops with similar crop calendar and phenology. The S1 data has a consistent time-series in terms of incidence angle and has a wide scope in mapping different crops (Inglada et al., 2015). Initially, SAR (S1) datasets were preprocessed with VV polarization imagery. Pre-processing includes orbital file correction, thermal noise removal and terrain correction. For removing speckle noise, the median filter with kernel window size 5 × 5 was used for this research. The selection is based on previous studies that demonstrate that the median filter with window size 5 × 5 produces consistent and satisfactory results than other speckle filters and window sizes (e.g., 3 × 3 or 7 × 7) (Ozdarici and Akyurek, 2010). Monthly median composites were developed for the entire wheat crop cycle (i.e., sowing until harvesting).
The analysis of S1 data shows the difference in response patterns from different crops. However, the variability of responses shows overlap and makes it difficult for the threshold-based separation (Figure 5). Thus, a Random Forest (RF) classification technique was utilized using time series S1 data and training points to separate the wheat from other crops. The Random Forest (RF) randomly selects a subset of training sample through replacement to build a single tree, i.e., it uses bagging technique where for every tree, data is sampled from the original complete training set. There are two important user- define parameters in RF, i.e., (i) Number of trees; (ii) Number of variables. The generalization error always converges as the number of trees increases (Breiman, 2001). Therefore, RF classifier doesn't have any issue of overfitting which can also be attributed to the Strong Law of Large Numbers (Bercovici and Pata, 1996). There is no well-defined rule for selection of the number of trees. However, Guan et al. (2013) suggest that number of trees can be as large as possible but beyond a certain point, additional trees will not help in improving the performance of the classifier. Also, the increased number of trees would require high computation. In this study, we have used the number of trees as 100. The selection was based on the hit and trial method. Secondly, the number of variables highly affects the performance of RF classifier, which is usually set to the square root of the number of input variables. In our case, we have used time series of the monthly median of VV polarized sentinel−1 backscatter values. The application of Random Forest was applied within the classified mask generated from the optical image analysis. This step was applied only after the harvest season.
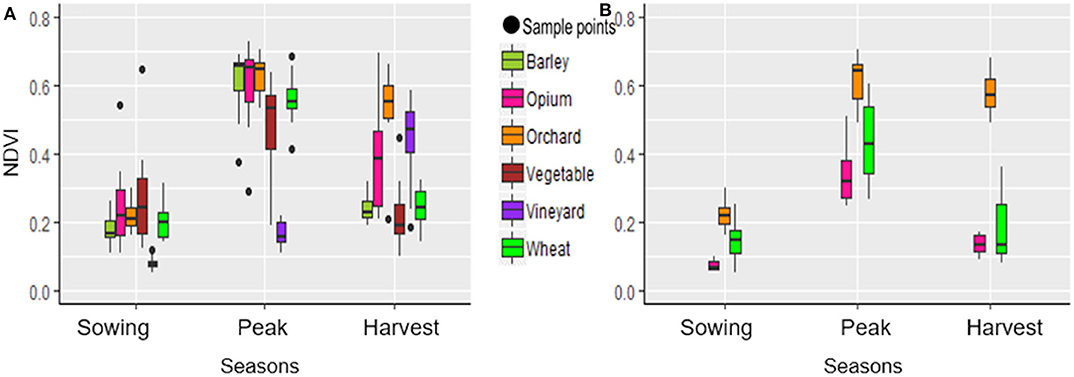
Figure 5. Seasonal phenological characteristics using NDVI. (A) Laghman, (B) Helmand province.
Accuracy Assessment
In the context of remote sensing based land cover classification, accuracy assessment can be defined as an agreement between a standard assumed to be correct and a classified image of unknown quality (Grenier et al., 2008). Classification errors occur when a pixel (or feature) belonging to one category is assigned to another category. Accuracy assessments can be done using qualitative methods through visual interpretation and quantitative evaluation based on statistical methods (Cochran, 1997; Olofsson et al., 2014). The accuracy assessment for this study was conducted in two steps. First, the results were checked by comparing with various ancillary data to identify gross errors. Second, the final data were used for quantitative accuracy assessment. Of the total reference samples (ground sample points) collected for different crops, 70% were used for training and the remaining 30% for validation. Error matrices were generated for each province separately. Using these error matrices, the statistical accuracy assessment was done by generating producer's and user's accuracy including Kappa coefficients. Kappa coefficient is an indicator of accuracy of the classified map. It is a measure of how the classification results compare to values assigned by chance. The value of the kappa coefficient ranges from 0 to 1. If kappa coefficient equals to 0, there is no agreement between the classified image and the reference image. If kappa coefficient equals to 1, then the classified image and the ground truth image are identical. Higher the value of kappa coefficient, more accurate the classified map is.
Tools Used
The workflow for the wheat area mapping is implemented in the Google Earth Engine (GEE) environment using custom Java scripts. The reference data and other required data were loaded into GEE asset storage. The preprocessed images were also loaded into GEE asset to run the classification. The resulting wheat maps were exported as Geocoded rasters and imported to ArcGIS software for visual interpretation and accuracy analysis.
Results and Discussion
Understanding the Phenological and Temporal Backscatter Characteristics of Wheat and Other Vegetation
Phenological Characteristics Using Optical Data
Cropping calendar information aggregated by province (Figure 3) suggests that the sowing season of wheat overlaps with barley, opium poppy, and vegetables. However, some differences can be seen in the length of the season including the start and end of the season, and peak. While analyzing the data, we consulted province-wise crop calendars. However, due to cloud cover, it was not possible to create monthly composites of Sentinel 2 images covering all the provinces to generate monthly phenology. Therefore, seasonal median composites of NDVI were created during the sowing, peak and harvest seasons for wheat. As an example, crop growth patterns for Laghman province are shown in Figures 5A, 6A which depict vineyards having distinct signals compared to wheat areas during the sowing season. The growth pattern is also significantly different. The orchards had higher NDVI both during the peak and harvest time. NDVI response from vegetables varied a lot but the values were lower than the wheat during the peak and the harvest season. The NDVI values for opium poppy showed higher overlap during the sowing period. It has relatively higher NDVI values during the peak and the harvest time. The opium poppy has a shorter cropping season so separation with barley and opium poppy would have been possible if cloud-free monthly images could be obtained. The NDVI characteristics of the opium poppy in Helmand province (Figure 5B) showed higher separability from the wheat during the sowing and peak season. Overall, the NDVI seasonal composites were useful to distinguish the wheat from orchards, vineyards and some vegetables. Not much separation between these crops could be achieved using the sowing period data alone; much more improved results can be obtained by integrating sowing, peak and harvest season data. However, significant overlap in NDVI was still observed between the wheat, opium poppy, and barley using the optical image composites.
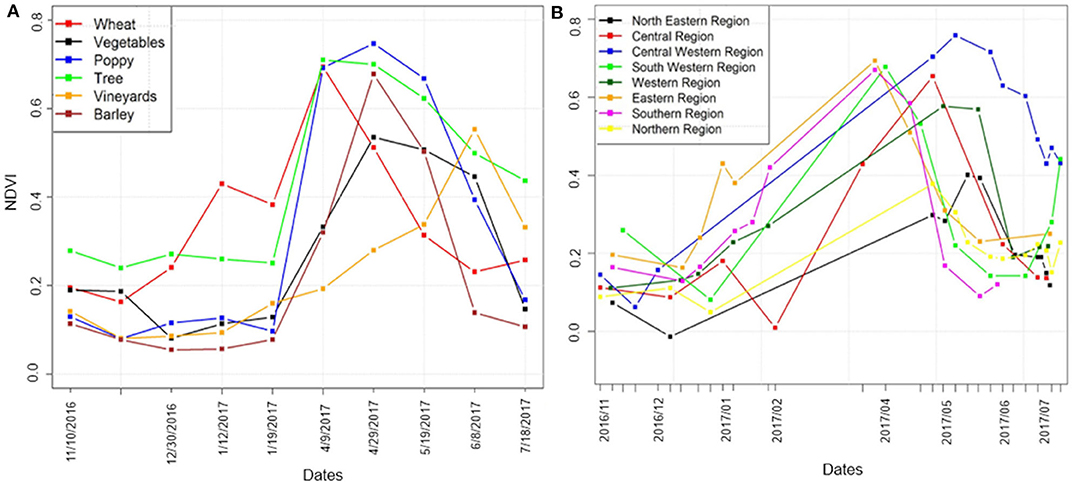
Figure 6. (A) Phenological characteristics of different crops (Laghman Province); (B) Phenological characteristics of wheat in different AEZ.
Figure 6B shows the difference in the phenological characteristics of wheat for different Agro-Ecological Zones (AEZ) in Afghanistan. By examining Figure 6B, it was observed that there is not much difference in the phenological characteristics of wheat in the Eastern, Southern and the South Western Region. The Western and the Central Western region have late peak and harvest times. In the Northern and North Eastern Region, the NDVI values at peak season were generally low compared to other regions and also the harvest time of the wheat was late. The shift in the sowing, peak and harvest time of wheat is due to the different altitude, climatic zones and that varies according to the agro-ecological zones. The difference in the growth pattern of the wheat in different AEZs also suggests the use of different NDVI thresholds for sowing, peak and harvest season for different provinces.
Analysis of Temporal Backscatter Characteristics of S1 (SAR Data)
SAR has all-weather capability and good temporal resolution. Therefore, backscatter characteristics of wheat and other overlapping crops/vegetation features were also examined using Sentinel 1 SAR data. The monthly temporal median composite images from November 2016–July 2017 were utilized to study the response of backscatter characteristics of overlapping crops at different periods (Figure 7). Since SAR backscatter varies by plant structure, distinct signals were observed for different crops. However, due to high overlapping responses from different crops (Figure 7), the threshold-based separation was not possible using SAR backscatter datasets. Random Forest classification was used on the monthly composites of backscatter data to constrain the classification within the mask (threshold from optical S2 data) obtained by phenological analysis from S2 images in the earlier stage.
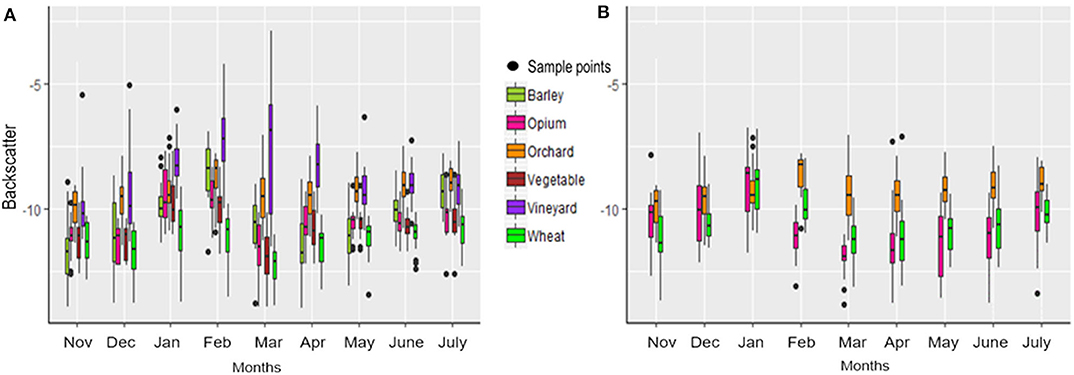
Figure 7. Monthly SAR Backscatter profile by crop. (A) Laghman, (B) Helmand.
The Accuracy of the Wheat Area Estimation
Classification error matrices were generated for each province for wheat and non-wheat areas using validation samples. Table 3 shows the confusion matrix for Irrigated and Rainfed wheat.
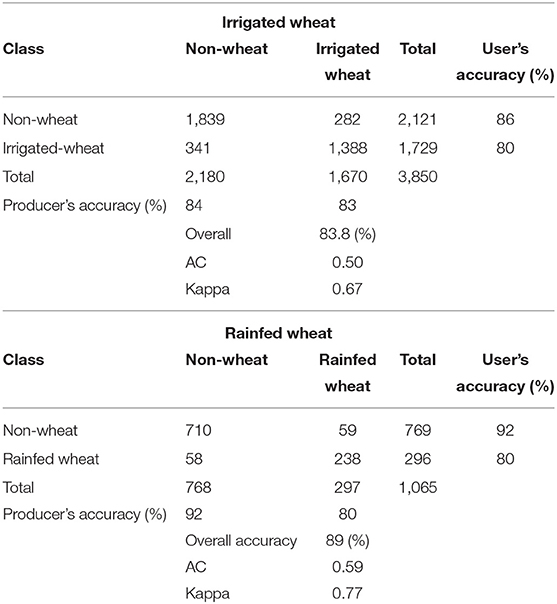
Table 3. Confusion matrix.
The statistics of accuracy (overall, users, producers, and Kappa) achieved at a provincial level for irrigated and rainfed wheat is depicted in Figure 8. The mean overall accuracy for all provinces for irrigated and rainfed wheat areas was 83.8 and 89.0%, respectively. The minimum overall accuracy was 48% for irrigated wheat in the Faryab province. This was exceptional because of three reasons (i) cloud cover, which hampers the quality of the images over that province; (ii) the limited number of sample points, which makes it difficult to identify the thresholds; and (iii) poor quality of ground sample points. The overall accuracy was <75% for irrigated wheat for only six provinces out of 34. For rainfed wheat, only one province had <75% accuracy. The accuracy for the provinces without the reference data was generally lower than those where reference samples were available. The Kappa value forirrigated wheat for provinces with available field data was 0.69 whereas it was 0.54 for provinces with no field data. After evaluating the accuracy of each province, the wheat area was estimatedusing the equation (Equation 6).
In the study, we also explored the potential accuracy for using S1 and S2 datasets and accuracy achieved for the estimation at different crop growth stages, i.e., sowing, peak, and harvest for Kabul as a case study (Table 4). The accuracies and the area estimates for different combinations and periods are presented in Table 4. From Table 4, it can be observed that the accuracy of the classification is highest when the assessment is done at the end of the season, i.e., utilizing both optical and SAR datasets. However, a decent accuracy can be achieved during peak season using both optical and SAR images. The peak season area estimates can be highly useful for food security management and to address major deviations in the wheat area cultivated during the specific season.
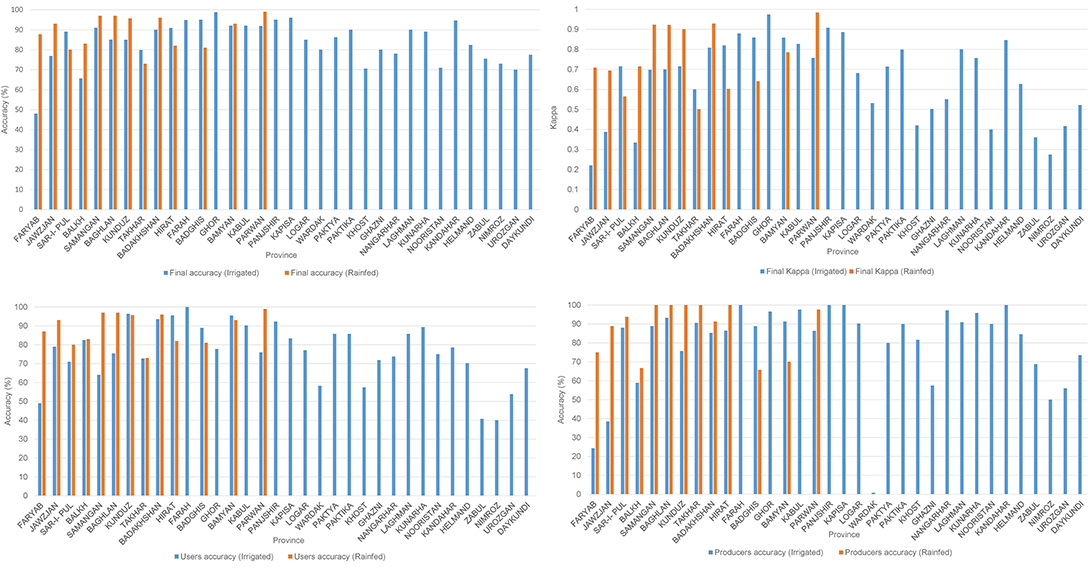
Figure 8. Accuracy analysis results by provinces.
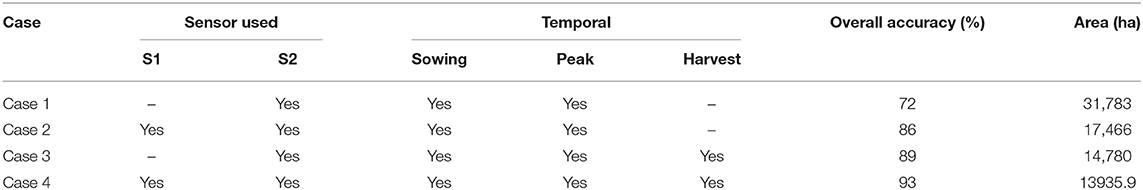
Table 4. Area and accuracy using different combinations of datasets (example Kabul province).
Distribution of Wheat in Afghanistan
Figure 9 shows the distribution of irrigated and rainfed wheat areas for 2017 produced using both optical (S2) and SAR (S1) data and images from sowing until harvest. By observing the map (Figures 3, 9), it can be concluded that the majority of the rainfed areas were located in the northern region of the country, which is mountainous (Hindu Kush range) and experiences a decent amount of precipitation and snowfall during the winter season, whereas irrigated the area is distributed across the entire country. More than 80% of wheat (both irrigated and rainfed) is produced in sixteen provinces of which Badghis, Takhar, Balkh, Kunduz, Herat, Helmand, and Kandahar are major wheat-producing provinces accounting for nearly 50% of the wheat production in the country.
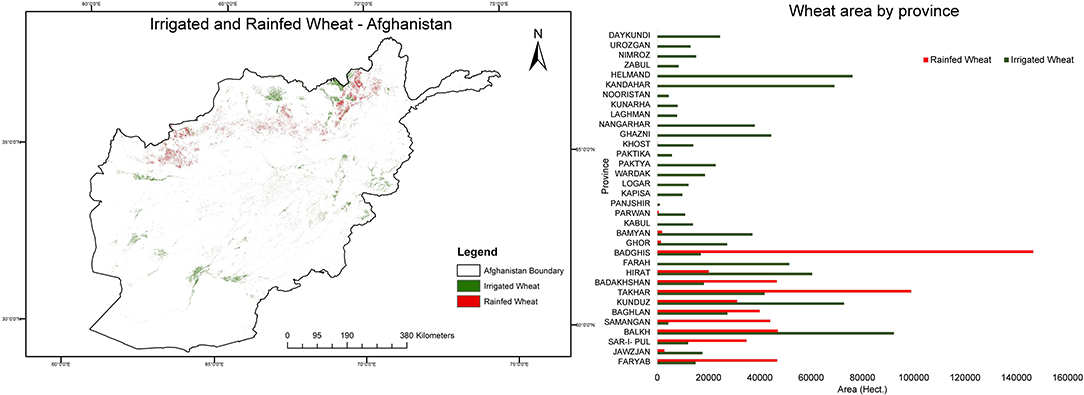
Figure 9. Distribution of Irrigated and Rainfed Wheat area of Afghanistan in 2017.
Operationalization and Dissemination
The wheat mapping workflow is implemented in GEE using a customized interface for each module. A systematic capacity building program, including formal and on the job training, was conducted for MAIL professionals to run the workflow. A web-based visualization system was developed (Figure 10) to disseminate the final results. The portal can be accessed via the following URL link: http://geoapps.icimod.org/afwheat/.
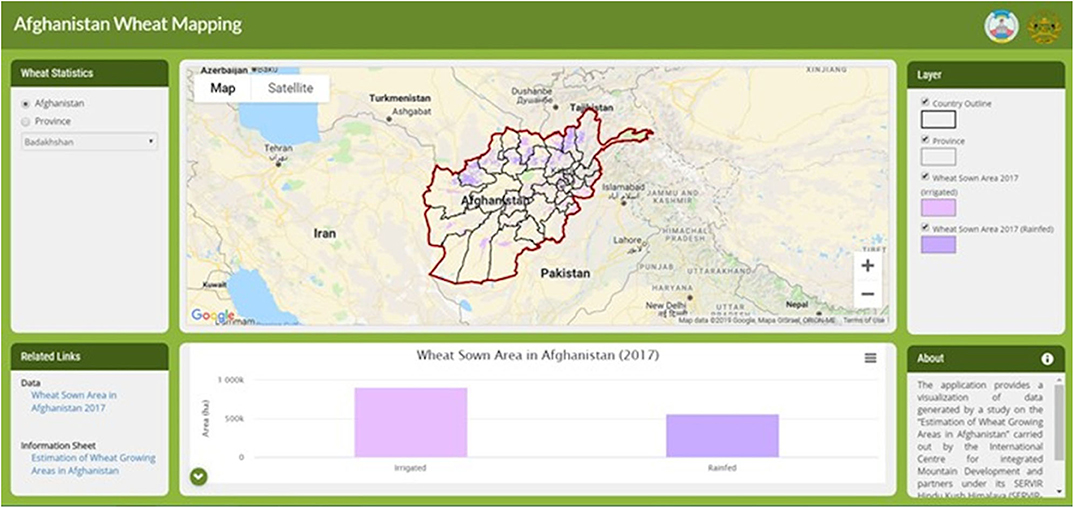
Figure 10. Web mapping system for dissemination and visualization of wheat map.
Limitations
While the study demonstrated a method for in-season classification of wheat area for food security planning in Afghanistan, there are few limitations of the study. Firstly, the classification system is implemented in the free cloud platform of Google earth Engine assuming that GEE will continue ingesting the Sentinel−2 and Sentinel−1 data in its image collection. If for any reason, GEE discontinues providing access to the GEE cloud platform, the system could not be automated and all the Sentinel data would have to be downloaded and processed offline. Secondly, the threshold-based separation of wheat from other crops has a limitation in the area where wheat is mixed with other crops especially vegetables and opium poppy which have similar phenology. Though SAR images were used to separate these crops from wheat, it requires field samples for each year which is quite challenging in the context of Afghanistan. Alternative source like high-resolution satellite images could be used for the collection of samples from those areas. Third, currently, Sentinel-1 SAR images only capture VV polarized data over Afghanistan. Multiple polarized SAR data could be a better option for classifying wheat using the RF algorithm. Fouth, for operationalization of the system, capacity development has been done for Geospatial staff in MAIL but, many of the MAIL staff have left during the study period. Though most of the system is automated and the system could be implemented with quick training, MAIL has to ensure the availability of staff and knowledge transfer during staff turnover.
Conclusion and Way Forward
In this study, a systematic methodology for wheat area mapping was developed for Afghanistan with the potential for operationalization to support the management of food security in the country. To overcome the issues related to low internet bandwidth, lack of sufficient ground samples and limited availability of cloud-free optical satellite images, a cloud-based system combining phenological characteristics using optical images and temporal backscatter profiles using SAR images was adopted. The system uses a multi-step approach to provide area estimation as the wheat season progresses. The first estimation is provided during the peak season to give an early indication of wheat cultivated area. The more accurate estimation is provided immediately after the harvest season. Considering the low capacity on the use of remote sensing based crop type mapping in Afghanistan, this approach was automated in GEE. Through NASA SERVIR, training activities are underway to enhance the skills of the local staff in government agencies on mapping and monitoring of crop areas using GEE.
Data Availability Statement
The datasets generated for this study are available on request to the corresponding author.
Author Contributions
MM: concept development, analysis, and writing. VT: concept development, analysis, implementation, and writing. WE, FQ, BB, and KV: review methodology, review analysis, and writing. BR and WY: data analysis and writing.
Funding
This study was partially supported by the SERVIR-HKH program. SERVIR-HKH was a joint development initiative of the National Aeronautics and Space Administration (NASA) and the United States Agency for International Development (USAID). SERVIR works in partnership with leading regional organizations worldwide to help developing countries use the information provided by Earth-observing satellites and geospatial technologies for managing climate risks and land use. The study was also partially supported by core funds of ICIMOD contributed by the governments of Afghanistan, Australia, Austria, Bangladesh, Bhutan, China, India, and Myanmar, Nepal, Norway, Pakistan, Sweden, and Switzerland.
Disclaimer
The views and interpretations in this paper are those of the authors and are not necessarily attributable to ICIMOD, USAID, or NASA.
Conflict of Interest
The authors declare that the research was conducted in the absence of any commercial or financial relationships that could be construed as a potential conflict of interest.
Acknowledgments
The authors express their sincere gratitude to the Airbus company for providing the high-resolution Pleiades images at a discounted price.
References
Ahl, D. E., Gower, S. T., Burrows, S. N., Shabanov, N. V., Myneni, R. B., and Knyazikhin, Y. (2006). Monitoring spring canopy phenology of a deciduous broadleaf forest using MODIS. Remote Sens. Environ. 104, 88–95. doi: 10.1016/j.rse.2006.05.003
Ahmad, J. (2018). International Conference on Food and Agricultural Economics, 2nd Edn. Available online at: http://www.ageconalanya.com/ICFAEC%202018%20PROCEEDINGS%20BOOK.pdf
Avetisyan, A. (2017). Afghanistan Opium Survey 2017 Cultivation and Production. United Nation Office of Drugs and Crime. Available onlie at: https://www.unodc.org/documents/crop-monitoring/Afghanistan/Afghan_opium_survey_2017_cult_prod_web.pdf
Baker, W. (2015). Wheat Production Above Average but Down From Last Year. United States Department of Agriculture. Available online at: https://ipad.fas.usda.gov/highlights/2015/07/Afghanistan/Index.htm
Bercovici, H., and Pata, V. (1996). The law of large numbers for free identically distributed random variables. Ann. Probab. 24, 453–465. doi: 10.1214/aop/1042644726
Camps-Valls, G., Gómez-Chova, L., Calpe-Maravilla, J., Soria-Olivas, E., Martín-Guerrero, J. D., and Moreno, J. (2003). “Support vector machines for crop classification using hyperspectral data,” in Pattern Recognition and Image Analysis, Vol. 2652, eds F. J. Perales, A. J. C. Campilho, N. P. de la Blanca, and A. Sanfeliu (Berlin; Heidelberg: Springer), 134–141. doi: 10.1007/978-3-540-44871-6_16
CIA (2019). South Asia: Afghanistan—The World Factbook—Central Intelligence Agency. The World Fact Book. Available online at: https://www.cia.gov/library/publications/the-world-factbook/geos/af.html
Cochran, W. G. (1997). Sampling Techniques, Vol. 3. John Wiley and Sons. Available online at: https://hwbdocuments.env.nm.gov/Los%20Alamos%20National%20Labs/General/14447.pdf
Deschamps, B., McNairn, H., Shang, J., and Jiao, X. (2012). Towards operational radar-only crop type classification: comparison of a traditional decision tree with a random forest classifier. Can. J. Remote Sens. 38, 60–68. doi: 10.5589/m12-012
Dong, J., Xiao, X., Menarguez, M. A., Zhang, G., Qin, Y., Thau, D., et al. (2016). Mapping paddy rice planting area in northeastern Asia with landsat 8 images, phenology-based algorithm and google earth engine. Remote Sens. Environ. 185, 142–154. doi: 10.1016/j.rse.2016.02.016
Fischer, A. (1994). A model for the seasonal variations of vegetation indices in coarse resolution data and its inversion to extract crop parameters. Rem. Sens. Environ. 48, 220–230. doi: 10.1016/0034-4257(94)90143-0
Fisher, J. I., and Mustard, J. F. (2007). Cross-scalar satellite phenology from ground, Landsat, and MODIS data. Rem. Sens. Environ. 109, 261–273. doi: 10.1016/j.rse.2007.01.004
Foerster, S., Kaden, K., Foerster, M., and Itzerott, S. (2012). Crop type mapping using spectral–temporal profiles and phenological information. Comput. Electr. Agric. 89, 30–40. doi: 10.1016/j.compag.2012.07.015
Gao, Q., Zribi, M., Escorihuela, M., Baghdadi, N., and Segui, P. (2018). Irrigation mapping using sentinel-1 time series at field scale. Rem. Sens. 10:1495. doi: 10.3390/rs10091495
Gorelick, N., Hancher, M., Dixon, M., Ilyushchenko, S., Thau, D., and Moore, R. (2017). Google Earth Engine: Planetary-scale geospatial analysis for everyone. Rem. Sens. Environ. 202, 18–27. doi: 10.1016/j.rse.2017.06.031
Grenier, M., Labrecque, S., Benoit, M., and Allard, M. (2008). Accuracy Assessment Method for Wetland Object-Based Classification. Available online at: https://www.isprs.org/proceedings/xxxviii/4-c1/Sessions/Session1/6739_Grenier_Proc_pos.pdf
Guan, H., Li, J., Chapman, M., Deng, F., Ji, Z., and Yang, X. (2013). Integration of orthoimagery and lidar data for object-based urban thematic mapping using random forests. Int. J. Remote Sens. 34, 5166–5186. doi: 10.1080/01431161.2013.788261
Haworth, B., Biggs, E., Duncan, J., Wales, N., Boruff, B., and Bruce, E. (2018). Geographic information and communication technologies for supporting smallholder agriculture and climate resilience. Climate 6:97. doi: 10.3390/cli6040097
Hird, J., DeLancey, E., McDermid, G., and Kariyeva, J. (2017). Google earth engine, open-access satellite data, and machine learning in support of large-area probabilistic wetland mapping. Remote Sens. 9:1315. doi: 10.3390/rs9121315
Hudson, I. L., and Keatley, M. R. (Eds.). (2010). Phenological Research: Methods for Environmental and Climate Change Analysis. Dordrecht; New York, NY: Springer.
Immitzer, M., Vuolo, F., and Atzberger, C. (2016). First experience with sentinel-2 Data for crop and tree species classifications in central europe. Remote Sens. 8:166. doi: 10.3390/rs8030166
Inglada, J., Arias, M., Tardy, B., Hagolle, O., Valero, S., Morin, D., et al. (2015). Assessment of an operational system for crop type map production using high temporal and spatial resolution satellite optical imagery. Remote Sens. 7, 12356–12379. doi: 10.3390/rs70912356
Jakubauskas, M. E., Legates, D. R., and Kastens, J. H. (2002). Crop identification using harmonic analysis of time-series AVHRR NDVI data. Comput. Elect. Agric. 37, 127–139. doi: 10.1016/S0168-1699(02)00116-3
Ji, S., Zhang, C., Xu, A., Shi, Y., and Duan, Y. (2018). 3D Convolutional neural networks for crop classification with multi-temporal remote sensing images. Remote Sens. 10:75. doi: 10.3390/rs10010075
Jin, Y., Sung, S., Lee, D., Biging, G., and Jeong, S. (2016). Mapping deforestation in north Korea using phenology-based multi-index and random forest. Remote Sens. 8:997. doi: 10.3390/rs8120997
Jonsson, P., and Eklundh, L. (2002). Seasonality extraction by function fitting to time-series of satellite sensor data. IEEE Trans. Geosci. Remote Sens. 40, 1824–1832. doi: 10.1109/TGRS.2002.802519
Karlsen, S. R., Elvebakk, A., Høgda, K. A., and Johansen, B. (2006). Satellite-based mapping of the growing season and bioclimatic zones in Fennoscandia. Glob. Ecol. Biogeogr. 15, 416–430. doi: 10.1111/j.1466-822X.2006.00234.x
Latham, S. J. (2017). Northern and Eastern Afghanistan: Monitoring of Rice Cultivation Using Satellite Remote Sensing and GIS Technologies. Food and Agriculture Organization United Nation. Available online at: http://www.fao.org/3/a-i6986e.pdf
Liakos, K. G., Busato, P., Moshou, D., Pearson, S., and Bochtis, D. (2018). Machine learning in agriculture: a review. Sensors. 18:2674. doi: 10.3390/s18082674
Lloyd, D. (1990). A phenological classification of terrestrial vegetation cover using shortwave vegetation index imagery. Int. J. Remote Sens. 11, 2269–2279. doi: 10.1080/01431169008955174
Markon, C. J., Fleming, M. D., and Binnian, E. F. (1995). Characteristics of vegetation phenology over the alaskan landscape using AVHRR time-series data. Polar Rec. 31, 179–190. doi: 10.1017/S0032247400013681
Martínez, B., and Gilabert, M. A. (2009). Vegetation dynamics from NDVI time series analysis using the wavelet transform. Remote Sens. Environ. 113, 1823–1842. doi: 10.1016/j.rse.2009.04.016
Menenti, M., Azzali, S., Verhoef, W., and van Swol, R. (1993). Mapping agroecological zones and time lag in vegetation growth by means of fourier analysis of time series of NDVI images. Adv. Space Res. 13, 233–237. doi: 10.1016/0273-1177(93)90550-U
Muradi, A. J., and Boz, I. (2018). The contribution of agriculture sector in the economy of Afghanistan. Int. J. Sci. Res. Manage. 6, EM-2018-750-755. doi: 10.18535/ijsrm/v6i10.em04
Murmu, S., and Biswas, S. (2015). Application of fuzzy logic and neural network in crop classification: a review. Aquat. Proc. 4, 1203–1210. doi: 10.1016/j.aqpro.2015.02.153
Myneni, R. B., Keeling, C. D., Tucker, C. J., Asrar, G., and Nemani, R. R. (1997). Increased plant growth in the northern high latitudes from 1981 to 1991. Nature 386, 698–702. doi: 10.1038/386698a0
Oguro, Y., Suga, Y., Takeuchi, S., Ogawa, M., Konishi, T., and Tsuchiya, K. (2001). Comparison of SAR and optical sensor data for monitoring of rice plant around hiroshima. Adv. Space Res. 28, 195–200. doi: 10.1016/S0273-1177(01)00345-3
Olofsson, P., Foody, G. M., Herold, M., Stehman, S. V., Woodcock, C. E., and Wulder, M. A. (2014). Good practices for estimating area and assessing accuracy of land change. Remote Sens. Environ. 148, 42–57. doi: 10.1016/j.rse.2014.02.015
Ozdarici, A., and Akyurek, Z. (2010). “A comparison of SAR filtering techniques on agricultural area identification,” in ASPRS 2010 Annual Conference (San Diego, CA), 10.
Pham, H. T. M., Huynh, T. T. T., Duong, T. T., and Kawarazuka, N. (2017). Food System Policy Baseline Assessment Report From Vietnam. Hanoi: International Center for Tropical Agriculture (CIAT).
Piao, S., Fang, J., Zhou, L., Ciais, P., and Zhu, B. (2006). Variations in satellite-derived phenology in China's temperate vegetation. Glob. Change Biol. 12, 672–685. doi: 10.1111/j.1365-2486.2006.01123.x
Rashid, A. (1997). FAO/GIEWS Special Report on Afghanistan 08/97. Available online at: http://www.fao.org/3/w6059e/w6059e00.htm
Shahriar, P., Budde, M., and Rowland, J. (2014). Mapping irrigated areas in Afghanistan over the past decade using MODIS NDVI. Remote Sens. Environ. 149, 155–165. doi: 10.1016/j.rse.2014.04.008
Simms, D. M., and Waine, T. W. (2016). “Opium yield estimates in Afghanistan using remote sensing,” in Seventh International Conference on Agricultural Statistics (ICAS VII). Available online at: https://www.istat.it/storage/icas2016/b09-simms.pdf
Skriver, H., Mattia, F., Satalino, G., Balenzano, A., Pauwels, V. R. N., Verhoest, N. E. C., et al. (2011). Crop Classification using short-revisit multitemporal SAR data. IEEE J. Appl. Earth Observ. Remote Sens. 4, 423–431. doi: 10.1109/JSTARS.2011.2106198
Sonobe, R., Tani, H., Wang, X., Kobayashi, N., and Shimamura, H. (2014). Random forest classification of crop type using multi-temporal TerraSAR-X dual-polarimetric data. Remote Sens. Lett. 5, 157–164. doi: 10.1080/2150704X.2014.889863
Soria-Ruiz, J., Fernandez-Ordonez, Y., McNairm, H., and Bugden-Storie, J. (2007). “Corn monitoring and crop yield using optical and RADARSAT-2 images,” in 2007 IEEE International Geoscience and Remote Sensing Symposium (Barcelona: IEEE), 3655–3658. doi: 10.1109/IGARSS.2007.4423638
Tamiminia, H., Homayouni, S., and Safari, A. (2015). Clustering of multi-temporal fully polarimetric l-band sar data for agricultural land cover mapping. ISPRS–International Archives of the Photogrammetry. Remote Sens. Spatial Inform. Sci. XL-1-W5, 701–705. doi: 10.5194/isprsarchives-XL-1-W5-701-2015
Tatsumi, K., Yamashiki, Y., Canales Torres, M. A., and Taipe, C. L. R. (2015). Crop classification of upland fields using Random forest of time-series Landsat 7 ETM+ data. Comput. Electr. Agric, 115, 171–179. doi: 10.1016/j.compag.2015.05.001
Tilman, D., Balzer, C., Hill, J., and Befort, B. L. (2011). Global food demand and the sustainable intensification of agriculture. Proc. Natl. Acad. Sci. U.S.A. 108, 20260–20264. doi: 10.1073/pnas.1116437108
UN FAO (2016). Afghanistan Special Report: Pre-Harvest Assessment. Available online at: https://reliefweb.int/sites/reliefweb.int/files/resources/2016%20Pre-Harvest_Assessment%20Report.pdf
United Nations (2013). Ensuring food and nutrition security. United Nations World Econ. Soc. Surv. 2013, 85–119. doi: 10.18356/0e3c4bbb-en
USAID (2017). Agriculture Consolidated Project Appraisal Document. Available online at: https://www.usaid.gov/sites/default/files/documents/1871/USAID_Afghanistan_Project_Appraisal_Document_-_Public_Version_2017-04-03.pdf
Wardlow, B. D., and Egbert, S. L. (2010). A comparison of MODIS 250-m EVI and NDVI data for crop mapping: a case study for southwest Kansas. Int. J. Remote Sens. 31, 805–830. doi: 10.1080/01431160902897858
White, M. A., Thornton, P. E., and Running, S. W. (1997). A continental phenology model for monitoring vegetation responses to interannual climatic variability. Glob. Biogeochem. Cycles 11, 217–234. doi: 10.1029/97GB00330
World Bank (2014). Islamic Republic of Afghanistan Agricultural Sector Review (No. AUS9779). Available online at: http://documents.worldbank.org/curated/en/245541467973233146/pdf/AUS9779-REVISED-WP-PUBLIC-Box391431B-Final-Afghanistan-ASR-web-October-31-2014.pdf
Zhang, X., Friedl, M. A., Schaaf, C. B., Strahler, A. H., Hodges, J. C. F., Gao, F., et al. (2003). Monitoring vegetation phenology using MODIS. Remote Sens. Environ. 84, 471–475. doi: 10.1016/S0034-4257(02)00135-9
Keywords: sentinel 1, sentinel 2, GEE, crop type, random forest
Citation: Tiwari V, Matin MA, Qamer FM, Ellenburg WL, Bajracharya B, Vadrevu K, Rushi BR and Yusafi W (2020) Wheat Area Mapping in Afghanistan Based on Optical and SAR Time-Series Images in Google Earth Engine Cloud Environment. Front. Environ. Sci. 8:77. doi: 10.3389/fenvs.2020.00077
Received: 31 May 2019; Accepted: 19 May 2020;
Published: 19 June 2020.
Edited by:
Niall Patrick Hanan, New Mexico State University, United StatesReviewed by:
Ahmad Khan, University of Maryland, College Park, United StatesQiuyan Yu, New Mexico State University, United States
Copyright © 2020 Tiwari, Matin, Qamer, Ellenburg, Bajracharya, Vadrevu, Rushi and Yusafi. This is an open-access article distributed under the terms of the Creative Commons Attribution License (CC BY). The use, distribution or reproduction in other forums is permitted, provided the original author(s) and the copyright owner(s) are credited and that the original publication in this journal is cited, in accordance with accepted academic practice. No use, distribution or reproduction is permitted which does not comply with these terms.
*Correspondence: Mir A. Matin, bWlyLm1hdGluQGljaW1vZC5vcmc=