Further Development of Small Hydropower Facilities May Alter Nutrient Transport to the Pantanal Wetland of Brazil
 Marcia Divina de Oliveira1*
  Ibraim Fantin-Cruz2
  Juliana Andrade Campos3
  Marcel Medina de Campos2
  Rafael Mingoti4
  Marcelo Luiz de Souza5
  Daniela Maimoni de Figueiredo2 Eliana Freire Gaspar de Carvalho Dores2 Olavo Pedrollo3
  Stephen K. Hamilton6,7
- 1Brazilian Agricultural Research Corporation, EMBRAPA Pantanal, Corumbá, Brazil
- 2Department of Sanitary and Environmental Engineering, Federal University of Mato Grosso, Cuiabá, Brazil
- 3Institute of Hydraulic Research, Federal University of Rio Grande do Sul, Porto Alegre, Brazil
- 4Brazilian Agricultural Research Corporation, EMBRAPA Satellite Monitoring, Campinas, Brazil
- 5Brazilian National Water Agency, Brasília, Brazil
- 6W.K. Kellogg Biological Station, Department of Integrative Biology, Michigan State University, Hickory Corners, MI, United States
- 7Cary Institute of Ecosystem Studies, Millbrook, NY, United States
Small hydropower (SHP) facilities, defined variably but usually by installed capacities of <10–50 MW, are proliferating around the world, particularly in tropical and subtropical regions. Compared to larger dams, SHPs are generally viewed as having less environmental impact, although there has been little research to support that assertion. Numerous SHPs have been built, and many more are in development or proposed, in rivers that drain into the Pantanal, a world-renowned floodplain wetland system located mostly in Brazil. The upland tributaries are important sources of nutrients to the Pantanal, affecting the biological productivity of downstream floodplains. This study presents measurements from upstream and downstream of 25 current hydropower facilities, most of which are SHPs, throughout the upland watersheds of the Upper Paraguay River basin to reveal how these facilities may affect the concentrations and transport of nutrients in rivers flowing to the Pantanal. Artificial neural network models estimated the impact of building 80 future SHPs on nutrient transport into the Pantanal, based on observations at current facilities as well as the spatial distribution of future facilities. Overall impacts of current hydropower facilities were not large, and in most cases were indistinguishable based on comparisons between upstream and downstream. The short water residence times of reservoirs associated with SHPs likely explain their tendency to have little or no effect on nutrient transport. However, model predictions for hydropower facilities that may be built in the future, many on rivers with higher discharge and sediment loads, point to significant reductions in overall TN (8%) and TP (29%) transport, with potential negative consequences for river and floodplain productivity. Negative impacts may be either because the rivers carry low nutrient concentrations and are thereby sensitive to oligotrophication, or they are particularly important overall nutrient sources supporting ecosystem productivity in downstream rivers and floodplains. Together with a parallel study of sediment transport, these results support recommendations that several river systems presently lacking dams in their lower reaches should be excluded from future hydropower development to maintain the nutrient and sediment supply to the Pantanal.
Introduction
Small hydropower (SHP) facilities are the most common kind of hydroelectric dams being built around the world, and although they are generally viewed as less environmentally harmful than larger dams, there has been little research to support that assertion, particularly in tropical and subtropical regions where the most new SHPs are being constructed (Mbaka and Mwaniki, 2015; Couto and Olden, 2018). Reflecting the widespread assumption that SHPs have lower environmental and social impacts than larger dams, many countries have enacted policies that promote SHPs, including less stringent environmental review. Brazil is an example, defining SHPs as facilities with installed electrical generation capacities between 5 and 30 MW (ANEEL, 2016). Multiple SHPs may be located in series along river systems, raising concerns about their cumulative effects on rivers and downstream ecosystems, as has been noted in China (Kibler and Tullos, 2013) and in the Amazon Basin (Athayde et al., 2019).
A large number of SHPs have recently been built in the watersheds of the Amazon, Paraná and Paraguay rivers of Brazil (Couto and Olden, 2018). Many more are in development or proposed, including in rivers that drain into the Pantanal, a world-renowned floodplain wetland system in the Upper Paraguay River basin, located mostly in Brazil (Figure 1A). The Pantanal occupies 140,000-km2, most of which is subject to seasonal inundation for up to several months per year by either riverine overflow or delayed drainage of local rainfall or both (Hamilton et al., 1996). The upland tributaries transport nutrients into the Pantanal (Oliveira et al., 2019), thereby affecting the biological productivity of downstream floodplains. Aquatic primary productivity is often limited by either the availability of nitrogen or phosphorus, or co-limited by both nutrients (Guildford and Hecky, 2000), and in floodplains external nutrient supply determines overall ecosystem productivity. As a result, floodplain lands subject to flooding only by relatively nutrient-poor local rainfall tend to be markedly less productive than those inundated by nutrient-rich river water from the upland tributaries (Junk et al., 1989, 2011; Lewis et al., 2000; Hamilton, 2002; Güntzel et al., 2020).
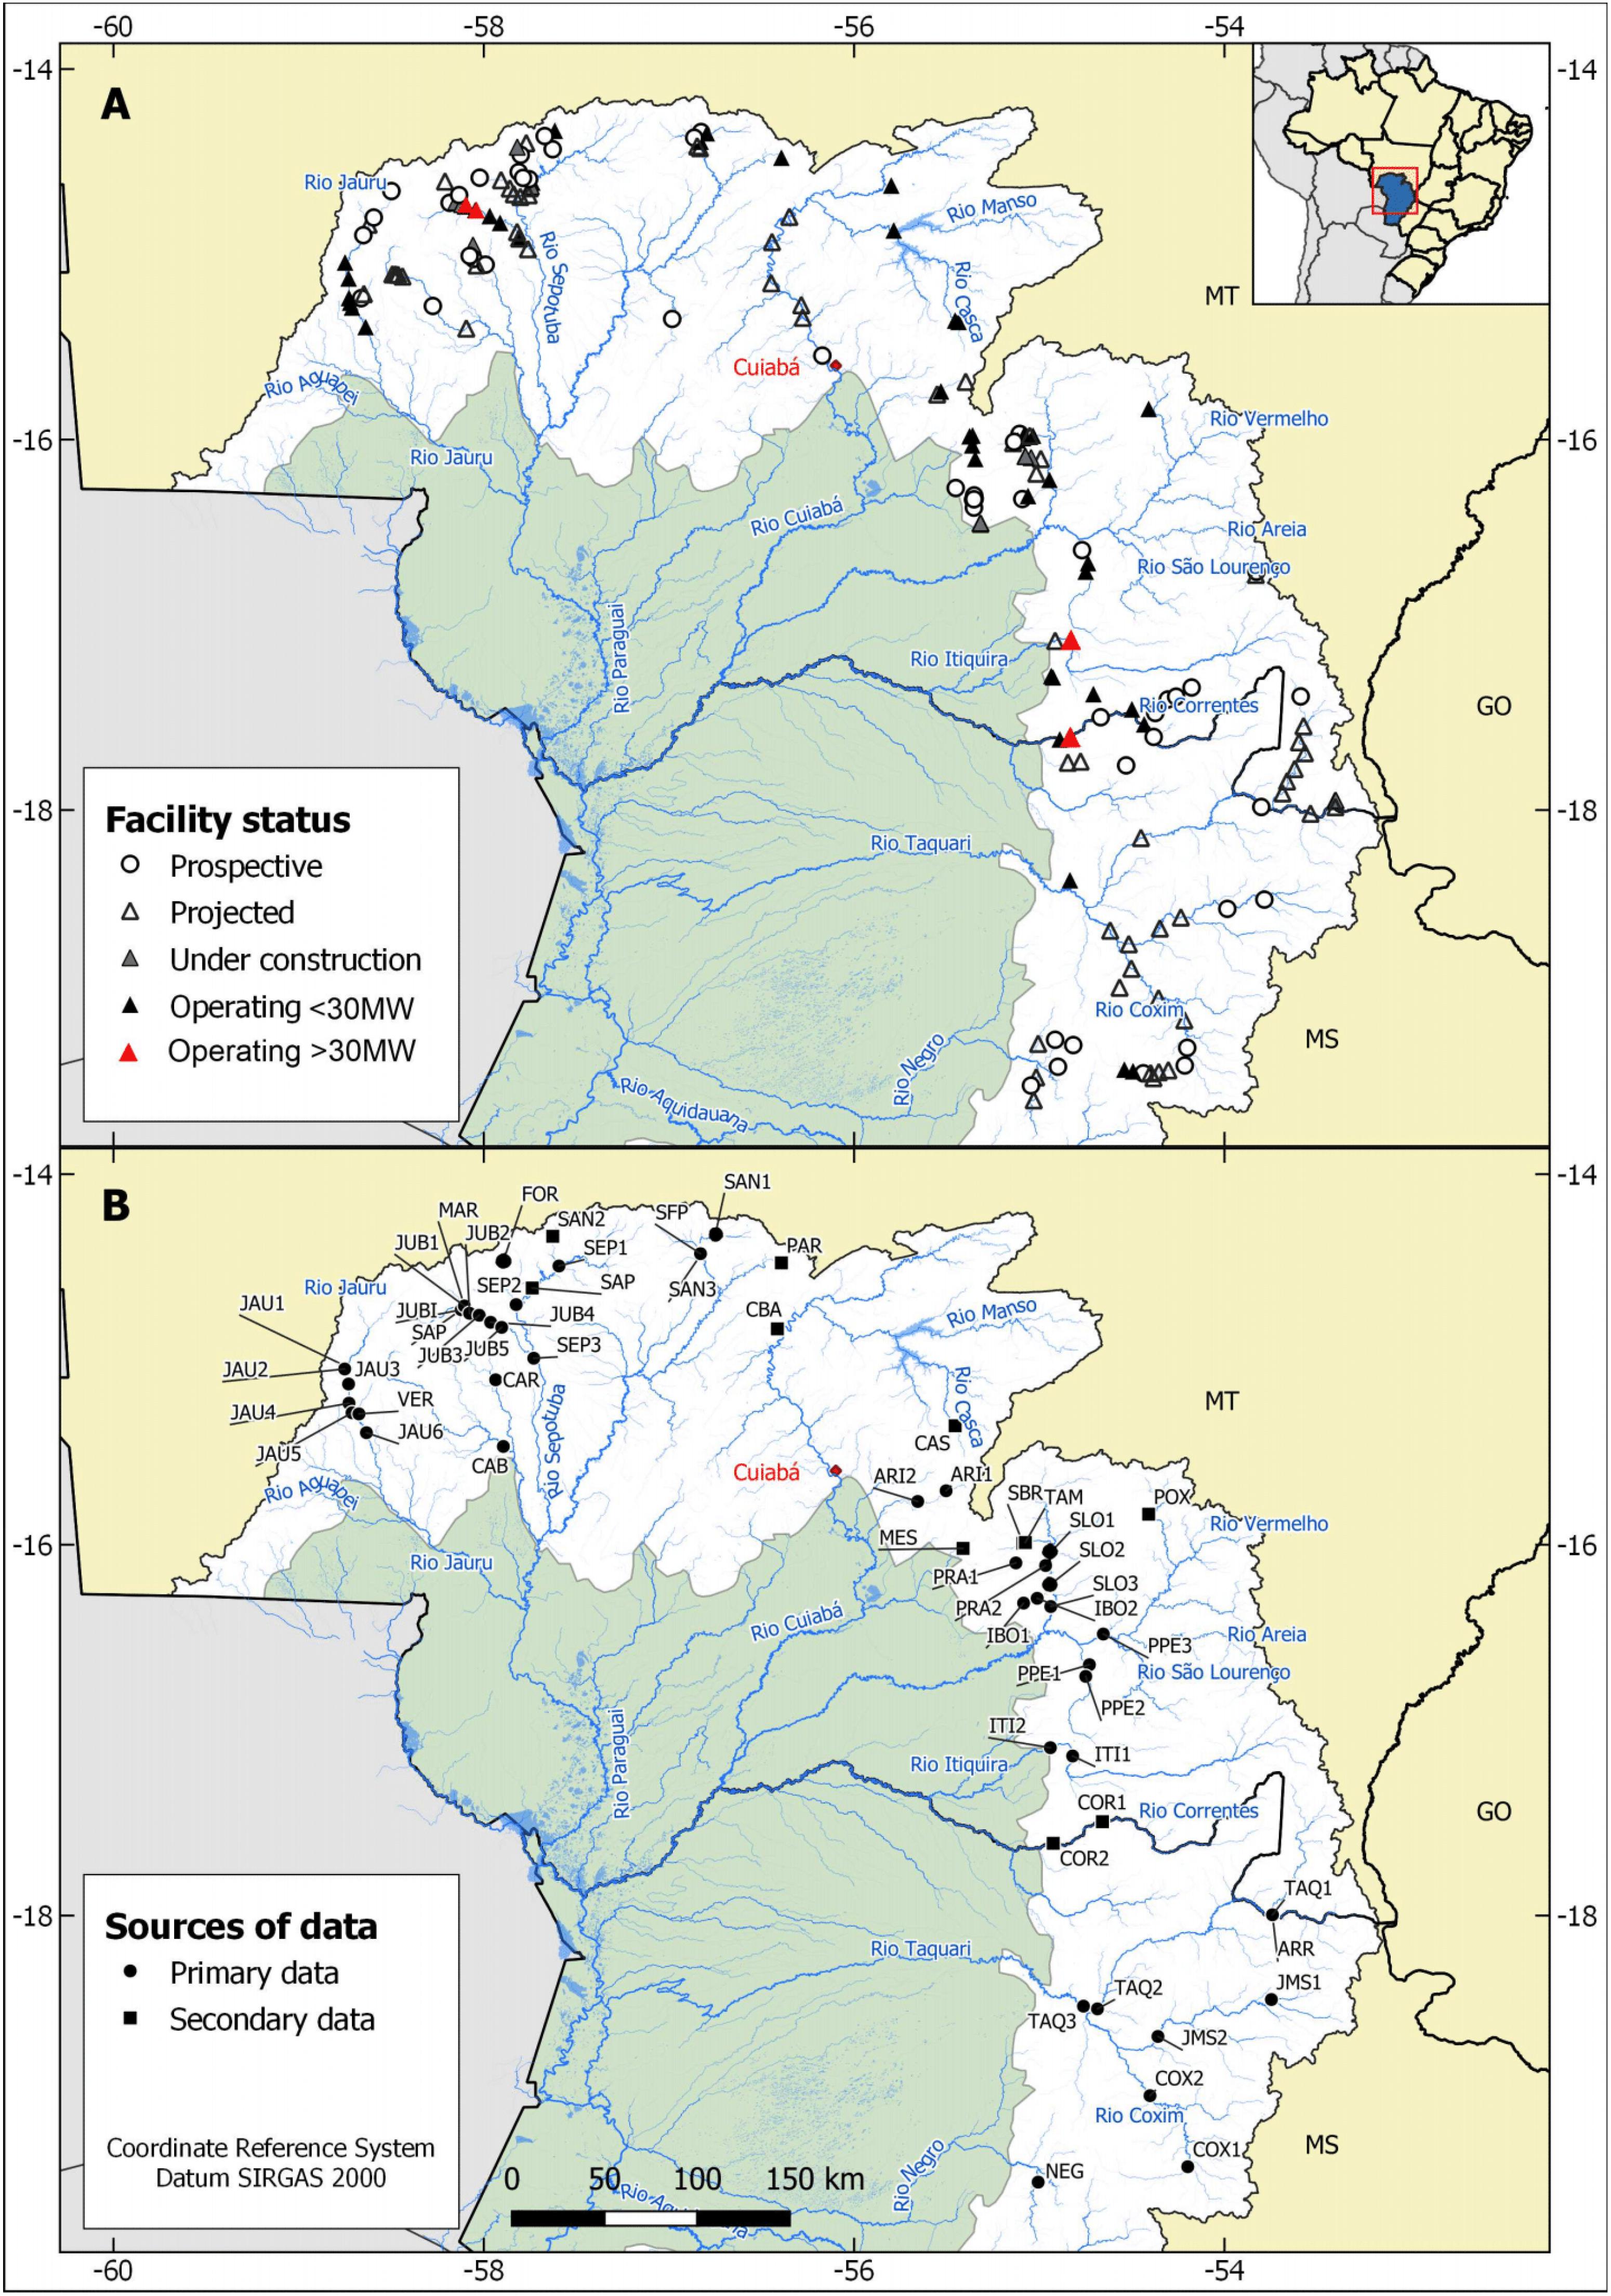
Figure 1. (A) Hydropower facilities in the upland watershed of the Pantanal that are currently in operation as well as future projects that are under construction, planned, or identified as potential sites for hydropower development by either the Brazilian National Electric Energy Agency (ANEEL) or the state environmental agencies (depending on location). Red triangles indicate the four studied facilities with installed capacities > 30 MW. (B) Sampling sites for nutrient transport, including sampling conducted by the authors (primary data) as well as secondary data derived from environmental compliance reports submitted to state agencies (SEMA-MT and IMASUL) and from previous scientific studies. The Pantanal floodplains are shaded in green and rivers (rios) and other waterbodies are shown in blue. Sampling site acronyms are identified in Table 1.
Existing and proposed hydropower facilities in tributaries to the Pantanal are depicted in Figure 1A. As of 2018 there were 47 hydropower facilities in operation (hereafter “current hydropower facilities”), the majority of which are SHPs, with an additional 138 projects under construction, planned, proposed, or identified by the government as prospective sites (hereafter “future hydropower facilities”) (Agência National de Águas [ANA], 2018). Many of the current and future projects are closely situated along river reaches, creating “cascades” where one project begins a short distance below the end of an upstream one.
Given the numerous SHPs planned or envisioned for development in the Upper Paraguay River basin, decision-makers urgently need to understand how these facilities on the tributaries may alter the transport of nutrients from the uplands into the Pantanal. The current study examines nutrient transport as one component of the basin-level environmental impacts of SHPs, and was carried out in conjunction with related studies on hydrology (Figueiredo et al., in review), sediment transport (Fantin-Cruz et al., 2020), and fish and fisheries.
Here we present measurements from above and below a number of current hydropower facilities throughout the Upper Paraguay River basin to reveal how these facilities may affect downstream water quality and, in turn, the transport of dissolved and particulate nutrients from the uplands to the Pantanal. In addition, we develop predictive models using artificial neural networks to estimate the impact of future hydropower development on nutrient transport into the Pantanal, based on observations at current facilities as well as the spatial distribution of future facilities. A companion paper in this journal (Fantin-Cruz et al., 2020) from the same project analyzes SHP effects on sediment transport to the Pantanal, and both papers conclude with recommendations developed from joint consideration of SHP impacts on nutrient and sediment transport. Our study design was based on the hypothesis that nutrient retention would be a function of water residence time above the dams, and that the sedimentation of particulate forms of nutrients would be the most readily observable effect, recognizing that many facilities may not slow the water enough to show these effects. Dams that produce longer water residence times would also be most likely to show biological retention (i.e., assimilation) or removal (e.g., denitrification) of nutrients.
Study Site
This study examines rivers of the uplands in the Upper Paraguay River basin in Brazil that drain to the Pantanal wetland. The Pantanal lies mostly within Brazil, and drains southward via the Paraguay River. The uplands (150–1,400 m a.s.l.), which represent 59% of the basin area and lie mainly to the east and north of the Pantanal, include a lot of sloping terrain favoring rapid runoff and high sediment production. The Pantanal floodplains lie between 80 and 150 m a.s.l. According to the Köppen-Geiger climate classification, the climate of the region is tropical savanna, with average annual precipitation in the uplands ranging from 1600 to 2100 mm. About 80% of the annual rainfall occurs in the rainy season from October to April (Gonçalves et al., 2011).
The native vegetation in the uplands is Cerrado savanna, but extensive areas are now converted to cropland (29% of the upland watershed area analyzed in this study) or pasture (22%). Human population density is low and Cuiabá city and its environs, situated along the Cuiabá River not far upstream of the Pantanal, is the largest urban area, which together with three other medium-sized cities located in the uplands has about 1,260,000 inhabitants. Water quality concerns in the region involve mostly diffuse pollution by soil erosion and agrochemicals from agricultural activities (Zeilhofer et al., 2006), as well as localized pollution by wastewater effluent from urban areas (Figueiredo et al., 2018).
The Pantanal is internationally recognized as a globally important wetland ecosystem that contains a rich mosaic of terrestrial, seasonally flooded, and aquatic habitats and landscapes. It is a Ramsar Site of International Importance under the Ramsar Convention and a UNESCO Biosphere Reserve. The region supports populations of several endangered mammals and birds including the hyacinth macaw (Anodorhynchus hyacinthinus), giant otter (Pteronura brasiliensis), jaguar (Panthera onca), pampas deer (Ozotoceros bezoarticus), and marsh deer (Blastocerus dichotomus) (Tomás et al., 2019). Cattle ranching, subsistence and recreational fishing, and ecotourism are major economic activities within the Pantanal.
Materials and Methods
Hydropower Facilities
The characteristics of the current hydropower facilities studied here, as well as the river reaches in which they occur, are given in Supplementary Table S1. The information includes facility name, river system, geographic coordinates, mean annual discharge, watershed area, reservoir area and volume, dam height, hydraulic residence time, installed potential, facility design (run-of-river vs. conventional and length of diverted river reach where applicable), and time since construction.
Most of these facilities can be considered small, although six have installed capacities above the Brazilian government’s regulatory definition of SHP as <30 MW installed capacity, and three of those exceed 100 MW. Two of those that exceed 30 MW (Juba I and II, each 42 MW) have dams and reservoirs similar in size to the SHPs, and one of the SHPs (São Lourenço, 29 MW) creates a reservoir comparable in size to larger facilities such as the largest one studied here, Ponte de Pedra (176 MW). Thus, because installed capacity is an imperfect indicator of the degree to which the passage of river water is slowed, which in turn determines the potential effects of these facilities on nutrient transport, we analyze the SHPs and larger facilities together in this study.
Most of the hydropower facilities studied here are diversion designs, where a low dam with a small or non-existent reservoir diverts river water into an artificial channel (headrace) for as much as several km to a powerhouse farther down the river valley (Supplementary Table S1). Most of the river discharge is normally diverted, leaving the natural channel with as little as 10% of the discharge, then returned to the river below the powerhouse with no net loss or gain. The designs that lack a large reservoir are “run-of-river” facilities inasmuch as they cannot alter discharge except on short time scales (Csiki and Rhoades, 2010; Kaunda et al., 2012; Figueiredo et al., in review). Many of the SHPs are located on lower-order rivers but some are on larger rivers with low elevational gradients.
Nutrient concentrations and other water quality data (described in “Sample Collection and Analysis” for upstream and downstream of current SHPs and several larger hydropower facilities), as well as in reaches where such facilities may be built in the future, were obtained from our own sampling and measurements (primary data) as well as from reports submitted by hydropower companies to the state environmental agencies as required for environmental compliance (secondary data). The nutrient and discharge measurements conducted for environmental compliance followed the same field and laboratory methods we used, and analyses were conducted only by certified laboratories with appropriate quality assurance protocols.
From the 30 current hydropower facilities with available data (Supplementary Table S1), 25 had sufficient numbers of sampling dates to compare upstream to downstream nutrient concentrations and transport (17 based on primary data and eight based on secondary data; criteria for selection are described in section “Water Quality Data Compilation From Secondary Sources”). Data for the other five SHPs were included in the model development (section “Prediction of Impacts of Future Hydropower Facilities”). The spatial distribution of sampling sites with primary or secondary data is shown in Figure 1B, and sampling site codes used in figures are listed in Table 1. Spatial coordinates of sampling sites as well as their locations in river networks appear in Supplementary Table S2.
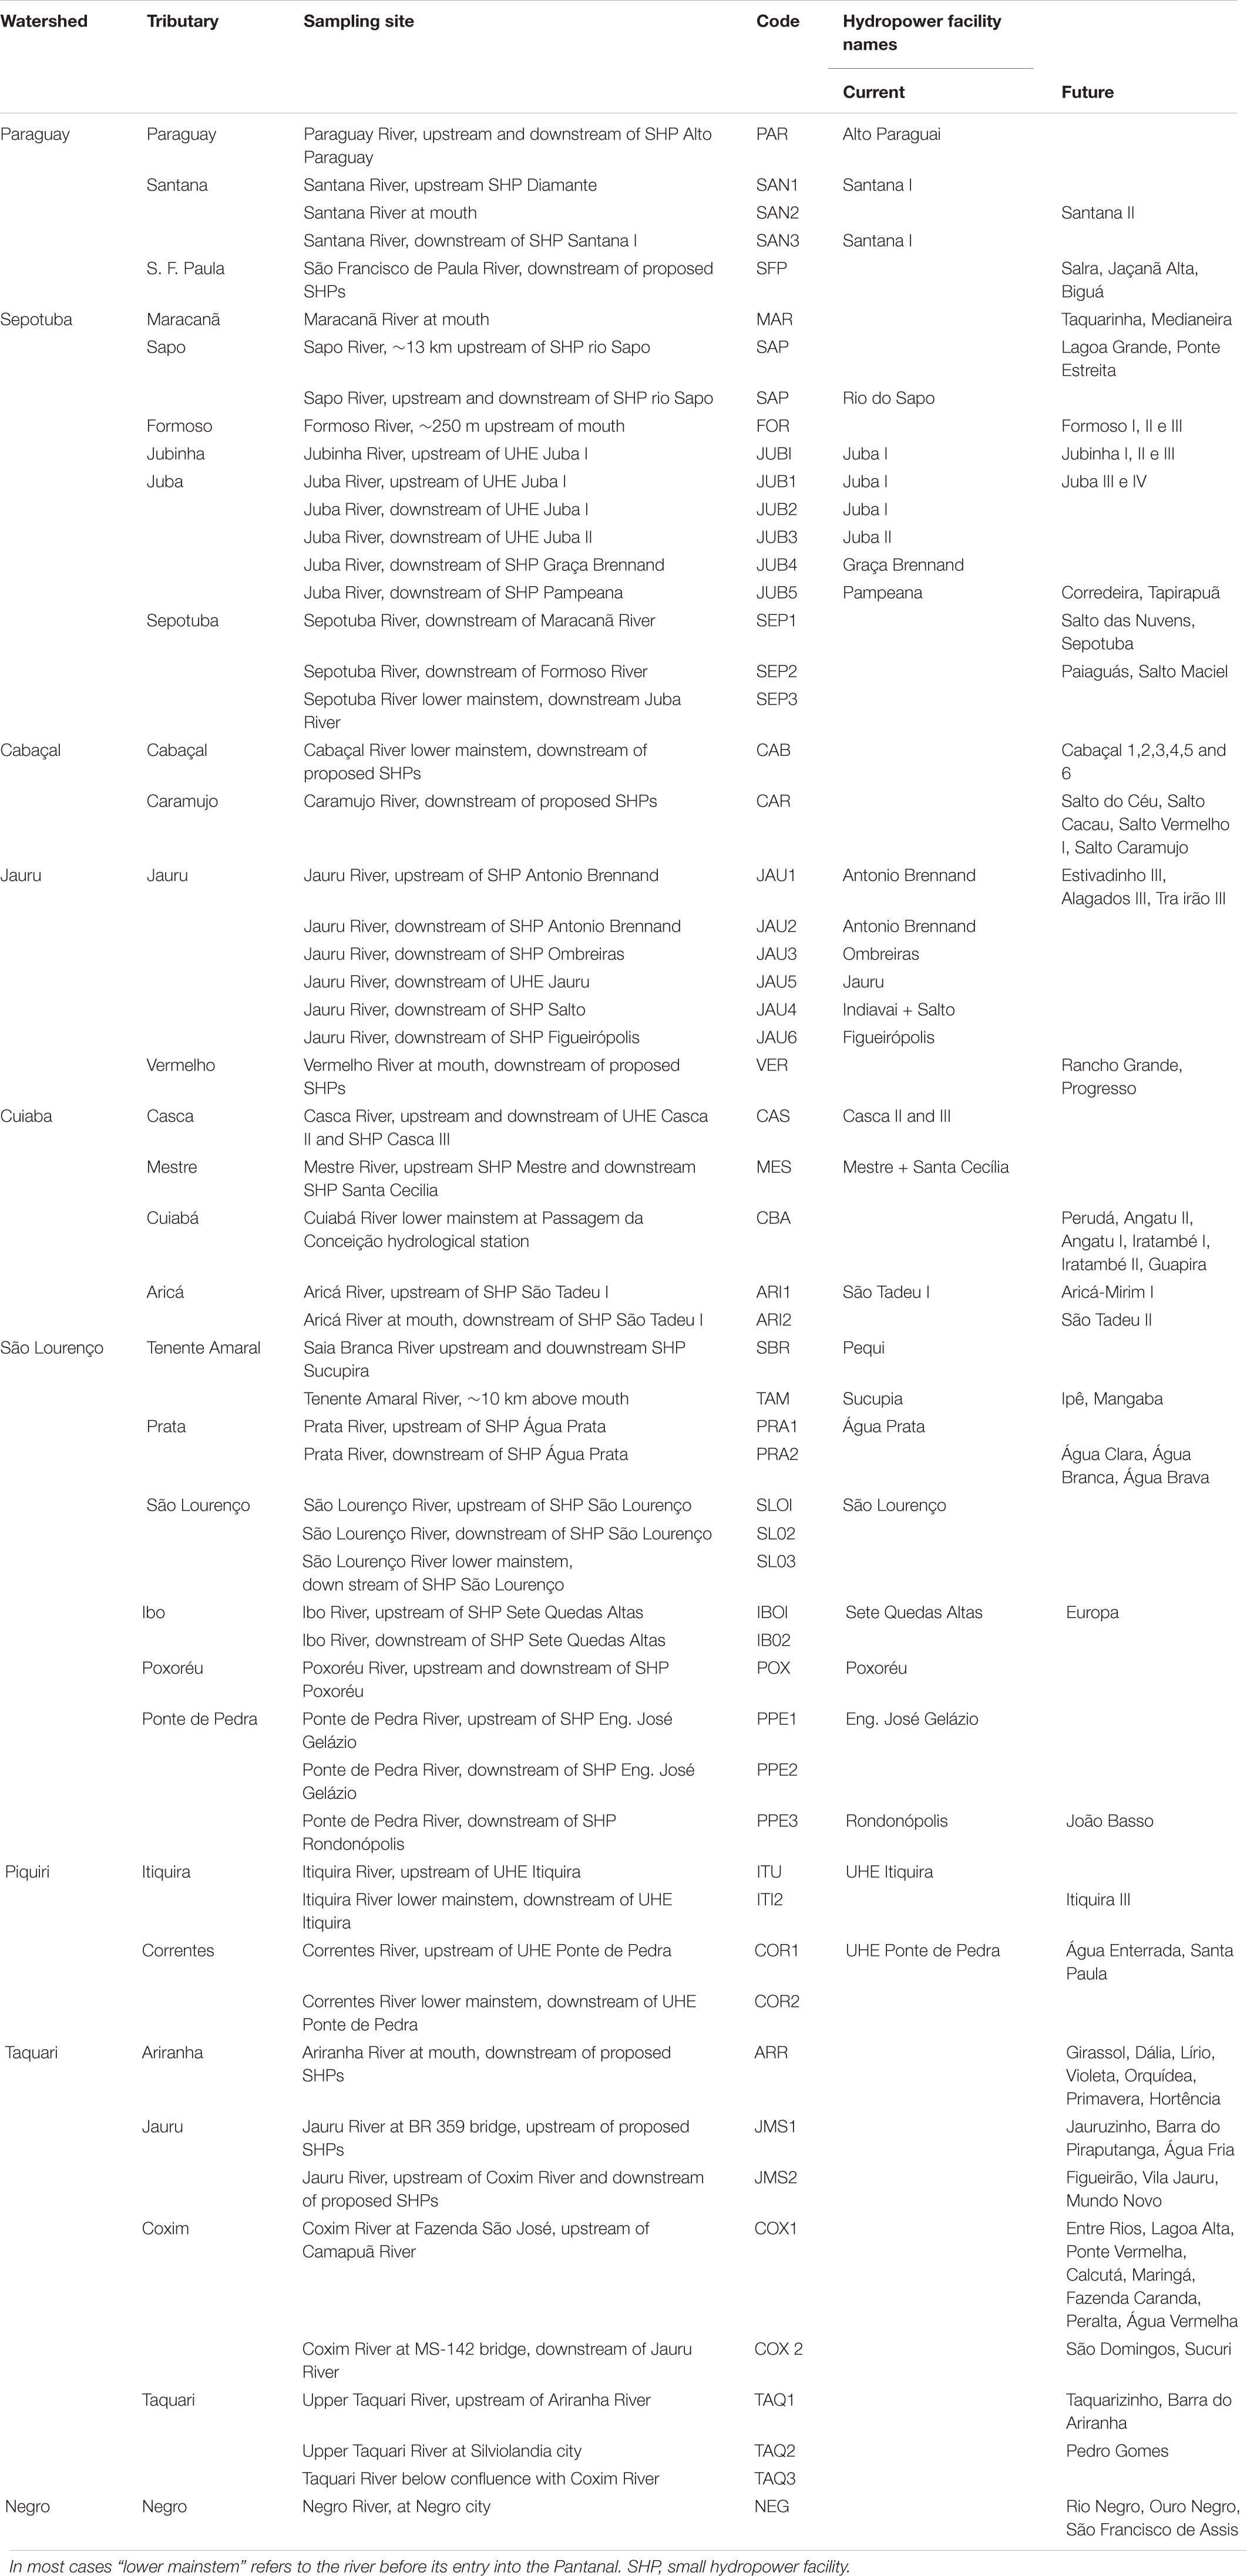
Table 1. List of sampling sites and hydropower facilities they pertain to, with codes for figures and tables.
Sample Collection and Analysis
Primary data on discharge, water quality including dissolved and suspended matter, and particulate nutrients in bedload transport above and below current hydropower facilities were collected on 13 dates spanning the wet and dry seasons from October 2018-May 2019 (some locations had fewer collection dates). The primary data set contains water quality data for upstream and downstream of 17 hydropower facilities (Supplementary Table S2). In addition, on 6–13 dates we sampled a number of rivers at locations close to where SHPs may be constructed in the future. At each sampling location we recorded the bathymetric profile of the channel cross-section and installed a staff gage unless one already existed there (a number of gages are maintained by hydropower companies). Discharge was measured across the channel profile on each sampling date using an acoustic Doppler current profiler (SonTek RiverSurveyor-M9) following the methods outlined in Agência National de Águas [ANA] (2019a, b). For nine rivers where discharge could not be measured—the Paraguai, Casca, Mestre, Saia Branca, Tenente Amaral, Caeté, Gloria, and Poxoréo rivers—a hydrological model provided estimates (Collischonn et al., 2019).
We collected depth- and flow-integrated water samples by the equal-discharge-increment method. Depth-integrated samples of the water column at each point were obtained with either a DH48 or DH50 integrating sampler depending on hydraulic conditions. Samples from each point were composited in a mixing bucket in volumetric proportion to the discharge contribution of each point, as determined from the profiler data using custom software from the Brazilian National Water Agency (Hidrosedimentos 2.0: Agência National de Águas [ANA], 2019a, b).
We analyzed the water samples for particulate organic carbon (POC), total phosphorus (TP), total nitrogen (TN), soluble reactive phosphorus (SRP), nitrate (NO3–), nitrite (NO2–), ammonium (NH4+), and specific conductance (corrected to 25°C), pH and turbidity. The sum of nitrate, nitrite, and ammonium is presented here as dissolved inorganic N (DIN). Chemical analyses were conducted at EMBRAPA Pantanal following (1) membrane-suppression ion chromatography for the major ions listed above, NO3–, NO2– and NH4+; (2) flow injection analysis with standard colorimetric methods for SRP, total N and total P (Wetzel and Likens, 2000); and (3) high-temperature combustion in an Elemental Analyzer for C in particulate matter collected on filters. Specific conductance, pH and turbidity were measured in the field during the sampling using a YSI sonde and a turbidimeter, both calibrated following manufacturers’ instructions.
Transported bedload material was collected using a Helley-Smith sampler (Carvalho, 2008). In this paper the bedload transport and its nutrient content are used in the calculation of nutrient fluxes. Bedload samples consisted of heterogeneous mixtures of fine inorganic sediment and coarse particulate organic matter. After drying at 105°C for 24 h, the latter fraction was removed by sieving, ground, and mixed back into the samples before subsampling for analysis of C and N content by high-temperature combustion in an Elemental Analyzer and of P content by extraction in hot acid (Andersen, 1975) followed by colorimetric analysis of SRP. More detail on sediment sampling and how hydropower facilities affect the balance between suspended and bedload sediment inflows and outflows is given in Fantin-Cruz et al. (2020).
Water Quality Data Compilation From Secondary Sources
The secondary data set contains water quality data for an additional 22 hydropower facilities, including 14 SHPs that we also sampled, and 8 that have only secondary data. Secondary data were used mainly in the modeling described later, although secondary data from upstream and downstream of 8 SHPs not sampled in this study are included in the graphical analyses together with a larger number of reaches with primary data. To assemble the secondary data set, we incorporated data on rivers that were available from reports submitted by hydropower companies to the environmental agency of the State of Mato Grosso (SEMA-MT). Out of about 3,000 water quality samplings in the secondary data set, we selected 401 and 452 samplings with TN and TP measurements that could be used mainly for the predictive model. Selection criteria included measurements of multiple water quality variables, close correspondence in timing of the upstream and downstream samplings, and at least five dates of sampling. For cases where more than one location was sampled to represent upstream or downstream water quality, the mean was taken, weighted by the relative discharge in the case of more than one tributary coming together above a facility. Reported values that were below the detection limit of the analyses were substituted with the detection limit concentrations. Further screening of the selected secondary data for quality assurance included:
1. Deletion of extreme outliers that became apparent based on comparison with existing published data of the range of chemical characteristics of rivers in the region (Hamilton et al., 1997; Oliveira et al., 2019) and state environmental agency reports.
2. Deletion of ion concentrations that were not commensurate with conductance measurements (this was the case for a few very high concentrations of nitrate and ammonium).
3. Deletion of nutrient concentrations in cases where total dissolved concentrations exceeded total (dissolved plus particulate) concentrations.
Data Analysis
The effects of current hydropower facilities on TN, TP, and POC concentrations and transport were evaluated by comparing median concentrations upstream and downstream of each facility, based on a combination of primary data (N = 13 dates in most cases) and secondary data (variable numbers of sampling dates). Transport was calculated as the median concentration times discharge, averaging the discharge estimates above and below each SHP location to avoid potential spurious results caused by the uncertainty inherent in discharge measurements as well as by short-term (sub-daily) fluctuations imposed by the hydropower facilities (hydropeaking: Figueiredo et al., in review). Observed ratios of upstream to downstream concentrations were grouped into classes based on the percentage change in either direction (i.e., retention or release), similar to the sustainability boundary approach suggested by Richter et al. (2012) for analysis of flow regime alterations in river systems that lack detailed knowledge of the impacts of altered flows. Ratios of <10% were defined as undetectable changes, 10–20% as moderate, and >20% as high alterations. In addition to comparing the median concentrations and transport rates for all sampling dates combined for each study reach, we conducted statistical analyses of the changes in concentrations observed across all individual sampling dates in each reach using a one-sample t-test for which the null hypothesis was zero change. Analyses were conducted after log10 transformation of the concentration changes to improve normality.
Prediction of Impacts of Future Hydropower Facilities
Artificial neural networks (ANNs) were developed to predict the impacts of future hydropower facilities on TN and TP (this study) as well as suspended sediment concentrations (Fantin-Cruz et al., 2020). As one of the most commonly used artificial intelligence tools, ANNs are well suited to model phenomena subject to controls that are complex, incompletely understood, and likely non-linear (American Society of Civil Engineers [ASCE], 2000). The ANN model architecture was a three-layer feedforward network with a non-linear (unipolar sigmoid) activation function (Supplementary Figure S1), similar to ANNs that have been applied to study floodplain inundation in the Pantanal (Fantin-Cruz et al., 2011) as well as elsewhere (Dawson et al., 2006). The ANN models were trained with a data set representing 30 reaches containing SHPs (including primary and secondary data). The back-propagative algorithm (Rumelhart et al., 1986), along with training acceleration techniques (Vogl et al., 1988) as well as other needed functions, were custom programmed in the Matlab R2012b environment. Overfitting was avoided using the cross-validation technique (Hecht-Nielsen, 1989).
For cross-validation training, the data were divided into three samples (approximately 2/3 for training, 1/3 for validation, and 1/3 for verification), using a systematic sampling method to provide a representative distribution of the 30 locations for all samples. The extreme values (maximum and minimum) of all variables were included in the training samples and all input data of the future hydropower facilities were within the domain of the trained ANN, ensuring that model predictions were within the ranges of the training data.
The complexity of the ANNs (number of neurons in the intermediate layer) was defined by the architecture search with the lowest possible complexity that still had the same approximation and generalization capacity of a purposely oversized ANN that was trained without overfitting. These approximation and generalization capacities were verified by the performance of the application to the validation sample, since the verification sample, by definition, cannot participate, neither in training nor in the definition of the ANN architecture (Hecht-Nielsen, 1989).
In the present study, input variables that were considered for the ANNs included contributing watershed area, reservoir area and volume, soil classification (11 classes in the contributing watersheds: Empresa Brasileira de Pesquisa Agropecuária [EMBRAPA], 2018), land use and cover (8 classes: Empresa Brasileira de Pesquisa Agropecuária [EMBRAPA], 2015), upstream concentrations of TN or TP, and the potential of contributing watersheds to yield nitrogen and phosphorus to rivers. Sufficient information was available for 80 of the 138 potential future hydropower facilities.
The potential watershed yields of organic N and P to river systems were estimated from the Soil and Water Assessment Tool (SWAT), the full results of which are posted online (Mingoti et al., 2020). Details of this SWAT model are presented by Neitsch et al. (2011) and Arnold et al. (2012). The SWAT model was run for each watershed for the year 2017 using spatial data on climate, topography, soils, and land use and cover. Annual and monthly inputs were estimated for the contributing watersheds above each current and future hydropower facility. Watershed yields of organic N and P at each hydropower facility showed considerable spatial variability, ranging from 0.02–5.6 and 0.02–0.93 t ha–1 y–1, respectively. Watershed yields of N and P were highest in the Taquari, Coxim, and Jauru-MS watersheds, followed by the Correntes, and were relatively low in the northern watersheds.
We developed independent ANN models to predict changes in the concentrations of TN, TP and suspended sediments (the latter presented in Fantin-Cruz et al., 2020). The ANN models were trained with concentrations of TN (577 records) and TP (622 records) measured upstream and downstream of 30 current hydropower facilities. Pearson linear correlations between input and output variables indicated the best predictive variables for each model. Overall performance of the ANNs was evaluated by the Nash-Sutcliffe model efficiency coefficient.
Results
River Discharge and Chemistry
Discharge and water chemistry were variable among the river systems. The rivers with current and future hydropower facilities that are analyzed in this study range in discharge, based on means for the available periods of record, from 0.7 to 230 m3 s–1, with the majority (∼50%) lower than 25 m3 s–1 (Supplementary Tables S3, S4). The rivers with the highest discharges include the lower mainstems of the Taquari, Cuiabá and Sepotuba rivers, close to their entry into the Pantanal. The tributaries with the lowest discharges include the Upper Paraguay, Santana, Maracanã and Sapo rivers in the Paraguay River system, the Mestre river in the Cuiabá River system, the Tenente Amaral, Prata and Ibó rivers in the São Lourenço River system, and the Negro River.
Among the 25 current hydropower facilities that we studied, 14 are on rivers with discharges below 50 m3 s–1, and the remaining 11 are on rivers with discharges between 50 and 100 m3 s–1 (Supplementary Table S4). Among the 80 future hydropower facilities that we modeled in this study, all of which would be SHPs (Figure 1A and Supplementary Table S5), the majority (52 SHPs, or 65%) would be on rivers with discharges below 25 m3 s–1, with 17 on rivers between 25 to 100 m3 s–1, and 11 on rivers > 100 m3 s–1. The reaches with proposed SHPs on the Taquari, Cuiabá, and Sepotuba rivers include the highest discharges among the rivers studied here.
Most of the rivers in the Upper Paraguay River basin carry water that is slightly to moderately acidic and low in dissolved ions, as indicated by pH values ranging from <5–7 and specific conductance values < 20 μS cm–1 (Supplementary Table S3). Rivers of higher ionic strength include the Jauru in Mato Grosso State (Jauru-MT), Cabaçal, Cuiabá, Miranda, and Aquidauana rivers, with pH values in the range of 7–8 and conductance in the range of 50–200 μS cm–1.
Nutrient Concentrations and Ratios
Concentrations of TN and TP were correlated in rivers draining to the Pantanal (Figure 2 and Supplementary Table S3). TN concentrations were similar between the dry and wet seasons, but TP concentrations tended to be higher in the wet season (Supplementary Figure S2). The Taquari River system, including the Taquari, Jauru-MS, and Coxim rivers, tended to have the highest concentrations of both TN and TP in both the wet and dry seasons. The ratios of TN:TP indicate that aquatic primary production in downstream waters can variably be either N or P limited or co-limited by N and P. Molar ratios of TN:TP in the range of 20–50 (equivalent to mass ratios of 9.0–22.6 and depicted as dotted lines in Figure 2) are indicative of potential N and P co-limitation (Guildford and Hecky, 2000). The TN:TP ratios for some rivers were higher in the dry season, causing them to shift from likely P limitation or N and P co-limitation in the wet season toward likely co-limitation or limitation by N in the dry season.
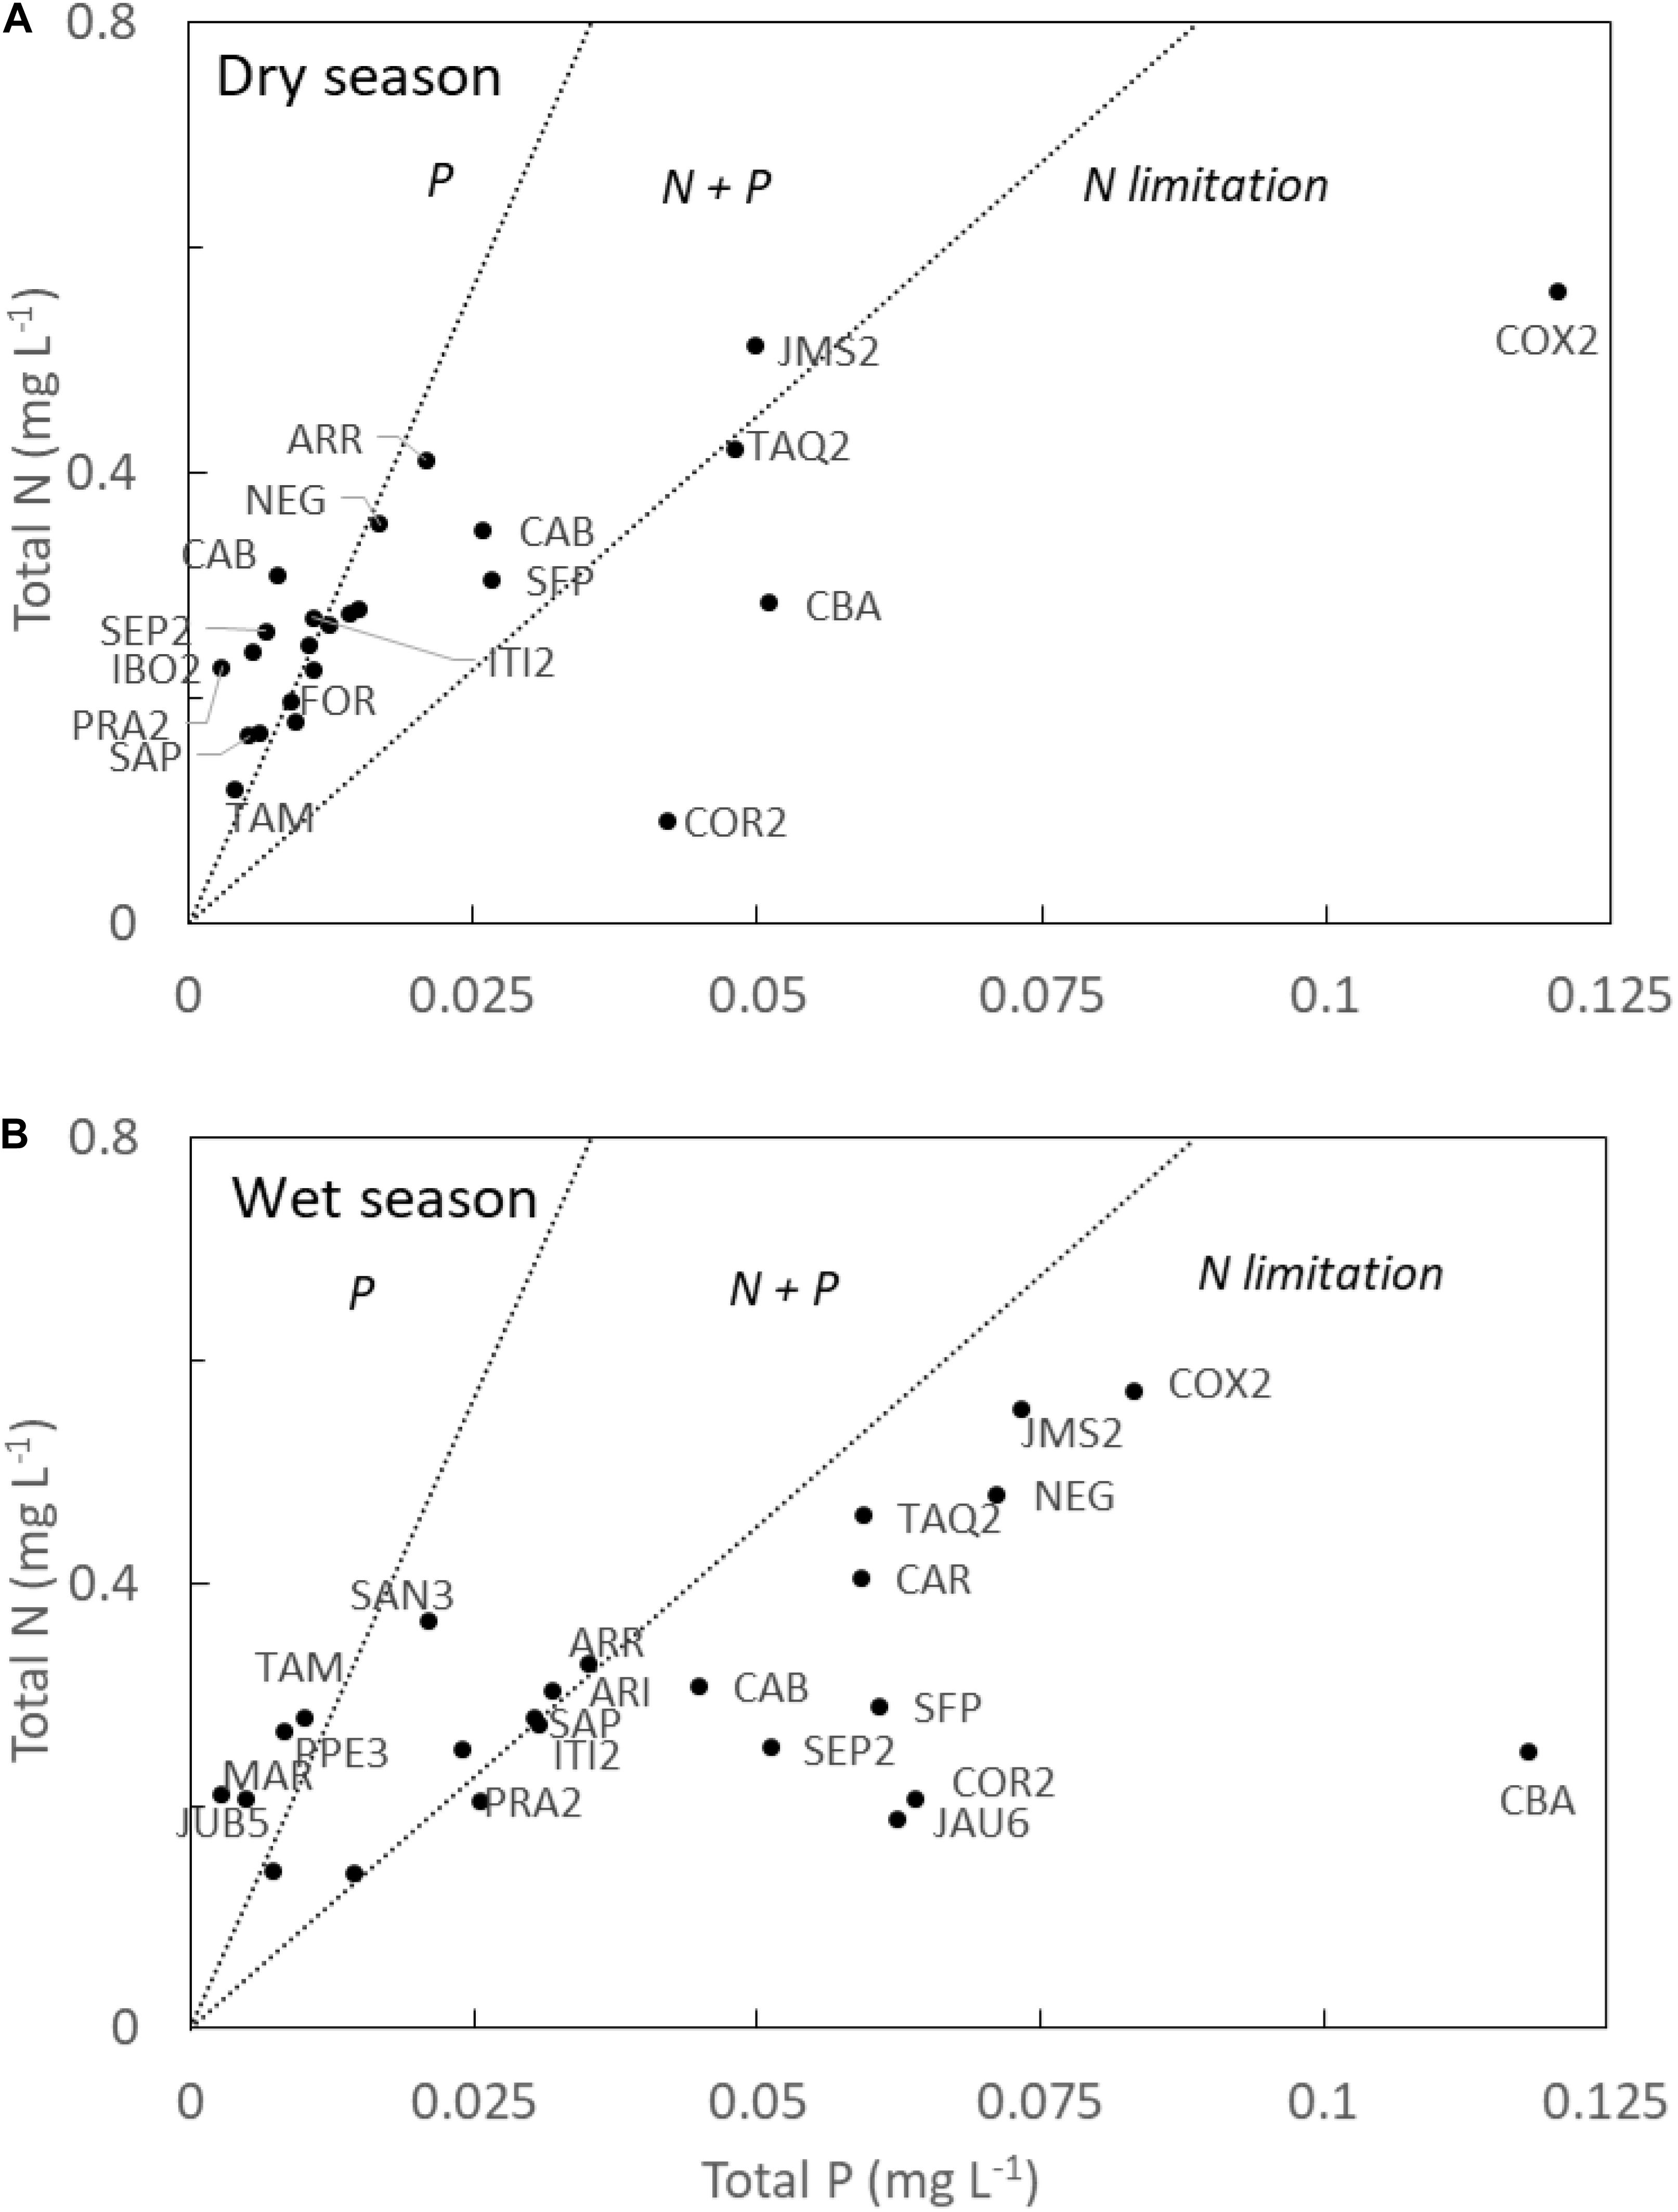
Figure 2. Concentrations of TN and TP in rivers draining to the Pantanal with dashed lines delimiting the zone of likely co-limitation by N and P during the dry season (A) and wet season (B). In reaches containing hydropower facilities (13 of the 24 locations), the data shown here are downstream of the facilities. Observations were divided into seasons based on mean monthly rainfall, with May-October and November-April as the dry and wet seasons, respectively. Codes indicate the sampling points detailed in Table 1. The figure includes both primary and secondary data and reaches with current hydropower facilities as well as reaches targeted for future facilities.
Riverine Transport of Nutrients to the Pantanal
Transport of both nitrogen and phosphorus by rivers from the upland watersheds to the Pantanal is dominated by suspended particulate forms, which compose nearly all of the TP and often the majority of the TN (Figure 3). Rivers with high rates of transport of TN and TP tend to also have high rates of POC transport, reflecting their higher loads of suspended particulate organic matter. Nutrient transport in the water column is a function of both discharge rates and concentrations, with discharge exerting primary control, most strongly for TN (Figure 4). The most important rivers bringing N and P to the Pantanal among those studied here are thus the largest ones in terms of discharge: the Cuiabá, Taquari, Sepotuba, São Lourenço, and Correntes rivers. Bedload transport of particulate N, P, and C was small (<1% in most cases) relative to transport in the water column (Figure 5). Rivers with the highest absolute rates of bedload transport of TN, TP and POC include the Taquari, Itiquira, São Lourenço, and Ariranha, as well as the Formoso in the case of TN and POC but not TP.
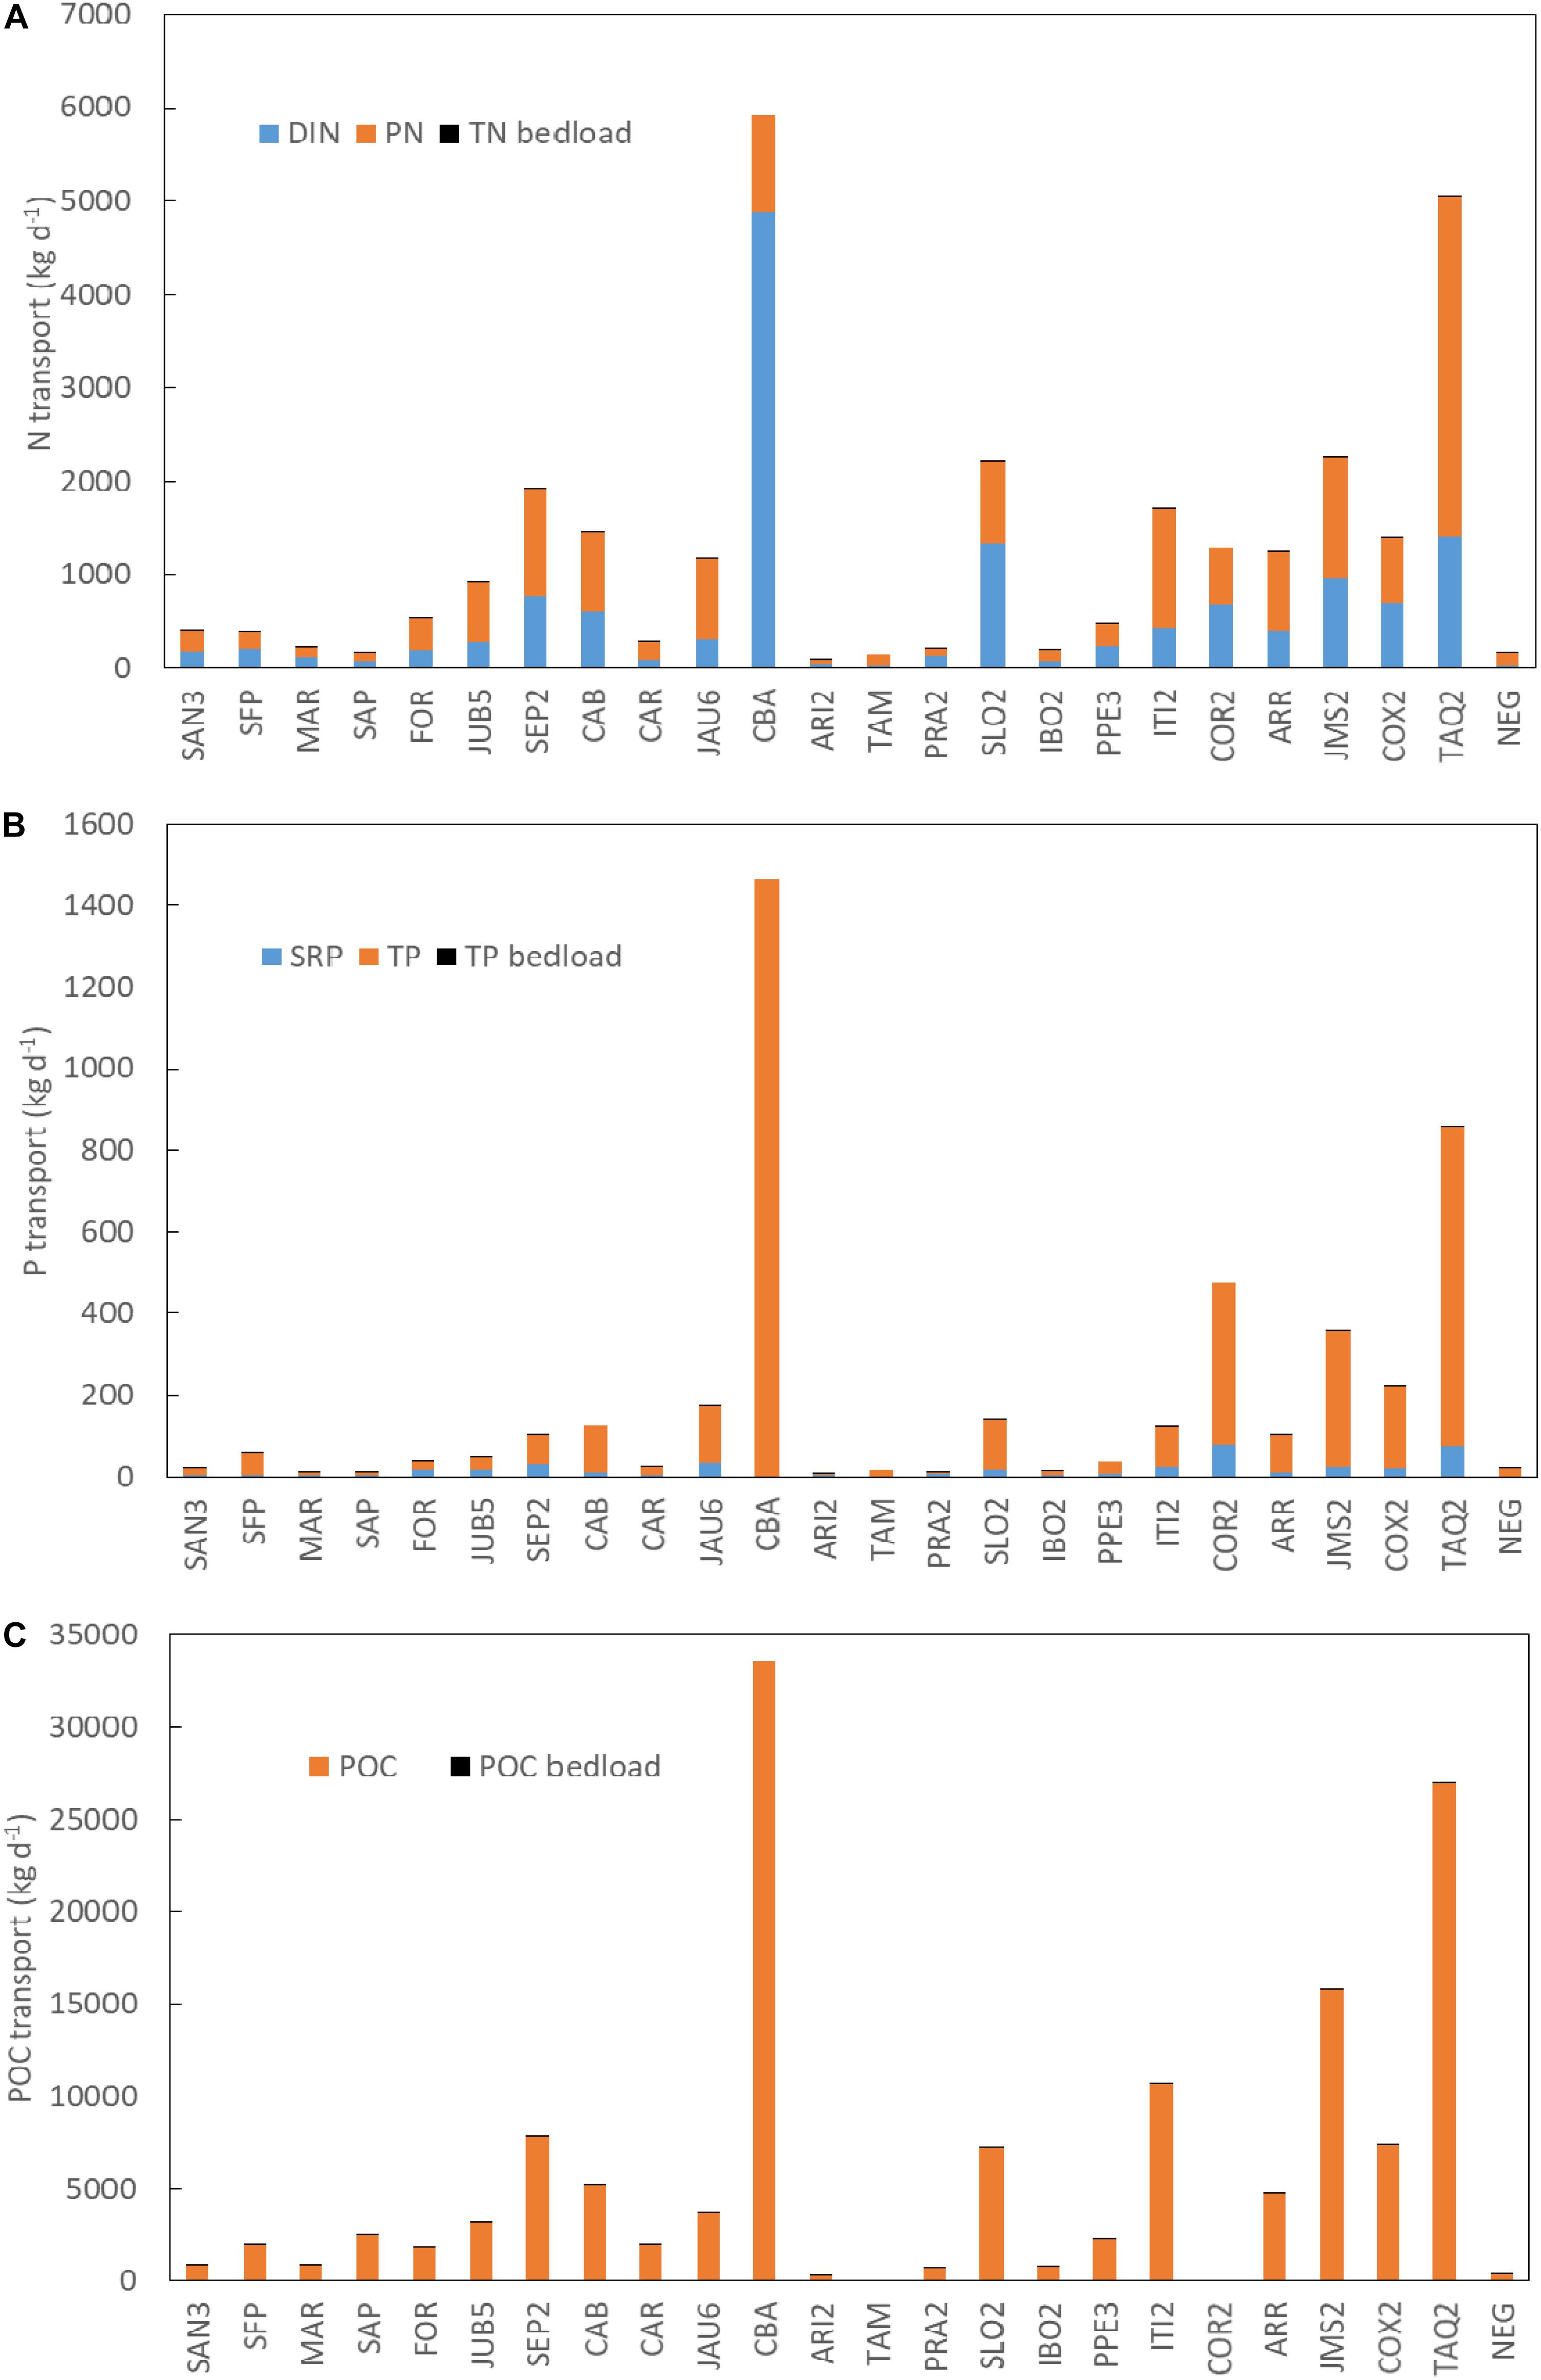
Figure 3. Riverine transport of TN (A), TP (B), and POC (C), with bars divided into dissolved, suspended, and bedload fractions, and of suspended and bedload POC. DIN is the sum of nitrate and ammonium. Bedload estimates, which are hardly large enough to be visible where they exist, were not made for sites CAB, TAM, PPE3, and COR2. Codes indicate the sampling points detailed in Table 1. The figure includes both primary and secondary data and reaches with current hydropower facilities as well as reaches targeted for future facilities.
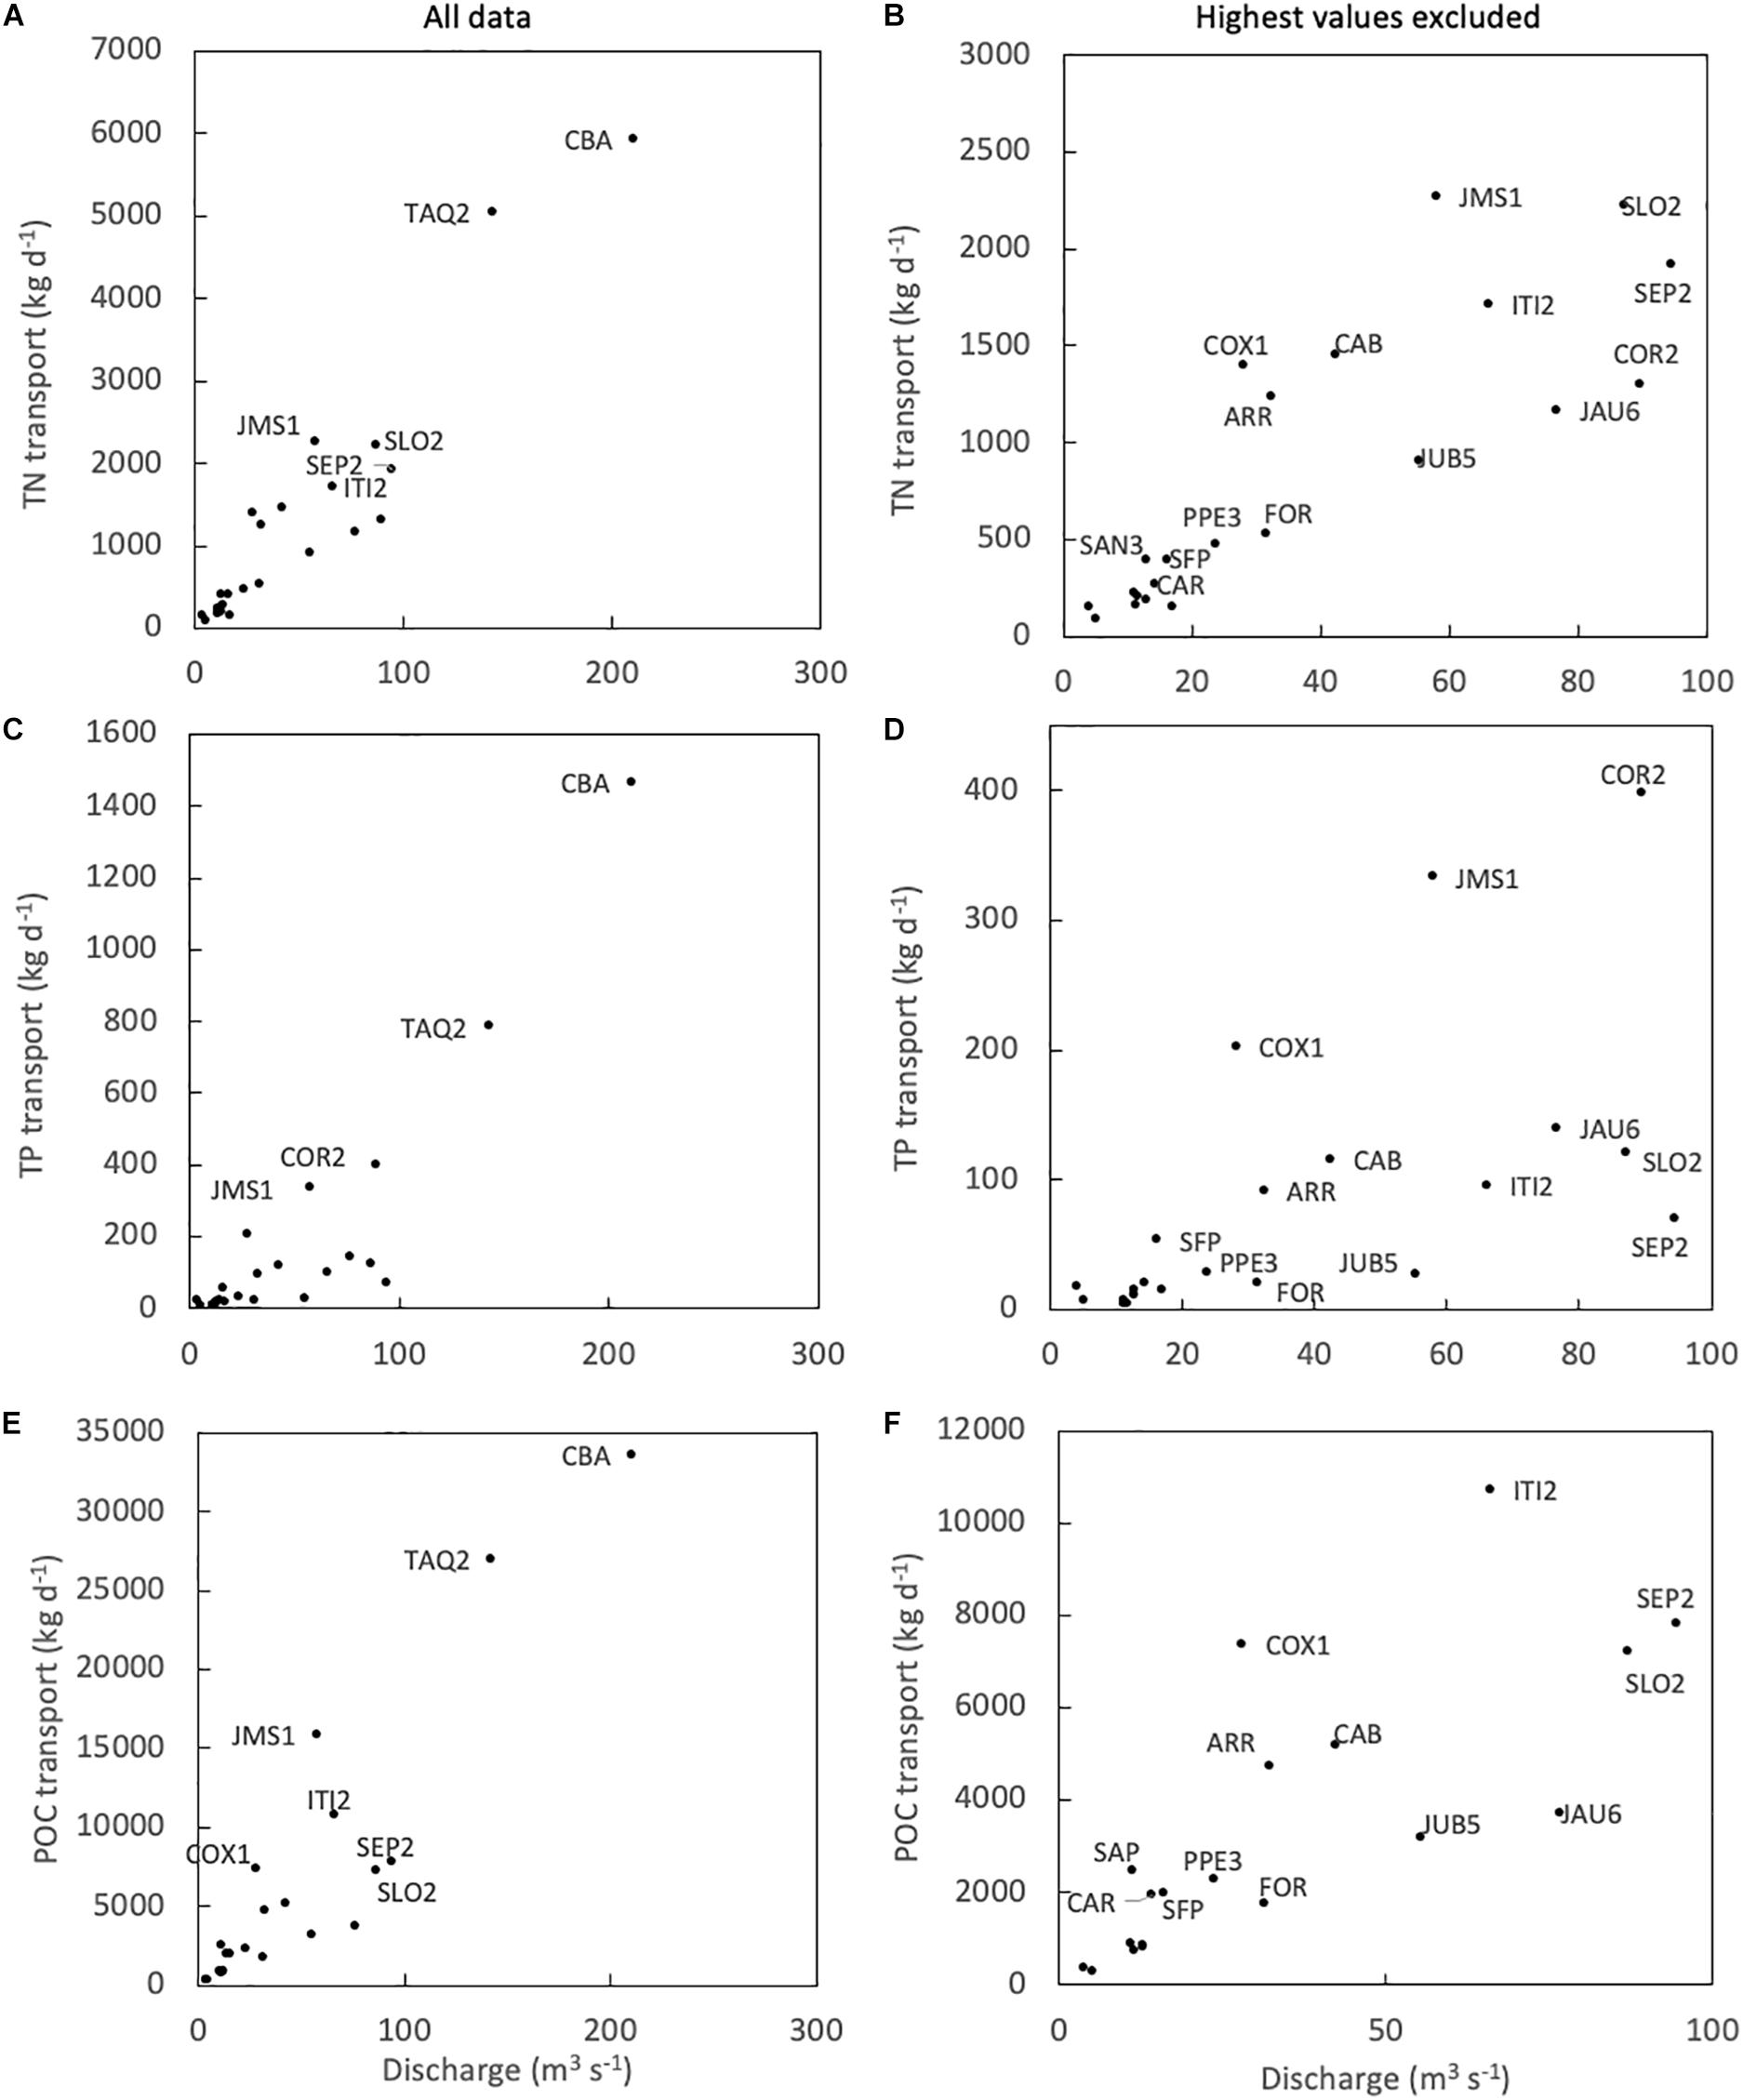
Figure 4. Water-column transport of total nitrogen (TN), total phosphorus (TP), and particulate organic carbon (POC) in relation to river discharge. (A) TN, all data; (B) TN, rivers with discharge < 100 m3 s–1; (C) TP, all data; (D) TP, rivers with discharge < 100 m3 s–1; (E) POC, all data; (F) POC, rivers with discharge < 100 m3 s–1. Codes indicate the sampling points detailed in Table 1. The figure includes both primary and secondary data and reaches with current hydropower facilities as well as reaches targeted for future facilities.
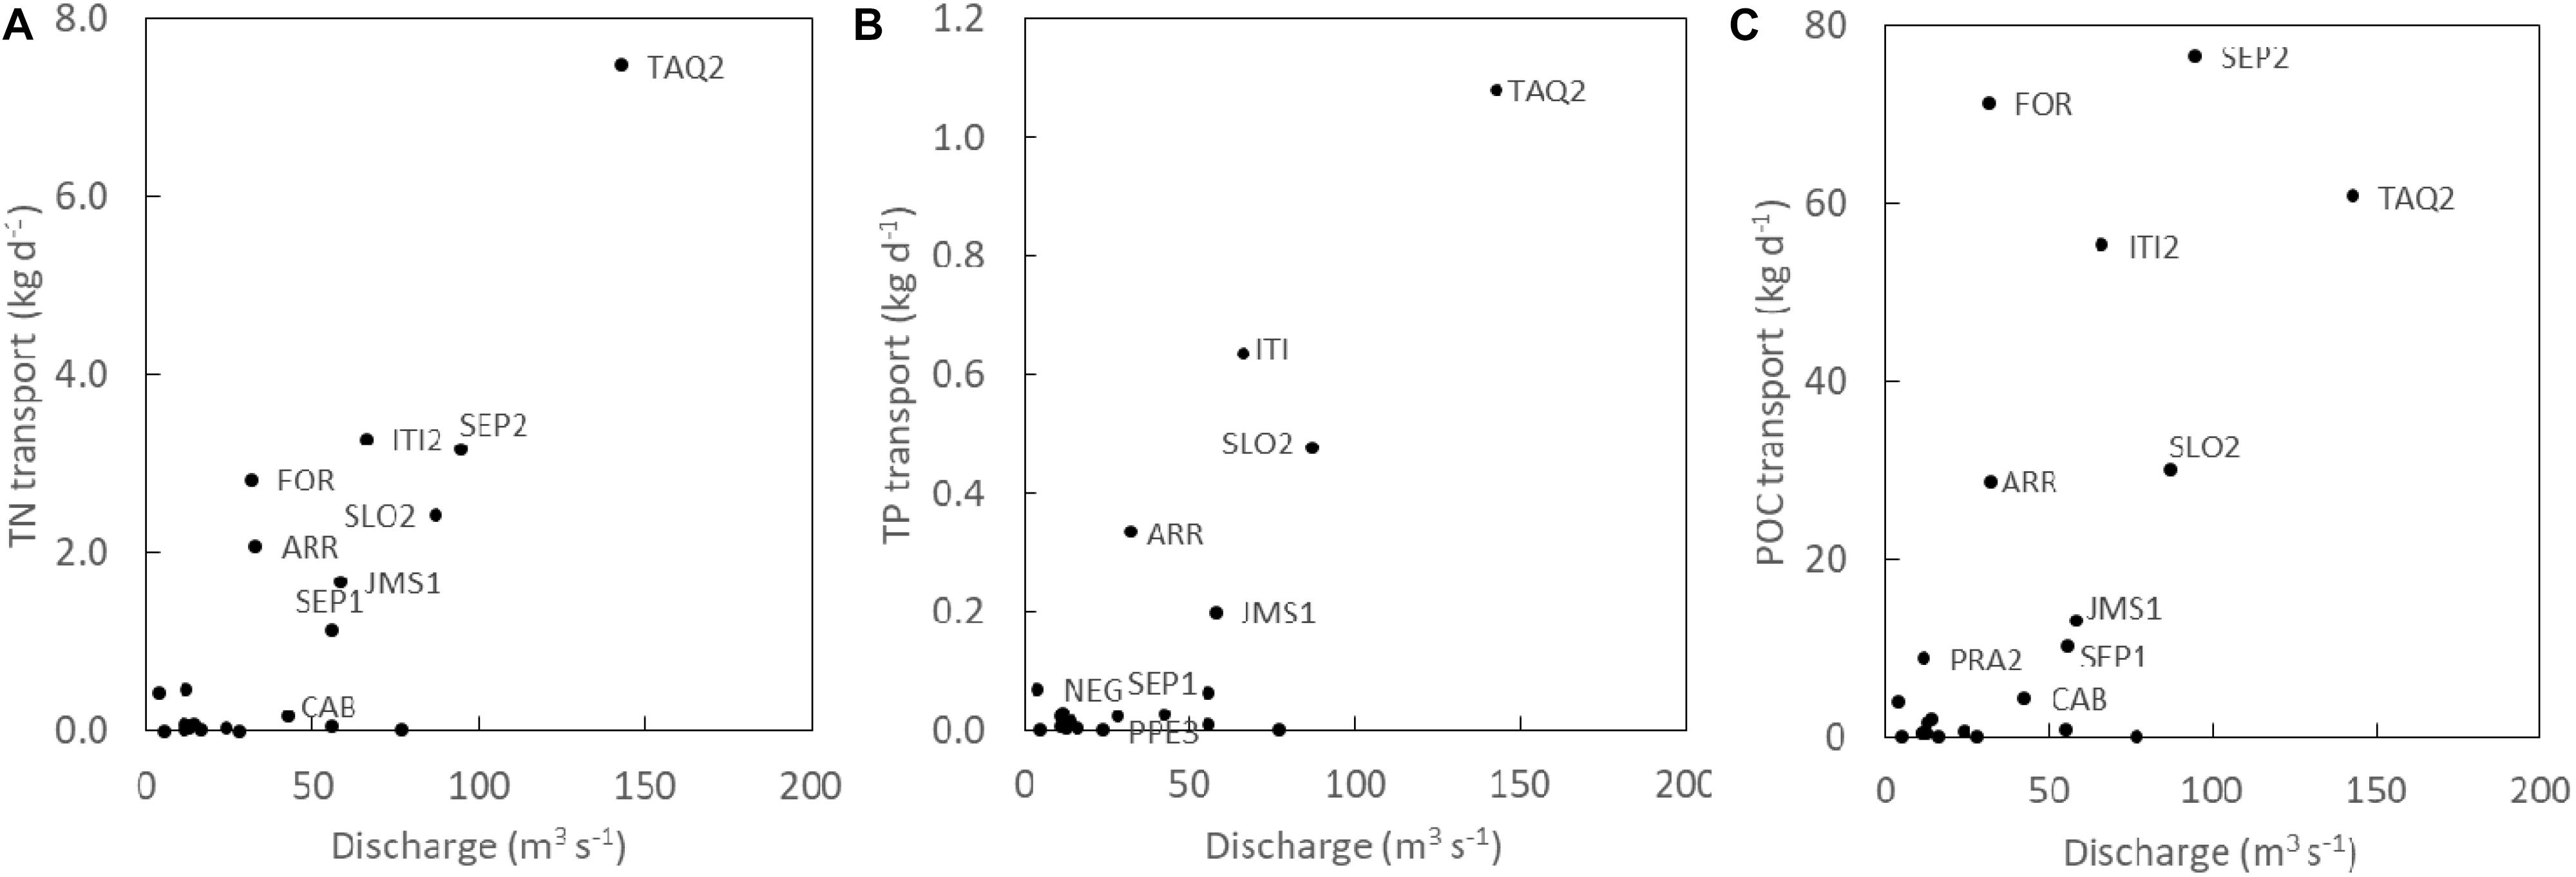
Figure 5. Bedload transport of (A) total nitrogen (TN), (B) total phosphorus (TP), and (C) total carbon (TC) in relation to river discharge. Codes indicate the sampling points detailed in Table 1. The figure includes primary data for reaches with current hydropower facilities as well as reaches targeted for future facilities.
Effects of Current Hydropower Facilities on Nutrient Transport
Concentrations and transport of TN, DIN, TP, and POC in the water column upstream and downstream of 25 current hydropower facilities are compared in Figure 6 and Supplementary Table S4. The changes between upstream and downstream are presented as both concentrations, which bear on the productivity of downstream waters, and rates of transport (i.e., kg d–1), which bear on the overall nutrient supply from the upland watersheds to the Pantanal. For a given project, the ratios between concentrations and transport covary because we assumed that discharge did not change, and hence we used the mean of upstream and downstream discharge measurements to calculate transport. We do not consider bedload nutrient transport here because it was almost always a small proportion of total transport (Figure 3).
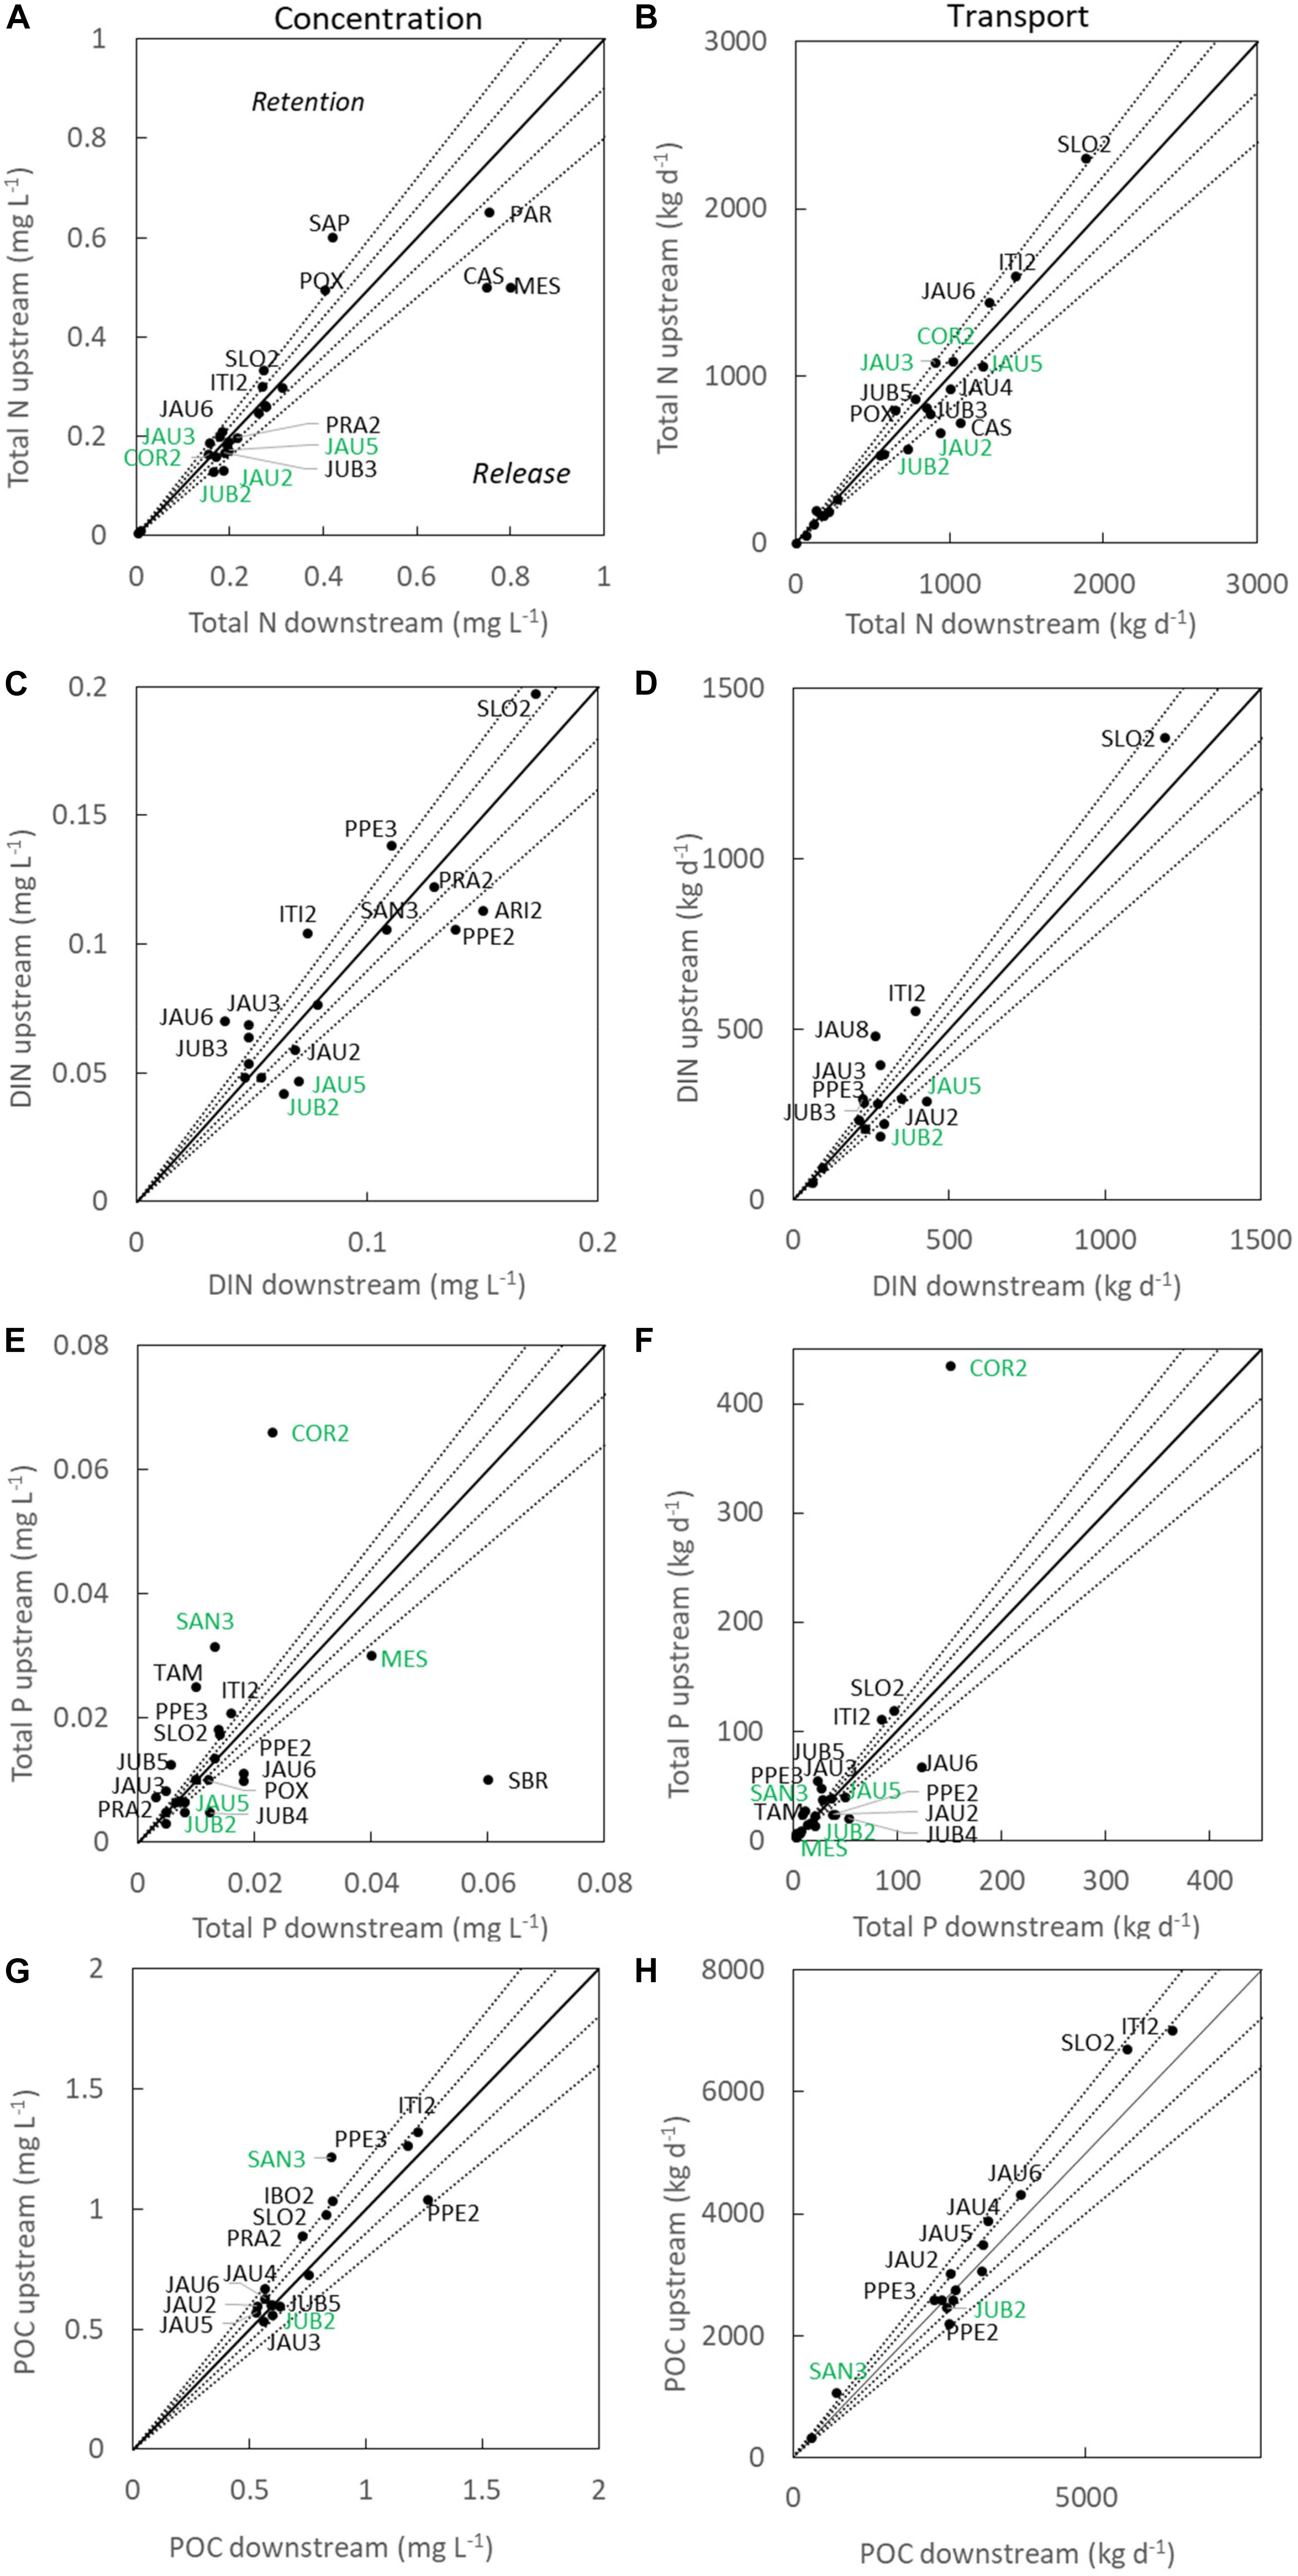
Figure 6. Comparisons of changes in concentrations and transport between upstream and downstream of current hydroelectric facilities based on primary data collected in this study as well as secondary data. (A,B) total nitrogen (TN) concentrations and transport, (C,D) dissolved inorganic N concentrations and transport, (E,F) total phosphorus (TP) concentrations and transport, and (G,H) particulate organic carbon (POC) concentrations and transport. Solid line shows the line of parity and dashed lines show bounds of ±10 and ±20% around that line; points above the line indicate net retention and those below indicate net release between the upstream and downstream sampling points. Upstream:downstream ratios that deviate considerably from 1:1 are identified with the codes shown in Table 1; codes in green font indicate cases where the statistical analysis of the concentration changes across all individual sampling dates showed significant (p < 0.05) differences from zero. Both primary and secondary data are included in the figure, and all data are in Supplementary Table S4.
Comparison of median values shows that there is no consistent trend for either nutrient release or retention in reaches containing current hydropower facilities, with ratios falling approximately equally on either side of the 1:1 line for TN, DIN, TP, and POC (Figure 6). Some reaches show upstream: downstream ratios for TN and TP that deviate considerably (>20%) from the 1:1 line, but with no correspondence in which facilities deviate between the two variables. Seven of 25 hydropower facilities deviated from 1:1 by >20% for TN, 9 of 17 deviated by >20% for DIN, 17 of 25 deviated by >20% for TP, and 3 of 17 cases deviated by >20% for POC. The reaches with the largest deviations in concentrations of TN and TP from the 1:1 line are mainly facilities on smaller river systems (Santana, Sapo, Casca, Saia Branca and Mestre rivers). The greatest reduction in TP concentration and transport was observed where the Correntes River flows through the Ponte de Pedra reservoir (COR2), as well as the PCH São Lourenço on the river of the same name; these are two of the largest reservoirs included in this study.
Statistical analysis of the concentration changes across all individual sampling dates for each hydropower facility using one-sample t-tests showed significant (p < 0.05) differences from zero for a minority of reaches (marked with green in Figure 6), reflecting the high variability in the results. Differences were significant for 5 of 25 reaches for TN (20%), 2 of 17 for DIN (12%), 5 of 25 for TP (20%), and 1 of 17 (6%) for POC. The percentage of significant results for TN and TP is much larger than could be expected by chance alone. The reaches with significant changes in TN and/or TP across all sampling dates are on the Jauru, Juba, Correntes, Santana, and Mestre river systems.
Predicting the Impacts of Future Hydropower Development
Among the potential ANN input variables, by far the most significant predictor of TN and TP retention were the measured upstream concentrations, accounting for 74 and 57% of the predictive capability of the models, respectively (Supplementary Figure S3). Less important but still significant were watershed nutrient yields from the SWAT model, land use (n = 10 classes), watershed area, and reservoir area and volume. Soil classes were not significant predictors for TN or TP. The performance of the ANNs was satisfactory, as indicated by the Nash-Sutcliffe model efficiency coefficients. The coefficients for the TN model were 0.847 for training and 0.823 for verification, and for the TP model they were 0.712 and 0.606, respectively.
Predicted impacts of future hydropower facilities on TN concentrations and transport showed a diversity of effects ranging from considerable retention to little effect to considerable release (Figure 7). The greatest TN retention in terms of both concentrations and transport is predicted for the multiple future SHPs on the Coxim and Taquari rivers, which are presently undammed and carry relatively high TN concentrations and loads. In contrast, future SHPs on the Jauru-MS (coded as JMS2), Juba, and Itiquira rivers, which carry TN concentrations on the low end of the range, are predicted to release more TN than they retain.
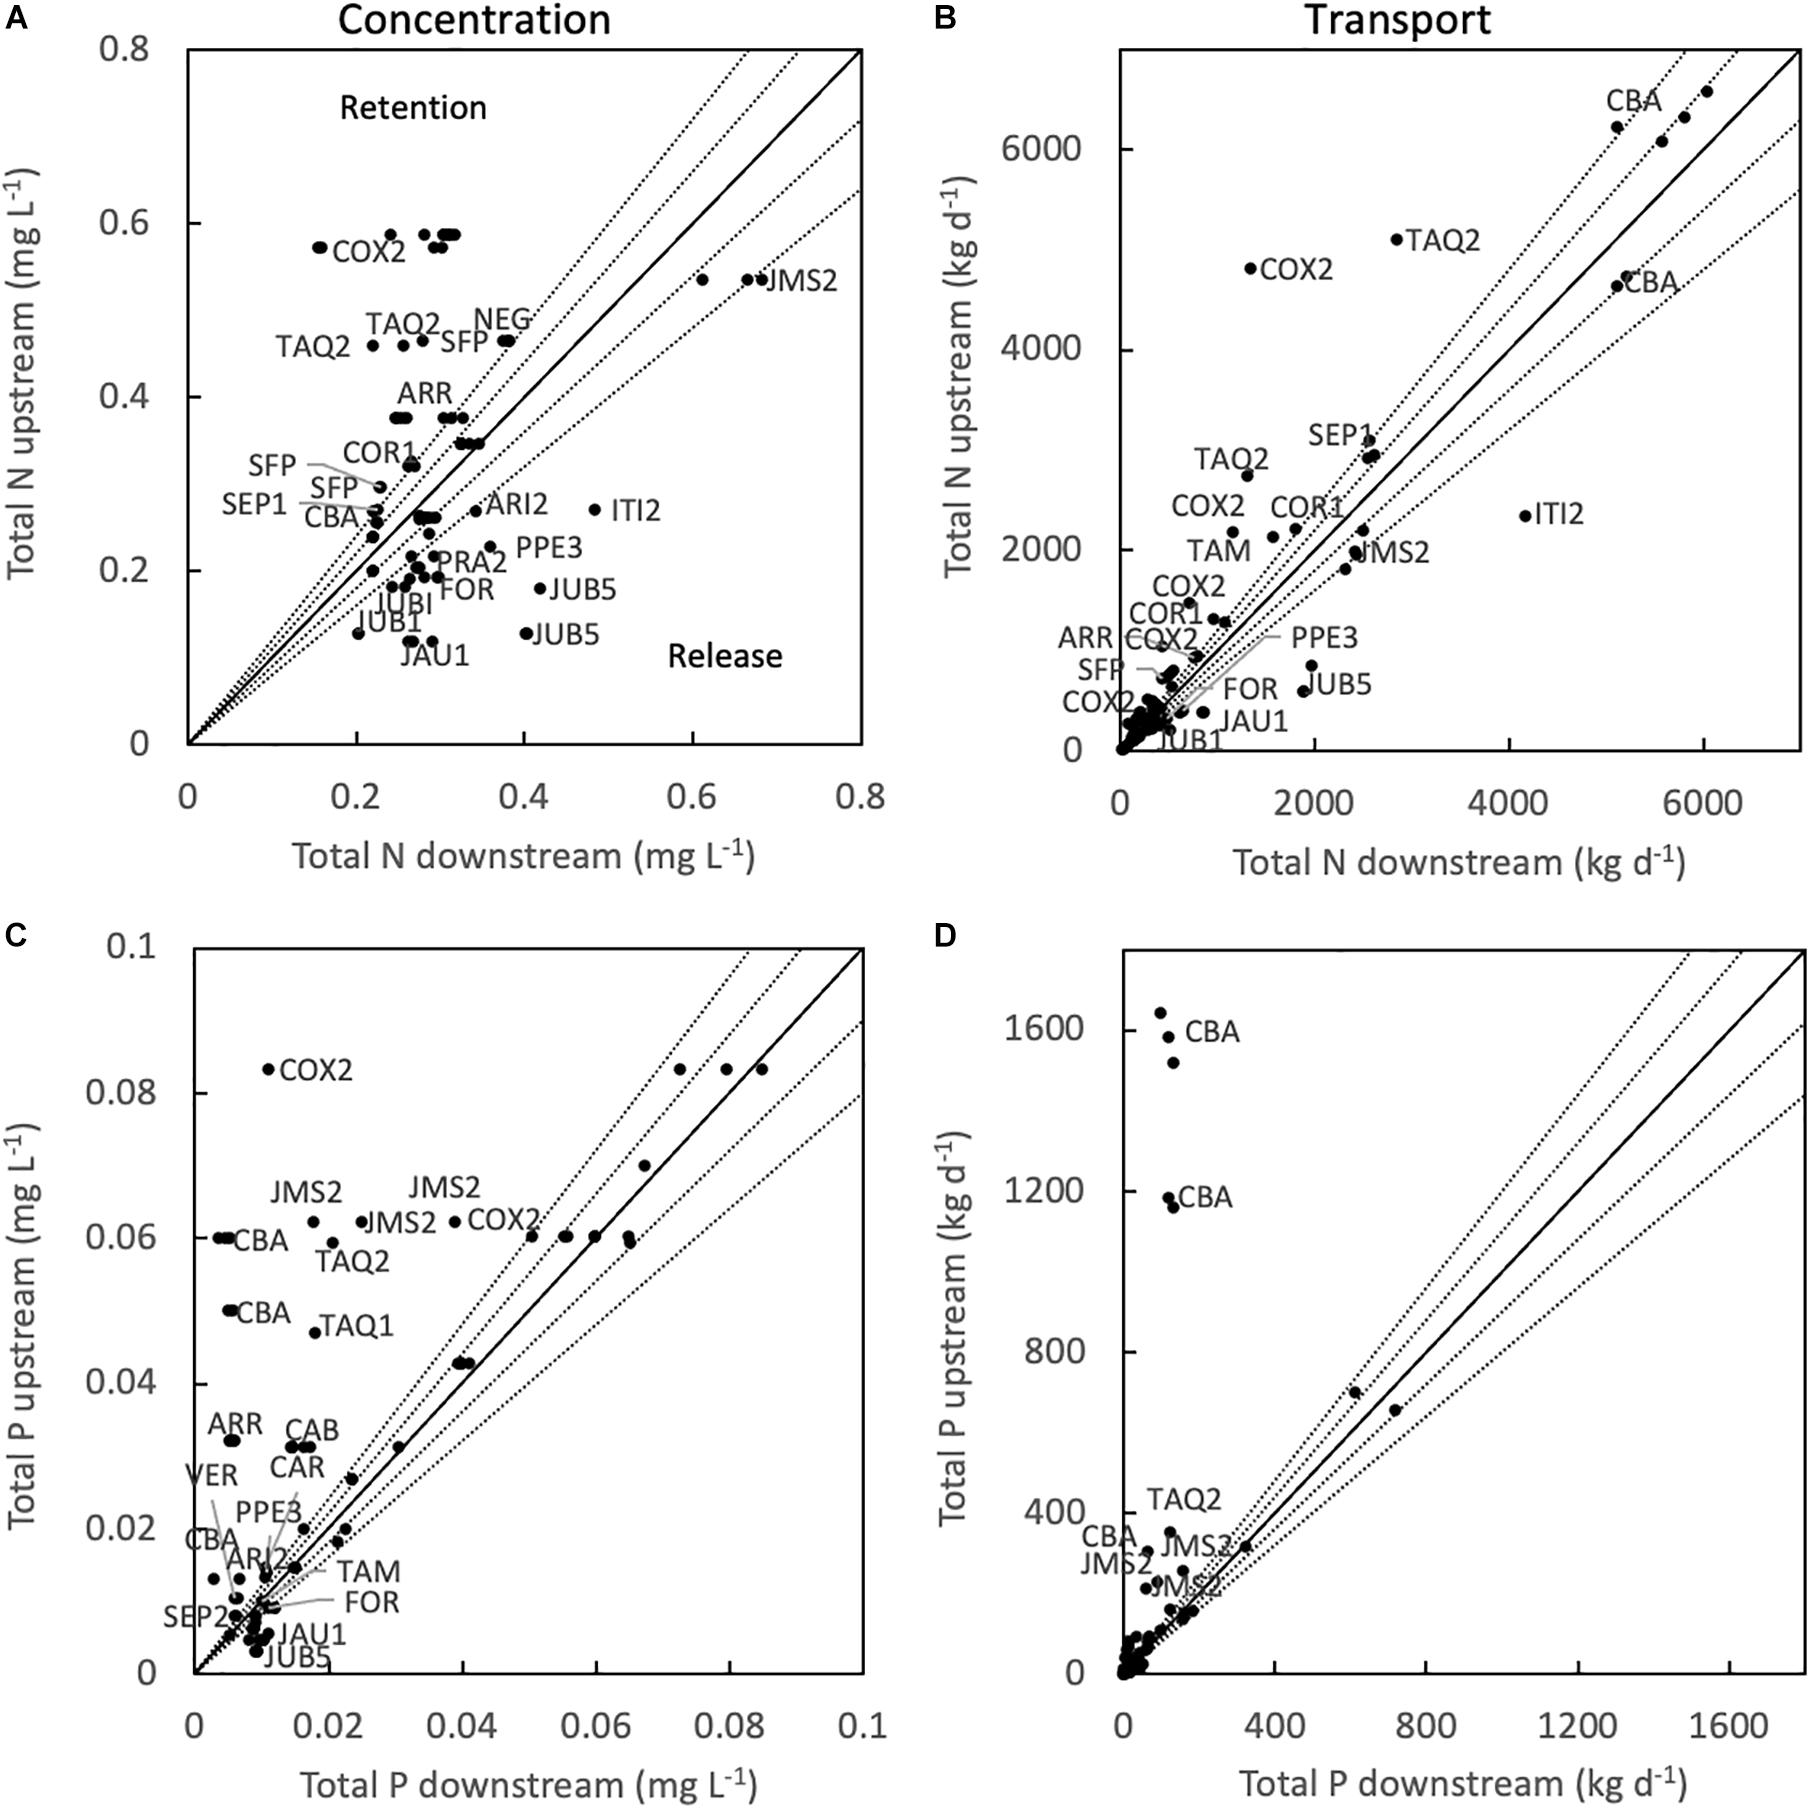
Figure 7. Comparisons of neural network model predictions of changes in total nitrogen and phosphorus between upstream and downstream of future hydroelectric facilities, with river systems labeled by codes in Table 1. (A) Total N concentrations, (B) total N transport, (C) total P concentrations, and (D) total P transport. Solid line shows the line of parity and dashed lines show bounds of ±10 and ±20% around that line; points above the line indicate net retention and those below indicate net release between the upstream and downstream sampling points. Upstream:downstream ratios that deviate considerably from 1:1 are identified with the codes shown in Table 1. Both primary and secondary data are included in the figure and all data are in the Supplementary Table S5.
In contrast to TN, for which future SHPs may either cause net retention or release, model predictions for TP show either net retention, which is often considerable, or neutral effects of SHPs (Figure 7). The greatest decreases in TP concentrations are predicted for SHPs on the Taquari river system, which carries relatively high TP concentrations and loads of suspended material. The predicted retention of TP by the multiple future SHPs on the Cuiabá River above the city of Cuiabá is particularly large.
The measured current and modeled future rates of transport of TN and TP by the major rivers flowing from the upland watershed into the Pantanal, based on the most downstream sampling points, are summarized in Figure 8. Available data for a few smaller rivers are not shown (Negro, Aricá Mirim, and Ribeirão Ponte de Pedra rivers), and the Taquari River is divided into its two major tributaries (Upper Taquari and Coxim rivers) whose confluence is a short distance upstream of the border of the Pantanal. As is apparent in Figure 7, TN is predicted to decrease in some rivers and increase in others as a result of future hydropower development, whereas TP tends to decrease, especially in the three rivers with highest rates of transport, or not change much. Summing all of the riverine transport rates (including the aforementioned smaller rivers) indicates that future hydropower development would result in net reductions of 8% of the TN transport and 29% of the TP transport from the uplands to the Pantanal.
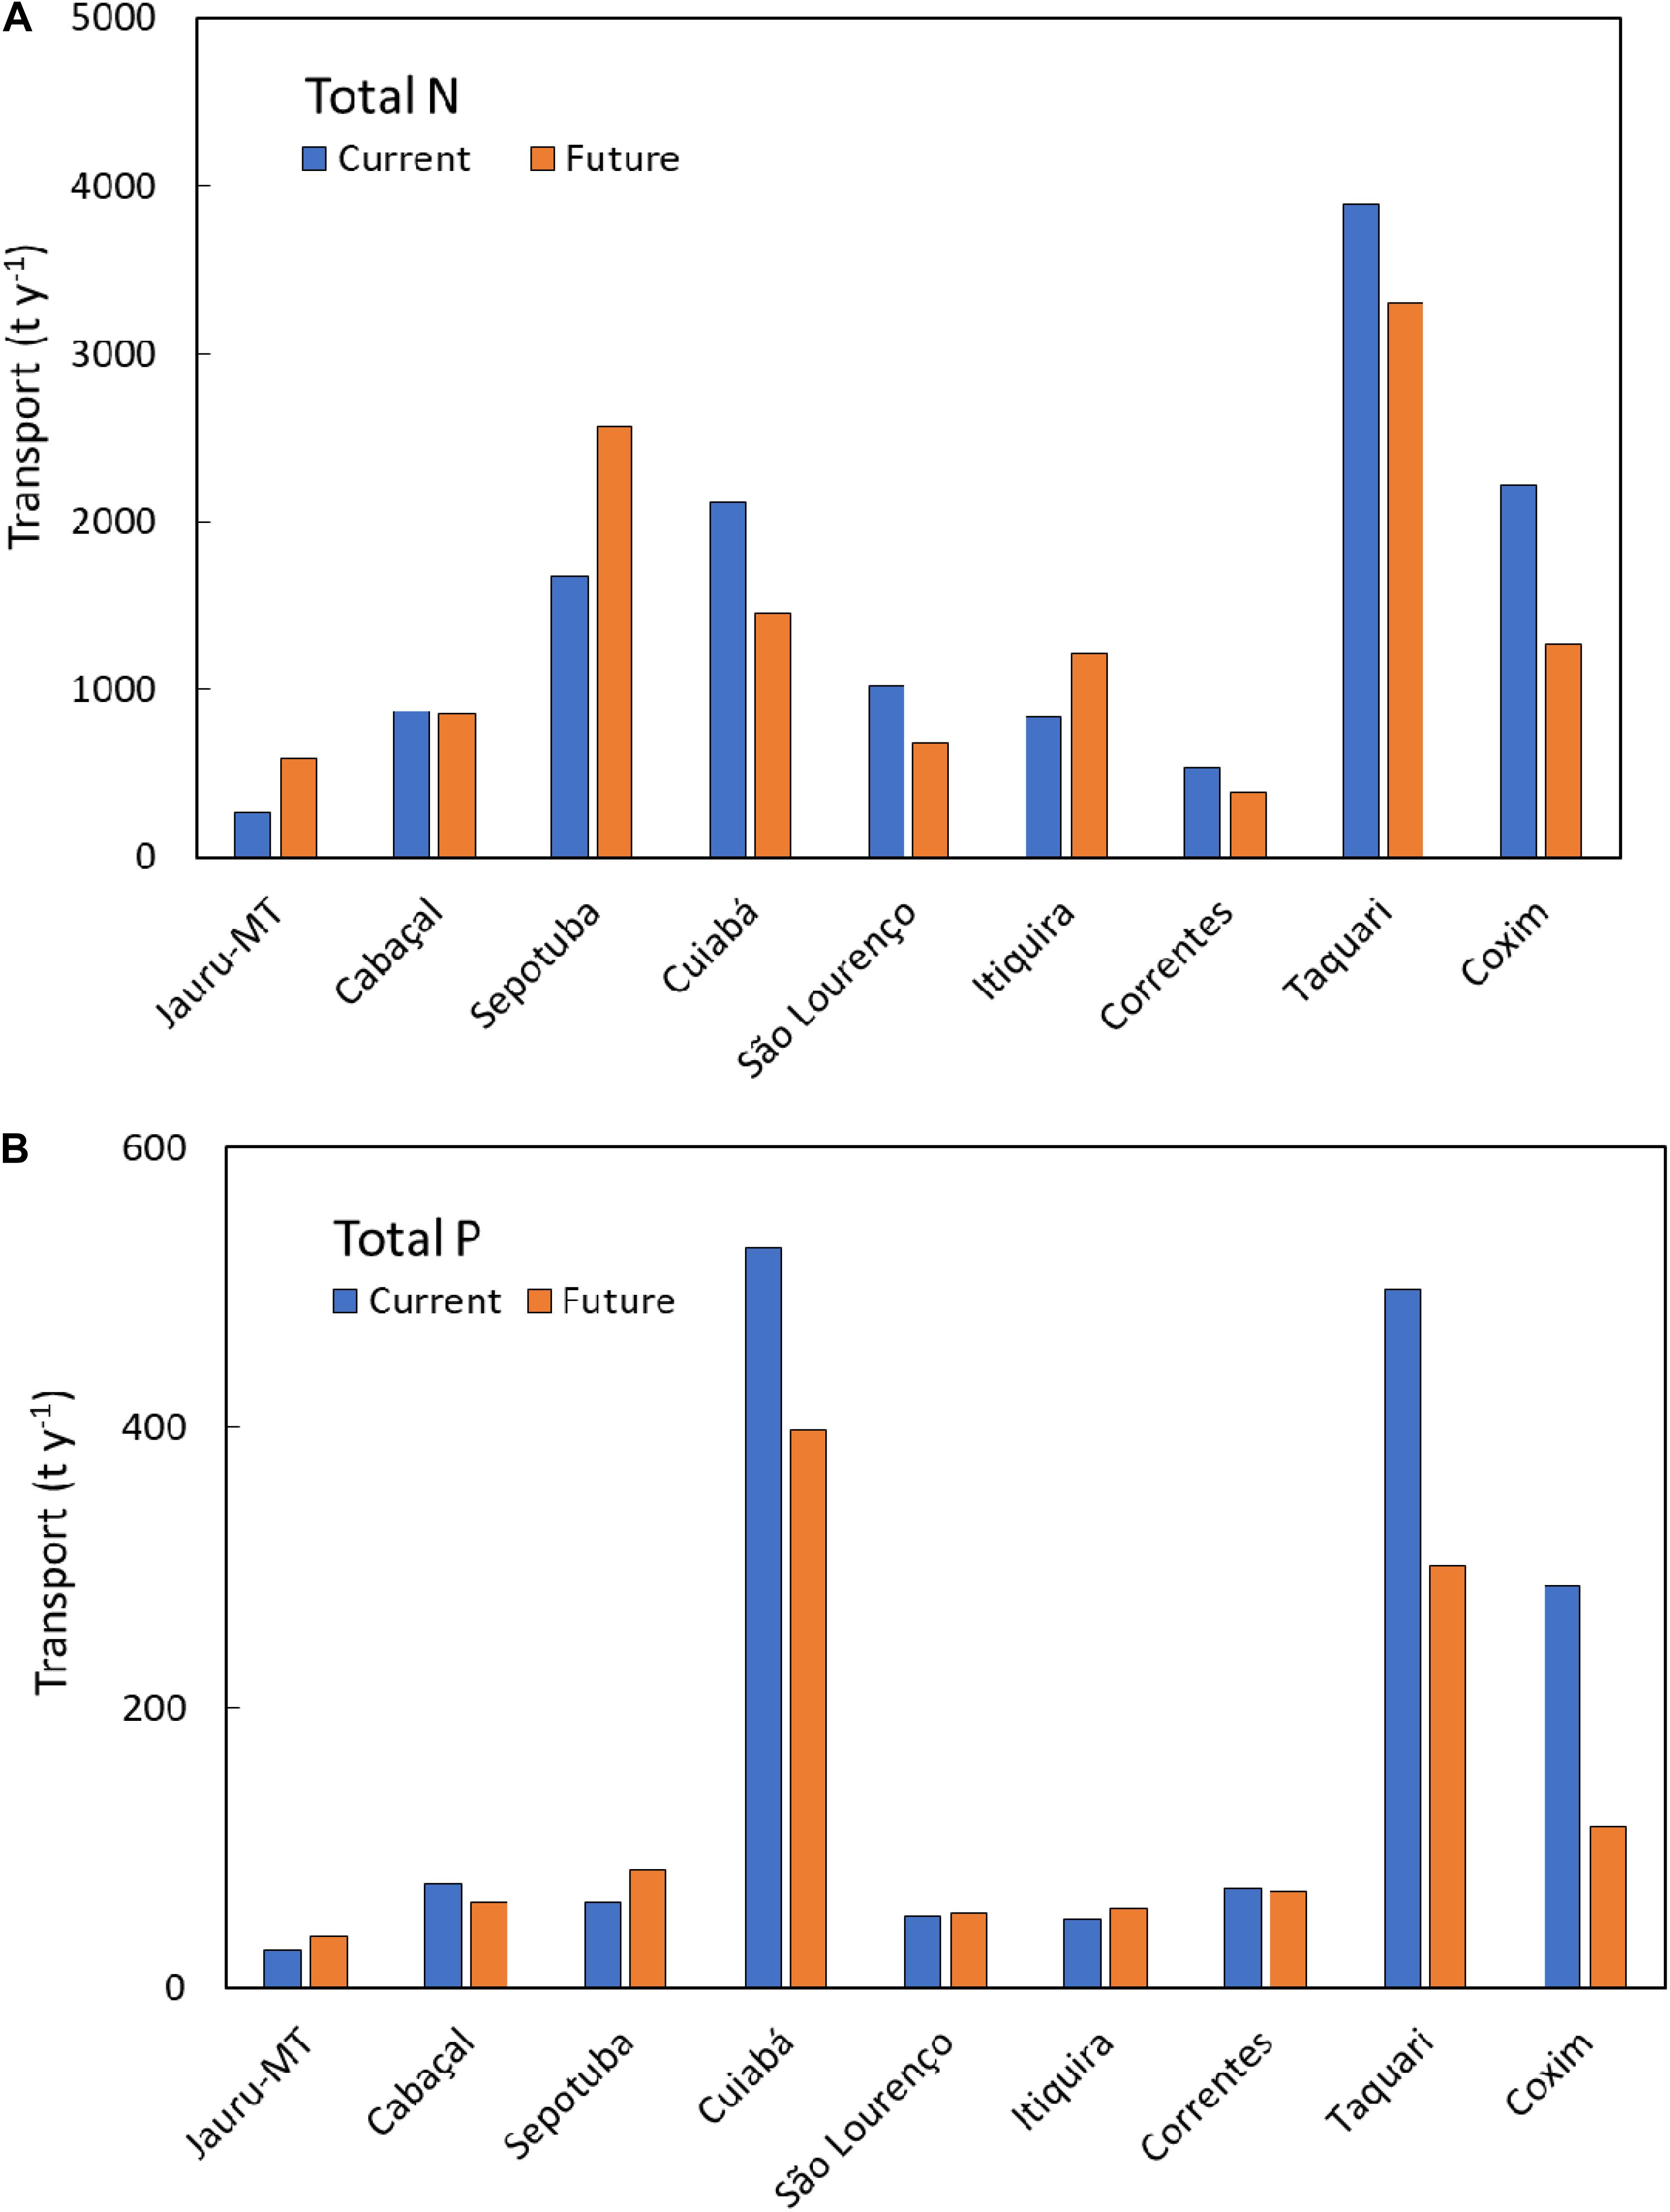
Figure 8. Summary of transport of (A) total nitrogen and (B) total phosphorus by rivers from the upland watershed into the Pantanal. Bars show current rates and rates predicted by the neural network modeling were all future hydropower facilities to be built in each river system.
Discussion
Our comprehensive analysis of how SHPs affect nutrient concentrations and transport, which is unprecedented in the literature, applies not only to future hydropower development in the Upper Paraguay River basin and elsewhere in Brazil, but also worldwide. The results are especially pertinent to decision-making regarding further SHP development in similar landscapes and climates elsewhere in Latin America, East Africa, and Southern Asia (Couto and Olden, 2018). Landscape and climate are relevant because they determine the nature and quantity of riverine nutrient and sediment loads, and climate is also relevant because warm climates can support high rates of biological activity all year.
Overall the impacts of current hydropower facilities on nutrient transport were not large, and in most cases were not distinguishable based on comparisons between samples taken upstream and downstream of the facilities. This contrasts with the well-documented retention of N and P by larger reservoirs around the world (Maavara et al., 2020). As we hypothesized at the outset, the short water residence times of most of the reservoirs associated with SHPs likely explain their tendency to have little or no detectable effect on nutrient transport. However, model predictions for future hydropower facilities project significant reductions in TN and TP concentrations and/or transport, with potential negative consequences for downstream river and floodplain productivity. This difference between the conclusions for current and future hydropower facilities is explained by the larger discharge and sediment loads of a number of the river systems where future facilities are planned (e.g., the Taquari and Cuiabá rivers) (Fantin-Cruz et al., 2020); the modeling accounted for the greater potential trapping of sediments and associated nutrients by dams on more sediment-rich rivers.
Nutrient Concentrations in Rivers Draining to the Pantanal
The rivers in the upland portion of the Upper Paraguay River basin generally show concentrations of TN and TP that would be associated with oligotrophic to mesotrophic states in recipient water bodies (Wurtsbaugh et al., 2019). Total P is carried predominantly in particulate form, whereas dissolved inorganic N tends to be a substantial fraction of TN concentrations and transport. These results are consistent with data reported by Oliveira et al. (2019) for the major rivers at their points of entry into the Pantanal. Ratios of TN: TP suggest that aquatic primary production would potentially be more N-limited in the wet season and P-limited in the dry season, likely reflecting the lower concentrations of suspended particulate P at lower flows (Guildford and Hecky, 2000). Bedload transport of TN, TP, and POC is consistently small compared to transport in the water column; no studies of bedload nutrient transport in these kinds of rivers are available for comparison.
Effects of Current Hydropower Facilities on Nutrient Transport
Comparison of upstream to downstream concentrations for 25 reaches containing current hydropower facilities showed that most facilities did not markedly alter TN, DIN, TP, and POC concentrations and transport. Overall the majority of reaches showed no consistent changes in nutrient concentrations, although TN and TP showed changes in 16 and 15% of the reaches, respectively.
The relatively large reservoirs with longer water residence times would be expected to show the most nutrient retention. As river water passes through the PCH São Lourenço, with a water residence time of up to 18 days, Fantin da Cruz et al. (in review) showed water quality changes including reductions in pH, dissolved oxygen, suspended solids, and turbidity, and Fantin da Cruz et al. (in review) showed that the majority (62%) of sediment inputs was retained, yet we found little change in TN, TP or POC. Another large reservoir (mean water residence time of 16 days) is Ponte de Pedra, a 176-MW hydropower facility on the Correntes River. Our data showed significant reductions in TP concentrations, and a previous study documented reductions in turbidity and concentrations of total suspended solids, TP, and nitrate (Fantin-Cruz et al., 2016). Smaller reservoirs in the present study showed few changes, although median concentrations suggest that TN was retained by the Itiquira dam and POC was retained by some dams on the Jauru, Correntes, and São Lourenço rivers. However, those changes were not consistently observed across all sampling dates, as indicated by the lack of statistical significance.
There are a few studies of SHPs from this region or comparable settings to compare with our observation that most current SHPs did not markedly alter concentrations and transport of TN and TP. Fantin da Cruz et al. (in review) found that SHPs on tributaries in the São Lourenço River watershed with short water residence times (1–2 days) may have been associated with longitudinal increases in pH and dissolved oxygen, but had no detectable effect on temperature, total dissolved solids, suspended solids, turbidity, or chemical oxygen demand. In contrast, Coelho da Silva et al. (2019) reported changes in water quality along the Jauru River where a series of six hydropower facilities produce cumulative total water residence times of ∼17 days. Comparisons of samples collected over the years before and after hydropower facility construction in the Jauru River showed changes in suspended solids, TN, and TP, although in variable directions, and the authors noted the difficulty of ascribing the cumulative changes to the facilities given their variable designs and the limited pre-dam sampling. Timpe and Kaplan (2017) analyzed hydrological alterations at multiannual time scales by a large number of dams in the Amazon and Upper Paraguay basins, including eight facilities we also studied on the Santana, Juba, Jauru, Casca and Aricá rivers (Supplementary Table S1). Those authors found a tendency for dams to significantly alter flow regimes, with larger effects in lowland facilities with large dams and reservoirs, although the magnitude of alteration was comparable between large dams and SHPs when the alterations were scaled to the facilities’ installed capacities. Hydrological alterations at sub-daily scales by many of the hydropower facilities studied here are analyzed by Figueiredo et al. (in review).
Reviews of the impacts of SHP dams elsewhere in the world have either reported a lack of measurements of nutrients (Anderson et al., 2015; Kelly-Richards et al., 2017; Athayde et al., 2019) or a tendency for only small effects of low-head dams (Mbaka and Mwaniki, 2015). A number of studies have documented sediment retention to the point of complete infilling of reservoirs behind old run-of-river dams in the U.S. that were candidates for removal (Csiki and Rhoades, 2010), but how that long-term sediment accumulation relates to annual retention of sediments and associated nutrients above today’s dams is unclear.
Predicting the Impacts of Future Hydropower Development
The ANN model predictions show further reductions in TN and TP concentrations and transport with the construction of all future hydroelectric facilities This is attributable to the expansion of future SHP construction into presently undammed river systems, such as the Cuiabá and Taquari (including its tributaries, the Coxim and Jauru-MS rivers), which carry higher loads of suspended particulate material that is prone to retention by sedimentation (Fantin-Cruz et al., 2020). Many of the current SHPs are located on smaller rivers with lower concentrations of suspended material and nutrients, and their smaller dams produce reservoirs with short water residence times. As expected, the ANN model predicted larger effects on rivers with higher particulate nutrient concentrations and transport, such as Taquari River system, which is the watershed with highest yields of N and P predicted by the SWAT model, greatly exceeding those of most of the northern watersheds (Mingoti et al., 2020).
Decreases in TP concentrations and transport are particularly likely to affect downstream primary production of both aquatic ecosystems and, where sediments are deposited on floodplains within the Pantanal, terrestrial plant growth during the dry season. Preferential retention of TP relative to TN would increase the likelihood of P limitation downstream. On an annual basis, most of the suspended sediments carried by rivers into the Pantanal become deposited on the floodplains (Oliveira et al., 2019). Fluvial inputs provide the only significant P inputs to these ecosystems, and TN:TP ratios show that decreases in TP concentrations will push these waters from likely N limitation toward N + P co-limitation or P limitation. From a regional standpoint, the most consequential reductions in TP transport into the Pantanal would be caused by future hydropower development in the Cuiabá and Taquari/Coxim river systems.
In some cases the model predictions indicated net increases (release) of TN or TP (Figures 7,8), and the Sepotuba River system showed the largest predicted net releases of TN and TP with future hydropower development. Either net TN or TP retention or release is conceivable as water passes through a hydropower facility, with retention likely attributable to sedimentation of particulate matter as well as biological uptake, whereas release could reflect remineralization from sedimented organic matter. Inputs of organic matter could be episodic and/or occur as coarse material, and in either case they could have been missed by our sampling. Large accumulations of coarse particulate matter were sometimes visible above SHP dams. Another possibility is that there are local sources of nutrient input from adjacent uplands.
Recommendations for Future Hydropower Development
Effects of new hydropower facilities on downstream nutrient concentrations and transport are one of a number of environmental and social considerations for decisions about whether and where to construct dams in the Upper Paraguay River basin. Effects on sediment transport and fish migrations are two other environmental impacts of paramount importance (Fantin-Cruz et al., 2020; Campos et al., 2020). Considering concentrations and transport of nutrients together with the parallel study of sediments presented by Fantin-Cruz et al. (2020), we argue that new hydropower facilities should not be built on undammed rivers entering the Pantanal that have particularly low nutrient concentrations and transport, as well as on those that have the highest absolute rates of transport to the Pantanal.
River systems with low nutrient concentrations are likely to be the least productive, and therefore the most sensitive to reductions in either TN or TP or both. The lowest nutrient concentrations reported in this study were found in the Sepotuba, Correntes and São Lourenço river systems. In response to present and future damming and the consequent retention of nutrients, these rivers and their floodplains may experience oligotrophication, with negative consequences for fisheries yields and overall river and floodplain ecosystem productivity (Stockner et al., 2000). Reduced riverine sediment and nutrient loads may eventually reduce the productivity of pastures used for cattle (Forsberg et al., 2017) and of fisheries within the Pantanal.
River systems that carry the largest quantities of nutrients to the Pantanal also deserve protection because their high nutrient loads support river and floodplain ecosystem productivity not only as they flow through the Pantanal but also downstream along the Paraguay River axis (Oliveira et al., 2019). River systems of particular importance to the nutrient budget of the Pantanal that remain undammed in their lower reaches include the Cuiaba and Taquari/Coxim.
Effects on sediment transport to the Pantanal are larger and are also a key consideration for these recommendations (Fantin-Cruz et al., 2020). Based on the results of these two studies, we recommend no future hydropower development on four river systems presently lacking dams in their mainstem reaches within the uplands – the Cabaçal, Sepotuba, Cuiabá, and Taquari/Coxim rivers. Without dams, these rivers would maintain the natural export of nutrients and sediments from the uplands to downstream rivers and floodplains that is essential to support the productivity and biodiversity of the Pantanal Wetland. Additionally, important fish migration corridors would be preserved (Campos et al., 2020).
Data Availability Statement
All datasets generated for this study are included in the article/Supplementary Material.
Author Contributions
MO, IF-C, MS, DF, ED, and SH conceived and carried out the study. IF-C, MO, and MC conducted the field work and data analysis. JC, OP, and RM developed the modeling. MO, IF-C, and SH wrote the manuscript. All the authors contributed to the article and approved the submitted version.
Funding
Funding was provided by the Brazilian National Water Agency, the Eliseu Alves Foundation (Case 062/ANA/2016), the Foundation for Research Support in the State of Mato Grosso (FAPEMAT Case 0249639/2017), the Brazilian National Council for Scientific and Technological Development (CNPq, Case 435543/2018-0), and the Critical Ecosystem Partnership Fund (Grant Agreement CEPF-104254). Financial, logistical and technical support was provided by the Brazilian Corporation for Agricultural Research (EMBRAPA) and thse Federal University of Mato Grosso (PROPeq/PROAD-UFMT). We are also grateful to CAPES-PNPD for the postdoctoral fellowship to DF.
Conflict of Interest
The authors declare that the research was conducted in the absence of any commercial or financial relationships that could be construed as a potential conflict of interest.
Acknowledgments
We are grateful for support in field activities and access to secondary data provided by the State Secretariats for the Environment of Mato Grosso (SEMA-MT) and Mato Grosso do Sul (IMASUL), the Prosecutor’s Office of the State of Mato Grosso (MP-MT), the Brazilian Association for Clean Energy generation (ABRAGEL), and the Union of Construction, Generation, Transmission and Distribution of Electrical Energy and Gas in the State of Mato Grosso (SINDENERGIA). We also appreciate field assistance by Valdeci Oliveira, Josias Campos, Hernandes Monteiro, Valdomiro Lima e Silva, Adriano Dias, and Luiz Amaro.
Supplementary Material
The Supplementary Material for this article can be found online at: https://www.frontiersin.org/articles/10.3389/fenvs.2020.577793/full#supplementary-material
References
Agência National de Águas [ANA] (2018). Plano de Recursos Hídricos da Região Hidrográfica do Paraguai – PRH Paraguai. Relatório final. Available online at: http://arquivos.ana.gov.br/portal/RH-Paraguai/Plano.pdf
Agência National de Águas [ANA] (2019a). Medição de vazão pelo método acústico Doppler. Apostila. Available online at: http://dspace.agencia.gov.br:8080/conhecerhana/112
Agência National de Águas [ANA] (2019b). Hidrossedimentometria: Amostradores e Técnicas de Amostragem de Sedimentos em Suspensão. 2012. Apresentação. Brasília: Agência National de Águas.
American Society of Civil Engineers [ASCE] (2000). Artificial Neural Networks in Hydrology. I: Preliminary Concepts. J. Hydrol. Eng. 5, 115–123. doi: 10.1061/(asce)1084-0699(2000)5:2(115)
Andersen, G. (1975). “Other organic phosphorus compounds,” in Soil Components. Organic Components, Vol. Vol. 1, ed. J. E. Gieseking (Berlin: Springer), 305–331. doi: 10.1007/978-3-642-65915-7_4
Anderson, D., Moggridge, H., Shucksmith, J. D., and Warren, P. H. (2015). Quantifying the impact of water abstraction for low head “run of the river” hydropower on localized river channel hydraulics and benthic macroinvertebrates. River Res. Appl. 33, 202–213. doi: 10.1002/rra.2992
ANEEL (AGÊNCIA NACIONAL DE ENERGIA ELÉTRICA). (2016). Resolução Normativa N° 745, 22 de Novembro de 2016. Brasil: Ministério de Minas e Energia. 228:27.
Arnold, J. G., Kiniry, J. R., Srinivasan, R., Williams, J. R., Haney, E. B., and Neitsch, S. L. (2012). Soil and Water Assessment Tool Input/Output File Documentation Version 2012. Available online at: http://swat.tamu.edu/media/69296/SWAT-IO-Documentation-2012.pdf (accessed November 25, 2020).
Athayde, S., Duarte, C. G., Gallardo, A. L., Moretto, E. M., Sangoi, L. A., Dibo, A. P. A., et al. (2019). Improving policies and instruments to address cumulative impacts of small hydropower in the Amazon. Energy Policy 132, 265–271. doi: 10.1016/j.enpol.2019.05.003
Campos, M. M., Tritico, H. M., Girard, P., Zeilhofer, P., Hamilton, S. K., and Fantin-Cruz, I. (2020). Predicted impacts of proposed hydroelectric facilities on fish migration routes upstream from the Pantanal Wetland (Brazil). River Res. Appl. 36, 452–464. doi: 10.1002/rra.3588
Coelho da Silva, A. C., Fantin-Cruz, I., Lima, Z. M., and Figueiredo, D. M. (2019). Cumulative changes in water quality caused by six cascading hydroelectric dams on the Jauru River, tributary of the Pantanal floodplain. Rev. Bras. Recurs. Hídricos 24:e18.
Collischonn, W., Paz, A. R., Melo, M. M. M., and Jardim, P. F. (2019). Potenciais Impactos de Barragens Sobre o Regime Hidrológico nos rios da Região Hidrográfica do Paraguai. Elaboração de Estudos de Avaliação dos Efeitos da Implantação de Empreendimentos Hidrelétricos na Região Hidrográfica do Rio Paraguai. Agência Nacional de Águas. Available online at: https://www.ana.gov.br/gestao-da-agua/planejamento-dos-recursos-hidricos/plano-de-recursos-hidricos-rio-paraguai/grupo-de-acompanhamento/19a-reuniao-do-gap-1/relatorio-de-andamento_hidrologia_parte1-1.pdf (accessed November 25, 2020).
Couto, T. B. A., and Olden, J. (2018). Global proliferation of small hydropower plants – science and policy. Front. Ecol. Environ. 16, 91–100. doi: 10.1002/fee.1746
Csiki, S., and Rhoades, B. L. (2010). Hydraulic and geomorphological effects of run-of-river dams. Progr. Phys. Geogr. 34, 755–780. doi: 10.1177/0309133310369435
Dawson, C. W., Abrahart, R. J., Shamseldin, A. Y., and Wilby, R. L. (2006). Flood estimation at ungauged sites using artificial neural networks. J. Hydrol. 319, 391–409. doi: 10.1016/j.jhydrol.2005.07.032
Empresa Brasileira de Pesquisa Agropecuária [EMBRAPA] (2015). Monitoramento das Alterações da Cobertura Vegetal e uso do Solo na Bacia do Alto Paraguai – Porção Brasileira (Analysis period: 2012 to 2014). Brasilia: Instituto SOS Pantanal.
Empresa Brasileira de Pesquisa Agropecuária [EMBRAPA] (2018). Brazilian Soil Classification System. Available online at: https://www.embrapa.br/busca-de-publicacoes/-/publicacao/1094001/brazilian-soil-classification-system (accessed November 25, 2020).
Fantin da Cruz, R., Hamilton, S. K., Tritico, H. M., Fantin-Cruz, I., Figueiredo, D. M., and Zeilhofer, P. (in review). Water quality impacts of small hydroelectric power plants in a tributary to the Pantanal floodplain, Brazil. River Res. Appl.
Fantin-Cruz, I., Oliveira, M. D., Campos, J. A., Campos, M. M., Ribeiro, L. S., and Mingoti, R., et al. (2020). Further development of small hydropower facilities will significantly reduce sediment transport to the Pantanal Wetland of Brazil. Front. Environ. Sci. 8:577748. doi: 10.3389/fenvs.2020.577748
Fantin-Cruz, I., Pedrollo, O., Castro, N. M. R., Girard, P., Zeilhofer, P., and Hamilton, S. K. (2011). Historical reconstruction of floodplain inundation in the Pantanal (Brazil) using neural networks. J. Hydrol. 399, 376–384. doi: 10.1016/j.jhydrol.2011.01.014
Fantin-Cruz, I., Pedrollo, O., Girard, P., Zeilhofer, P., and Hamilton, S. K. (2016). Changes in river water quality caused by a diversion hydropower dam bordering the Pantanal floodplain. Hydrobiologia 768, 223–238. doi: 10.1007/s10750-015-2550-4
Figueiredo, D. M., Dores, E. F. G. C., Fantin-Cruz, I., Figueiredo, S. B., Zeilhofer, P., Oliveira, M. D., et al. (2018). “Histórico da qualidade da água dos principais rios em 22 anos de monitoramento,” in Bacia do rio Cuiabá-uma Abordagem Socioambiental, eds D. M. Figueiredo, E. F. G. C. Dores, and Z. M. Lima (Cuiabá: Entrelinhas), 130–193.
Forsberg, B. R., Melack, J. M., Dunne, T., Barthem, R. B., Goulding, M., Paiva, R. C. D., et al. (2017). The potential impact of new Andean dams on Amazon fluvial ecosystems. PLoS One 12:e0182254. doi: 10.1371/journal.pone.0182254
Gonçalves, H. C., Mercante, M. A., and Santos, E. T. (2011). Hydrological cycle. Braz. J. Biol. 71, 241–253. doi: 10.1590/S1519-69842011000200003
Guildford, S. J., and Hecky, R. E. (2000). Total nitrogen, total phosphorus, and nutrient limitation in lakes and oceans: Is there a common relationship? Limnol. Oceanogr. 45, 1213–1223. doi: 10.4319/lo.2000.45.6.1213
Güntzel, A. M., da Silva, W. M., and Panarello, E. A. (2020). Connectivity as the control key to intensity of flood pulse in Taquari River oxbow lakes. Rev. Ambient. Água 15:e2534. doi: 10.4136/ambi-agua.2534
Hamilton, S. K. (2002). “Hydrological controls of ecological structure and function in the Pantanal wetland (Brazil),” in The Ecohydrology of South American Rivers and Wetlands, Vol. 6, ed. M. McClain (Rennes: IAHS Special Publication), 133–158.
Hamilton, S. K., Sippel, S. J., Calheiros, D. F., and Melack, J. M. (1997). An anoxic event and other biogeochemical effects of the Pantanal wetland on the Paraguay River. Limnol. Oceanogr. 42, 257–272. doi: 10.4319/lo.1997.42.2.0257
Hamilton, S. K., Sippel, S. J., and Melack, J. M. (1996). Inundation patterns in the Pantanal Wetland of South America determined from passive microwave remote sensing. Arch. Hydrobiol 137, 1–23.
Hecht-Nielsen, R. (1989). “Theory of the backpropagation neural network,” in Proceedings of the International 1989 Joint Conference on Neural Networks, Vol. 1, Washington, DC, 593–605. doi: 10.1109/IJCNN.1989.118638
Junk, W. J., Bayley, P. B., and Sparks, R. E. (1989). “The flood pulse concept in river-floodplain systems,” in Proceedings of the International Large River Symposium, Honey Harbour, 110–127.
Junk, W. J., da Silva, C. J., da Cunha, C. N., and Wantzen, K. M. (2011). The Pantanal: Ecology, Biodiversity and Sustainable Management of a Large Neotropical Seasonal Wetland. (Moscow: Pensoft), 870.
Kaunda, C. S., Kimambo, C. Z., and Nielsen, T. K. (2012). Hydropower in the context of sustainable energy supply: a review of technologies and challenges. ISRN Renew. Energy 2012:7306312012. doi: 10.5402/2012/730631
Kelly-Richards, S., Silber-Coats, N., Crootof, A., Tecklin, D., and Bauer, C. (2017). Governing the transition to renewable energy: a review of impacts and policy issues in the small hydropower boom. Energy Policy 101, 251–264. doi: 10.1016/j.enpol.2016.11.035
Kibler, K. M., and Tullos, D. D. (2013). Cumulative biophysical impact of small and large hydropower development in Nu River, China. Water Resour. Res. 49, 3104–3118. doi: 10.1002/wrcr.20243
Lewis, W. M. Jr., Hamilton, S. K., Lasi, M. A., Rodríguez, M. A., and Saunders, J. F. III (2000). Ecological determinism on the Orinoco floodplain. Bioscience 50, 681–692. doi: 10.1641/0006-3568(2000)050[0681:edotof]2.0.co;2
Maavara, T., Akbarzadeh, Z., and Van Cappellen, P. (2020). Global dam-driven changes to riverine N:P:Si ratios delivered to the coastal ocean. Geophys. Res. Lett. 47:e2020GL088288. doi: 10.1029/2020GL088288
Mbaka, J. G., and Mwaniki, M. W. (2015). A global review of the downstream effects of small impoundments on stream habitat conditions and macroinvertebrates. Environ. Rev. 23, 257–262. doi: 10.1139/er-2014-0080
Mingoti, R., Sais, I. C. R., Padovani, S. R., Calheiros, D. F., and Oliveira, M. D. (2020). SWAT Model Details and Results. Available online at: http://geoinfo.cnpm.embrapa.br/layers/geonode%3Abap_bd2_v4o2_wgs84 (accessed November 25, 2020).
Neitsch, S. L., Arnold, J. G., Kiniry, J. R., and Williams, J. R. (2011). Soil and Water Assessment Tool Theoretical Documentation, version 2009. Forney, TX: Texas Water Resources Institute. Available online at: http://swatmodel.tamu.edu/documentation/
Oliveira, M. D., Hamilton, S. K., and Calheiros, D. F. (2019). Mass balances of dissolved solutes, nutrients, and suspended sediment as water moves through the Pantanal wetland to its outflow (Paraguay River). Braz. J. Water Resour. 24, 1–15. doi: 10.1590/2318-0331.231820170169
Richter, B. D., Davis, M., Apse, C., and Konrad, C. (2012). A presumptive standard for environmental flow protection. River Res. Appl. 28, 1312–1321. doi: 10.1002/rra.1511
Rumelhart, D. E., Hinton, G. E., and Williams, R. J. (1986). Learning representations by backpropagating errors. Nature 323, 533–536. doi: 10.1038/323533a0
Stockner, J. G., Rydin, E., and Hyenstrand, P. (2000). Cultural oligotrophication: Causes and consequences for fisheries resources. Fisheries 25, 7–14. doi: 10.1577/1548-8446(2000)025<0007:co>2.0.co;2
Timpe, K., and Kaplan, D. (2017). The changing hydrology of a dammed Amazon. Sci. Adv. 3:e1700611. doi: 10.1126/sciadv.1700611
Tomás, W. M., de Oliveira Roque, F., Morato, R. G., Medici, P. E., Chiaravalloti, R. M., Tortato, F. R., et al. (2019). Sustainability agenda for the Pantanal Wetland: perspectives on a collaborative interface for science, policy, and decision-making. Trop. Conserv. Sci. 12, 1–30. doi: 10.1177/1940082919872634
Vogl, T. P., Mangis, J. K., Rigler, A. K., Zink, W. T., and Alkon, D. L. (1988). Accelerating the convergence of the back-propagation method. Biol. Cybern. 59, 257–263. doi: 10.1007/bf00332914
Wurtsbaugh, W. A., Paerl, H. W., and Dodds, W. K. (2019). Nutrients, eutrophication and harmful algal blooms along the freshwater to marine continuum. WIREs Water 6:e1373. doi: 10.1002/wat2.1373
Keywords: hydroelectricity, dams, tropical, water quality, river transport
Citation: Oliveira MD, Fantin-Cruz I, Campos JA, Campos MM, Mingoti R, Souza ML, Figueiredo DM, Dores EFGC, Pedrollo O and Hamilton SK (2020) Further Development of Small Hydropower Facilities May Alter Nutrient Transport to the Pantanal Wetland of Brazil. Front. Environ. Sci. 8:577793. doi: 10.3389/fenvs.2020.577793
Received: 29 June 2020; Accepted: 19 October 2020;
Published: 10 December 2020.
Edited by:
Lee Baumgartner, Charles Sturt University, AustraliaReviewed by:
Fernando Mayer Pelicice, Federal University of Tocantins, BrazilRafael Dettogni Guariento, Federal University of Mato Grosso do Sul, Brazil
Copyright © 2020 Oliveira, Fantin-Cruz, Campos, Campos, Mingoti, Souza, Figueiredo, Dores, Pedrollo and Hamilton. This is an open-access article distributed under the terms of the Creative Commons Attribution License (CC BY). The use, distribution or reproduction in other forums is permitted, provided the original author(s) and the copyright owner(s) are credited and that the original publication in this journal is cited, in accordance with accepted academic practice. No use, distribution or reproduction is permitted which does not comply with these terms.
*Correspondence: Marcia Divina de Oliveira, marcia.divina@embrapa.br