Changing Relationship Between Tibetan Plateau Temperature and South China Sea Summer Monsoon Precipitation
 Mei Liang
 Jianjun Xu1*
  Johnny C. L. Chan
- 1South China Sea Institute of Marine Meteorology and College of Ocean and Meteorology, Guangdong Ocean University, Zhanjiang, China
- 2School of Energy and Environment, City University of Hong Kong, Hong Kong, China
- 3Department of Atmospheric and Oceanic Sciences and Institute of Atmospheric Sciences, Fudan University, Shanghai, China
- 4State Key Laboratory of Disastrous Weather, China Academy of Meteorological Sciences, Beijing, China
The present study documents the changes in the relationship between the Tibetan Plateau summer surface temperature (TPST) and the South China Sea summer monsoon precipitation (SCSSMP). A stepwise regression model is used to exclude the signals of global warming, El Niño–Southern Oscillation (ENSO), western North Pacific Subtropical High (WNPSH), Atlantic Multidecadal Oscillation (AMO) and Pacific Decadal Oscillation (PDO). The results indicate that the relationship between TPST–SCSSMP changes with time, going from a negative correlation during the period of 1980–1994 to an obvious positive correlation during 1998–2016 in the South China Sea. Meanwhile, the negative correlation between TPST and the East Asia subtropical front (Meiyu) is enhanced during 1998–2016. This change in the TPST–SCSSMP relationship is associated with the change of the atmospheric circulation, which is mainly due to TPST interdecadal variation. A wave–like structure at the low latitude moves eastward along the low–level monsoon flow, and a strong cyclonic circulation is apparent in the southwestern part of the Plateau, including the Indochina Peninsula, South China Sea, and the ocean to the east of the Philippines, which is consistent with the negative correlation between TPST and Outgoing Longwave Radiation (OLR). The increase in water–vapor convergence and more favorable convection conditions lead to more precipitation in the region after the late 1990s. The present results suggest that, in a changing climate, we should be cautious when using predictor with interdecadal variations.
Introduction
Warming rate is found amplification with elevation in high–altitude region in recent years, especially the Tibetan Plateau (Beniston et al., 1997; Liu and Chen, 2000; Beniston, 2003; Seidel and Free, 2003; Pepin and Lundquist, 2008; Liu et al., 2009, 2012; Wang et al., 2014; Pepin et al., 2015; Wu et al., 2017; Zhu and Fan, 2018; Gao et al., 2019). Large evidences show that variations in Tibetan Plateau summer surface temperature (TPST) could greatly affect the interannual and interdecadal variations in the South China Sea summer monsoon by the records (Ye et al., 1957; Ye and Gao, 1979, 1992; Ding, 1992; Yanai et al., 1992; Ye and Wu, 1998; Xu et al., 2002, 2010, 2015, 2018; Zhao et al., 2003; Duan and Wu, 2005, 2008; Lu et al., 2005; Zhou et al., 2009; Duan et al., 2011, 2012, 2013; Liu et al., 2012; Wu et al., 2012a,b, 2014; Boos and Kuang, 2013).
However, in a changing climate, the Tibetan Plateau and South China Sea summer monsoon precipitation (SCSSMP) relationships would change and the understanding of them still need to research. Zhang et al. (2004) and Ding et al. (2009) described that decadal variations existed in the relationship between winter–spring snow over the Tibetan Plateau and SCSSMP in 1960s−1990s. Si and Ding (2013) suggested that the relationship between the Tibetan Plateau winter snow and the SCSSMP changed in 1999. The correlation between them changed from the positive to a strong positive. On the whole, the robustness of this relationship in a changing climate remains unclear.
There are many factors affect the SCSSMP, but these factors are not independent. For example, El Niño–Southern Oscillation (ENSO) together with the Atlantic Multidecadal Oscillation (AMO) leaded to an anomalous cyclone (anticyclone) over the western North Pacific Subtropical High (WNPSH) that persisted from the ENSO mature winter to the ENSO decaying summer, strengthening (weakening) the SCSSMP (Wu et al., 2003; Fan et al., 2018). In addition, ENSO was strongly modulated by the Pacific Decadal Oscillation (PDO), which furtherly affected on the SCSSMP (Lee et al., 2013; Feng et al., 2014; Song and Zhou, 2015; Bollasina Massimo and Gabriele, 2018). In addition, Annamalai et al. (2013) showed that global warming shifted the monsoon circulation and dried South Asia. Overall, global warming and interdecadal variability in climate systems, such as the WNPSH, ENSO, AMO, and PDO influence the change of summer rainfall in this area. It is therefore necessary to exclude these factors so as to isolate the contributions of Tibetan Plateau warming to the TPST–monsoon relationship as well as explore the robustness of the relationship in a changing climate. The present study aims to explore the evolving relationship of TPST–SCSSMP by employing a stepwise regression model to exclude the influence of these other factors.
Datasets and methods are described in section 2. In section 3, the constructed stepwise regression model and the changing relationship of TPST–SCSSMP are documented. Section 4 examines the influence of the interdecadal variation of the TPST on atmospheric circulation. In section 5, conclusions and discussions are provided.
Datasets and Methods
Datasets
In this study, observational dataset and three reanalysis datasets are used to avoid the inadequate observation of Tibetan Plateau temperature at the high altitudes (Beniston et al., 1997; Ohmura, 2012; Rangwala and Miller, 2012; Wu et al., 2017). Observations used are mainly from the China Meteorological Science Data Network. The Japanese 55–year Reanalysis (JRA−55) is also used, which is a high–quality homogeneous climate dataset from 1980 to recent (Kobayashi and Iwasaki, 2016). ERA5 (the fifth generation of European Centre for Medium–Range Weather Forecasts atmospheric reanalyses of the global climate) is also used, which is a high-resolution dataset from 1950 to present (Malardel et al., 2015). An earlier version, ERA–Interim (Berrisford et al., 2011), is also used for comparisons. The Tibetan Plateau surface temperatures are therefore determined from the observation data and the 2–m surface temperature in these reanalysis datasets.
The observational dataset, with 693 national–level basic stations in China, is also used for precipitation, during the 38–year period of 1980–2016. The Global Precipitation Climatology Project (GPCP) can capture the SCSSMP precipitation well (Adler et al., 2003), therefor it is used to analysis the changes of the SCSSMP from 1980 to 2016. The Outgoing Longwave Radiation (OLR) dataset is also used. Global surface temperatures are extracted from the 2–m surface temperatures in the JRA55 reanalysis data. The ENSO index used here is the Oceanic Nino Index, obtained from https://www.cpc.ncep.noaa.gov/products/. The WNPSH index is loaded from China Meteorological Standardization Network. The AMO index is acquired from the Earth System Research Laboratory (ESRL) of National Oceanic and Atmospheric Administration (NOAA). The PDO index is downloaded from the National Centers for Environmental Information (NCEI) by using the NOAA's Extended Reconstruction of Sea Surface Temperature (ERSST Version 4).
For the download websites and resolutions of all above datasets, please see Table 1 for detail. To reduce the error, all reanalysis datasets are interpolated to the resolution of 1.25° latitude × 1.25° longitude. Summer here is defined as June, July, and August.
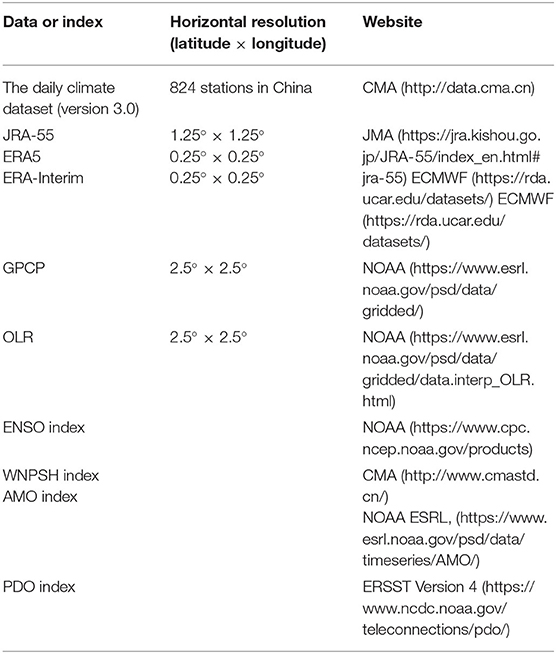
Table 1. The various datasets and indexes used in this study and the corresponding Websites.
Methods
The Vertically–integrated moisture flux (VIMF) is calculated using the monthly variables of specific humidity, sea–level pressure, meridional wind (v), zonal wind (u), and air temperatures data, which is integrated from low–level (1000 hPa) to mid–level (500 hPa). The amount of water vapor is mainly concentrated from surface to 500 hPa (Strong et al., 2002). The VIMF calculating equation is as follow.
Where ps is surface pressure, pt 500 hPa, V the wind vector, q specific humidity and g an acceleration of gravity.
It was hardly explored the region that higher than 5,000 m above sea level (Lawrimore et al., 2011), and to obtain suitable sample sizes for Tibetan Plateau. In this study, it is quite reasonable that sites with an elevation higher than 2,000 m are selected, and we think an altitude of 2,000 m is still higher than the surrounding area and also representative. Previous studies also selected sites higher than 2,000 m. For example, Su et al. (2017) chose the grids above 2,000 m from the reanalysis datasets to quantitatively analyze the warming amplification over the Tibetan Plateau. Finally, 61 stations in the eastern part of the Tibetan Plateau are selected to study in our study.
The Mann–Kendall (M–K) trend test and Theil–Sen estimator are both used to check the reliability of trend. The M–K test is a non–parametric test for detecting the presence of linear or non–linear trends in time series data. The stepwise regression is a widely–used method for fitting regression models. In this study, we use it to select predictive variables to construct a multiple regression model. Firstly, we employ it to select the significant predictive variables from global warming, ENSO, WNPSH, PDO, and AMO. Secondly, we construct a multiple regression model by using the significant predictive variables. Then we only analyze the standardized partial regression coefficients between the TPST and precipitation, as well as evaluating the relative contributions to precipitation. The significance of the results obtained by the regression method and climate mean analysis are all determined by using the standard two–tailed Student's t–test method. F test is used to test the significance of the regression equation.
TPST–SCSSMP Relationship
Temperature Change Over the Tibetan Plateau
Since most of the stations are located in the eastern Tibetan Plateau (25°−40°N, 90°−105°E) except for six stations located outside the region, those concentrated in the east areas are selected to represent the Tibetan Plateau to avoid the effect of interpolation. A coherent warming pattern is found in the eastern Tibetan Plateau during 1980 to 2016 (Figure 1), where 92% of stations trends pass the 95% statistically significant (solid red dots in Figure 1). The trends exceeded 0.5°C/decade are all distributed over the southwest and northeast sides of the Tibetan Plateau.
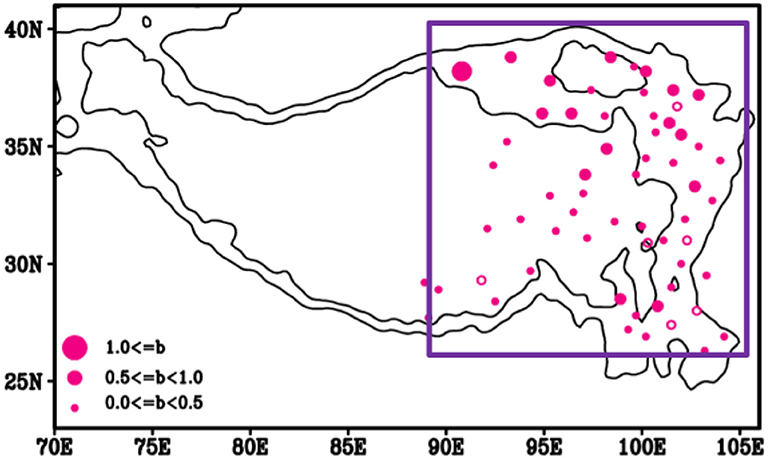
Figure 1. Temperature changes at stations higher than 2,000 m above mean sea level in the eastern Tibetan Plateau during the summers of 1980–2016 (units: °C/decade; solid black lines represent the 2,000 m and 3,000 m height above mean sea level; the solid points indicate significant differences above the 95% confidence level). The purple area (27–40°N, 90–105°E) is selected as the research region for JRA55, ERA5 and ERA-Interim reanalysis temperature data at 2 m.
To test the reliability of the reanalysis data in reflecting the TPST change, we compare it with the station data at the same region (eastern Tibetan Plateau; purple box in Figure 1). The interannual variation of TPST exhibits a consistent significantly increasing trend in all the datasets, although the variability is higher after 2005 (Figure 2). All of the datasets well reflect the annual variability of the TPST. The Mann–Kendall and Theil–Sen estimator are both used to check whether the trend is robust. The values of the trends differ slightly among the data sets, but both methods detected consistent increasing trends (P < 0.01). The trend is therefore reliable and robust, despite the annual variability after 2005. The 2–m global surface temperature from JRA55 is also analyzed to compare this trend with that of global warming. It is found that the global–average surface temperature increases at a relative lower rate (0.15°C/decade, P < 0.05) during 1980–2016. Those previous studies (Liu and Chen, 2000; Wang et al., 2008, 2014; Liu et al., 2009) were also pointed out that warming was amplified in the TPST compared with the globe and other plain regions.
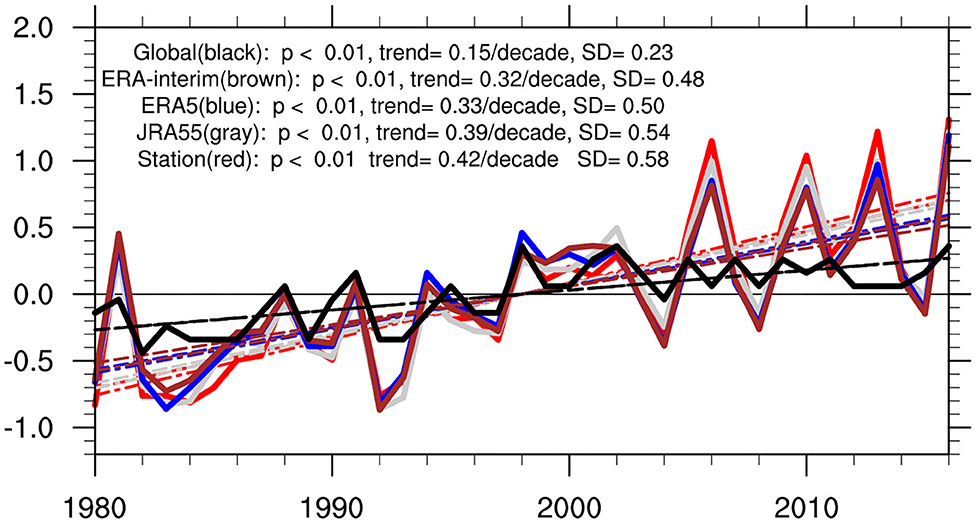
Figure 2. Interannual changes in summer temperature averaged by the Tibetan Plateau and globe (black) for in situ stations (red), JRA55 (gray), ERA5 (blue), ERA–Interim (brown), and globe (black, JRA55) (units: °C). Significances of the trends are assessed using the Mann–Kendall test and Theil–Sen estimator. P < 0.01 indicates a significant difference above the 99% confidence level.
The Mann–Kendall method is also employed to investigate whether a shift occurred in the temperature on the eastern Tibetan Plateau. The results show that a dramatic shift is found during 1980–2016 (P < 0.05) in all datasets (Figure 3A). The year of abrupt change in TPST may occur either in 1995 (Figure 3D), 1996 (Figure 3B), or 1997 (Figures 3C,E), depending on the dataset, being 1996 in the observation station, 1995 in the ERA5, but 1997 in the JRA55 and ERA–Interim. Combining all datasets, the time series is separated into two periods, 1980–1994 and 1998–2016. The temperature anomalies are ~-0.37°C to −0.46°C during 1980–1994, but increase up to 0.29°C to 0.37°C during 1998–2016 (P < 0.05). The results verify the conclusion that the TPST warming is greater than that of the globe and a dramatic shift occurs around 1996. The snow–albedo feedback mechanism is generally used to explain Tibetan Plateau warming (Giorgi et al., 1997; Pepin and Lundquist, 2008; Liu et al., 2009; Ceppi et al., 2010). In addition, the cloud–radiation effects on water vapor and radiative fluxes (Rangwala, 2013), are also responsible too. In the present study, we are interested in the evolving relationship between the TPST and SCSSMP. It would seem reasonable to hypothesize that this interdecadal variation of the TPST may change the atmospheric circulation and water vapor conditions, which further impact the SCSSMP in the downstream area of the Plateau. The question is whether the interdecadal variation on the Tibetan Plateau warming affects TPST–SCSSMP relationship and how robust such a relationship is in a changing climate.
Figure 3. (A) Temperature change in summer over the eastern part of the Tibetan Plateau region for 1980–1994 and 1998–2016. The solid lines are time series of Tibetan Plateau summer temperature during 1980–2016 for different datasets. The dashed lines represent the mean TPST for 1980–1994 and 1998–2016, respectively. Mann–Kendall regime shift test of the temperature over the eastern part of the Tibetan Plateau for (B) station, (C) JRA55, (D) ERA5, and (E) ERA–Interim. Red line represents the forward line; Green line represents the back line. All of them are statistically significant at the 95% confidence level.
The Changing Relationship of TPST–SCSSMP
The reliability of the GPCP precipitation dataset is examined by comparing it with the observed precipitation dataset (Figures 4A,B). Similar spatial distribution patterns of precipitation change are found in these two describes and these spatial distribution patterns are consistent with those results from previous studies (Burke and Stott, 2017; Stanley, 2017; Xu et al., 2018). Precipitation is generally higher in the south of the Yangtze River, such as the South China, and lower in the north of the Yellow River and Southwest China. The lower precipitation in southwestern China is more obvious over the North China Plain. The similarity precipitation distribution patterns between these two datasets confirm that the GPCP precipitation data well reflects the precipitation in China and even in East Asia. In the subsequent analyses, we therefore use GPCP precipitation data to examine the changeable TPST–SCSSMP relationship.
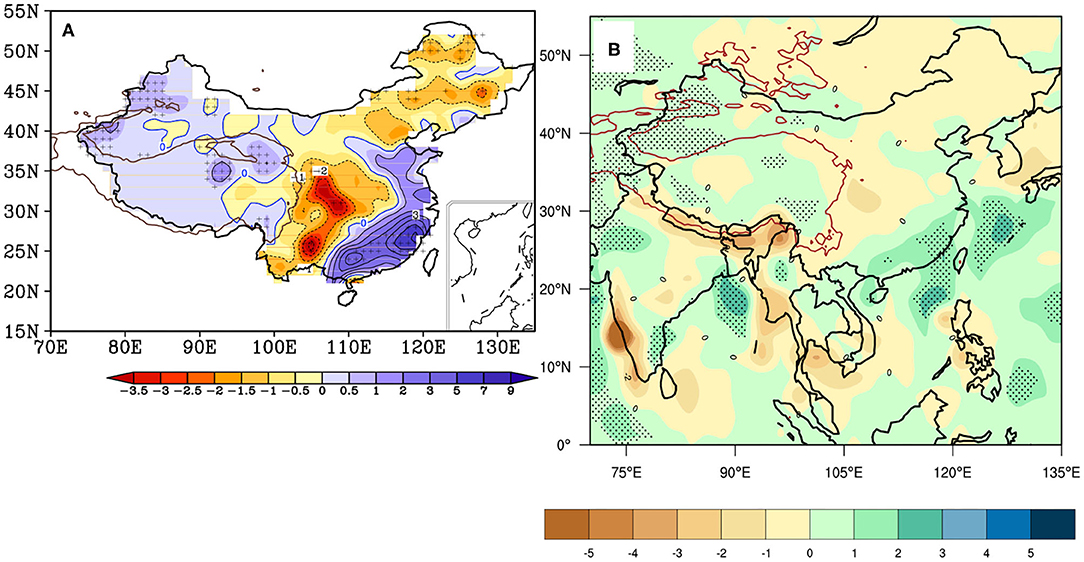
Figure 4. Spatial distribution of precipitation trends in (A) China (based on observations) and (B) East Asia (based on GPCP data; brown contour delineates an altitude of 2,000 m) in the summers of 1980–2016 (units: mm/decade; cross symbols indicate statistical significance above the 95% confidence level).
In addition to TPST, global warming, interannual, and interdecadal variability, such as WNPSH, ENSO, PDO, and AMO, can also influence the summer rainfall in this area. But these factors are not independent. ENSO together with the AMO caused the WNPSH anomalous cyclone (anticyclone), strengthening (weakening) the SCSSMP (Wu et al., 2003; Fan et al., 2018). In addition, ENSO was significantly modulated by the PDO, which furtherly affected on the SCSSMP (Lee et al., 2013; Feng et al., 2014; Song and Zhou, 2015; Bollasina Massimo and Gabriele, 2018). Furthermore, Annamalai et al. (2013) showed that the warming of globe shifted the monsoon circulation and dried South Asia. This introduces a question of which factors are more important and which are less important under the interaction of these factors. How should we select the predictive variables and construct a complete and realistic regression model? In this study, a stepwise regression model is conducted to explore this question. In each step, the variable with the smallest p values which <0.1 is added to the model. The process finally terminates when no additional available variable can be removed or added to this model (Efroymson, 1960; Draper and Smith, 1981).
The variable selection procedure is shown in Table 2. The SCSSMP at four datasets is the variable being predicted and Tibetan Plateau, and global warming, PDO, AMO, ENSO, and WNPSH are the predictors. Firstly, we assume all the variables are predictive variables and we construct a multiple regression model. The regression equation is significance (F > F0.1). Obviously, the predictive variables of TPST and WNPSH are both significant (P < 0.1), but the regression coefficients between WNPSH and SCSSMP are larger than that of TPST at four datasets. We therefore choose the WNPSH as the first predictor. According to this method, we then select the factors of TPST and global warming as the second and third predictors. After selecting three variables, it should begin to consider remove the insignificant predictor among them. Note that the last variable adds into the model, it cannot be deleted immediately. We can see that the factors of TPST, WNPSH, and are still significant. We add the variables of PDO, ENSO, and AMO by one after another. But none of the added variables and regression equation is significantly when each of variable is added, which means that PDO, ENSO, and AMO are not important predictors. Overall, TPST, global warming and WNPSH, are the three most important factors that affect the change of summer rainfall in this area. As a result, we stop adding variables. Finally, we establish a multiple regression model with the SCSSMP, TPST, global warming, and WNPSH (Table 3). In the following discussion, the standardized partial regression coefficient between the TPST and SCSSMP is considered as the isolated statistical relationship between them.
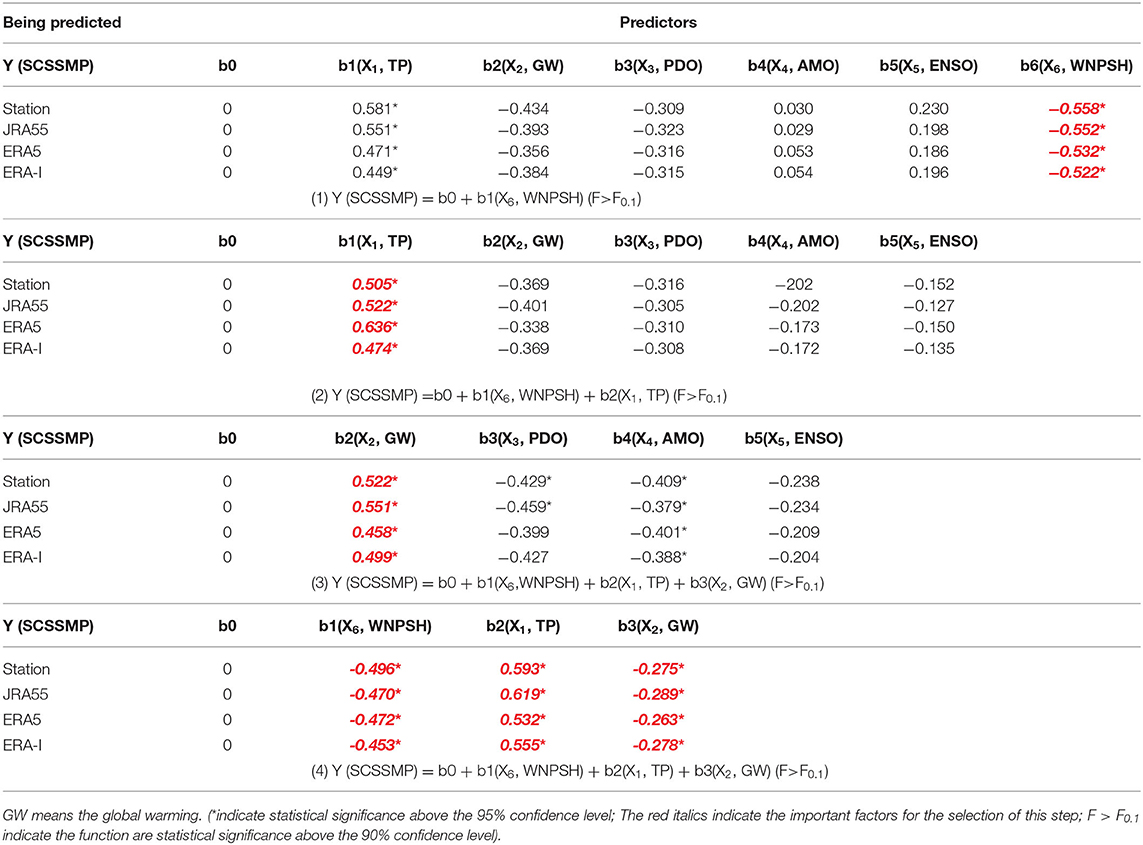
Table 2. Picking out the main factors affected SCSSM precipitation by using stepwise regression method.
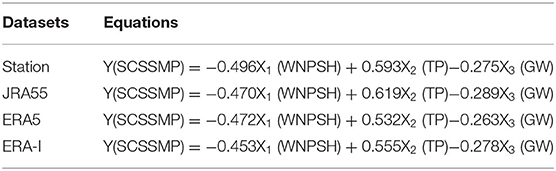
Table 3. The final constructed multiple regression equations between the SCSSM precipitation and Tibetan Plateau summer surface temperature (TPST), WNPSH, global warming (GW) at four datasets.
To examine the TPST–SCSSMP relationship after the regime shift in TPST, we calculate the standardized partial regression coefficients for period 1980–1994, 1998–2016, 1980–2016, respectively (Figure 5). For the entire study period (1980–2016, Figures 5C1–C4), we find a strong correlation between the TPST and east Asian summer monsoon rainfall (June to August), where the regression pattern resembles a “sandwich.” A positive relationship is found in South China, Indochina Peninsula, SCS, and the western north Pacific Ocean (WNP), as well as the North China and Northeast China. At the same time, the negative relationship between them is also obvious, extending from the southern of Tibetan Plateau across the mid–lower reaches of the Yangtze River to the Korean Peninsula and Japan along the south–northeast trend, which is generally dominated by the Meiyu front. This spatial pattern is fairly consistent with those results of Hsu and Liu (2003) and Wang et al. (2008). However, comparisons with the period of 1980–1994 and 1998–2016 (Figures 5A1–A4, B1–B4) show that the TPST–SCSSMP relationship changes, when the shift start around 1996. It is obviously found that the TPST–SCSSMP relationship is negative during 1980–1994 but positive for 1998–2016 in the South China Sea and the negative correlation along the Meiyu front is enhanced during 1998–2016. The observation dataset and three reanalysis datasets show the same phenomenon, which demonstrates that the recent changes relationship of TPST–SCSSMP responded to TPST shift over the last 20 years is a real phenomenon but not an artifact.
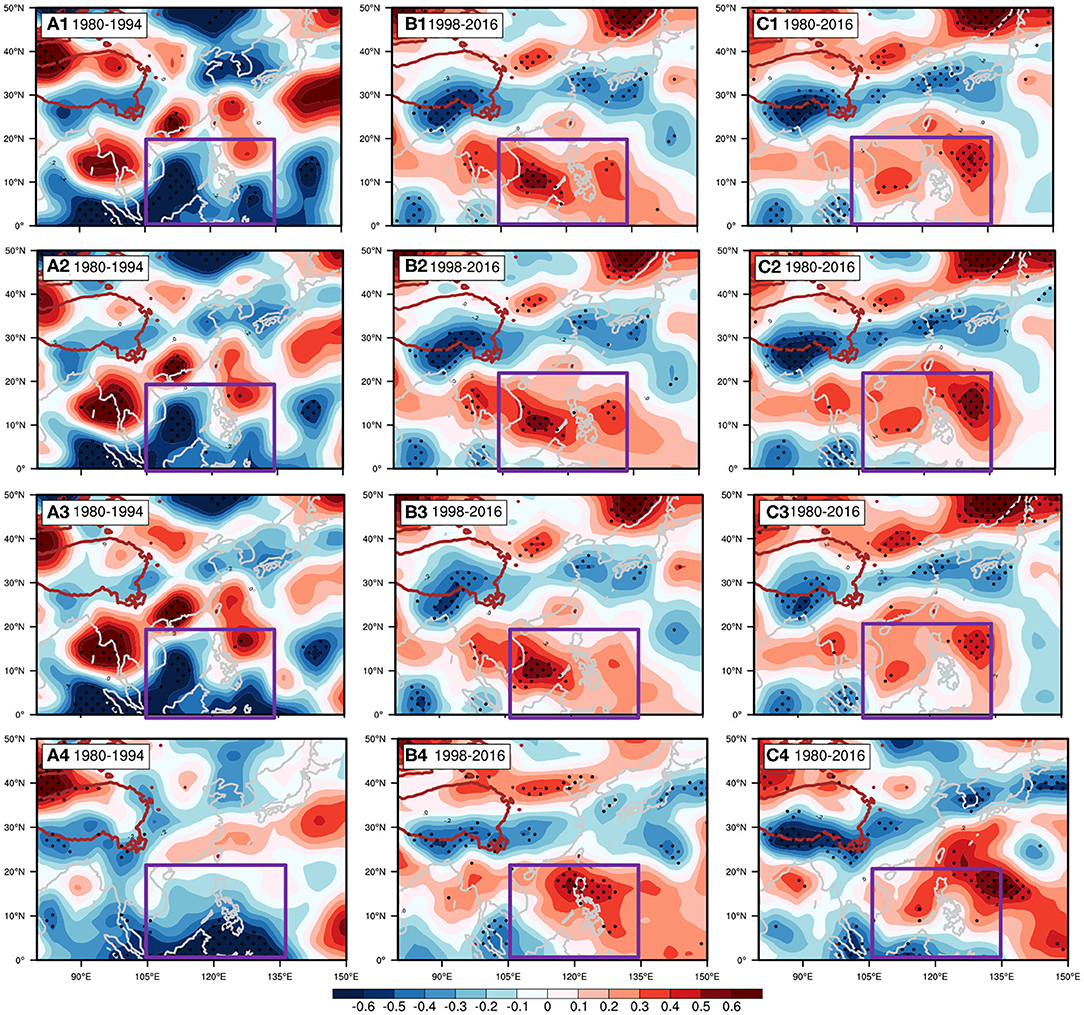
Figure 5. Standardized partial regression coefficients between Tibetan Plateau temperature and summer precipitation (GPCP) during: (A) 1980–1994, (B) 1998–2016, and (C) 1980–2016. 1: station data, 2: JRA55, 3: ERA5, and 4: ERA–Interim data. The purple box areas represent the South China Sea. Black spots indicate significant differences above the 90% confidence level based on the Student's t–test.
We also determine to identify whether the change relationship exist in other season (spring (MAM), summer (JJA), fall (SON), winter (DJF) by calculating the standard partial regression coefficients of TPST–SCSSMP during 1980–1994 and 1998–2016. A comparison of the results for these four seasons (not showed) shows that such a changing relationship of TPST–SCSSMP only is found in the summer season. In addition, the maximum value of the partial regression coefficient during the summer can reach 0.5 and−0.6, which is larger than that in the other seasons. We therefore consider that Tibetan Plateau temperature changes in the summer season are mainly responsible for those in the circulation and rainfall patterns in downstream regions.
To illustrate the changes of the TPST–SCSCM relationship, Figure 6 displays the 13–year moving average of the partial regression coefficients between TPST and SCSCMP in the South China Sea during 1980–2016. During 1985–1994, the partial regression coefficients between TPST and SCSCMP are almost negative, but they stepwise increase in the late 1990s and, finally, they are all greater than 0 and they can reach 0.8 at the early 2010s. The variations in the correlation coefficients are relatively consistent in the station data and the three reanalysis data sets, with only small differences in the values, which also verify that the TPST–SCSCM relationship is changes in the late 1990s. It should be noted that similar results are also captured in other moving average window lengths (11 years and 15 years) and small change the region (100-135°E, 0-20°N; 100-135°E, 0-22°N;100-140°E, 5-20°N; 100-145°E, 0-22°N; not showed).
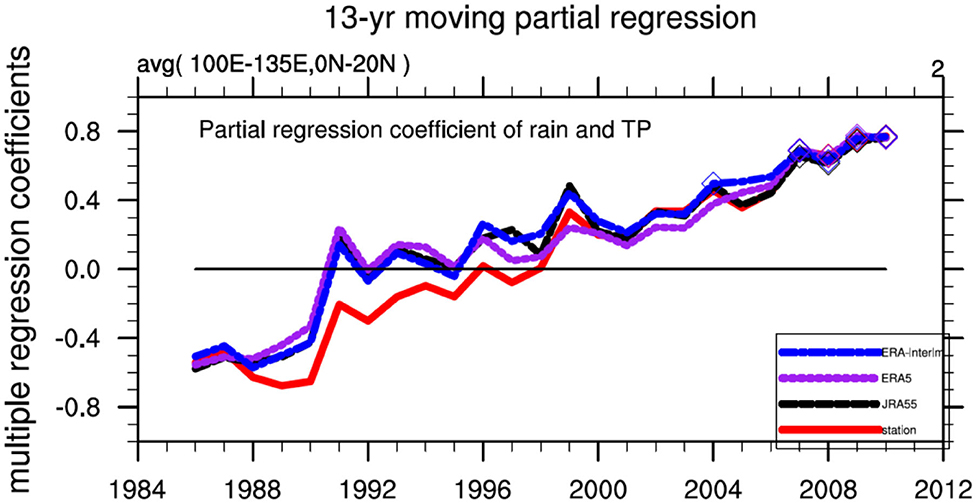
Figure 6. The 13–year moving standardized partial regression coefficients between Tibetan Plateau temperature and precipitation in the South China Sea (Purple box in Figure 5) during JJA in 1986–2010 using different data sets (red line: station data; black line: JRA55; purple line: ERA5; yellow line: ERA–Interim). The x–axis indicates the middle year in the 13–year moving window (e.g., 1986 indicates the correlation coefficient for 1980–1992 and 1987 indicates the correlation coefficient for 1981–1993). Hollow rhombuses indicate significant differences above the 90% confidence level based on the Student's t–test.
Effects of the TPST Interdecadal Variation on Atmospheric Circulation
Since the normalized partial regression coefficient between TPST and SCSSMP is considered to be an isolated statistical relationship between them, TPST and other meteorological elements (VIMF, OLR et al.) can also show the influences of the decadal variation of TPST on other elements. Hence, we use the same reanalysis datasets (JRA55, EAR5, ERA–Interim) to conduct regression analyses of TPST and wind field to show the influence of decadal variation of TPST on atmospheric circulation over the South China Sea (Figures 7, 8). During 1980–1994, an anticyclone appears at 700 hPa over the South China Sea (Figures 7A–E), which indicating that there is a negative correlation between the TPST and its wind field. In other words, the changes of TPST are more favorable for anticyclone enhance or for cyclone weaken at low–level over the South China Sea. At the same time, a strong anticyclone is also found over the Northern China and it also means the negative correlation between them. At 200 hPa, the South China Sea is dominated by the northerly wind, and the TPST is also negative correlated with the wind field (Figures 8A–E). The spatial pattern of this regression (TPST–wind field) is very similar to the regression pattern of TPST–SCSSMP from 1980 to 1994, which further confirms that changes in TPST deeply affect SCSSMP.
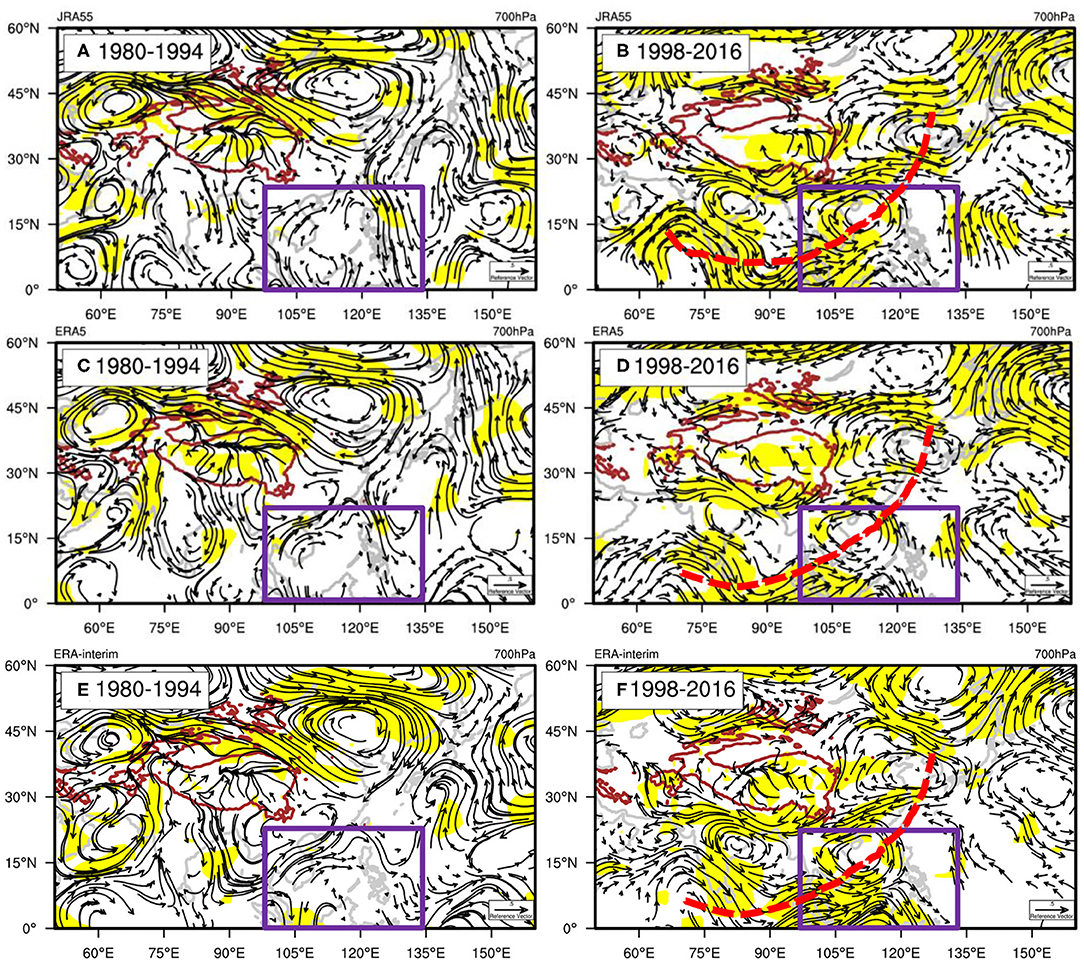
Figure 7. Standardized partial regression coefficients between Tibetan Plateau temperature and wind field at 700 hPa in East Asia: (A,C,E) for the period from 1980 to 1994 and (B,D,F) for the period from 1998 to 2016. (A,B) Based on JRA55; (C,D) based on ERA5; and (E,F) based on ERA–Interim. Red solid line represents the Tibetan Plateau. The purple boxed areas represent the South China Sea. Red dashed lines represent wave–like structures. Hence, the area where the averaged altitude above 3,000 m is already masked. Vectors are ignored for values <0.20. Shading indicates significant differences above the 90% confidence level based on the Student's t–test.
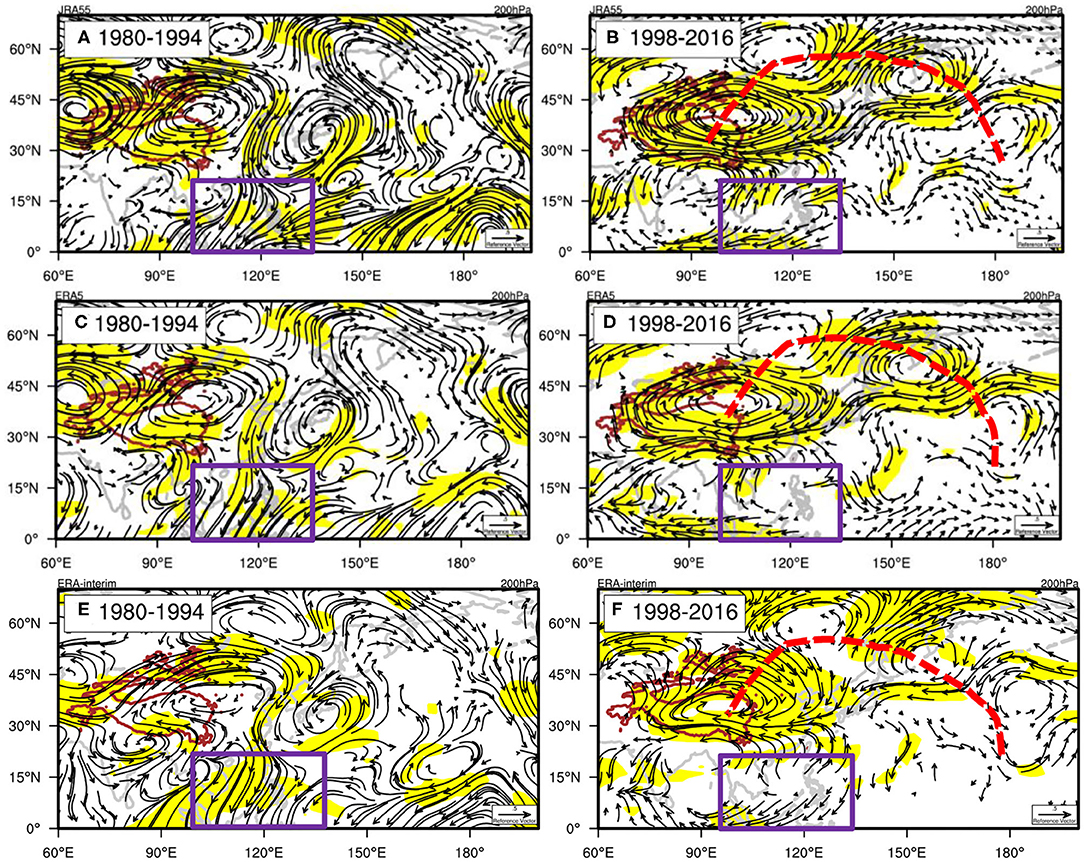
Figure 8. Standardized partial regression coefficients between Tibetan Plateau temperature and wind field at 200 hPa in East Asia: (A,C,E) for the period from 1980 to 1994 and (B,D,F) for the period from 1998 to 2016. (A,B) Based on JRA55; (C,D) based on ERA5; and (E,F) based on ERA-Interim. Red solid line represents the Tibetan Plateau. The purple boxed areas represent the South China Sea. Red dashed lines represent wave-like structures. Vectors are ignored for values <0.20. Shading indicates significant differences above the 90% confidence level based on the Student's t–test.
However, during 1998–2016, at 700 hPa, a wave–like structure in the low–latitude region moves easterly along the low–level monsoon flow (the red dotted line in Figures 7B–F). A strong cyclone exists in the southwestern part of the Tibetan Plateau and South China Sea. At 200 hPa, another wave train propagated downstream along the upper–level westerly jet stream and strong anticyclones appear over the South China Sea (Figures 8B–F). Combining the divergence at 200 hPa and convergence at 700 hPa over the South China Sea, strong convection is more likely to occurs and lead to water vapor converge, which means the likelihood of rain increase in the later period. By contrast, the region along the North China Plain across to the Korean Peninsula and to southern Japan is characterized by a northeasterly wind in the earlier period and anticyclonic circulation in the later period, thereby there is a negative correlation between the TPST and water vapor flux along the Meiyu front. It means less water vapor convergence here and the convection is suspended, leading to less rainfall in this area after the late 1990s. According to our results, during 1998–2016, the wave–like structure in the tropics moves westerly along the low–level monsoon and another wave train may propagate downstream along the upper–level westerly jet. Wang et al. (2008) has already conducted numerical experiments using the Max Planck Institute for Meteorology ECHAM4 to confirm that eastern Tibetan Plateau warming can excite or intensify these two Rossby wave trains. In this study, we confirm they results again by using the different reanalysis datasets.
To some extent, the partial regression coefficient pattern between TPST and SCSSMP is consistent with the SCSSM rainfall linear trend pattern (Figure 4B), which shows that the TPST is closely associated with the summer monsoon precipitation over the South China Sea, as also suggested in previous studies (Hsu and Liu, 2003; Wang et al., 2008). Consistent with the above mentioned (Figure 6), the relationship between the TPST and SCSSMP change when TPST underwent a shift that started around 1996. The TPST interdecadal variation may not only significantly affect the atmospheric circulation but also the water vapor transport and convective motion, and furtherly the SCSSMP. It is clearly that TPST is also negative correlated with VIMF over the South China Sea during 1980–1994 (Figures 9A–E), which meaning that it is much more dry air from the north Pacific gather here. Combining the regressions of wind field and water vapor flux, we are clearly understanding that the TPST change is not conducive to the SCSSMP. After the dramatic shift in TPST during 1998–2016, TPST is positive correlated with VIMF over the South China Sea (Figures 9B–F), which means that it is more favorable for water vapor convergence here. In other words, during 1998–2016, the area is more prone to precipitation when the convection conditions are suitable.
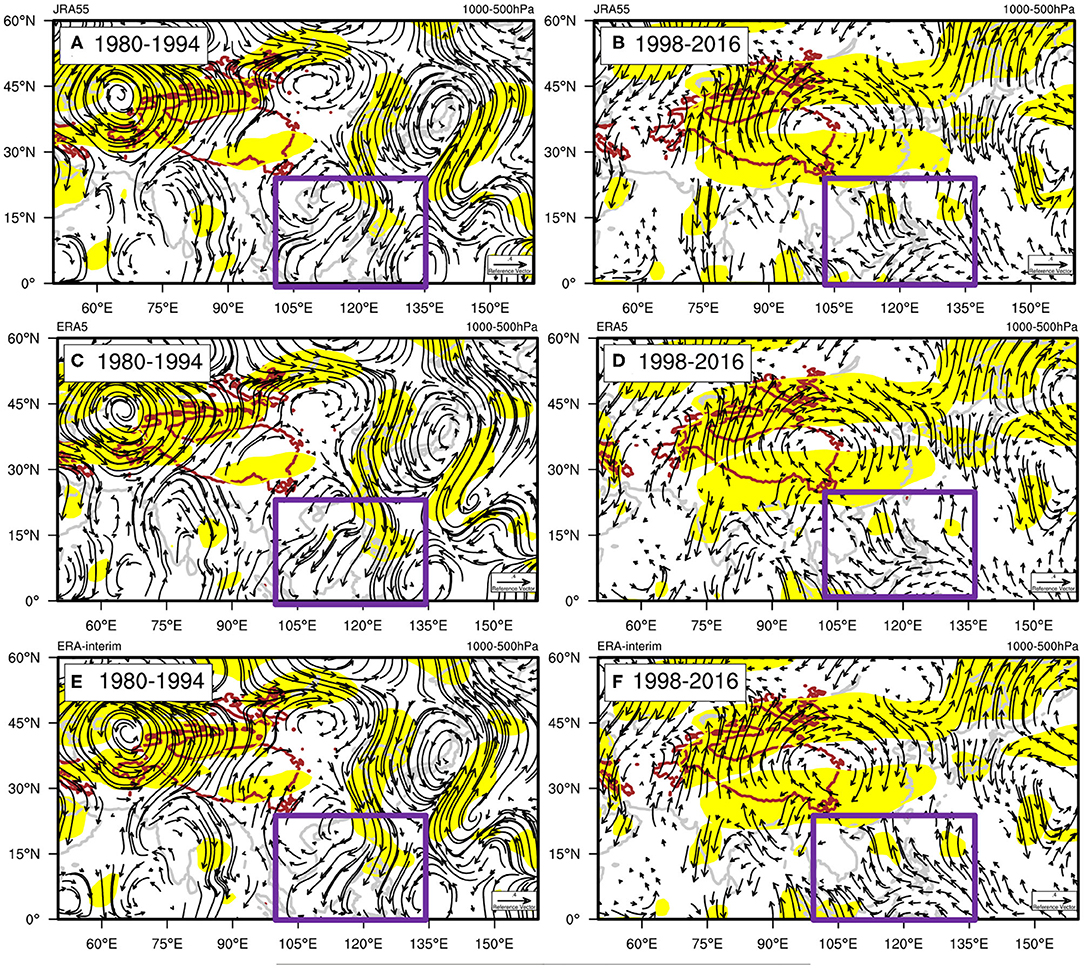
Figure 9. Standardized partial regression coefficients between Tibetan Plateau temperature and vertically integrated moisture flux (VIMF) between 1000–500 hPa in East Asia: (A,C,E) for the period from 1980 to 1994 and (B,D,F) for the period from 1998 to 2016. (A,B) Based on JRA55; (C,D) based on ERA5; and (E,F) based on ERA-Interim. Vectors are ignored for values <0.15. Shading indicates significant differences above the 90% confidence level based on the Student's t–test.
To further explore the changes in the convection motion after the interdecadal variation of the TPST, we study the changes in the TPST–OLR relationship to find the changes of the convection conditions. The regression coefficient between TPST at the observation sites and the OLR shows a positive correlation over the South China Sea during 1980–1994 (Figure 10a), while it is negative during 1998–2016 (Figure 10b). It is means that significant convection is likely to occur in the region during the latter period (Figure 10b), which also means that it is favorable for moisture convergence here. This change relationship is consistent with the results showed in Figures 7, 8. In addition, the relationship is characterized by a positive correlation along the Yunnan–Guizhou Plateau passing through the middle and lower reaches of the Yangtze River to Japan, which suggests that convection weakens in this region during 1998–2016.
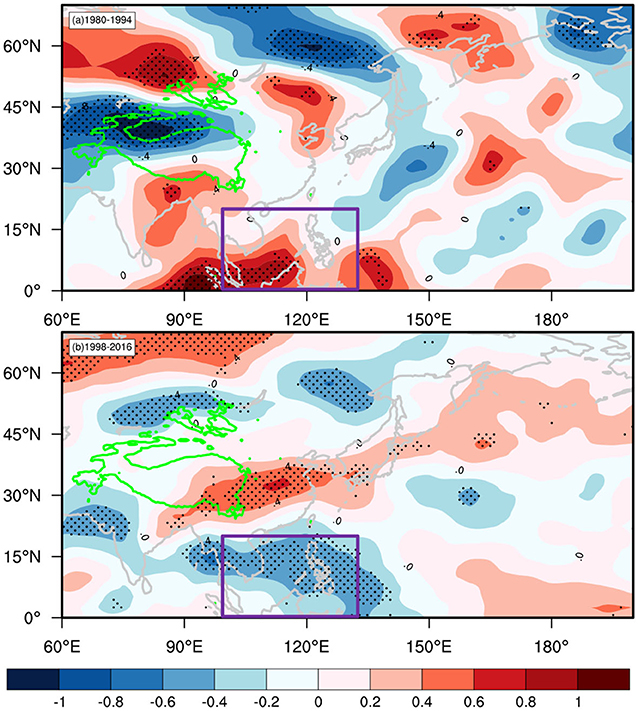
Figure 10. Standardized partial regression coefficients between Tibetan Plateau temperature at station and OLR in East Asia: (a) for the period from 1980 to 1994 and (b) for the period from 1998 to 2016. The purple boxed areas represent the South China Sea. Black spots indicate significant differences above the 90% confidence level based on the Student's t–test.
During 1980–1994, the TPST is not conducive to convection in the South China Sea and water vapor could not gather there (Figures 9A–E), so the precipitation is lower in the early period. In the later period, TPST warming is conducive to convection in the South China Sea, and therefore the low–level moisture and precipitation increase (Figures 4, 9B–F), and thus there is a positive relationship between the TPST and precipitation in the late 1990s. Our results suggest that in a changing climate, we should be cautious when using predictions with interdecadal variations (Piao et al., 2014; Zhang et al., 2019).
Conclusions and Discussions
Meteorological observation sites, JRA55, ERA5, and ERA–Interim datasets totally show that, between 1980 and 2016, the Tibetan Plateau summer surface temperature (TPST) increased rate (0.32°C/decade−0.42°C/decade) is far greater than the rate of global warming (0.15°C/decade). All datasets show that a regime shift in the TPST occurs around 1996 (P < 0.05), which means that a significant interdecadal variation exists in the TPST.
A stepwise regression model is conducted to explore global warming and natural internal variabilities, such as PDO, AMO, ENSO, and WNPSH, that can affect the changes in the relationship between the TPST and South China Sea summer monsoon precipitation (SCSSMP). We exclude the signals of ENSO, PDO, and AMO and finally set up a multiple regression equation between SCSSMP and TPST, WNPSH, global warming. The standardized partial regression coefficients between the TPST and SCSSMP is considered as the isolated statistical relationship the between them, which exclude the influences of other factors. These results showed that the correlation between the TPST and SCSSMP changes between 1980 and 2016. The TPST–SCSSMP relationship changes from a negative correlation to a positive correlation in the late 1990s.
The interdecadal variation of the TPST significantly affect the hemispheric atmospheric circulation, furtherly leading to the change of the SCSSMP. During 1980–1994, the anticyclone exists over the South China Sea is not conducive to convection (Figure 10a) and water vapor cannot gather there (Figures 9A–E), and therefore less precipitation occurs over the South China Sea. Hence, there is a negative relationship between the TPST and precipitation in the early period. In the later period, a wave–like structure in the low–latitude moves easterly along the low–level monsoon and a strong cyclonic circulation exists in the South China Sea, which is consistent with the negative correlation between the TPST–OLR. Hence, the TPST warming is conducive to convection over the South China Sea to increase the low–level moisture and precipitation, and thus there is a positive relationship between the TPST and precipitation in the late 1990s. Those results suggest that we should be cautious when using predictor with interdecadal variations in a changing climate.
Some issues still do not involve. Why there is a negative relationship between TPST and Meiyu front, extending from the southern of TP across the mid–lower reaches of the Yangtze River to the Korean Peninsula and Japan along the south–northeast trend. Hahn and Manabe (1975) suggested that the interannual variation of the TP heating likely modulated a Meiyu rain belt. Hsu and Liu (2003) further examined that he TP heating might impact the zonally elongated rainfall (Meiyu front) but not be the only dominant forcing. Recently, He et al. (2019) using the output of 30 models from CMIP5 provided further evidences that the enhanced latent heating maybe substantially increased precipitation over the southeastern TP. In other words, enhanced latent heat release (corresponding to the cooler temperature) might be responsible for the positive precipitation anomaly over the southeastern Tibetan Plateau. However, to what extent can TP heating or latent heat release explain the change of Meiyu. Further discussions are still needed.
According to Figure 8, it is likely that the summer diabatic heating over TP after 1998 is enhanced because there is a significant anticyclonic anomaly at 200 hPa. Does the increasing TPST denote an intensity surface heating source? Hoskins (1991) interpreted the atmospheric response to a given thermal forcing as the formation of lower layer cyclonic circulation and upper layer anticyclonic circulation. Wu and Liu (2000) furtherly developed the thermal adaptation theory (a prescribed deep/shallow convective-type heating). Wang et al. (2008) conducted the numerical experiments with atmospheric general circulation models by changing the albedo and showed that atmospheric heating would be enhanced after the TP temperatures rising. The reduction of albedo over the TP results in a local surface air temperature increase by more than 2°C. According to the thermal adaptation, the TP heating will result in a shallow cyclonic circulation at low-level and a deep anticyclonic circulation at high-level, which is consistent with the significant anticyclonic anomaly at 200 hPa (Figure 8). These results suggest that the summer diabatic heating over TP is likely enhance after 1998.
It should also be noted that, in this study, a simplified complex sea–land–gas interaction system is adopted, and these results are based on the assumption of a linear relationship between TPST and SCSSMP. In addition, many other factors could have affected the precipitation of South China Sea, such as the polar snow cover and snow depth. We only considered five other factors comprising global warming, ENSO, WNPSH, PDO, and AMO. Finally, uncertainties remain because our understanding of the linkage between the TPST and SCSSMP is based on statistical analyses. In the following study, we will use the ECHAM 6 numerical model to further verify our findings and understand the mechanism of the change relationship between TPST–SCSSMP.
Data Availability Statement
The raw data supporting the conclusions of this article will be made available by the authors, without undue reservation.
Author Contributions
JX and ML designed the experiments and ML conducted them. JC, LW, and XX provide some useful suggestions. ML prepared the manuscript with contributions from all of the co-authors. All authors contributed to the article and approved the submitted version.
Funding
This paper is supported by The Second Tibetan Plateau Scientific Expedition and Research (STEP) program (grant 2019QZKK0105) and the Funded by National Key R&D programs of China (grants 2018YFC1505705; 2018YFC1501706). It is also supported by the project of Enhancing School with Innovation of Guangdong Ocean University (230419053); Projects (Platforms) for Construction of Top-ranking Disciplines of Guangdong Ocean University (231419022); Special Funds of Central Finance Support the Development of Local Colleges and Universities (000041).
Conflict of Interest
The authors declare that the research was conducted in the absence of any commercial or financial relationships that could be construed as a potential conflict of interest.
Acknowledgments
We sincerely thank two reviewers whose comments allowed us to improve the manuscript substantially.
References
Adler, R. F., Huffman, G. J., Chang, A., Ferraro, R., Xie, P., Janowiak, J., et al. (2003). The version 2 Global Precipitation Climatology Project (GPCP) monthly precipitation analysis (1979-present). Hydrometeor J. 4:1147–1167. doi: 10.1175/1525-7541(2003)004<1147:TVGPCP>2.0.CO;2
Annamalai, H., Hafner, J., Sooraj, K. P., and Pillai P. (2013). Global warming shifts the monsoon circulation, drying South Asia. Climate J. 26, 2701–2718. doi: 10.1175/JCLI-D-12-00208.1
Beniston, M. (2003). Climatic change in mountain regions: a review of possible impacts. Clim. Change. 59, 5–31. doi: 10.1007/978-94-015-1252-7_2
Beniston, M., Diaz, H., and Bradley, R. (1997). Climatic change at high elevation sites: an overview. Clim. Change 36, 233–251. doi: 10.1023/A:1005380714349
Berrisford, P., Dee, D., Poli, P., and Brugge, P. (2011). The ERA-Interim Archive Version 2.0. Berkshire: Reading.
Bollasina Massimo, A., and Gabriele, M. (2018). On the link between the subseasonal evolution of the North Atlantic Oscillation and East Asian climate. Clim. Dyn. 51, 3537-3557. doi: 10.1007/s00382-018-4095-5
Boos, W. R., and Kuang, Z. M. (2013). Sensitivity of the South Asian Monsoon to elevated heating. Sci. Rep. 3:1192. doi: 10.1038/srep01192
Burke, C., and Stott, P. (2017). Impact of anthropogenic climate change on the East Asian Summer Monsoon. Clim. J. 30, 5205–5220. doi: 10.1175/JCLI-D-16-0892.1
Ceppi, P., Scherrer, S., Fischer, A., and Appenzeller, C. (2010). Revisiting swiss temperature trends 1959-2008. Int. J. Climatol. 32, 203-213. doi: 10.1002/joc.2260
Ding, Y. H. (1992). Effects of the Qinghai-Xizang(Tibetan) Plateau on the circulation features over the plateau and its surrounding areas. Adv. Atmos. Sci. 9, 112-130. doi: 10.1007/BF02656935
Ding, Y. H., Sun, Y., Wang, Z., Zhu, Y., and Song, Y. (2009). Inter-decadal variation of the summer precipitation in China and its association with decreasing Asian summer monsoon. Part 507 II: possible causes. Int. J. Climatol. 28:508. doi: 10.1002/joc.1759
Draper, N., and Smith, H. (1981). Applied Regression Analysis. 2d Edition. New York, NY: John Wiley & Sons, Inc.
Duan, A. M., Li, F., Wang, M. R., and Wu, G. X. (2011). Persistent weakening trend in the spring sensible heat source over the Tibetan Plateau and its impact on the Asian summer monsoon, Clim. J. 24, 5671-5682. doi: 10.1175/JCLI-D-11-00052.1
Duan, A. M., Wang, M. R., Lei, Y. H., and Cui, Y. F. (2013). Trends in summer rainfall over China associated with the Tibetan Plateau sensible heat source during 1980-2008. Clim. J. 26, 261-275. doi: 10.1175/JCLI-D-11-00669.1
Duan, A. M., and Wu, G. X. (2005). Role of the Tibetan Plateau thermal forcing in the summer climate patterns over subtropical Asia. Clim. Dyn. 24, 793-807. doi: 10.1007/s00382-004-0488-8
Duan, A. M., and Wu, G. X. (2008). Weakening trend in the atmospheric heat source over the Tibetan Plateau during recent decades, Part I: Observations. J. Clim. 21, 3149-3164. doi: 10.1175/2007JCLI1912.1
Duan, A. M., Wu, G. X., Liu, Y. M., Ma, Y. M., and Zhao, P. (2012). Weather and climate effects of the Tibetan Plateau. Adv. Atmos. Sci. 29, 978-992. doi: 10.1007/s00376-012-1220-y
Efroymson, M. A. (1960). “Multiple regression analysis,” Mathematical Methods for Digital Computers, eds A. Ralston and H. S. Wilf (New York, NY: Wiley), 191–203.
Fan, Y., Fan, K., Xu, Z., and Li, S. (2018). ENSO-South China Sea summer monsoon interaction modulated by the Atlantic Multidecadal Oscillation. Clim. J. 31, 3061-3076. doi: 10.1175/JCLI-D-17-0448.1
Feng, J., Wang, L., and Chen, W. (2014). How does the East Asian summer monsoon behave in the decaying phase of El Niño during different PDO phases? Clim. J. 27, 2682-2698. doi: 10.1175/JCLI-D-13-00015.1
Gao, K. L., Duan, A., De, M., Chen, G., and Wu, X. (2019). Surface energy budget diagnosis reveals possible mechanism for the different warming rate among Earth's three poles in recent decades. Sci. Bull. 64, 1140-1143. doi: 10.1016/j.scib.2019.06.023
Giorgi, F., Hurrel, J., Marinucci, M., and Beniston, M. (1997). Elevation dependency of the surface climate change signal: a model study. Clim. J. 10, 288–296. doi: 10.1175/1520-0442(1997)010<0288.EDOTSC>2.0.CO;2
Hahn, D. G., and Manabe, S. (1975). The role of mountains in the South Asian monsoon circulation. J. Atmos. Sci. 32, 1515-1541. doi: 10.1175/1520-0469(1975)032<1515.TROMIT>2.0.CO;2
He, C., Wang, Z., Zhou, T., and Li, T. (2019). Enhanced latent heating over the Tibetan Plateau as a key to the enhanced east Asian Summer Monsoon circulation under a warming climate. Clim. J. 32, 3373-3388. doi: 10.1175/JCLI-D-18-0427.1
Hoskins, B. (1991). Towards a PV-J view of the general circulation. Tellus. 43AB:27-35. doi: 10.1034/j.1600-0870.1991.t01-3-00005.x
Hsu, H. H., and Liu, X. (2003). Relationship between the Tibetan plateau heating and east Asian summer monsoon rainfall, Geophys. Res. Lett. 30:2066. doi: 10.1029/2003GL017909
Kobayashi, C., and Iwasaki, T. (2016). Brewer-Dobson circulation diagnosed from JRA-55. J. Geophys. Res. Atmos. 121:476. doi: 10.1002/2015JD023476
Lawrimore, J., Menne, M., Gleason, B., Williams, C., Wuertz, D., Vose, R., et al. (2011). An overview of the global historical climatology network monthly mean temperature data set, version 3. J Geophys Res. 116:D19121. doi: 10.1029/2011JD016187
Lee, S, Seo, Y., and Ha, K. (2013). Impact of the western North Pacific Subtropical High on the East Asian Monsoon precipitation and the Indian Ocean precipitation in the Boreal summertime. Asia-Pacific J. Atmos. Sci. 49, 171-182. doi: 10.1007/s13143-013-0018-x
Liu, X., and Chen, B. D. (2000). Climate warming in the Tibetan Plateau during recent decades. Int. J. Climatol. 20, 1729-1742. doi: 10.1002/1097-0088(20001130)20.14<1729.:AID-JOC556>3.0.CO;2-Y
Liu, X., Cheng, Z., Yan, L., and Yin, Z. (2009). Elevation dependency of recent and future minimum surface air temperature trends in the Tibetan Plateau and its surroundings. Global Planet Chang. 68, 164-174. doi: 10.1016/j.gloplacha.2009.03.017
Liu, Y. M., Wu, G. X., and Hong, J. L. (2012). Revisiting Asian monsoon formation and change associated with Tibetan Plateau forcing II. Change. Climate Dyn. 39, 1183–1195. doi: 10.1007/s00382-012-1335-y
Lu, C. X., Yu, G., and Xie, G. D. (2005). Tibetan Plateau serves as a water tower. IEEE Trans. Geosci. Remote Sens. 5, 1183–1195.
Malardel, S., Wedi, N., Deconinck, W., Diamantakis, M., Kuhnlein, C., Mozdzynski, G., et al. (2015). A New Grid for the IFS. Newsletter No. 146 - Winter 2015/16, ECMWF, 6.
Ohmura, A. (2012). Enhanced temperature variability in high-altitude climate change. Theor. Appl. Climatol. 110, 499-508. doi: 10.1007/s00704-012-0687-x
Pepin, N., Bradley, R. S., and Diaz, H. F. (2015). Elevation-dependent warming in mountain regions of the world. Nat. Clim. Change 5, 424-430. doi: 10.1038/nclimate2563
Pepin, N., and Lundquist, J. (2008). Temperature trends at high elevations: patterns across the globe. Geophys. Res. Lett. 35, L14701. doi: 10.1029/2008GL034026
Piao, S., Nan, H., and Chris, H. (2014). Evidence for a weakening relationship between interannual temperature variability and northern vegetation activity. Nat. Commun. 5:5018. doi: 10.1038/ncomms6018
Rangwala, I. (2013). Amplified water vapor feedback at high altitudes during winter. Int. J. Climatol. 33, 897-903. doi: 10.1002/joc.3477
Rangwala, I., and Miller, J. R. (2012). Climate change in mountains: a review of elevation-dependent warming and its possible causes. Clim. Change 114, 527-547. doi: 10.1007/s10584-012-0419-3
Seidel, D., and Free, M. (2003). Comparison of lower-tropospheric temperature climatologies and trends at low and high elevation radiosonde sites. Clim. Change 59, 53-74. doi: 10.1007/978-94-015-1252-7_4
Si, D., and Ding, Y. (2013). Decadal change in the correlation pattern between the Tibetan Plateau winter snow and the East Asian summer precipitation during 1979-2011. J. Clim. 26, 7622–7634. doi: 10.1175/JCLI-D-12-00587.1
Song, F., and Zhou, T. (2015). The Crucial role of internal variability in modulating the decadal variation of the East Asian Summer Monsoon-ENSO Relationship during the twentieth century. Clim. J. 28, 7093-7107. doi: 10.1175/JCLI-D-14-00783.1
Stanley, S. (2017). Summer rainfall patterns in east Asia shift with the wind. Eos. 98, 3011. doi: 10.1029/2017EO083011
Strong, G. S., Proctor, B., Wang, M., Soulis, E. D., Smith, C. D., Seglenieks, F., et al. (2002). Closing the Mackenzie Basin water budget, water years 1994/95 to 1996/97. Atmos. Ocean 40, 113-124. doi: 10.3137/ao.400203
Su, J., Duan, A., and Xu, H. (2017). Quantitative analysis of surface warming amplification over the Tibetan Plateau after the late 1990s using surface energy balance equation. Atmos. Sci. Let. 18, 112–117. doi: 10.1002/asl.732
Wang, B., Qing, B., and Hoskins, B. (2008). Tibetan Plateau warming and precipitation changes in East Asia. Geo. Res. Let. 35, L14702. doi: 10.1029/2008GL034330
Wang, Q., Fan, X., and Wang, M. (2014). Recent warming amplification over high elevation regions across the globe. Clim. Dyn. 43, 87-101. doi: 10.1007/s00382-013-1889-3
Wu, G. X., Duan, A. M., Liu, Y. M., Mao, J. Y., Ren, R. C., Bao, Q., et al. (2014). Tibetan Plateau climate dynamics: recent research progress and outlook. Natl. Sci. Rev. 2, 100-116. doi: 10.1093/nsr/nwu045
Wu, G. X., and Liu, Y. M. (2000). Thermal adaptation, overshooting, dispersion, and subtropical high. Part I: Thermal adaptation and overshooting (in Chinese). Chin. J. Atmos. Sci. 24, 433–436.
Wu, G. X., Liu, Y. M., Dong, B. W., Liang, X. Y., Duan, A. M., Bao, Q., et al. (2012b). Revisiting Asian monsoon formation and change associated with Tibetan Plateau forcing: Formation I. Clim. Dyn. 39, 1169-1181. doi: 10.1007/s00382-012-1334-z
Wu, G. X., Liu, Y. M., He, B., Bao, Q., Duan, A. M., and Jin, F. F. (2012a). Thermal controls on the Asian summer monsoon. Sci Rep. 2:404. doi: 10.1038/srep00404
Wu, L., Feng, X., and Liang, M. (2017). Insensitivity of the Summer South Asian High Intensity to a Warming Tibetan Plateau in Modern Reanalysis Datasets. J. Clim. 30, 3009-3024. doi: 10.1175/JCLI-D-16-0359.1
Wu, R., Hu, Z. Z., and Kirtman, B. (2003). Evolution of ENSO-related rainfall anomalies in East Asia. J. Clim. 16, 3742-3758. doi: 10.1175/1520-0442(2003)016<3742.EOERAI>2.0.CO;2
Xu, L., Xu, L., and He, S. (2018). Numerical simulation on the southern flood and northern drought in summer 2014 over Eastern China. Theo. Appl. Climat. 134, 1287-1299. doi: 10.1007/s00704-017-2341-0
Xu, X. D., Lu, C. G., and Shi, X. H. (2010). Large-scale topography of China: a factor for the seasonal progression of the Meiyu rainband? J. Geo. Res. 115, D02110. doi: 10.1029/2009JD012444
Xu, X. D., Tao, S. Y., and Wang, J. Z. (2002). The relationship between water vapor transport features of Tibetan Plateau-monsoon “large triangle” affecting region and drought-flood abnormality of China (in Chinese). Acta Meteorol. Sin. 60, 257-266.
Xu, X. D., Zhao, T., and Shi, X. (2015). A study of the role of the Tibetan Plateau's thermal forcing in modulating rainband and moisture transport in eastern China (in Chinese). Acta Meteorol. Sin. 73, 20-35.
Yanai, M., Li, C. F., and Song, Z. S. (1992). Seasonal heating of the Tibetan Plateau and its effects on the evolution of the Asian summer monsoon. J. Meteorol. Soc. Jpn. 70, 319-351. doi: 10.2151/jmsj1965.70.1B_319
Ye, D. Z., and Gao, Y. (1992). The Meteorology of the Qinghai-Xizang (Tibetan) Plateau. Beijing: Science Press.
Ye, D. Z., Luo, S. W., and Zhu, B. Z. (1957). The wind structure and heat balance in the lower troposphere over Tibetan Plateau and its surrounding, Acta Meteorol. Sin. 28, 108-121.
Ye, D. Z., and Wu, G. X. (1998). The role of the heat source of the Tibetan Plateau in the general circulation. Meteorol. Atmos. Phys. 67, 181-198. doi: 10.1007/BF01277509
Zhang, T., Wang, T., and Krinner, G. (2019). The weakening relationship between Eurasian spring snow cover and Indian summer monsoon rainfall. Sci. Adv. 5:eaau8932. doi: 10.1126/sciadv.aau8932
Zhang, Y., Li, T., and Wang, B. (2004). Decadal change of the spring snow depth over the Tibetan Plateau: the associated circulation and influence on the East Asian summer monsoon. Clim. J. 17, 2780–2793. doi: 10.1175/1520-0442(2004)017<2780.DCOTSS>2.0.CO;2
Zhao, S. R., Song, Z. S., and Ji, L. R. (2003). Heating Effect of the Tibetan Plateau on rainfall anomalies over North China during rainy season (in Chinese). Chin. J. Atmos. Sci. 27, 881–893.
Zhou, X. J., Zhao, P., and Chen, J. M. (2009). Impacts of thermodynamic processes over the Tibetan Plateau on the Northern Hemispheric climate. Sci. China Ser. 52, 1679–1693. doi: 10.1007/s11430-009-0194-9
Keywords: interdecadal variations, South China Sea summer monsoon, Tibetan Plateau, changing relationship, warming amplification
Citation: Liang M, Xu J, Chan JCL, Wu L and Xu X (2020) Changing Relationship Between Tibetan Plateau Temperature and South China Sea Summer Monsoon Precipitation. Front. Environ. Sci. 8:583466. doi: 10.3389/fenvs.2020.583466
Received: 15 July 2020; Accepted: 26 October 2020;
Published: 26 November 2020.
Edited by:
Haishan Chen, Nanjing University of Information Science and Technology, ChinaReviewed by:
Anmin Duan, Institute of Atmospheric Physics (CAS), ChinaWen Zhou, City University of Hong Kong, Hong Kong
Copyright © 2020 Liang, Xu, Chan, Wu and Xu. This is an open-access article distributed under the terms of the Creative Commons Attribution License (CC BY). The use, distribution or reproduction in other forums is permitted, provided the original author(s) and the copyright owner(s) are credited and that the original publication in this journal is cited, in accordance with accepted academic practice. No use, distribution or reproduction is permitted which does not comply with these terms.
*Correspondence: Jianjun Xu, jxu@gdou.edu.cn