Will Climate Change Exacerbate the Economic Damage of Flood to Agricultural Production? A Case Study of Rice in Ha Tinh Province, Vietnam
 Pham Quy Giang1*
  Tran Trung Vy2
- 1Faculty of Environment, Ha Long University, Quang Ninh, Vietnam
- 2Ha Long University, Quang Ninh, Vietnam
In developing countries in general and in Vietnam in particular, flood induced economic loss of agriculture is a serious concern since the livelihood of large populations depends on agricultural production. The objective of this study was to examine if climate change would exacerbate flood damage to agricultural production with a case study of rice production in Huong Son District of Ha Tinh Province, North-central Vietnam. The study applied a modeling approach for the prediction. Extreme precipitation and its return periods were calculated by the Generalized Extreme Value distribution method using historical daily observations and output of the MRI-CGCM3 climate model. The projected extreme precipitation data was then employed as an input of the Mike Flood model for flood modeling. Finally, an integrated approach employing flood depth and duration and crop calendar was used for the prediction of potential economic loss of rice production. Results of the study show that in comparison with the baseline period, an increase of 49.14% in the intensity of extreme precipitation was expected, while the frequency would increase 5 times by 2050s. As a result, the seriousness of floods would increase under climate change impacts as they would become more intensified, deeper and longer, and consequently the economic loss of rice production would increase significantly. While the level of peak flow was projected to rise nearly 1 m, leading the area of rice inundated to increase by 12.61%, the value of damage would rise by over 21% by 2050s compared to the baseline period. The findings of the present study are useful for long-term agricultural and infrastructural planning in order to tackle potential flooding threats to agricultural production under climate change impacts.
Introduction
Over the past few decades, natural disasters have been reported with increasing frequency and severity worldwide (Keerthiratne and Tol, 2018; Boustan et al., 2020; Rosselló et al., 2020). According to the United Nations Office for Disaster Risk Reduction (UNISDR, 2009), the cost of natural disasters around the world will exceed US$300 billion annually through 2050 and in fact, that figure was exceeded in 2011 when the cost exceeded US$360 billion (Daniell et al., 2016). Floods are listed among the most frequent and damaging natural disasters. The International Disaster Database reported that the average annual global cost of flood damage is approximately US$90 billion. Natural disasters in general and floods in particular, make developing countries particularly vulnerable because their responsiveness is much lower than that of developed countries (Messner et al., 2007; Nur and Shrestha, 2007; Banerjee, 2010; Andrade et al., 2018; Nkwunonwo et al., 2020). Figure 1 presents the number of natural disasters worldwide during the period of 1970–2019, where extreme weather and floods are dominant.
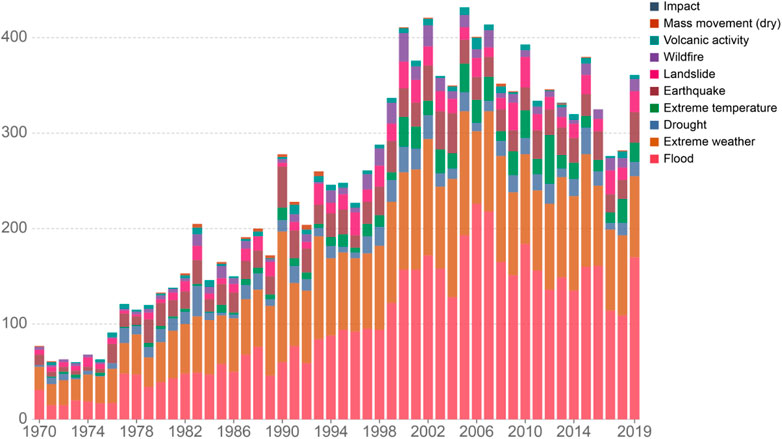
FIGURE 1. Global reported natural disasters during 1970–2019 (EMDAT, 2020).
According to Whitmee et al. (2015), the destruction of natural ecosystems is a major environmental concern that threatens agricultural production and thus the stability of national flood system in many countries particularly as well as global food systems generally. Global climate change and its related disasters, especially, have been determined as a foremost determinant of the devastation of ecosystems globally, consequently impacts on food systems and rural livelihoods. In fact, the State of Food Security and Nutrition in the World 2019 (FAO, 2019) reported that the targets of Millennium Development Goals of the United Nations ending in 2015 were not accomplished and more than 820 million people around the world are still hungry, this makes it difficult to accomplish the goal of zero hunger by 2030 set by the Sustainable Development Goals (SDGs). Considering climate change as a challenge to the availability, access, stability, and utilization aspects of food security, the sustainability of the environment is a long-term target that must be promoted in pursuit of sustainable development. Thus, preserving environmental sustainability and ensuring food security are interlinked and needed to take immediate actions for countries to meet the SDGs. Actions for environmental sustainability in the context of food security can be promoted through technical, policy, capacity enhancement and finance elements in the energy sector (Ngarava et al., 2019; Murshed et al., 2020; Xue et al., 2021) and the agricultural sector (Cambell et al., 2018; Tumushabe, 2018; Bizikova et al., 2020) among others.
A report of UNISDR, 2009 showed that Vietnam is one of the countries expose the most to floods (Figure 2). For developing countries in general and for Vietnam in particular, the loss of agricultural production due to flooding is a major obstacle to poverty reduction and economic development because the majority of the population lives in rural areas and depends on agricultural production. Evaluation of flood damage to agricultural crops is therefore critical for flood risk management as well as for long-term adaptation and mitigation actions in order to minimize the loss in the agricultural sector (Vu et al., 2013; Win et al., 2018; Balana et al., 2019; Kim, 2019).
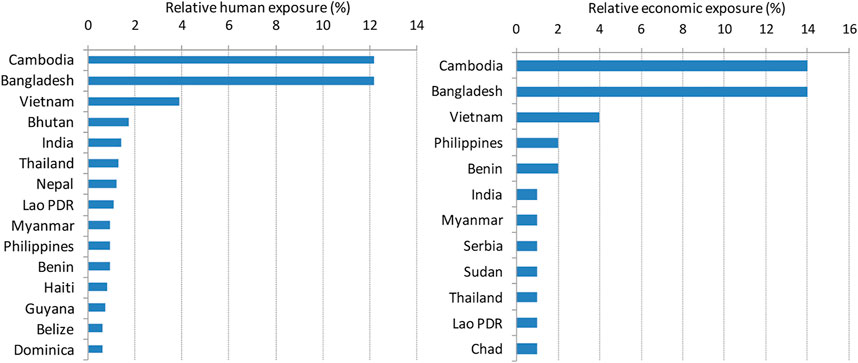
FIGURE 2. Human exposure and economic exposure to floods (UNISDR, 2009).
A wide variety of methodologies have been introduced for the evaluation of economic damage of floods to agricultural crops around the world. In Japan, a mathematical model for flood damage evaluation including a physically based distributed hydrologic model integrated with a distributed flood loss estimation model was introduced by Dutta et al. (2003). A similar approach using the flood model MIKE FLOOD coupled with damage functions was also applied by Vozinaki et al. (2012) to assess flood damage in Greece. In China, Penning-Rowsell et al. (2013) applied a depth-loss relationship to study flood damage in the Taihu Basin. In this study, asset categories and flood depth were used to establish the depth-loss rate based on an existing “flood loss rate”, which is the ratio of the pre-flood property value at different ranges of flood depths, and its associated flood damage data recorded from floods in the past. The gap in these studies is that the impact of climate change on floods, which has become obvious nowadays, was ignored.
In Vietnam, agriculture contributes around one quarter to the country’s Gross National Product (GDP). However, according to Pham et al. (2014), agricultural production is frequently threatened by increasingly severe climate change and floods. The United Nation Office for Disaster Risk Reduction (2009) stated that Vietnam is among the top countries facing the most serious effects by floods, meanwhile Standard and Poor, (2014) ranked Vietnam as the world’s second most vulnerable country to climate change. In fact, according to the Ministry of Natural Resources and Environment (MONRE, 2016), observational analysis of climate variables has shown clear manifestations of climate change in Vietnam. Specifically, on a nationwide average, temperatures rose by 0.62°C in the period of 1958–2014. In particular, it increased 0.42°C in the period of 1985–2014 compared with the period of 1981–1990. Between 1958 and 2014, annual rainfall tended to increase slightly over VietNam. In a seasonal scale, rainfall tended to rise in the winter and spring, however, it reduced in the autumn. Annual rainfall was found to decline by 5.8–12.5% in the Northern part of Viet Nam, but in the Southern part it increased by 6.9–19.8% depending on the observed station. In addition, droughts in the dry season occurred more frequently, meanwhile extreme rainfall increased considerably in the Central part. The number of strong typhoons causing serious flooding was also found with an increasing trend during the observation period (1958–2014). According to Climate change and sea level rise scenarios for Vietnam (MONRE, 2016), by the end of this century, under the RCP8.5 scenarios, temperature would increase by 3.3–4.0°C in the North and 3.0–3.5°C in the South. For rainfall, the greatest increase would be over 20% in most of the North, Central Coast, a part of the South and Central Highlands. The average maximum 1-day rainfall would increase all over Vietnam by 10–70% compared to the baseline period. The increase in extreme rainfall would lead to more serious flooding in Vietnam. Thus, the concern of flood damage to agricultural production in the future is therefore becoming more onerous.
Among Vietnamese agricultural crops, rice is the most popular as it is grown throughout the country and is a major product for export. The total harvested area of rice cultivation is over 7.7 million hectares, accounting for approximately 80% of the harvested area of all agricultural products of the country. With a total production of 46 million tons and an exported volume of 6.6 million tons per year, Vietnam is the fifth largest rice producer and the third rice exporter in the globe (Maitah et al., 2020). However, rice is likely the most flood-affected crop due to its low-land cultivation location (Pham and Tran, 2018; Pham et al., 2019). Thus, the objective of this study was to predict the magnitude of future floods under the impact of climate change and their damage to rice production in Vietnam by a complex approach combining climate modeling, hydrological modeling and flood damage modeling. The area selected for this study was Huong Son, a district in the North-Central Region which is considered as the hotspot of flooding in Vietnam due to high frequency and severity of floods. The baseline period of the study for climate change comparison was 1986–2005, and the prediction was made for the decade of 2050s.
The task of ensuring national food security, controlling, preventing and mitigating natural disasters is extremely important to social security and sustainable development. As part of the national strategy to respond to climate change, the agricultural sector needs to have appropriate programs and projects that have both immediate and long-term actions on climate change that have been and will have a negative impact on agricultural production. In this context, this study is expected to provide a comprehensive picture of the damage caused by climate change impacts and flooding to rice production, which consequently threatens food security as well as Vietnam’s rice export capacity. Therefore, the results of this study are extremely important scientific information that helps policymakers come up with appropriate and effective strategies to mitigate the impact of climate change on food security, thereby maintaining Vietnam’s rice export position in the world.
This study contributes a new integrated approach of determining the damage caused by flooding to agricultural production under the impact of climate change. The integration of GIS, GCMs, hydrological modelling and stage-damage functions in this study is original and has potential application for other study areas. In addition to practical implications, this study contributed to the current understanding of how climate change accelerates flooding and how the change in flooding characteristics alters its damage to rice production.
The remainder of the paper is organized as follows: Materials and methods introduces the study area and describes the approach to the prediction of economic loss of rice production due to flood inundation under climate change impacts. Results and Discussion reports and discusses the results of the study, including changes in the intensity and frequency of extreme precipitation under a climate change scenario, changes in spatial and temporal aspects of flooding and the consequent loss of rice production. Finally, Conclusion concludes findings and limitations of the study, and provides suggestions for future research as well as policy making.
Materials and Methods
The methodology for predicting flood induced economic losses of rice production under climate change impacts involves projection of extreme precipitation under MRI-CGCM3 climate model, simulation of flood inundation using hydrological model and calculation of economic loss based on inundation depth and duration using Geographical Information System (GIS). The projection of extreme precipitation with MRI-CGCM3 was run under Representative Concentration Pathway (RCP) 8.5, which presents the highest level of radiative forcing for 2,100 relative to pre-industrial values (+8.5 W/m2). RCP8.5, together with RCP2.6, RCP4.5, and RCP6.0 are the four greenhouse gas concentration trajectories adopted by the Intergovernmental Panel on Climate Change (IPCC) for its fifth Assessment Report (AR5). The four RCPs include one mitigation scenario leading to a very low forcing level (RCP2.6), two medium stabilization scenarios (RCP4.5/RCP6.0) and one very high baseline emission scenario (RCP8.5) (Weyant et al., 2009; IPCC, 2014).
Study Area
Huong Son (18o16'07″-18o37'28″N; 105o06'08″-105o33'08″E) is a rural district located in the North-East of Ha Tinh Province, approximately 350 km South of Ha Noi. The district faces Nghe An Province to the North, Laos PDR to the West, Vu Quang district to the South-East and to Duc Tho District to the East (Figure 3). The district covers an area of approximately 1096.79 km2 and is a part of the Ca River Basin (CRB), which stretches on the territory of Laos and Vietnam and is one of the largest river basins in the mainland Southeast Asia. As of 2019, Huong Son has a population of more than 118,000 people. Having a dense river and stream network with Ngan Pho being the main river flowing through the district, Huong Son is threatened by annual river floods. In fact, the North-Central Region in general, and Huong Son District in particular, are well-known as a hotspot of flooding in Vietnam due to the high frequency and severity of flooding that occurs in the region. An analysis of flood frequency (return period) corresponding to each flood flow level from the observation data during the past 56 years (1961–2016) at Son Diem hydrological station is presented in Figure 4. In Huong Son, rice is grown three crops a year: Winter-Spring crop (early November to mid April), Summer-Autumn crop (early May to late September) and October crop (mid May to mid November) and is a major crop in many downstream communes with a total area of 5,700 ha and a total production of 55,000 tons per year. However, because the main flood season lasts from early August to late November, the harvesting time of the Summer-Autumn rice and October rice falls into the flood season, the risk of flood damage to rice is therefore very high.
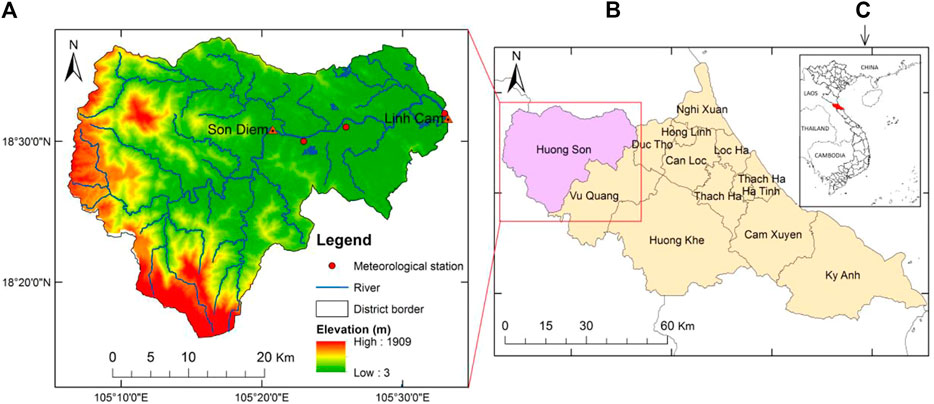
FIGURE 3. Characteristics of Huong Son district (A) geographic location of Huong Son district in Ha Tinh Province (B) and geographic location of Ha Tinh Province in Vietnam (C).
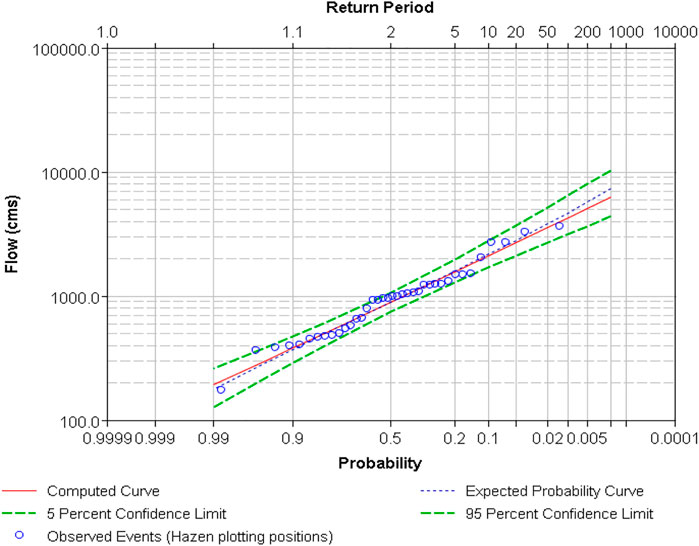
FIGURE 4. Flood frequency and probability at Son Diem hydrological station.
Extreme Precipitation Projection and Flood Modeling
In this study, long-term historical precipitation daily data date back to more than 50 years with volume resolution of 0.1 mm were employed for Generalized Extreme Value (GEV) analysis in combination pattern scaling method to predict extreme precipitation in the 2050s following the approach introduced by Ye and Li (2011). The GEV function parameters for the General Circulation Model (GCM) baseline and future periods were estimated using the Probability Weighted Moments (PWM) method (Landwehr et al., 1979) for each GCM grid (x,y). In this study, MRI-CGCM3 climate model, which was developed by Meteorological Research Institute of Japan, was employed. MRI-CGCM3 is an overall upgrade of the MRI-CGCM2 series. This climate model is a core subset of MRI’s Earth system model MRI-ESM1 (Yukimoto et al., 2011). MRI-CGCM3 consists of the atmosphere-land model (MRI-AGCM3), the ocean and sea ice model (MRI.COM3), and the aerosol model (MASINGAR mk-2). These component models are coupled with a simple and flexible coupler ‘‘Scup’’, which enables users to make a variety of combinations of the component models with arbitrary resolutions and grid coordinates (Yukimoto et al., 2012). The MIKE FLOOD model was then used for flood modeling using the projected extreme precipitation derived from GEV analysis. MIKE FLOOD integrates the one-dimensional model MIKE 11 and the two-dimensional model MIKE 21 into a single, dynamically coupled modeling system. This coupled tool exploits the best features of both MIKE 11 and MIKE 21. Lateral links are used, enabling the overbank flow simulation between the river channel and the floodplain area. A lateral link allows a string of MIKE 21 cells to be laterally linked to a given reach in MIKE 11, either a section of a branch or an entire branch. The maximum flood water depth and duration, which were estimated at every model grid node, were subsequently used as input to a flood loss model for the prediction of economic loss of rice production. The model used in the present study was previously calibrated and validated by Pham et al. (2016). The results of model calibration and validation, which used Coefficient of determination (R2), Nash-Sutcliffe Simulation Efficiency (NSE), and Index of Agreement (IA), Root Mean Square Error (RMSE), and Mean Absolute Percentage Error (MAPE) to compare observed data and simulated data of river discharge and water level at six hydrological monitoring gauges showed that there was a high correlation between simulated data and observed data (R2, NSE, and IA values for all gauges are all close to 1) while RMSE and MAPE gave acceptable values for all gauges. This indicates that the model is appropriate for flood modeling in the study area (Pham et al., 2016).
Prediction of Flood Induced Economic Loss of Rice Production
The flood induced economic loss model for rice production using Eqs. 1, Eqs. 2.
Where, EL(xy) is the economic loss of rice due to flood in grid xy (VND).TEL is the total economic loss of rice (VND).A(xy) is the cultivation area of rice in grid xy (m2).Y is the estimated yield of rice per unit area (kg/m2).C is the estimated cost per unit weight of rice product (VND/kg).E(Ht) is the loss coefficient for rice corresponding to depth H and duration t at grid xy (%). LF is the loss factor, taking into account of growing season of rice (%). In the present study, LF was assumed to be 100% as the flood season in the study area (August–November) covers the harvesting season of rice (August–September).
The loss coefficient E(Ht) is calculated based on a stage-loss function. In the present study, three types of function were developed which are exponential function, polynomial function and linear function. Among the three types of function developed, the linear function has the highest coefficient of determination R2 for all depth levels. It was therefore selected for economic loss calculation. The linear function E = F(t)= a.t + b, where E is the loss coefficient in percentage (E ≤ 100%), t is the inundation duration (days), a and b are coefficients determined for each water depth level. In the present study, flood depth (H) was divided into three levels: Level 1: 0.2m < H ≤ 0.5 m; Level 2: 0.5 <H ≤ 1.0 m; and Level 3: H > 1.0 m. The study assumption is that the flood level shallower than 0.2m caused no economic loss to rice. The loss curves and functions were built from interview survey data with local farmers. 195 farmers in the district whose rice fields were often inundated by annual flooding were randomly selected for investigation. Figure 5; Table 1 present loss curves and loss function for rice production. The curves clearly show a combined effect of flood depth and flood duration on the loss of rice production. As the flood is higher and longer, the loss is greater. However, the loss and its increase along with flood duration for flood depth below 0.5 m are much smaller compared to flood depth above 0.5 m. Little effect of shallow flood on rice is due to the fact that rice varieties grown in the study area usually have a height of over 80 cm and are wet rice, which has the ability to tolerate flooding for a certain period of time. This is also an indication for adaptation that tall rice varieties should be cultivated for the flooding-sensitive areas.
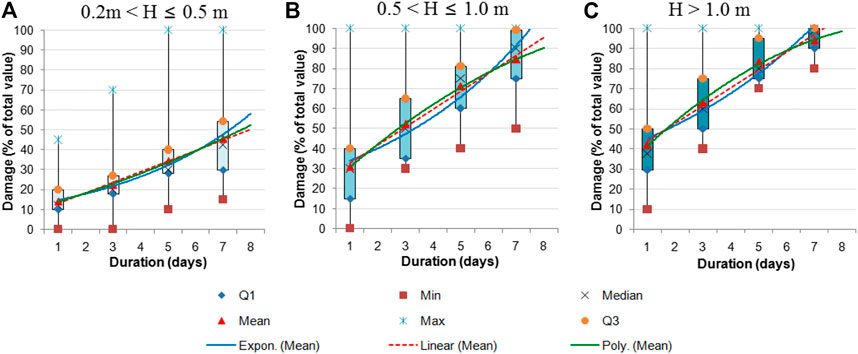
FIGURE 5. Loss curves for rice production.
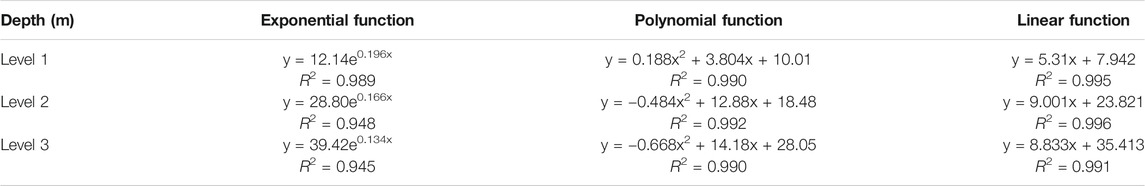
TABLE 1. Loss functions for rice production.
Results and Discussion
Increases in Extreme Precipitation and Flood Level
Figure 6 shows daily precipitation in Huong Son district during a period of 57 years from 1960 to 2016. This set of precipitation data was used for the calculation of extreme precipitation using GEV method. Figure 7 presents both the baseline GEV distribution and the 2050s GEV distribution under RCP8.5 projected by the MRI-CGCM3 model for 24-h extreme precipitation at Pho Chau meteorological station.
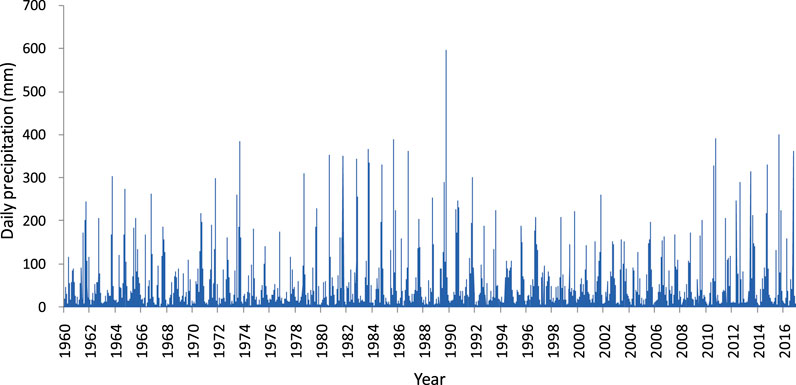
FIGURE 6. Daily precipitation at Pho Chau during 1960–2016.
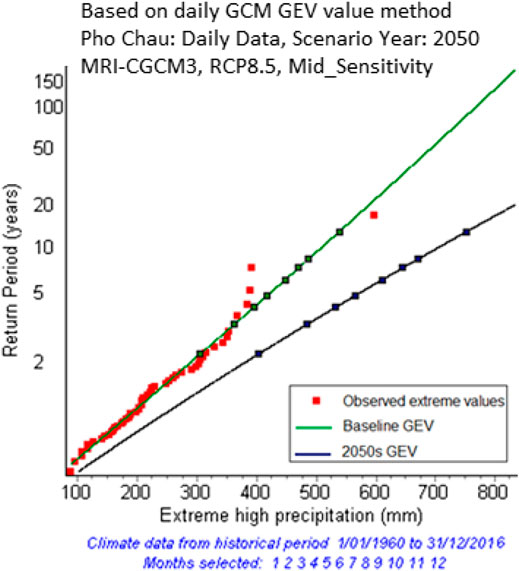
FIGURE 7. Extreme precipitation under the baseline period and in the 2050s.
Figure 7 obviously shows that in the 2050s under climate change impact, extreme precipitation at all levels will become more intense and more frequent compared to the baseline period. The line of GCM projected GEV becomes increasingly farther apart from the line of observed GEV towards the upper tail of the distribution indicates stronger effects of climate change causing more extreme precipitation events. This pattern of precipitation change was previously discussed in Ye and Li (2011), which also applied a similar method for extreme precipitation prediction. Results from the analysis of rainfall data and flood data recorded during the past 50 years show that in Huong Son district, the duration from it started raining until floods reached the peak level was approximately 5 days. This study therefore conducted a calculation for the change of five-day extreme precipitation. The result shows that for an average extreme precipitation (EP) level, the baseline intensity of the 20 years-return period EP was 786.1 mm and changed to 1172.4 mm under RCP8.5 projection scenarios, which represents a potential range of intensity increase of 49.14%. The frequency of the 20-years EP level of the baseline changed to 4.2 years, which are significant frequency increases nearly 5 times, meanwhile the frequency of 50-years EP and 100-years EP of the baseline changed to 6.9 and 10.1 years, meaning that the frequency would increase more than 7 times and nearly 10 times, respectively. Figure 8 shows the change in flood water level at Son Diem, the main hydrological station in Huong Son District. The water level in the 2050s projected by MRI-CGCM3 model under RCP8.5 presents a significant increase compared with the baseline period. The peak water level was predicted to rise nearly 1 m, from 7.62 m in the baseline period to 8.59 m in the 2050s. It must be mentioned that the hydrological regime of the study area is influenced by a dense system of rivers and streams. The streams are short and steep, so when it rains, the water rushes to the main river and causes the water level to rise quickly. Therefore, it is reasonable that when the rains occur with a greater intensity under climate change impact, the river flow and water level will increase sharply. Future flood events would also last longer due to climate change impacts as the distance between MRI-CGCM curve and the baseline curve increasingly enlarges with time during the peak flood period. A similar pattern of climate change induced raise in flood water level was previously found and discussed in Pham and Tran (2018).
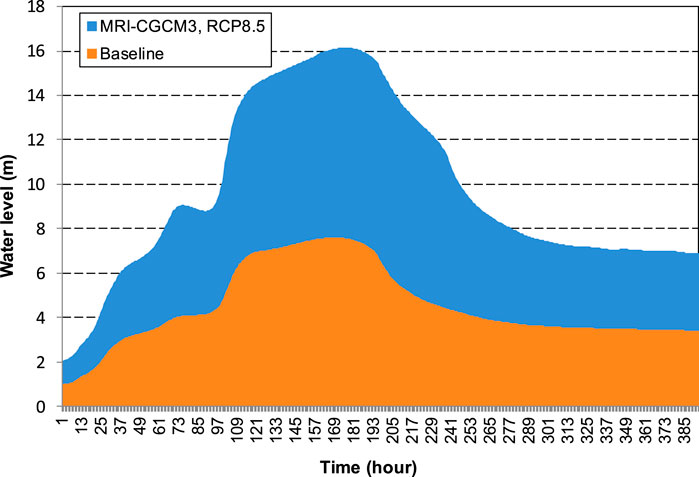
FIGURE 8. Comparison of water level in the baseline period and in 2050s.
Increases in the Area, Depth, and Duration of Inundation and Damage to Rice Production
Results from MIKE FLOOD model provided depth and duration of the flood at each mesh grid of the model. These data were then used for the generation of maps of depth and duration using spatial interpolation method. The maps are shown in Figures 9–12. From the Figures, it can be seen that the depth (and also duration) of inundation is heterogeneous over the flooded area for both the baseline period and future period. This is due to the heterogeneity of the topography: the lower the topography, the higher the depth of inundation and the longer the duration of inundation. Calculation results from inundation maps show that the flooded area in the baseline period was 7106.65 ha, accounting for 6.5% of the total natural area of the district. Most upstream communes are not flooded, but downstream communes are flooded with large areas. This can be explained by the characteristics of topography of the study area where the upstream areas have high terrain and steep slopes and the downstream areas are mostly low-lying valleys. During a flood event, surface runoff that forms in the upstream area will finally create cumulative flows of the main river that flood low-lying areas downstream. By 2050s, under climate change reinforcement (MRI-CGCM3, RCP8.5 scenario), flooded area would increase to 7534.64 ha (an increase of 427.09 ha (up 6.0%) in comparison with the baseline period). In addition to a significant increase in the flooded area, the maps also show an increase in flood depth and inundation time. A common characteristic of floods in downstream flood plains is that flood water recede slowly, which is the reason that when the rain lasts longer with greater intensity, in addition to the rise of water level, the flood inundation will also last longer. The increase in the area and duration of flood inundation due to climate change reinforcement was a quite popular projection among the scientific community and was reported by recent studies (Pham and Tran, 2018; Yue et al., 2019). The area of rice cultivation inundated was identified by overlaying the map of inundation and the map of land use. The loss of rice production was calculated using the stage-loss function (Table 1) for every map grid and is displayed in Figure 13. Figure 13 shows that most of the area of rice inundated will be completely damaged (the loss is 100%).
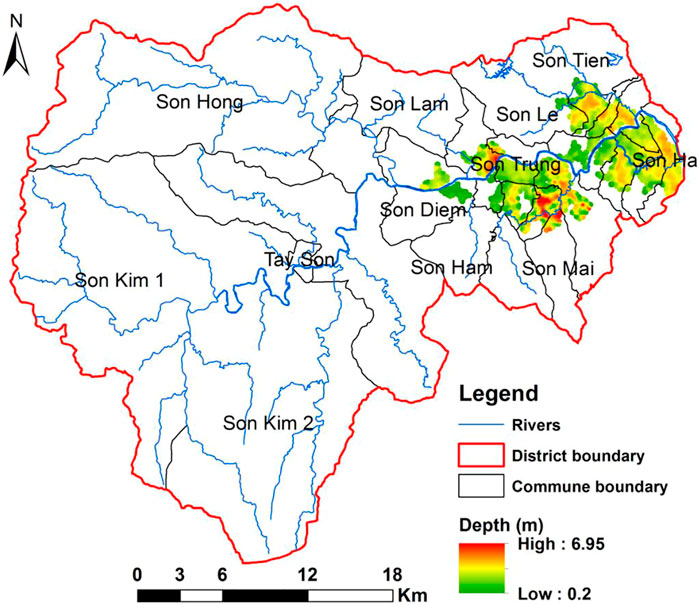
FIGURE 9. The area of inundation in Huong Son district in the baseline period.
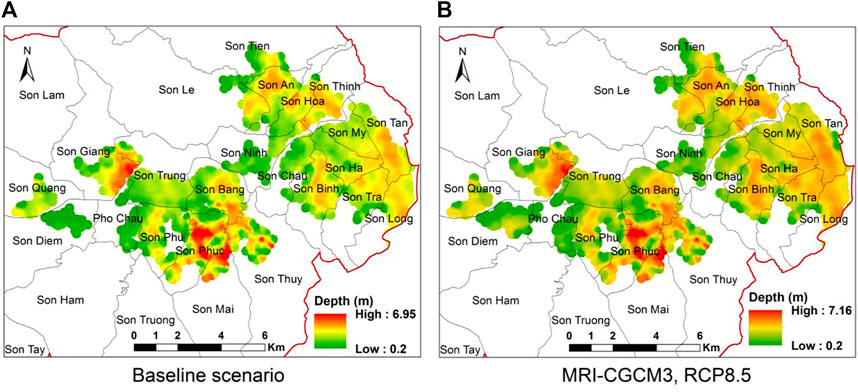
FIGURE 10. Inundation depth under baseline and MRI-CGCM3, RCP8.5 scenarios.
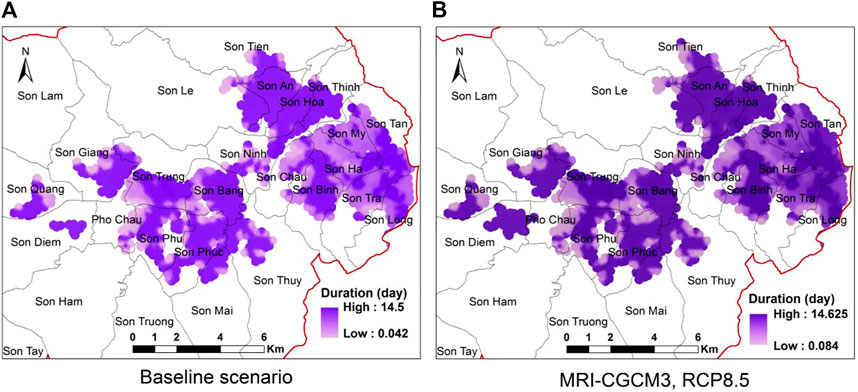
FIGURE 11. Inundation duration under baseline and MRI-CGCM3, RCP8.5 scenarios.
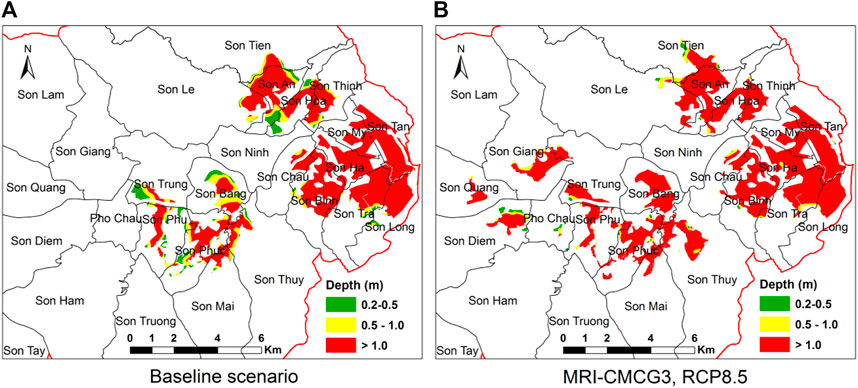
FIGURE 12. Map of classified inundation depth upon rice cultivation area.
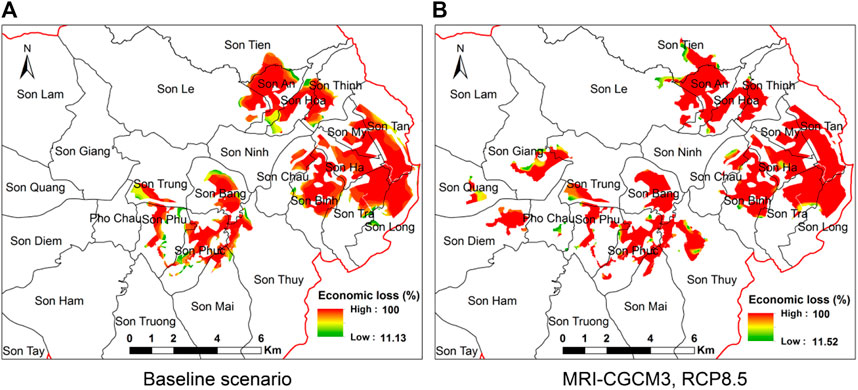
FIGURE 13. Loss of rice in percentage due to flooding under baseline and MRI-CGCM3, RCP8.5 scenarios.
Figure 14 shows the area of rice inundated, the corresponding rice production affected, and the consequent economic loss of rice production. It can be seen that in both the baseline period and future period, the inundated area with a depth over 1 m is dominant, meanwhile the inundated area with depth below 1 m and below a half meter is very small. This expresses the seriousness of the inundation in the study area and indicates a large loss of rice under deep flooding. The total area of rice inundated at the baseline period is 2752.32 ha, increasing to 3099.38 ha (up 12.61%) in the 2050s period according to MRI-CGCM3, RCP8.5 scenarios. Compared with the increase in the total flooded area of the district, the increase in the area of rice flooded was much larger (12.61% compared with 6.0%). This is due to the fact that rice is cultivated in low-lying, plain or low-slope areas so that even a slight increase in the flood flow would spread inundation to a large area of rice cultivation. With an average rice yield of 5 tons/ha, rice price is 6.5 million VND/ton according to statistics of Huong Son District Statistical Office in 2018, rice production affected by flooding increased from 13761.58 to 15496.91 tons; the value of damage increased from VND 78.94 billion to VND 95.54 billion (up 21.02%). The above results show that the increasing trend of inundation time and depth of flooding has made the value of damage to rice production increased under the MRI-CGCM3, RCP8.5 scenarios.
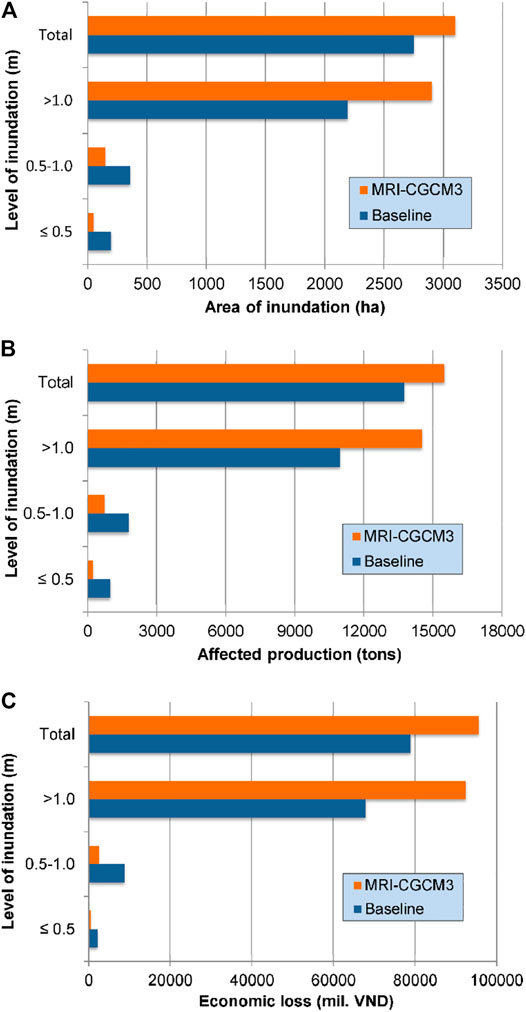
FIGURE 14. A comparison between the baseline period and 2050s on inundated area (A), production affected (B) and economic loss of rice production (C).
The study found that the increase in the economic loss of rice production was not proportionate to the increase in the inundation area due to additional effect by the increase in inundation duration. This can be explained by the loss curves for rice production previously shown in Figure 5, which express a major role of inundation duration in the damage as the curves increased sharply when inundation duration increased. It is widely agreed that besides main factors including flood season, depth and duration, flood induced economic loss also depends on many other factors such as flood flow velocity, contamination of flood water, sediment concentration, flood forecast, and the response of government and people in a flood situation. These factors, however, are very spatially and temporally heterogeneous and thus difficult to predict. Information about their effects, particularly on agricultural production is also limited. They are therefore often neglected in economic loss calculation. Although some hints were recommended for the quantitative influence of several of the above factors (Thieken et al., 2005), there are still no appropriate and accurate approaches for including all of such factors in economic loss evaluation. This is also one of the limitations of this study and more investigation on the effect of those factors is recommended for further research.
Conclusion
In Vietnam, flood damage to rice production is a great concern since rice is a major product for export and the livelihood of large populations depends on rice production. This study evaluated the economic loss of rice production caused by flood inundation under the effect of climate change using a modeling approach based on a case study of Huong Son District of Ha Tinh Province in the North-central part of Vietnam. MRI-CGCM3 climate model and GEV distribution method were inter-connected for the estimation of extreme precipitation and its return periods using historical daily observations. The derived extreme precipitation data was then used in MIKE FLOOD model for flood simulation. Finally, an integrated approach employing flood inundation depth, inundation duration, flood season, and rice cultivation calendar was applied to estimate the potential loss of rice production. The result of the study shows that in the context of climate change, by 2050s, while extreme precipitation could be 5 times more frequent, an increase of nearly 50% in its intensity is also expected. As a result, the severity of floods would increase as they become more intensified, deeper and longer, and consequently resulting in a significant increase in their damage to rice production.
The findings of the study indicate a number of policy implications. First, the implementation of the National Action Plan on Climate Change should be accelerated in order to effectively mitigate the adverse impact of climate change, strengthen the adaptive capacity of the community and economic system, and actively respond to natural disasters. Second, long-term infrastructural planning including building and strengthening the dyke and drainage systems, control dams and reservoirs, and floodwalls should be made to tackle stronger flooding threats under climate change impacts. Third, besides improvements in infrastructural system for the protection of agriculture fields, changing agricultural practices and using improved crop varieties can also help obtain higher production yields. Some rice varieties are more suitable for flooding-based cultivation systems, such as very fast growing floating rice varieties, which are also grown in the Mekong delta in the south of Vietnam. Planting early-maturing crops to avoid the flooding season is also a recommended solution among many others.
From this study, a number of limitations were acknowledged and those limitations would give valuable suggestions for further studies. The main limitation is that the study used depth and duration of flood inundation as the main factors causing damage while other flood characteristics such as contamination of flood water, sediment concentration, the effectiveness of flood forecast, and the response of government and people in a flood situation were neglected. Besides, the methodology was applied to a relatively small area and for only a particular crop. In fact, large areas of other major agricultural crops such as corn, groundnut, sweet potato, etc. in other regions around the country are flooded every year. Therefore, it is recommended that future studies test this method for other crops in other regions where floods may have different characteristics. In addition, further research on probabilities of floods relative to the harvest period of crops is needed to enhance the accuracy of predictions, and other RCPs scenarios should be employed to examine the range of possibilities of climate change and its damage.
Data Availability Statement
The original contributions presented in the study are included in the article/supplementary material, further inquiries can be directed to the corresponding author.
Author Contributions
PQG performed the design of study, data collection, data analysis, model simulation, and manuscript writing and editing. TTV contributed to the discussion of the study results and editing the manuscript.
Conflict of Interest
The authors declare that the research was conducted in the absence of any commercial or financial relationships that could be construed as a potential conflict of interest.
Acknowledgments
The authors wish to acknowledge the agencies under the Ministry of Natural Resources and Environment of Vietnam for providing hydrological data, meteorological data and other data necessary for this study. A part of this work was conducted at Vietnam National University of Agriculture and was presented at the “Symposium on Integrated Land and Water management and Climate change in Vietnam and Japan”, Hanoi, November 18, 2019 (Pham, 2019).
References
Andrade, L., O'Dwyer, J., O'Neill, E., and Hynds, P. (2018). Surface Water Flooding, Groundwater Contamination, and Enteric Disease in Developed Countries: A Scoping Review of Connections and Consequences. Environ. Pollut. 236, 540–549. doi:10.1016/j.envpol.2018.01.104
Balana, B. B., Sanfo, S., Barbier, B., Williams, T., and Kolavalli, S. (2019). Assessment of Flood Recession Agriculture for Food Security in Northern Ghana: An Optimization Modelling Approach. Agric. Syst. 173, 536–543. doi:10.1016/j.agsy.2019.03.021
Banerjee, L. (2010). Effects of Flood on Agricultural Productivity in Bangladesh. Oxford Development Stud. 38, 339–356. doi:10.1080/13600818.2010.505681
Bizikova, L., Jungcurt, S., McDougal, K., and Tyler, S. (2020). How Can Agricultural Interventions Enhance Contribution to Food Security and SDG 2.1? Glob. Food Security 26 (2020), 100450. doi:10.1016/j.gfs.2020.100450
Boustan, L. P., Kahn, M. E., Rhode, P. W., and Yanguas, M. L. (2020). The Effect of Natural Disasters on Economic Activity in US Counties: A century of Data. J. Urban Econ. 118, 103257. doi:10.1016/j.jue.2020.103257
Campbell, B. M., Hansen, J., Rioux, J., Stirling, C. M., Twomlow, S., and Wollenberg, E. (2018). Urgent Action to Combat Climate Change and its Impacts (SDG 13): Transforming Agriculture and Food Systems. Curr. Opin. Environ. Sustainability 34, 13–20. doi:10.1016/j.cosust.2018.06.005
Daniell, J., Friedemann, W., and Schaefer, A. (2016). The Economic Costs of Natural Disasters Globally from 1900-2015: Historical and Normalised Floods, Storms, Earthquakes, Volcanoes, Bushfires, Drought and Other Disasters. Geophys. Res. Abstr. 18, EGU2016–1899.
Dutta, D., Herath, S., and Musiake, K. (2003). A Mathematical Model for Flood Loss Estimation. J. Hydrol. 277, 24–49. doi:10.1016/s0022-1694(03)00084-2
EMDAT (2020). OFDA/CRED International Disaster Database. Brussels: Universitécatholique de Louvain – Brussels – Belgium.
FAO (2019). The State of Food Security and Nutrition in the World 2019: Safeguarding against Economic Slowdowns and Downturns. Rome, Italy: Food and Agriculture Organization of the United Nations.
IPCC (2014). Climate Change 2014: Synthesis Report. Contribution of Working Group I, II and III to the Fifth Assessment Report of the Intergovernmental Panel on Climate Change. Geneva, Switzerland: The University of Western Australia.
Keerthiratne, S., and Tol, R. S. J. (2018). Impact of Natural Disasters on Income Inequality in Sri Lanka. World Development 105, 217–230. doi:10.1016/j.worlddev.2018.01.001
Kim, C. R. (2019). Framework of Extreme Flood Risk Management in the Typhoon Country Region. Trop. Cyclone Res. Rev. 8, 35–45. doi:10.1016/j.tcrr.2019.07.004
Landwehr, J. M., Matalas, N. C., and Wallis, J. R. (1979). Probability Weighted Moments Compared with Some Traditional Techniques in Estimating Gumbel Parameters and Quantiles. Water Resour. Res. 15, 1055–1064. doi:10.1029/WR015i005p01055
Maitah, K., Smutka, L., Sahatqija, J., Maitah, M., and Phuong Anh, N. (2020). Rice as a Determinant of Vietnamese Economic Sustainability. Sustainability 12, 5123. doi:10.3390/su12125123
Messner, F., Penning-Rowsell, E., Green, C., Meyer, V., Tunstall, S., and Veen, A. V. D. (2007). Evaluating Flood Damages: Guidance and Recommendations on Principles and Methods. Report No. T09-06-01. Germany: Centre of Environmental Research, Dresden Flood Research Center. Technical report.
MONRE (2016). Climate Change and Sea Level Rise Scenarios for Vietnam. Hanoi, Vietnam: Ministry of Natural Resources and Environment.
Murshed, M., Chadni, M. H., and Ferdaus, J. (2020). Does ICT Trade Facilitate Renewable Energy Transition and Environmental Sustainability? Evidence from Bangladesh, India, Pakistan, Sri Lanka, Nepal and Maldives. Energ. Ecol. Environ. 5, 470–495. doi:10.1007/s40974-020-00190-2
Ngarava, S., Zhou, L., Ayuk, J., and Tatsvarei, S. (2019). Achieving Food Security in a Climate Change Environment: Considerations for Environmental Kuznets Curve Use in the South African Agricultural Sector. Climate 7, 108. doi:10.3390/cli7090108
Nkwunonwo, U. C., Whitworth, M., and Baily, B. (2020). A Review of the Current Status of Flood Modelling for Urban Flood Risk Management in the Developing Countries. Scientific Afr. 7, e00269. doi:10.1016/j.sciaf.2020.e00269
Nur, I., and Shrestha, K. K. (2017). An Integrative Perspective on Community Vulnerability to Flooding in Cities of Developing Countries. Proced. Eng. 198, 958–967. doi:10.1016/j.proeng.2017.07.141
Penning-Rowsell, E. C., Yanyan, W., Watkinson, A. R., Jiang, J., and Thorne, C. (2013). Socioeconomic Scenarios and Flood Damage Assessment Methodologies for the Taihu Basin, China. J. Flood Risk Manage. 6, 23–32. doi:10.1111/j.1753-318X.2012.01168.x
Pham, Q. G., Kurisu, K., and Hanaki, K.(2016). Assessing the Accuracy of Flood Inundation Simulation in a Watershed Scale Using Different Correlation Based and Non-correlation Based Statistics. Proceedings of the 5th Annual International Conference on Sustainable Energy and Environmental Sciences (SEES 2016). Singapore, February 22nd-23rd.
Pham, Q. G. (2019). “Prediction of Economic Loss of rice Production Due to Flood Inundation under Climate Change Impacts Using a Modeling Approach: A Case Study in Ha Tinh Province, Vietnam”, in Symposium on Integrated Land & Water Management and Climate Change in Vietnam and Japan, Hanoi, November 18.
Pham, Q. G., and Tran, T. P. (2018). Evaluation of Loss of rice Production Due to Climate Change Reinforced Flood in Vietnam Using Hydrological Model and GIS. EnvironmentAsia 11, 65–78. doi:10.14456/ea.2018.38
Pham, Q. G., Toshiki, K., Sakata, M., Kunikane, S., and Tran, Q. V. (2014). Modelling Climate Change Impacts on the Seasonality of Water Resources in the Upper Ca River Watershed in Southeast Asia. Sci. World J. 2014, 1–14. doi:10.1155/2014/279135
Rosselló, J., Becken, S., and Santana-Gallego, M. (2020). The Effects of Natural Disasters on International Tourism: A Global Analysis. Tourism Management 79, 104080. doi:10.1016/j.tourman.2020.104080
Standard and Poor's (2014). Climate Change Is a Global Mega-Trend for Sovereign Risk. New York, USA: Standard and Poor's.
Thieken, A. H., Müller, M., Kreibich, H., and Merz, B. (2005). Flood Damage and Influencing Factors: New Insights from the August 2002 Flood in Germany. Water Resour. Res. 41 (12), W12430. doi:10.1029/2005WR004177
Tumushabe, J. T. (2018). “Climate Change, Food Security and Sustainable Development in Africa,” in The Palgrave Handbook of African Politics, Governance and Development. Editors S. Oloruntoba, and T. Falola (New York: Palgrave Macmillan), 853–868. doi:10.1057/978-1-349-95232-8_53
UNISDR (2009). Global Assessment Report on Disaster Risk Reduction. Geneva, Switzerland: United Nations International Strategy for Disaster Reduction.
Vozinaki, A. E. K., Kourgialas, N. N., and Karatzas, G. P. (2012). Estimation of Agricultural Flood Loss in the Koiliaris River Basin in Crete, Greece. Eur. Water 39, 53–63.
Vu, N. C., Holland, J., Cassells, S., and Touhy, M. (2013). Using GIS to Map Impacts upon Agriculture from Extreme Floods in Vietnam. Appl.Geogr. 41, 65–74. doi:10.1016/j.apgeog.2013.03.014
Weyant, J., Azar, C., Kainuma, M., Kejun, J., Nakicenovic, N., Shukla, P. R., et al. (2009). Report of 2.6versus 2.9 Watts/m2RCPP Evaluation Panel. Geneva, Switzerland: IPCC Secretariat.
Whitmee, S., Haines, A., Beyrer, C., Boltz, F., Capon, A. G., de Souza Dias, B. F., et al. (2015). Safeguarding Human Health in the Anthropocene Epoch: Report of the Rockefeller Foundation–Lancet Commission on Planetary Health. Available at: https://www.thelancet.com/commissions/planetary-health.
Win, S., Zin, W. W., Kawasaki, A., and San, Z. M. L. T. (2018). Establishment of Flood Damage Function Models: A Case Study in the Bago River Basin, Myanmar. Int. J. Disaster Risk Reduction 28, 688–700. doi:10.1016/j.ijdrr.2018.01.030
Xue, L., Haseeb, M., Mahmood, H., Alkhateeb, T. T. Y., and Murshed, M. (2021). Renewable Energy Use and Ecological Footprints Mitigation: Evidence from Selected South Asian Economies. Sustainability 13, 1613. doi:10.3390/su13041613
Ye, W., and Li, Y. (2011). A Method of Applying Daily GCM Outputs in Assessing Climate Change Impact on Multiple Day Extreme Precipitation for Brisbane River Catchment. 19th International Congress on Modelling and Simulation, Perth, Australia, 12–16 December.
Yue, Z., Ying, W., Yu, C., Fengguo, L., and Heping, L. (2019). Assessment of Future Flash Flood Inundations in Coastal Regions under Climate Change Scenarios - A Case Study of Hadahe River basin in Northeastern China. Sci. Total Environ. 693, 133550. doi:10.1016/j.scitotenv.2019.07.356
Keywords: climate change, modeling, rice production, flood economic loss, loss function, MRI-CGCM3, RCP8.5
Citation: Giang PQ and Vy TT (2021) Will Climate Change Exacerbate the Economic Damage of Flood to Agricultural Production? A Case Study of Rice in Ha Tinh Province, Vietnam. Front. Environ. Sci. 9:643947. doi: 10.3389/fenvs.2021.643947
Received: 19 December 2020; Accepted: 18 June 2021;
Published: 30 June 2021.
Edited by:
Aavudai Anandhi, Florida Agricultural and Mechanical University, United StatesReviewed by:
Juan Moreno-Cruz, University of Waterloo, CanadaMuntasir Murshed, North South University, Bangladesh
Copyright © 2021 Giang and Vy. This is an open-access article distributed under the terms of the Creative Commons Attribution License (CC BY). The use, distribution or reproduction in other forums is permitted, provided the original author(s) and the copyright owner(s) are credited and that the original publication in this journal is cited, in accordance with accepted academic practice. No use, distribution or reproduction is permitted which does not comply with these terms.
*Correspondence: Pham Quy Giang, phamquygiang@daihochalong.edu.vn