Identifying Critical Area of Ecosystem Service Supply and Demand at Different Scales Based on Spatial Heterogeneity Assessment and SOFM Neural Network
 Guitang Liao1*
  Peng He2 Xuesong Gao3 Zhengyu Lin2 Conggang Fang4 Wei Zhou3 Chenghua Xu1 Liangji Deng3*
- 1College of Resources and Environment, Chengdu University of Information Technology, Chengdu, China
- 2Agricultural Information and Rural Economy Research Institute, Sichuan Academy of Agricultural Sciences, Chengdu, China
- 3College of Resource, Sichuan Agricultural University, Chengdu, China
- 4Chengdu Land and Resources Information Center, Chengdu Natural Resources Bureau, Chengdu, China
The purpose of this study was to establish a spatial multi-scale integrated assessment framework for critical areas of ecosystem service supply and demand, in order to provide theoretical support for regional ecological protection planning and refined management. Taking the typical hilly area of the upper reaches of the Yangtze River in China as an example, based on the assessment matrix of land use and ecosystem services, we used the method of spatial heterogeneity assessment and self-organizing feature mapping (SOFM) to explore the identification and regionalization of critical areas of ecosystem services at regional and small scales. The results show that there was spatial heterogeneity and scale effects of ecosystem services under the two scales. The small-scale supply–demand pattern was greatly affected by microtopography and land use patterns, and the importance of ecosystem services was as follows: forest area in the upper part of the mountain > orchard and dry area in the middle and lower part of the mountain > valley farming area > flat town and farming area. The regional-scale supply–demand pattern was greatly affected by landscape structure, location conditions and social economy, and the importance of ecosystem services was as follows: south > west > north > central. The SOFM network quantitatively identified four types of ecological areas with clear dominant functions at regional and small scales. The balance between supply and demand in the studied ecosystem service areas was I < II < III < IV, in which IV was the critical area in terms of supply and I was the critical area in terms of demand. This assessment framework can improve the spatial accuracy and objectivity of the quantification and mapping of ecosystem services, and provide new ideas for multi-scale identification and expression of ecosystem services.
Introduction
Ecosystem services are products and services that human beings obtain directly or indirectly from ecosystem functions (Costanza et al., 1997; MA, 2005). The sustainable supply of ecosystem services forms the environment and the material basis for human survival and development, which has an extremely high or even incalculable value (Yan et al., 2017). However, continuous population growth, industrialization, and urbanization have placed considerable pressure on ecosystems, leading to the serious degradation of ecosystem service capacity. Over the past 50 years, provisioning services have increased globally, but most other types of services have shown a downward trend, and among these the declining rate of regulating services is extremely significant (Li et al., 2013). On the other hand, the human socio-economic system has underestimated the value of ecosystem services for a long time, which has led to the excessive consumption of ecosystem services and serious imbalances and damage to ecosystems (Costanza et al., 1997; Fu and Zhang, 2014; Xie et al., 2015). The protection of natural ecosystems and enhancement of the quantity and quality of ecosystem services has become an urgent challenge globally (TEEB Foundations, 2010).
The relationship between supply and demand in relation to ecosystem services and their spatial measurement are the key to identifying regional eco-environmental problems and revealing their internal driving forces (Li et al., 2013). The products and services supplied by ecosystems, together with human demand and consumption, constitute the dynamic process of ecosystem services, involving the natural ecosystem and the human socio-economic system (Ma et al., 2017). The supply of ecosystem services is spatially constrained by biophysical and chemical processes, as well as the spatial distribution and structure of land use/cover (LUCC). The demand for ecosystem services is determined by the social and economic activities of individuals and groups, with regional differences and demand elasticity differences (Yan et al., 2017). In recent years, many scholars have conducted extensive research on the supply, demand, flow, and trade-offs of ecosystem services in different regions (Fisher et al., 2009; Burkhard et al., 2012, 2014; Villamagna et al., 2013; Peng et al., 2017; Wang J. et al., 2019). The research objects were mainly concentrated on the supply and demand of a single ecosystem service type, with more research focusing on provisioning services, followed by regulation services and cultural services, and less attention to maintenance services (Wang Z. Z. et al., 2019). The research scale involves global, continental, national, regional and local scales, but the research has been mainly based on a single spatial scale (Ma et al., 2017), and there has been a lack of multi-scale research. Research cases are mainly concentrated in Europe, the United States and Asia (Wei et al., 2017). Among them, provisioning services analysis focuses on water and food (Kroll et al., 2012; Yang et al., 2012; Boithias et al., 2014; Jie et al., 2015); Regulation and maintenance services analysis focuses on flood regulation, pollination, and climate regulation (Stürck et al., 2014; Zhao and Sander, 2015); Cultural services analysis focuses on recreation (Beichler, 2015; Peña et al., 2015; Tratalos et al., 2016). On the other hand, land use change caused by human activities is the main factor that causes spatial differences and imbalances between supply and demand in relation to ecosystem services (Li et al., 2011). Burkhard et al. (2009, 2012) proposed the relationship matrix assessment method from the perspective of the internal relationship between land use and ecosystem services, which achieved the rapid assessment of the supply and demand potential of ecosystem services. This method can be used for ecosystem assessments with high complexity and uncertainty, and has attracted widespread attention and application (Li et al., 2016; Guan et al., 2020). However, the relationship matrix method cannot sufficiently reflect the internal heterogeneity and marginal effect of ecosystem service supply and demand (Ma et al., 2017), especially at small and micro-scales. Therefore, it is necessary to improve the relationship matrix method from the perspective of spatial heterogeneity to enhance its prediction accuracy in terms of the supply and demand distribution of ecosystem services at a small scale.
The identification of critical areas is the core of ecological protection zoning and planning, and the source of much difficulty in the practical application of ecosystem services theory. Previous studies often clustered and partitioned areas based on administrative or watershed units, but it is difficult to ensure the consistency of physical geography and ecological functional characteristics within these units, which seriously limits the application of multi-scale research (Mao et al., 2019). In recent years, some scholars have utilized hotspot analysis to explore identification methods for important areas in terms of multi-scale ecosystem services (Cai et al., 2017; Hou et al., 2018; Wang J. et al., 2019). However, although hotspot analysis method is suitable for one-dimensional or low-dimensional data, multi-dimensional ecosystem service data must be reduced and integrated before hotspot analysis, which increases the uncertainty of the results to a certain extent. Self-organizing feature mapping (SOFM) can classify multi-dimensional data sets based on their individual characteristics. It has the advantages of maintaining the topological structure, self-organization, self-adaptability, and strong fault tolerance. SOFM can be used to achieve bottom-up natural zoning, which is an effective quantitative method to connect the characteristics of physical geographical units and natural zoning (Ma et al., 2013). Some scholars have applied SOFM method to ecological function zoning (Ma et al., 2013; Mao et al., 2019) and ecological protection and restoration divisions (Wu et al., 2020; Xie et al., 2020), which has proved that the method is feasible for ecosystem services. However, these studies have primarily focused on the supply of ecosystem services at a single scale, rather than from the perspective of supply and demand. These applications are limited to identifying the critical areas of ecological protection, and there are still defects in the identification and characterization of critical areas relating to the balance of supply and demand in ecosystem services.
At present, China’s per capita ecological assets are lower than the world average (Xie et al., 2017). In order to solve the environmental crisis, the Chinese government is trying to build an ecological protection decision-making system based on the “Ecological Redline” to ensure the integrity of critical ecosystems and the effective supply of important ecosystem services. The question of how to accurately identify the critical areas of ecological protection has become the primary problem to be solved. Recently, various studies have focused on agriculture (Elahi et al., 2018a; Elahi et al., 2019a, Elahi et al., 2020; Elahi et al., 2021a; Elahi et al., 2021b) and livestock sectors (Elahi et al., 2017; Elahi et al., 2018b; Elahi et al., 2019b) for estimation of resources and institutional barriers in the land use. Moreover, some studies focused on environmental issues (Peng et al., 2020; Zhong et al., 2020); however, identification of the critical area of ecosystem service supply and demand at different scales has not been determined yet. Therefore, the main aim of this study is to propose a spatial multi-scale integrated ecosystem service pattern assessment framework to improve the accuracy of the prediction and identification of critical areas of the supply and demand of ecosystem services, and applies the framework to the ecological environment management of typical hilly areas in the upper reaches of the Yangtze River.
Materials and Methods
Classification of Land Use and Ecosystem Services
China’s current land use classification system is based on the economic and social attributes of land, and is mainly used for land use management. This classification system does not reflect the ecological function of land very well. Specifically, it does not include ecological land types, and thus cannot meet the needs of ES expression, analysis and mapping (Chen and Shi, 2005; Deng et al., 2009; Zhang et al., 2017). Therefore, based on the identification and evaluation of land production, living and ecological functions, we established a new three-level land use classification system in a previous study, which was named the production–living–ecological land (PLEL) classification system (Liao et al., 2019). This system included three first-level categories. Production land (PL) is related to the industrial structure and refers to the main function of providing industrial products, agricultural products, and service products. Living land (LL) is related to carrying and maintaining human settlements and refers to the main functions of providing human living, consumption, leisure, and entertainment. Ecological land (EL) is related to the natural ecosystem and refers to the main function of providing ecological products and services, as well as playing an important role in regulating, maintaining, and ensuring regional ecological security. Subsequently, 21 land use types were classified, according to the land cover and ecosystem types (Table 1).
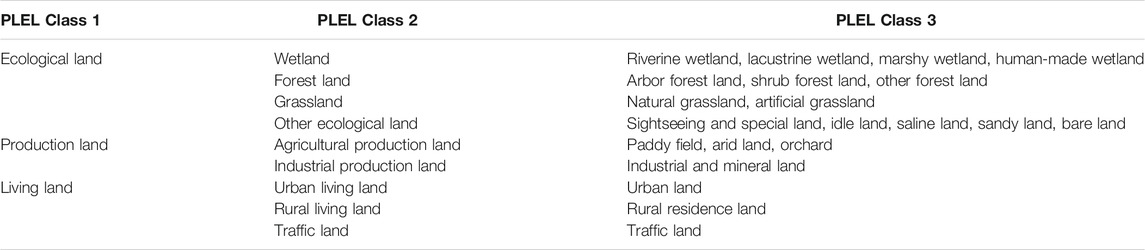
TABLE 1. Production–living–ecological land (PLEL) classification system.
According to the different ecological functions, ecosystem services were divided into four categories: provisioning services, regulating services, habitat services, and cultural services (MA (Millennium Ecosystem Assessment), 2005; TEEB Foundations, 2010). Provisioning services are the material or energy outputs from ecosystems, such as food and fiber. Regulating services are the services that ecosystems provide by acting as regulators, such as climate regulation. Habitat services are the services that ecosystems provide as habitats for migratory species and for gene-pool protection, such as the maintenance of genetic diversity. Cultural services are the nonmaterial benefits that people obtain from ecosystems through spiritual enrichment, cognitive development, recreation, and aesthetic experiences. Based on the classifications of ecosystem services by de Groot et al. (2002), Burkhard et al. (2012), and Xie et al. (2017), we have selected 11 ecosystem services for analysis (Figure 1, 2).
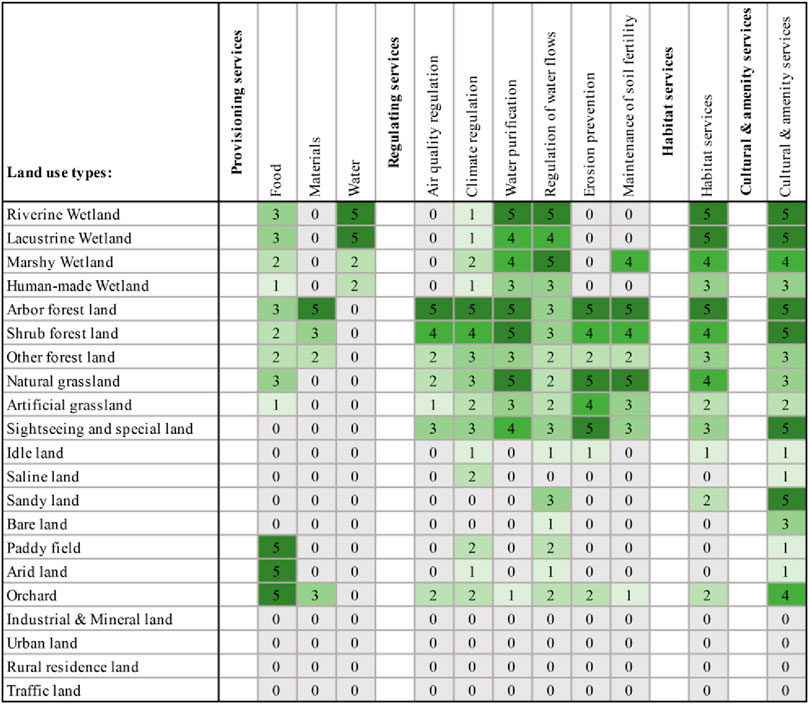
FIGURE 1. Assessment matrix of the supply potential of ecosystem services within the different land use types. The values indicate the following potentialities: 0 = no relevant potentiality; 1 = very low relevant potentiality; 2 = low relevant potentiality; 3 = medium relevant potentiality; 4 = high relevant capacity; and 5 = very high relevant potentiality.
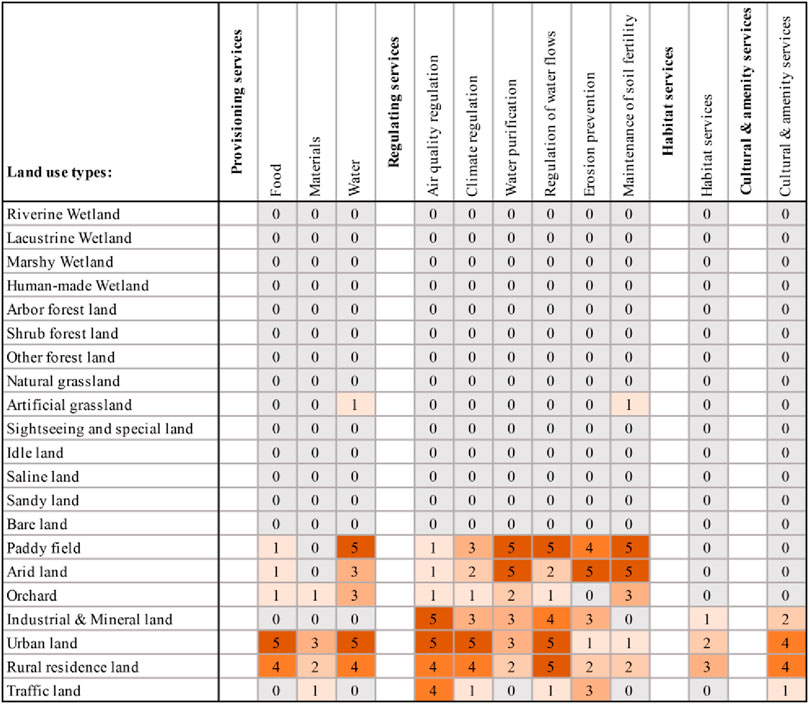
FIGURE 2. Assessment matrix for the demand potential of ecosystem services within the different land use types. The values indicate the following potentialities: 0 = no relevant potentiality; 1 = very low relevant potentiality; 2 = low relevant potentiality; 3 = medium relevant potentiality; 4 = high relevant potentiality; and 5 = very high relevant potentiality.
Spatial Heterogeneity Assessment of Ecosystem Services
Assessment Matrix of Supply and Demand of Ecosystem Services
Based on the non-monetary assessment method proposed by Burkhard et al. (2009, 2012, 2014) and the independent scores of regional experts, we established assessment matrixes of ecosystem services’ supply and demand potentialities for different land use types (Figure 1, 2). In the assessment matrixes, 21 land use types are placed on the y-axis, and 11 ecosystem services are placed on the x-axis. The score of the matrix has the following meanings: 0 = no relevant potentiality of supply or demand; 1 = very low relevant potentiality of supply or demand; 2 = low relevant potentiality of supply or demand; 3 = medium relevant potentiality of supply or demand; 4 = high relevant potentiality of supply or demand; and 5 = very high relevant potentiality of supply or demand.
Spatial Heterogeneity Correction Model of Ecosystem Services
Due to the spatial heterogeneity of the influencing factors, such as natural, social, economic, and population factors, etc., the same land use types or ecosystems can have different supply and demand potential in terms of ES in different regions. Therefore, this study proposed an assessment method for the spatial heterogeneity of ES, which improves on the assessment matrix method of Burkhard et al. (2012).
1) In this study, biomass, soil, meteorology, topography, and other indicators with strong correlations or influences on ecosystem service supply were selected to establish the spatial heterogeneity correction model for each grid (10 m × 10 m) in the study area. The formula is as follows:
where
2) Demand for ecosystem services refers to the amount of ES consumed (available) or desired by human society. The demand of ES is linked to economic level, population density, and social preference. With reference to the relevant research literature (Peng et al., 2017; Wang J. et al., 2019), three socio-economic indicators of city distance, population density, and gross domestic production (GDP) were selected to express the spatial heterogeneity of ES demand. City distance refers to the buffer value of cities at the county level and above, reflecting the intensity of human consumption of ES. Population density can reflect the quantity of demand for ES. The greater the population density, the greater the total demand for services. The GDP can indirectly reflect human preferences for ES. The higher the regional economic level, the higher the expectation for ES. The formula is as follows:
where
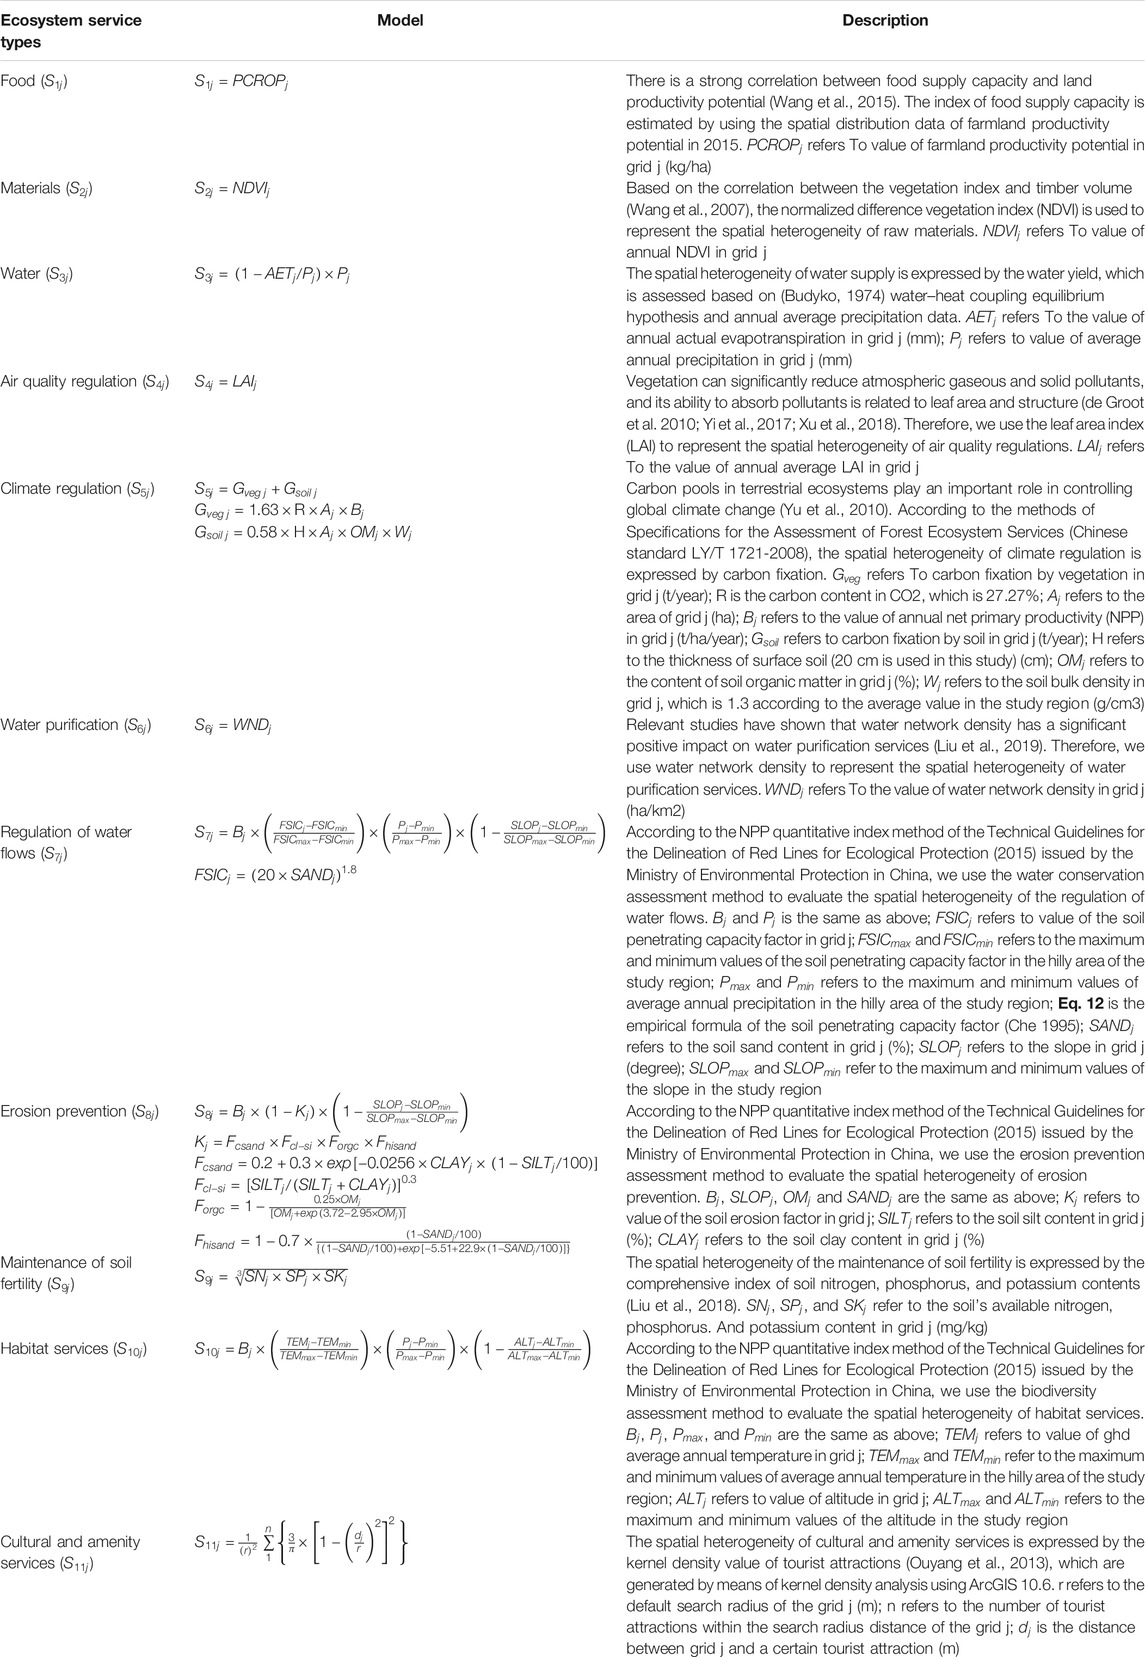
TABLE 2. Spatial heterogeneity index model of the supply of 11 ecosystem services.
Identifying Critical Areas of Ecosystem Service Supply and Demand at Different Scales
Supply and Demand Index Model of Ecosystem Services at the Small Scale
The purpose of small-scale identification is to reveal the spatial distribution characteristics of ecosystem service supply and demand inside the sample towns. Therefore, based on the assessment matrix and the spatial heterogeneity correction model of ecosystem service, the supply and demand index models were established to identify critical areas at the small scale. Then, we converted the PLEL vector maps of sample towns to raster maps, and calculated the supply, demand, and balance index of each grid. The model can be expressed as:
where

FIGURE 3. Topological structure of SOFM.
Supply and Demand Index Model of Ecosystem Services at the Regional Scale
The purpose of regional-scale identification is to reveal the critical areas of the supply and demand of ecosystem services in the study area, with sample towns as the basic unit. Therefore, based on the supply and demand index models at the small scale, the total supply and demand index models were established to identify critical areas at the regional scale. Due to the different areas of the sample towns, we used the unit area index to revise the supply, demand, and balance index of each town. The model can be expressed as:
where
Identifying Critical Areas of Ecosystem Service Supply and Demand
Self-organizing feature mapping (SOFM) is an unsupervised artificial neural network, which can map a high-dimensional data set to a low-dimensional space and obtain the similarity relationships between data. The SOFM network consists of two parts: the input layer and the output (competition) layer (Figure 3). The dimension of the input vector is the same as that of each node in the competition layer (Kohonen, 1997). Therefore, data clustering results can be obtained on the premise of keeping the topological structure of data set unchanged, and this is an effective method to identify and regionalize ecosystem services (Ma et al., 2013). The learning algorithm process of the SOFM network is as follows:
1) Initialization, initialize the connection weights from N input neurons to output neurons, assign a small random initial value
2) Provide a new input vector X.
3) Calculate the Euclidean distance
4) Given a surrounding domain
where,
5) Provide a new input vector and repeat the above learning process.
Case Study
Study Area
The hilly area of the Sichuan Basin is located in the upper reaches of the Yangtze River in Southwest China (28°10′–31°53′ N, 102°47′–107°28′ E) with an area of about 84,000 km2, including 70 counties (Figure 4), which is the most typical hilly area of the Mesozoic continental red strata in China. This region is an important functional region of urban development, food production and ecological protection in Western China and the upper reaches of Yangtze River, which plays an important role in the overall situation of regional economic and social development. However, due to the fragmentation of the natural landscape, low forest coverage, and low efficiency of agricultural production and land use, serious problems such as soil degradation, environmental pollution, resource depletion, and a decline in biodiversity have arisen, with this area becoming the most serious area of soil erosion in the upper reaches of the Yangtze River (Qiao and Yan, 2008; Wei et al., 2009). Because it is difficult to collect the land use/cover and socio-economic data for all towns of the study area, we therefore selected 215 typical hilly towns in the north, middle, west, and south of the Sichuan Basin as samples for this case analysis.
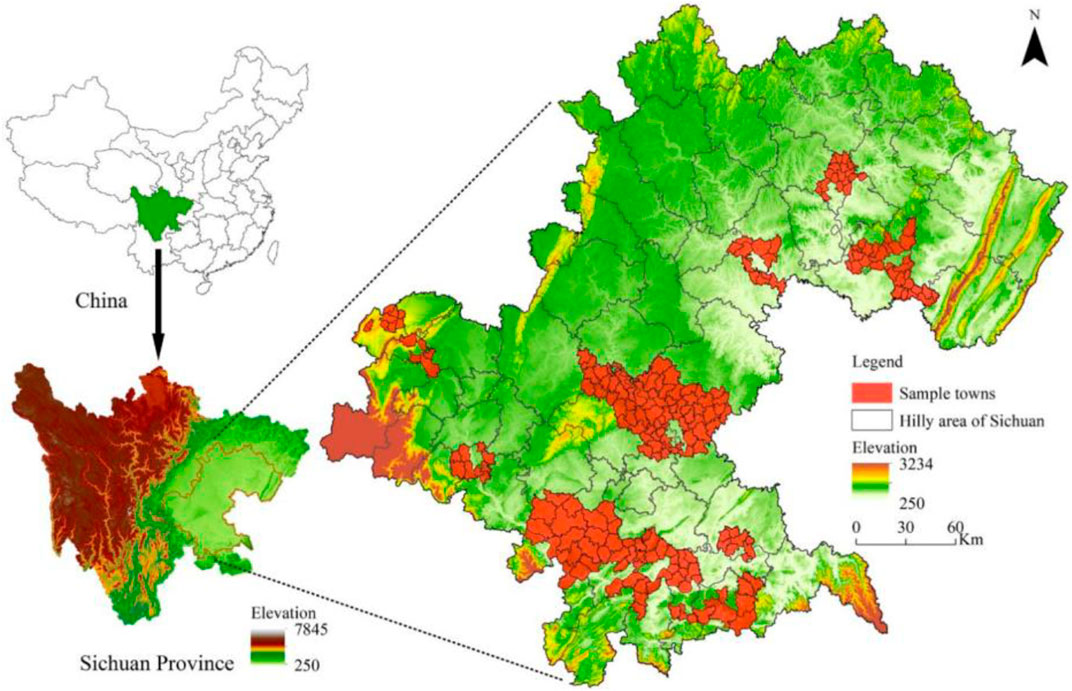
FIGURE 4. The study area and sample distribution in typical hilly areas, SW China.
Data Sources and Processing
In this study, ERDAS IMAGINE software was utilized to enhance and correct the Google Earth satellite images. Referring to the production–living–ecological land (PLEL) classification system, the PLEL vector database (1:10,000 scale) of sample towns in the study area was established through field investigations and the visual interpretation of the remote sensing images using ArcGIS 10.6. Advanced Spaceborne Thermal Emission and Reflection Radiometer Global Digital Elevation Model (ASTERGDEM) data were gathered from NASA. The data set of farmland productivity potential, the normalized difference vegetation index (NDVI), net primary productivity (NPP), soil texture, annual average precipitation, annual average temperature, distribution of tourist attractions, and GDP in 2015 were provided by the Data Center for Resources and Environmental Sciences, Chinese Academy of Sciences (RESDC) (http://www.resdc.cn). The data set of terrestrial evapotranspiration was provided by the Qinghai-Tibet Plateau Science Data Center (http://www.tpedatabase.cn). The data set of leaf area index (LAI) was provided by the Global Change Research Data Publishing and Repository (http://geodoi.ac.cn). The spatial distribution of soil organic matter, alkali-hydro nitrogen, rapidly-available phosphorus, and rapidly-available potassium was calculated through Kriging interpolation of 38,963 soil sampling points in the soil testing and formula fertilization database of Sichuan Province. Socioeconomic data were collected from the Statistical Yearbook of Sichuan Province and the Statistical Yearbook of various counties (2015).
Results
Characteristics of Ecosystem Service Supply and Demand
Based on the spatial heterogeneity assessment of ecosystem services, 11 supply and demand balance indices of ecosystem services (ESBI values) were calculated. Figure 5 shows that food (E1) supply was generally higher than demand in the study area, which was the main agricultural production area in Sichuan Basin, with more than 65% cultivated land. Spatially, the high value of food services decreased gradually from the low hilly area in the middle to the surrounding high hilly area. Correspondingly, high population density and low vegetation coverage led to a significant reduction in the supply capacity of ecosystem services in the central and northern parts of the study area. Therefore, the ESBI value of E2–E10 ecosystem services from high to low was as follows: south > west > north > middle. In addition, cultural and amenity services (E11) were greatly affected by socio-economic and location conditions, so the supply capacity of ecological areas closer to cities or settlements was generally higher.
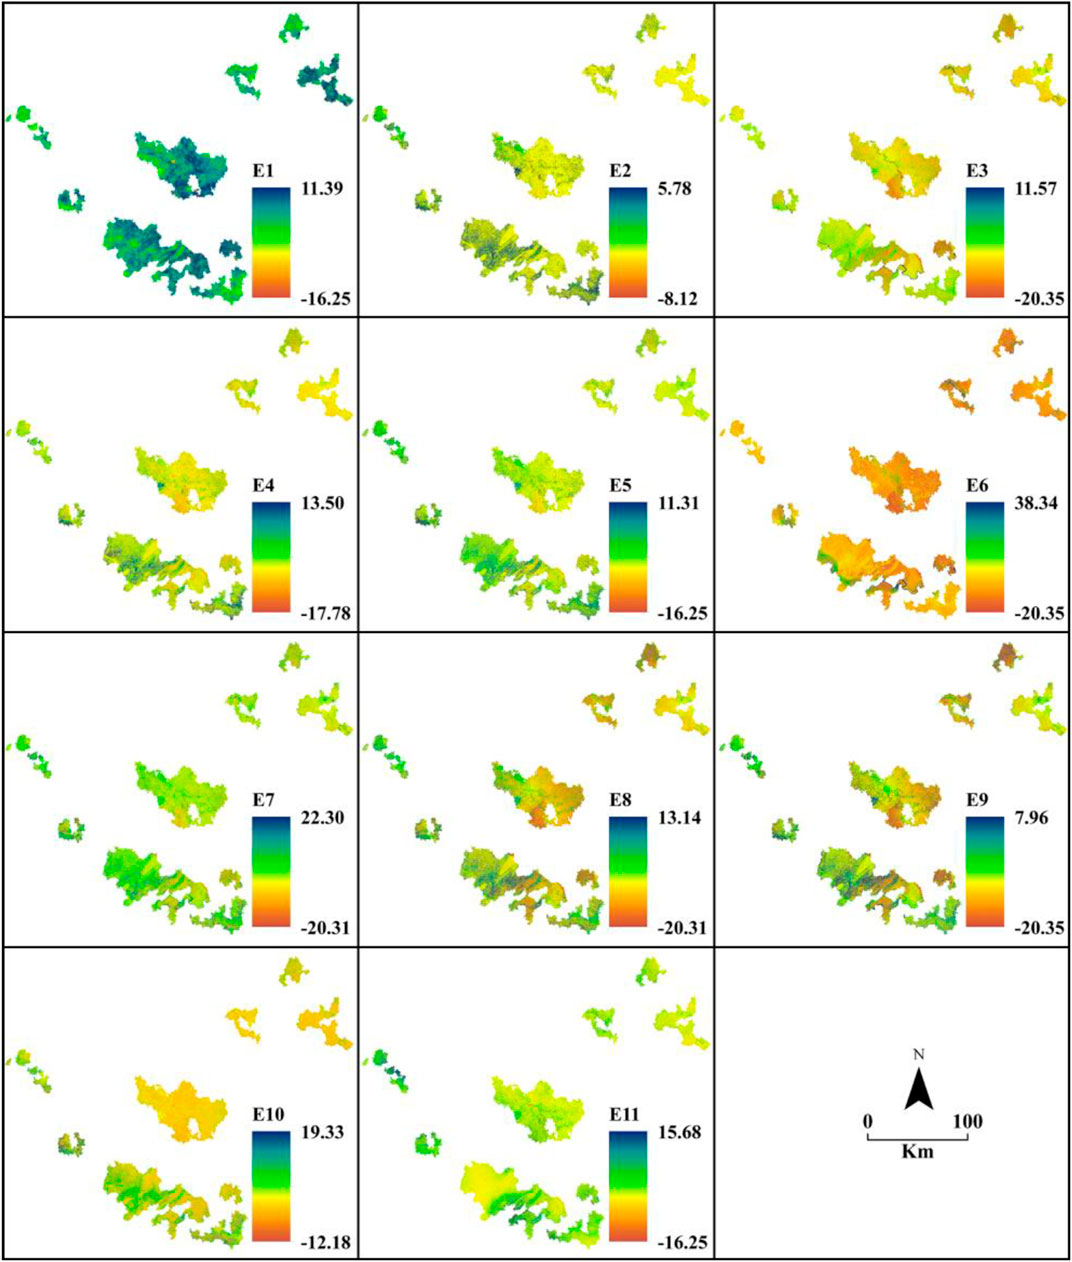
FIGURE 5. Supply and demand balance index of ecosystem service (ESBI) of 11 ecosystem services in typical hilly areas, SW China. Food (E1), materials (E2), water (E3), air quality regulation (E4), climate regulation (E5), water purification (E6), regulation of water flows (E7), erosion prevention (E8), maintenance of soil fertility (E9), habitat services (E10), cultural and amenity services (E11).
Figure 6 shows that the supply and demand of ecosystem services showed obvious spatial heterogeneity and regularity at different scales in typical hilly areas of SW China. At the regional scale (Figure 6, right), the total supply potentialities of ecosystem services increased gradually from the northeast to the southwest, which was consistent with the distribution trend of natural environmental factors, such as better vegetation coverage and hydrothermal conditions. On the contrary, the total demand potentialities of ecosystem services decreased from the northeast to the southwest. Especially in the middle and northeast of the study area, due to the high population density and the agriculture-dominated rural areas, the demand for ecosystem services was much higher than the supply. At the small scale, we take Qiuchang town, in the south of the study area, as an example for comparative analysis (Figure 6, left). The ESBI map, based on the spatial heterogeneity assessment, clearly expressed the spatial distribution of the critical area of ecosystem service supply and demand at the small scale. The ESBI of Qiuchang town was mainly affected by topography and land use. The supply area of ecosystem services is mainly distributed in the central and southeast mountainous areas, whereas the demand area of ecosystem services is mainly concentrated in the agricultural and urban areas of the valley.
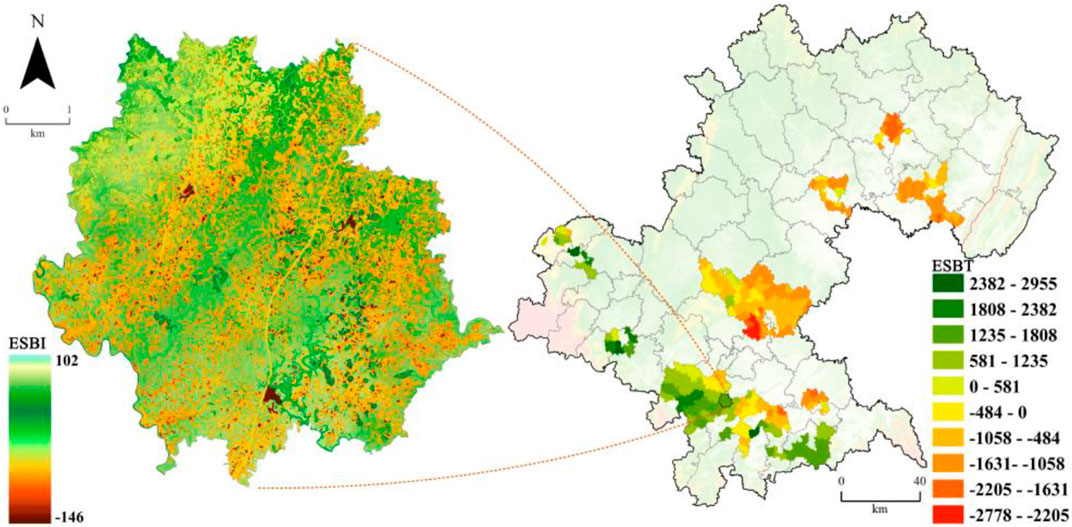
FIGURE 6. ESBI and ESBT values of ecosystem services at different scales in typical hilly areas, SW China.
Figure 7 shows that the supply and demand potential of ecosystem services at different scales was unbalanced, and the structure was similar. The supply of food, materials, air quality regulation, climate regulation, habitat and cultural and amenity services was greater than the demand, whereas the demand for water, water purification, erosion prevention and maintenance of soil fertility was significantly higher than the supply. At the regional scale (Figure 7A), the total supply met nearly 91% of the total demand. The supply potentialities of ES were mainly composed of regulating and provisioning services, at 42.66 and 36.13% of the total supply, respectively, which was mainly provided by arbor forest land, riverine wetlands, paddy fields, and orchards. Meanwhile, the demand potentialities of ES were also composed of regulating and provisioning services, at 77.57 and 19.41% of the total demand, respectively. At the small scale (Figure 7B), the total supply of Qiuchang town met 175% of the total demand. The supply potentialities of ES were also mainly composed of regulating and provisioning services, which accounted for 52.94 and 27.39%, respectively, and the demand potentialities of regulating and provisioning services accounted for 77.96 and 19.12% respectively.
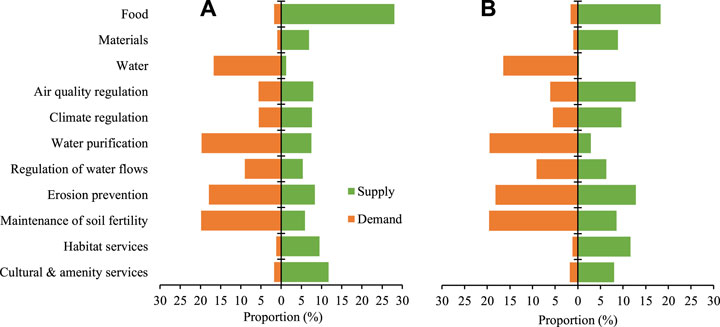
FIGURE 7. Quantitative structure of supply and demand of ecosystem services in typical hilly areas of SW China at the regional scale (A) and the small scale (B).
Identification and Regionalization of Ecosystem Service Supply and Demand
In this paper, the SPSS modeler was used to cluster the SOFM network to identify the critical areas of the supply and demand of ecosystem services. At the small scale, the ESBI values of 11 ecosystem services of each grid were used as the input parameters, the training samples were 893,887 grid units of Qiuchang Town; at the regional scale, the ESBT’ values of 11 ecosystem services of sample towns were used as the input parameters, and the training samples were 215 typical towns in hilly areas; the input parameters were trained for 1,000 times to build a stable SOFM model; the other parameters of the model used the software default values, and the output nodes were 12. In order to maintain the differences between different types, combined with the characteristics of regional ecosystem services, the SOFM clustering results are combined into four types. The calculation results of SPSS modeler software showed that the condensed and separated contour values at the two scales were both greater than 0.5, and the classification results were reliable. In addition, the spatial weight order of the small scale was: E9 > E8> E7 > E5 > E4 > E10 > E3 > E2 > E1 > E6 > E11; the spatial weight order of the regional scale was: E6 > E4 > E5 > E9 > E10 > E8 > E2 > E7 > E11 > E3 > E1; In general, regulation and provision of services had a greater impact on ecosystem services in the study area.
According to the clustering results of the SOFM network, the critical areas of ecosystem service supply and demand were identified through four categories at two scales. Figure 8 shows the spatial distribution of supply and demand types of ecosystem services at the regional scale (right) and the small scale (left). Meanwhile, we analyzed the characteristics of ecosystem services in different regions, and Figure 9 shows the average value of the supply and demand balance indices of 11 ecosystem services.
1) Regional Scale
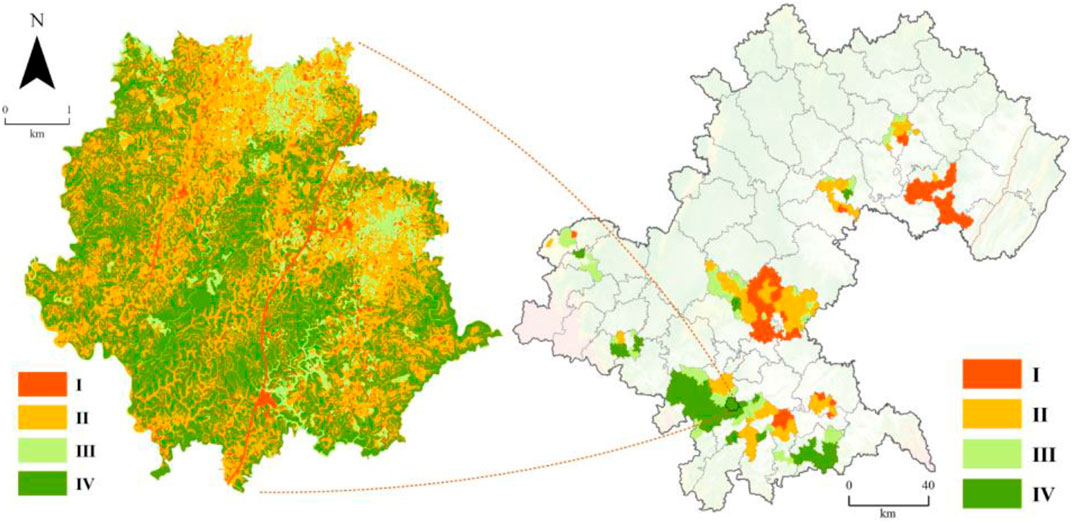
FIGURE 8. Regionalization of ecosystem service supply and demand at different scales in typical hilly areas, SW China. Left: small scale; right: regional scale.
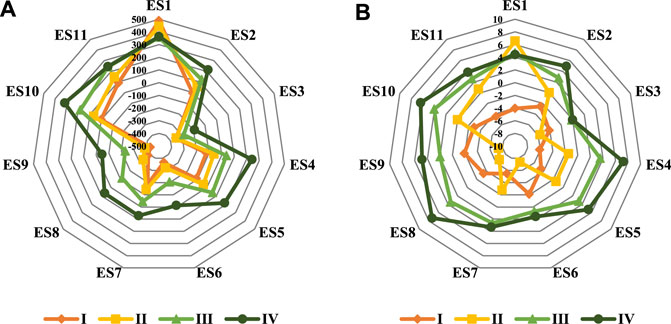
FIGURE 9. Characteristics of ecosystem service supply and demand in four types of regions at a regional scale (A) and at a small scale (B). Food (E1), materials (E2), water (E3), air quality regulation (E4), climate regulation (E5), water purification (E6), regulation of water flows (E7), erosion prevention (E8), maintenance of soil fertility (E9), habitat services (E10), cultural and amenity services (E11).
Type I: This type accounted for 32.09% of the sample towns, mainly distributed in the middle and northeast of the study area. This type of area was relatively flat land, close to the city, with high population density, a high proportion of agricultural and residential land, but the area of forest and wetlands was small, and the landscape was fragmented. Therefore, the imbalance between supply and demand was the most serious in this region, and it showed a strong demand for most ecosystem services, except for food and cultural and amenity services. Due to the high intensity of human disturbance in the region, it is necessary to strictly control the utilization of natural resources, implement soil and water conservation projects, and strengthen agricultural ecological protection and vegetation restoration in these areas.
Type II: This type accounted for 30.70% of the sample towns, mainly distributed in the transition zone around type I. The ecosystem service structure of this region was similar to that of type I, except that the supply and demand of habitat and materials services were balanced. The natural erosion of the surface was also serious, so it is necessary to prevent unreasonable land use from aggravating soil erosion, such as through steep slope reclamation.
Type III: This type accounted for 23.72% of the sample towns, mainly distributed in the west and south of the study area. The supply capacity of ecosystem services in this region was higher than the demand, and only water, water purification, and the maintenance of soil fertility were unable to meet the demand. It is necessary to strengthen the protection of natural vegetation with the function of water conservation and expand the conversion of farmland to forest and grasslands in these areas.
Type IV: This type accounted for 13.49% of the sample towns, mainly distributed in the south and southwest of the study area, with good natural environment quality and strong ecosystem service supply capacity. The area of forest and wetlands was large, and the landscape was concentrated and continuous. It is the critical area of ecosystem service supply at the regional scale, and plays an important role in the optimal management of ecosystems. In the future, the region should strengthen the protection of natural ecosystems and biodiversity, and should be included in the regional ecological red line for key management.
2) Small Scale
Type I: Areas of this type accounted for 23.72% of Qiuchang Town, mainly distributed in the urban and rural residential areas, with strong demand for ecosystem services. The area mainly provided industrial, residential, cultural, and entertainment services. The supply of ecosystem services cannot meet the needs of the people, and it was the sink of the ecosystem service demand in Qiuchang. Therefore, it is necessary to strengthen ecological restoration and reconstruction, optimize land use structure, and construct ecological network systems such as corridor and buffer zones, to ensure the effective flow and supply of ecosystem services.
Type II: Areas of this type accounted for 39.39% of Qiuchang Town, mainly distributed in gentle valleys and lower hills. The land use was mainly cultivated land, and the surface cover was crops, which was the critical area of food supply in Qiuchang. Single and unbalanced ecosystem services were the obvious characteristics of this region. The geographical conditions and hydrothermal resources of this region were good, and the potential for land development and utilization was great. However, it is still necessary to reasonably organize agricultural production and rural economic activities, strengthen the management and protection of agricultural ecosystems, prevent agricultural non-point source pollution, and enhance the area’s ability to resist natural disasters.
Type III: Areas of this type accounted for 12.00% of Qiuchang Town, mainly distributed in the transition zone between mountains and valleys. The land use was mainly orchard and arid land in the middle of hills. The supply and demand of this region were generally balanced, and the supply of 10 ecosystem services (except water) exceeded demand. This region was mainly a semi-natural ecosystem with a high altitude and large slope, and showed great potential to improve ecosystem services. Through clean production, slope farmland management, and conversion of farmland to forest, improving the ecological functions of soil and water conservation will be the key issues of ecosystem management.
Type IV: Areas of this type accounted for 42.42%, mainly distributed in mountainous areas with high forest coverage, which was the critical area of ecosystem services supply in Qiuchang town. The good natural environment and biodiversity of this region provide an important basis for ecological protection. It is necessary to strictly control the development and construction within and around this region, to reduce the human disturbance of the ecosystem, and finally to establish this area as a key zone of ecosystem conservation.
Discussion
Identifying critical areas of ecosystem service supply and demand is very important for ecological protection planning, resource allocation, and management decision-making. The primary problem in critical area identification is the quantitative assessment of ecosystem service supply and demand. Due to the limitation of small-scale applications of Burkhard’s method, this paper constructed a spatial heterogeneity assessment model, and attempted to accurately simulate the supply and demand of ecosystem services based on grid units. The case study results show that the grid-based spatial heterogeneity correction method can reduce the uncertainty of the assessment matrix method to a certain extent (Ou et al., 2018), and provide a reference for the accurate identification and expression of ecosystem services. On the other hand, due to the subjectivity of regions and experts, the supply and demand scores of different regions had certain differences. However, from the construction of the evaluation matrix, the scoring trends of this paper and related research were generally consistent (Cai et al., 2017; Ou et al., 2018), and the research results were still comparable. In addition, the study on the scale response characteristics of ecosystem services (Huang et al., 2019) showed that the township scale was the characteristic variation scale of ecosystem services, which can be used as an ideal scale level for ecosystem service evaluation and optimization. This result was consistent with our conclusion, indicating the rationality of choosing the township scale as a small-scale area study. However, the grid sizes currently selected for the study of ecosystem services at the township scale were quite different, so the scale issue needs to be further explored.
In this paper, a supply and demand index model of ecosystem services was constructed, and the unified quantification and mapping of ecosystem services based on multi-scale fusion were explored. In the case study, the small-scale supply–demand pattern was found to be affected by micro-topography and land use patterns, whereas the regional scale supply–demand pattern was found to be affected by landscape structure, location conditions, and social economy. These results were consistent with the related research results on the regional scale (Yang et al., 2018; Xie et al., 2020) and the township scale (Jiang et al., 2020), indicating that the research method in this paper can objectively express and reflect the distribution characteristics of the supply and demand of ecosystem services at different scales. However, production and benefit areas of ecosystem services are not completely coincident in space (Fisher et al., 2009); our method cannot effectively express the flow characteristics of ecosystem services. Accurate simulation of the spatial impact range and transmission path of various ecosystem services will be the focus of future research.
The SOFM network model was used to identify and extract the critical areas of ecosystem service supply and demand, while avoiding the subjectivity of traditional methods. The case study shows that the identification results of critical areas at different scales showed clear characteristics of dominant ecological function and the supply–demand relationship. Meanwhile, the differences in the functional characteristics of each type of region at the small scale was more significant than that at the regional scale. This may be due to the fact that there were more training samples at the small scale, so the constructed SOFM model had higher accuracy and better recognition ability at this scale. However, SOFM neural network clustering with multi-dimensional raster data often has some problems, such as high fragmentation of the edge region and unclear boundaries (Ma et al., 2013; Mao et al., 2019), which limits the practicability of the research results. Effectively identifying and merging the clustered, broken, and mixed blocks into complete blocks remains an urgent problem.
Conclusion
This paper presents a new framework for the identification and expression of the supply and demand patterns of ecosystem services. Through this framework, we identified the critical areas of ecosystem service supply and demand in the typical hilly area of the upper reaches of the Yangtze River, and provide a reference for the delimitation of ecological protection red lines and ecosystem management decisions at different scales.
First, a quantitative method of assessing spatial heterogeneity was applied to reveal the spatial variation characteristics of the supply and demand of ecosystem services, which extended the theoretical system and application scope of Burkhard’s method, and improved the accuracy of the identification and expression of ecosystem services. Case studies show that there was spatial heterogeneity and scale effects of ecosystem services under the two scales. The small-scale supply–demand pattern was greatly affected by microtopography and land use patterns, and the importance of ecosystem services was as follows: forest area in the upper part of the mountain > orchard and dry area in the middle and lower part of the mountain > valley farming area > flat town and farming area. The regional-scale supply–demand pattern was greatly affected by landscape structure, location conditions and social economy, and the importance of ecosystem services was as follows: south > west > north > central.
Second, based on the SOFM network model, the identification and extraction of critical areas of the supply and demand of ecosystem services can avoid the subjectivity of traditional methods. The balance between supply and demand in the studied ecosystem service areas was I < II < III < IV, in which IV was the critical area in terms of supply and I was the critical area in terms of demand. The ecological function characteristics of each type of zoning were obvious, the spatial distribution characteristics were consistent with the reality, and the results were reliable.
Third, eco-environmental management policy recommendations: Type I areas need to implement a green, low-carbon economy regional development strategy, strengthen ecological restoration and reconstruction, and control the excessive consumption of natural resources. Type II areas need to implement a regional development strategy for cleaner production, optimize agricultural production and rural economic activities, and improve the ability to withstand natural disasters. Type III areas need to implement a regional ecological protection strategy of returning farmland to forests and grasslands to further improve the quantity and quality of natural ecosystems. Type IV areas need to implement an ecological red line management strategy, protect the integrity of the natural ecosystem and biodiversity, strictly control the development and construction of the interior and surrounding areas, and reduce human interference.
Due to the fragmentation and blurring of the boundaries of some critical areas of ecosystem services at small scales, effectively identifying and merging broken and mixed blocks into complete and clear partition boundaries will be the focus of future research. Although this research framework still has some limitations and uncertainties, it was able to realize the unified quantification, identification, and mapping of critical areas of ecosystem services at multiple scales and provide valuable information for the precise management of the ecological environment.
Data Availability Statement
The raw data supporting the conclusions of this article will be made available by the authors, without undue reservation.
Author Contributions
Guitang Liao, Xuesong Gao and Liangji Deng conceived and designed the experiment. Zhengyu Lin and Peng He collected the data and analyzed the data. Wei Zhou and Chenghua Xu helped the language correction; Guitang Liao wrote the paper.
Funding
This work is financially supported by the Chengdu University of Information Technology (KYTZ202116).
Conflict of Interest
The authors declare that the research was conducted in the absence of any commercial or financial relationships that could be construed as a potential conflict of interest.
Acknowledgments
This work is financially supported by the Chengdu University of Information Technology (KYTZ202116). We would like to thank the reviewers for their valuable comments and suggestions.
References
Beichler, S. A. (2015). Exploring the Link between Supply and Demand of Cultural Ecosystem Services - towards an Integrated Vulnerability Assessment. Int. J. Biodiversity Sci. Ecosystem Serv. Manage. 11, 250–263. doi:10.1080/21513732.2015.1059891
Boithias, L., Acuña, V., Vergoñós, L., Ziv, G., Marcé, R., and Sabater, S. (2014). Assessment of the Water Supply:demand Ratios in a Mediterranean basin under Different Global Change Scenarios and Mitigation Alternatives. Sci. Total Environ. 470-471, 567–577. doi:10.1016/j.scitotenv.2013.10.003
Burkhard, B., Kandziora, M., Hou, Y., and Müller, F. (2014). Ecosystem Service Potentials, Flows and Demands-Concepts for Spatial Localisation, Indication and Quantification. Lo 34, 1–32. doi:10.3097/LO.201434
Burkhard, B., Kroll, F., Müller, F., and Windhorst, W. (2009). Landscapes' Capacities to Provide Ecosystem Services - A Concept for Land-Cover Based Assessments. Lo 15, 1–22. doi:10.3097/LO.200915
Burkhard, B., Kroll, F., Nedkov, S., and Müller, F. (2012). Mapping Ecosystem Service Supply, Demand and Budgets. Ecol. Indicators 21, 17–29. doi:10.1016/j.ecolind.2011.06.019
Cai, W., Gibbs, D., Zhang, L., Ferrier, G., and Cai, Y. (2017). Identifying Hotspots and Management of Critical Ecosystem Services in Rapidly Urbanizing Yangtze River delta Region, china. J. Environ. Manage. 191 (Apr.15), 258–267. doi:10.1016/j.jenvman.2017.01.003
Che, Z. H. (1995). On the Empirical Formula and Curve of Soil Permeability Coefficient. Water Resour. Hydropower Northeast China (9), 17–19.
Chen, J., and Shi, P. J. (2005). Discussion on Functional Land Use Classification System. J. Beijing Norm. Univ. (Nat. Sci. 5, 536–540. doi:10.3321/j.issn:0476-0301.2005.05.024
Cheng, W. M., Zhou, C. H., Chai, H. X., Zhao, S., and Li, B. (2009). Quantitative Extraction and Analysis of Basic Morphological. Types of Land Geomorphology in China 11 (6), 725–736. doi:10.3724/sp.j.1047.2009.00725
Costanza, R., d'Arge, R., de Groot, R., Farber, S., Grasso, M., Hannon, B., et al. (1997). The Value of the World's Ecosystem Services and Natural Capital. Nature 387, 253–260. doi:10.1038/387253a0
de Groot, R. S., Alkemade, R., Braat, L., Hein, L., and Willemen, L. (2010). Challenges in Integrating the Concept of Ecosystem Services and Values in Landscape Planning, Management and Decision Making. Ecol. Complexity 7 (3), 260–272. doi:10.1016/j.ecocom.2009.10.006
de Groot, R. S., Wilson, M. A., and Boumans, R. M. J. (2002). A Typology for the Classification, Description and Valuation of Ecosystem Functions, Goods and Services. Ecol. Econ. 41, 393–408. doi:10.1016/s0921-8009(02)00089-7
Deng, H. B., Chen, C. D., and Liu, X. T. (2009). Conception and Function Classification of Regional Ecological Land. Acta Ecologica Sinica 29 (3), 1519–1524. doi:10.3321/j.issn:1000-0933.2009.03.050
Elahi, E., Abid, M., Zhang, L., ul Haq, S., and Sahito, J. G. M. (2018a). Agricultural Advisory and Financial Services; Farm Level Access, Outreach and Impact in a Mixed Cropping District of Punjab, Pakistan. Land Use Policy 71, 249–260. doi:10.1016/j.landusepol.2017.12.006
Elahi, E., Abid, M., Zhang, H., Cui, W., and Ul Hasson, S. (2018b). Domestic Water Buffaloes: Access to Surface Water, Disease Prevalence and Associated Economic Losses. Prev. Vet. Med. 154, 102–112. doi:10.1016/j.prevetmed.2018.03.021
Elahi, E., Weijun, C., Zhang, H., and Abid, M. (2019a). Use of Artificial Neural Networks to rescue Agrochemical-Based Health Hazards: A Resource Optimisation Method for Cleaner Crop Production. J. Clean. Prod. 238, 117900. doi:10.1016/j.jclepro.2019.117900
Elahi, E., Weijun, C., Jha, S. K., and Zhang, H. (2019b). Estimation of Realistic Renewable and Non-renewable Energy Use Targets for Livestock Production Systems Utilising an Artificial Neural Network Method: A Step towards Livestock Sustainability. Energy 183, 191–204. doi:10.1016/j.energy.2019.06.084
Elahi, E., Khalid, Z., Cui, W. J., and Zhang, H. M. (2020). The Public Policy of Agricultural Land Allotment to Agrarians and its Impact on Crop Productivity in Punjab Province of Pakistan. Land Use Policy 90 (C), 104324. doi:10.1016/j.landusepol.2019.104324
Elahi, E., Khalid, Z., Tauni, M. Z., Zhang, H., and Lirong, X. (2021a). Extreme Weather Events Risk to Crop-Production and the Adaptation of Innovative Management Strategies to Mitigate the Risk: A Retrospective Survey of Rural Punjab, Pakistan, Pakistan. Technovation 2021, 102255. doi:10.1016/j.technovation.2021.102255
Elahi, E., Zhang, H., Lirong, X., Khalid, Z., and Xu, H. (2021b). Understanding Cognitive and Socio-Psychological Factors Determining Farmers' Intentions to Use Improved Grassland: Implications of Land Use Policy for Sustainable Pasture Production. Land Use Policy 102, 105250. doi:10.1016/j.landusepol.2020.105250
Elahi, E., Zhang, L., Abid, M., Javed, M. T., and Xinru, H. (2017). Direct and Indirect Effects of Wastewater Use and Herd Environment on the Occurrence of Animal Diseases and Animal Health in Pakistan. Environ. Sci. Pollut. Res. 24 (7), 6819–6832. doi:10.1007/s11356-017-8423-9
Fisher, B., Turner, R. K., and Morling, P. (2009). Defining and Classifying Ecosystem Services for Decision Making. Ecol. Econ. 68 (3), 643–653. doi:10.1016/j.ecolecon.2008.09.014
Fu, B. J., and Zhang, L. W. (2014). Land-Use Change and Ecosystem Services: Concepts, Methods and Progress. Progress Geography 33 (4), 441–446. doi:10.11820/dlkxjz.2014.04.001
Guan, Q., Hao, J., Ren, G., Li, M., Chen, A., Duan, W., et al. (2020). Ecological Indexes for the Analysis of the Spatial-Temporal Characteristics of Ecosystem Service Supply and Demand: A Case Study of the Major Grain-Producing Regions in Quzhou, China. Ecol. Indicators 108, 105748. doi:10.1016/j.ecolind.2019.105748
Hou, Y., Li, B., Müller, F., Fu, Q., and Chen, W. (2018). A Conservation Decision-Making Framework Based on Ecosystem Service Hotspot and Interaction Analyses on Multiple Scales. Sci. Total Environ. 643, 277–291. doi:10.1016/j.scitotenv.2018.06.103
Huang, M. Y., Yue, W. Z., Fang, B., and Feng, S. (2019). Scale Response Characteristics and Geographic Exploration Mechanism of Spatial Differentiation of Ecosystem Service Values in Dabie Mountain Area, central China from 1970 to 2015. Acta Geographica Sinica 74 (9), 1904–1920. doi:10.11821/dlxb201909015
Jiang, D. D., Ma, W. B., and Zou, F. L. (2020). Spatiotemporal Changes of Ecosystem Service Value in Dalou Mountain Area at Township Scale. Res. Environ. Sci. 33 (12), 2713–2723. doi:10.13198/j.issn.1001-6929.2020.11.10
Jie, X., Yu, X., Na, L., and Hao, W. (2015). Spatial and Temporal Patterns of Supply and Demand Balance of Water Supply Services in the Dongjiang Lake Basin and its Beneficiary Areas. J. Resour. Ecol. 6, 386–396. doi:10.5814/j.issn.1674-764x.2015.06.006
Kroll, F., Müller, F., Haase, D., and Fohrer, N. (2012). Rural-urban Gradient Analysis of Ecosystem Services Supply and Demand Dynamics. Land Use Policy 29, 521–535. doi:10.1016/j.landusepol.2011.07.008
Li, J., Jiang, H., Bai, Y., Alatalo, J. M., Li, X., Jiang, H., et al. (2016). Indicators for Spatial-Temporal Comparisons of Ecosystem Service Status between Regions: A Case Study of the Taihu River Basin, China. Ecol. Indicators 60, 1008–1016. doi:10.1016/j.ecolind.2015.09.002
Li, S. C., Liu, J. L., Zhang, C. Y., and Zhao, Z. Q. (2011). The Research Trends of Ecosystem Services and the Paradigm in Geography. Acta Geographica Sinic 66 (12), 1618–1630. doi:10.11821/xb201112004
Li, S. C. (2014). The Geography of Ecosystem Services. Beijing, China: Science Press. doi:10.1190/igcbeijing2014-144
Li, S. C., Zhang, C. Y., Liu, J. L., Zhu, W., Cheng, M. A., and Wang, J. (2013). The Tradeoffs and Synergies of Ecosystem services:Research Progress, Development Trend, and Themes of Geography. Geographical Res. 32 (8), 1379–1390.
Liao, G., He, P., Gao, X., Deng, L., Zhang, H., Feng, N., et al. (2019). The Production-Living-Ecological Land Classification System and its Characteristics in the Hilly Area of Sichuan Province, Southwest China Based on Identification of the Main Functions. Sustainability 11, 1600. doi:10.3390/su11061600
Liu, L. Y., Bian, Z. Q., and Ding, S. Y. (2018). Effects of Landscape Spatial Heterogeneity on the Generation and Provision of Ecosystem Services. Acta Ecologica Sinica 38 (18), 6412–6421. doi:10.5846/stxb201801160119
Liu, Y., Lv, J. S., and Bi, J. (2019). Characterizing Water Purification Services and Quantifying Their Driving Factors in Watershed Terrestrial Ecosystems. Prog. Geogr. 38 (4), 588–599. doi:10.18306/dlkxjz.2019.04.011
Ma, C., Li, S. C., Liu, J. L., et al. (2013). Regionalization of Ecosystem Services of Beijing-Tianjin-Hebei Area Based on SOFM Neural Network[J]. PROGRESS GEOGRAPHY 32 (9), 1383–1393.
Ma, L., Liu, H., Peng, J., and Wu, J., (2017). A Review of Ecosystem Services Supply and Demand. Acta Geographica Sinica 72 (7), 1277–1289. doi:10.11821/dlxb201707012
MA (Millennium Ecosystem Assessment) (2005). Ecosystems and Human Well-Being: Synthesis. Washington D.C: Island Press.
Mao, Q., Peng, J., Liu, Y. X., Wu, W., Zhao, M., and Wang, Y. (2019). An Ecological Function Zoning Approach Coupling SOFM and SVM: A Case Study in Ordos. Acta Geographica Sinica 74 (3), 460–474.
Ou, W. X., Wang, H. N., and Tao, Y. (2018). A Land Cover-Based Assessment of Ecosystem Services Supply and Demand Dynamics in the Yangtze River Delta Region. Acta Ecologica Sinica 38 (17), 6337–6347. doi:10.5846/stxb201707061225
Ouyang, Z. Y., Zhu, C. Q., and Yang, G. B. (2013). Gross Ecosystem Product: Concept, Accounting Framework and Case Study. Acta Ecologica Sinica 33 (21), 6747–6761. doi:10.1016/j.chnaes.2012.12.001
Peña, L., Casado-Arzuaga, I., and Onaindia, M. (2015). Mapping Recreation Supply and Demand Using an Ecological and a Social Evaluation Approach. Ecosystem Serv. 13, 108–118. doi:10.1016/j.ecoser.2014.12.008
Peng, B., Chen, H., Elahi, E., and Wei, G. (2020). Study on the Spatial Differentiation of Environmental Governance Performance of Yangtze River Urban Agglomeration in Jiangsu Province of China. Land Use Policy 99, 105063. doi:10.1016/j.landusepol.2020.105063
Peng, J., Hu, X. X., and Zhao, M. Y. (2017). Research Progress on Ecosystem Service Trade-Offs: From Cognition to Decision-Making. Acta Geographica Sinica 72 (6), 960–973. doi:10.11821/dlxb201706002
TEEB Foundations (2010). in TEEB-the Economics of Ecosystems and Biodiversity (TEEB): Ecological and Economic Foundations. Editor P. Kumar (London: Earthscan)
Qiao, B., and Yan, X. C. (2008). The Investigation and Research on Rehabilitation and Restoration Modes of Vulnerable Ecological Regions in Hilly Areas of Sichuan. Ecol. Econ. 10, 41–44.
Stürck, J., Poortinga, A., and Verburg, P. H. (2014). Mapping Ecosystem Services: the Supply and Demand of Flood Regulation Services in Europe. Ecol. Indicators 38, 198–211. doi:10.1016/j.ecolind.2013.11.010
Tratalos, J. A., Haines-Young, R., Potschin, M., Fish, R., and Church, A. (2016). Cultural Ecosystem Services in the UK: Lessons on Designing Indicators to Inform Management and Policy. Ecol. Indicators 61, 63–73. doi:10.1016/j.ecolind.2015.03.040
Villamagna, A. M., Angermeier, P. L., and Bennett, E. M. (2013). Capacity, Pressure, Demand, and Flow: a Conceptual Framework for Analyzing Ecosystem Service Provision and Delivery. Ecol. Complexity 15, 114–121. doi:10.1016/j.ecocom.2013.07.004
Wang, J., Zhai, T., Lin, Y., Kong, X., and He, T. (2019). Spatial Imbalance and Changes in Supply and Demand of Ecosystem Services in China. Sci. Total Environ. 657 (20), 781–791. doi:10.1016/j.scitotenv.2018.12.080
Wang, L. Y., Xiao, Y., and Rao, E. M. (2015). Spatial Characteristics of Food Provision Service and its Impact Factors in China. Journal Natural Resources 30 (2), 188–196. doi:10.11849/zrzyxb.2015.02.002
Wang, L., and Zhang, X. H., and Song, N. P. (2007). Timber Volume Evaluation of Intensively-Managed Plantation of poplar Based on RS Technology, 6. Forest Resources Management, 84–88. doi:10.3969/j.issn.1002-6622.2007.06.021
Wang, Z. Z., Zhang, L. W., and Li, X. P. (2019). The Spatial⁃Temporal Pattern of Hotspots and Coldspots of Ecosystem Services at the Watershed Scale. Acta Ecologica Sinica 39 (3), 823–834. doi:10.5846/stxb201804180886
Wei, H., Fan, W., Wang, X., Lu, N., Dong, X., and Zhao, Y. (2017). Integrating Supply and Social Demand in Ecosystem Services Assessment: A Review. Ecosystem Serv. 25, 15–27. doi:10.1016/j.ecoser.2017.03.017
Wei, J., Deng, L. J., and Tan, H. (2009). Assessment of Ecological Security of Land Resources in Central Hilly Area of Sichuan Province-A Case Study of Guangan City. J. Sichuan Agric. Univ. 27, 338–344.
Wu, J. S., Luo, K. Y., and Ma, H. K. (2020). Ecological Security and Restoration Pattern of Pearl River Delta, Based on Ecosystem Service and Gravity Model. Acta Ecologica Sinica 40 (23), 8417–8429. doi:10.5846/stxb202003150550
Xie, G. D., Zhang, C. X., and Zhang, L. M. (2015). Improvement of the Evaluation Method for Ecosystem Service Value Based on Per Unit Area. JOURNAL NATURAL RESOURCES 30 (8), 1243–1254. doi:10.11849/zrzyxb.2015.08.001
Xie, G., Zhang, C., Zhen, L., and Zhang, L. (2017). Dynamic Changes in the Value of China's Ecosystem Services. Ecosystem Serv. 26, 146–154. doi:10.1016/j.ecoser.2017.06.010
Xie, Y. C., Zhang, S. X., and Lin, B. (2020). Spatial Zoning for Land Ecological Consolidation in Guangxi Based on the Ecosystem Services Supply and Demand. Journal Natural Resources 35 (1), 217–229.
Xu, L., Li, S. N., and Lu, S. W. (2018). Research Advances in forest Absorption of Gaseous Air Pollutants. World For. Res. 31 (6), 25–30. doi:10.13348/j.cnki.sjlyyj.2018.0080.y
Yan, Y., Zhu, J. Y., and Wu, G. (2017). Review and Prospective Applications of Demand, Supply, and Consumption of Ecosystem Services. Acta Ecologica Sinica 37 (8), 2489–2496.
Yang, L., Zhen, L., Pan, Y., Cao, X., and Long, X. (2012). Ecosystem Services Supply and Consumption—A Case in Yellow River Watershed, China. J. Arid Land Resour. Environ. 26, 131–138.
Yang, S. H., Hu, S. G., and Qu, S. J. (2018). [Terrain Gradient Effect of Ecosystem Service Value in Middle Reach of Yangtze River, China]. Ying Yong Sheng Tai Xue Bao 29 (3), 976–986. doi:10.13287/j.1001-9332.201803.016
Yi, X. Y., Peng, Y. H., and Liao, J. Y. (2017). A Review of the Relationship between forest Vegetation and Atmospheric Particulate Matter. Plant Sci. J. 35 (5), 790–796. doi:10.11913/PSJ.2095-0837.2017.50790
Yu, G. R., Li, X. R., and Wang, Q. F. (2010). Carbon Storage and its Spatial Pattern of Terrestrial Ecosystem in china. J. Resour. Ecol. 1 (2), 97–109.
Zhang, H. Q., Xu, E. Q., and Zhu, H. Y. (2017). Ecological-living-industrial Land Classification System in China. J. Resour. Ecol. 8, 121–128.
Zhao, C., and Sander, H. A. (2015). Quantifying and Mapping the Supply of and Demand for Carbon Storage and Sequestration Service from Urban Trees. PLoS One 10, e0136392. doi:10.1371/journal.pone.0136392
Keywords: Ecosystem services, critical area, spatial heterogeneity, SOFM neural network, Sichuan Basin
Citation: Liao G, He P, Gao X, Lin Z, Fang C, Zhou W, Xu C and Deng L (2021) Identifying Critical Area of Ecosystem Service Supply and Demand at Different Scales Based on Spatial Heterogeneity Assessment and SOFM Neural Network. Front. Environ. Sci. 9:714874. doi: 10.3389/fenvs.2021.714874
Received: 26 May 2021; Accepted: 01 July 2021;
Published: 14 July 2021.
Edited by:
Faik Bilgili, Erciyes University, TurkeyReviewed by:
Ehsan Elahi, Nanjing University of Information Science and Technology, ChinaIbrahim Dogan, Bozok University, Turkey
Copyright © 2021 Liao, He, Gao, Lin, Fang, Zhou, Xu and Deng. This is an open-access article distributed under the terms of the Creative Commons Attribution License (CC BY). The use, distribution or reproduction in other forums is permitted, provided the original author(s) and the copyright owner(s) are credited and that the original publication in this journal is cited, in accordance with accepted academic practice. No use, distribution or reproduction is permitted which does not comply with these terms.
*Correspondence: Guitang Liao, liaoguitang1982@163.com; Liangji Deng, auh6@sicau.edu.cn