 Yanfeng Huo1,2,3
 Yonghong Wang4,5*
 Pauli Paasonen5
 Quan Liu6
 Guiqian Tang7Yuanyuan Ma8
 Tuukka Petaja4
 Veli-Matti Kerminen4
 Markku Kulmala4
- 1Anhui Institute of Meteorological Sciences, Key Laboratory for Atmospheric Sciences & Remote Sensing of Anhui Province, Hefei, China
- 2Shouxian National Climate Observatory, Shouxian, China
- 3Huaihe River Basin Typical Farmland Ecological Meteorological Field Science Experiment Base of China Meteorological Administration, Shouxian, China
- 4Research Center for Eco-Environmental Sciences, Chinese Academy of Science, Beijing, China
- 5Institute for Atmospheric and Earth System Research/Physics, Faculty of Science, University of Helsinki, Helsinki, Finland
- 6Beijing Weather Modification Office, Beijing Meteorological Bureau, Beijing, China
- 7Institute of Atmospheric Physics, Chinese Academy of Sciences, Beijing, China
- 8Key Laboratory of Land Surface Process and Climate Change in Cold and Arid Regions, Northwest Institute of Eco-Environment and Resources, Chinese Academy of Sciences, Lanzhou, China
Boundary layer height (BLH) is an important parameter in climatology and air pollution research, especially in urban city. We calculated the BLH with a bulk Richardson number (Ri) method over urban cities of China during 1980–2018 using European Centre for Medium-Range Weather Forecasts (ECMWF) ERA-interim data after carefully validation with sounding data obtained from two meteorology stations in eastern China during 2010–2018. The values of BLH between these two types of data have correlation coefficients in the range of 0.65–0.87, which indicates that it is reasonable to analyze long-term trends of the BLH from ERA data sets. Using ERA-interim calculated BLH, we found that there is an increasing trend in the daytime BLH in most cities of eastern China, particularly during the spring season. A correlation analysis between the BLH and temperature, wind speed, relative humidity and visibility revealed that the variability in meteorological parameters, as well as in aerosol concentrations over highly polluted eastern China, play important roles in the development of the BLH.
Introduction
Planetary boundary layer (PBL) is the turbulent layer of the troposphere and plays an important role influencing the concentration, transport and diffusion of atmospheric compounds (Stull, 1988). The PBL height is most commonly identified as an inversion in the potential temperature and dewpoint, or as a peak value in the low-level wind speed. Air pollutants are concentrated in the PBL, and the daily variation of the PBL is crucial in interpreting the diurnal variation of air pollutants in areas with anthropogenic emissions (Kaser et al., 2015; Petäjä et al., 2016; Sun et al., 2013; Ma et al., 2020; Xian et al., 2021). In general, the height of planetary boundary layer varies spatially and temporally, typically ranging from about a hundred meters to some kilometres. The PBL height can be as high as 5 km over a desert in mid-summer due to strong surface heating, while being as low as 50–100 m during a night over land under clear sky and light wind conditions (Zhang et al., 2013; Chen et al., 2016).
Radio sounding measurements, providing the profiles of wind, humidity and temperature, are typically used in weather stations to determine the height of PBL (Seidel et al., 2010). In general, such sounding is conducted twice a day at 08:00 and 20:00. However, the method needs a lot of man power to be conducted in long-term measurements, in addition to which it cannot provide information about the diurnal evolution of the boundary layer height due to the limited time resolution. Seidel et al (2010) compared seven methods of calculating the PBL height from a 505-station global radiosonde data set, and also attempted to quantify aspects of structural and parametric uncertainty in the values of the PBL height. Zhang et al (2013) estimated trends of the PBL height over 25 stations in Europe using radiosonde data from 1973–2010, and found significant increases in the daytime PBL height at most of the stations. Guo et al (2016) compared the PBL height between the radiosonde and reanalysis data from 2011–2015 in China, and found a good agreement between these two data sets. Remote sensing, as an alternative method, is widely used to determine the PBL height from a backscattering signal during the past decades. Wang et al (2012) derived the PBL height at two locations of Lanzhou, China, using a micro-pulse lidar and microwave radiometer, and found that these two results were consistent with each other during strong convective situations. Zhang et al (2016) compared the PBL height from CALIOP and radiosonde data in Beijing and Jinhua, and obtained correlation coefficients of 0.59 and 0.65 at Beijing and Jinhua, respectively, between these two kinds of data.
Very recently, Guo et al (2019) found an increasing trends of the PBL height over China during 1976–2003, but a non-uniform decrease after 2004. Capital cities of China suffer the most from air pollution, but the variability and trends of the PBL height are unknown in those regions.
With the rapid economic growth in China, air pollution has become an issue with large influences on climate, human health and visibility degradation during the last decades (Wang et al., 2015). Wang et al (2020), Ding et al (2016) and Petäjä et al (2016) and other work (Ma et al., 2020) found that atmospheric air pollution can be enhanced by boundary layer-aerosol interactions, characterised by higher aerosol concentrations and shallower boundary layer heights. Therefore, a better knowledge of the long-time variation of the PBL height in China is essential when evaluating variations in aerosol concentrations and effects of regional climate change. However, only a few studies reported a long-term variation of the PBL height over highly polluted cities in China (Guo et al., 2016; Tang et al., 2016).
In this study, we used ERA-reanalysis data combined with radio sounding measurements in determining long-term trends in the BLH in the capital cities of each province in eastern China. Our results provide insights into the decadal variation of the BLH in polluted eastern China during the urbanization period. We also explored the spatial variability in the BLH over China during these years.
Data and Methodology
We chose 26 capital cities of each province in eastern China to analyze the boundary layer heights (BLHs) variation and made a comprehensive analysis. The detailed city list and locations are listed in Table 1.
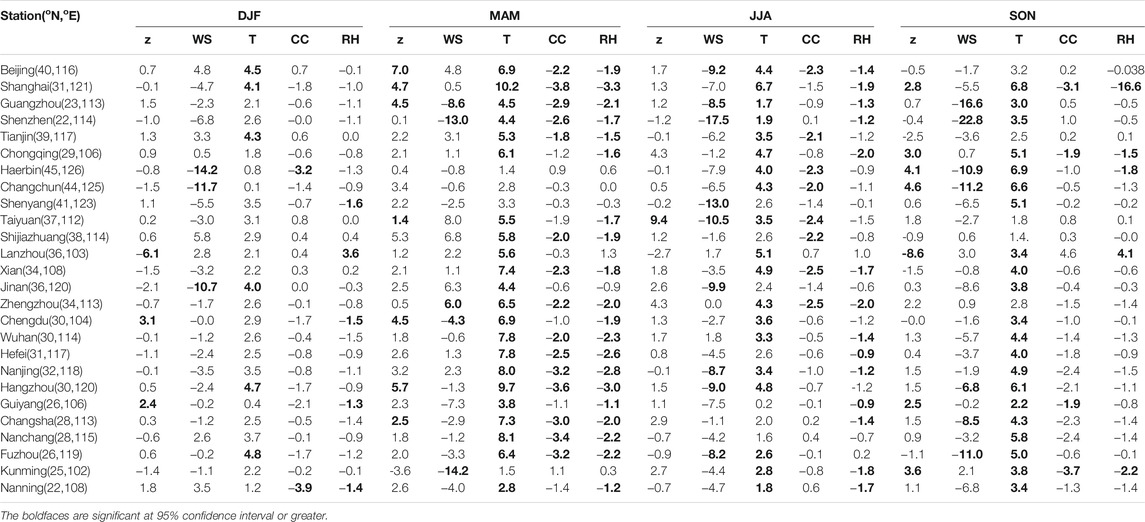
TABLE 1. Seasonal trends in 14 BJT BLH, wind speed, temperature, cloud cover, relative humidity (z, WS, T, CC, RH with units of m, 10−3 m/s, 10−2 K, 10–3, ‰, respectively) during 1980–2018. Boldfaces are significant at 95% confidence interval or greater.
Dataset
The ERA-Interim reanalysis are assimilated results, including model products and various measurements (Dee et al., 2011). Its model-layers data contain 60 vertical layers (starting with about 25 m near surface, decreasing to about 500 m around 500 hPa), which has been used to calculate the boundary layer height (Seidel et al., 2010; Guo et al., 2016). In this work, the reanalysis data with a horizontal resolution of 0.75° × 0.75° and time resolution of 6 h were used for the BLHs calculation, after which we interpolated the BLHs to 26 city sites (Figure 1). In addition, the surface temperature, relative humidity and wind speed obtained from reanalysis products were used in our analysis to constrain the factors influencing the boundary layer. Visibility data from the strictly quality-controlled Chinese observational data set were also used to analyze influences of aerosols on the boundary layer height.
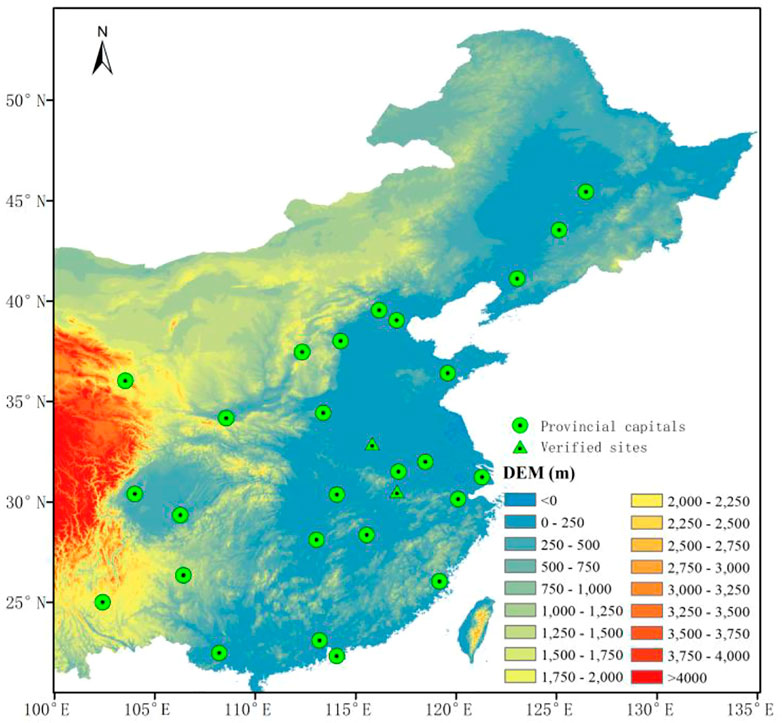
FIGURE 1. The distribution of stations in this study. The color in the map represents altitude. The blue triangles denotes Fuyang (upper one) and Anqing station, respectively.
We applied radiosonde data at two sounding stations in central China during 2010–2018 to validate our results from the ERA-Interim reanalysis calculation. The two stations are a part of China Meteorological Administration L-band second-resolution ground-based sounding network. The instrument used for validation is a digital radiosonde sensor (GTS1), which is developed by the Shanghai Changwang Meteorological Science and Technology Company. The instrument has been used widely in China meteorology stations as routine measurements, and a comparison between the GTS1 and Vaisala RS80 shows that the instrument performance good (Bian et al., 2010). For simplicity, we hereafter call the reanalysis results and sounding results as ERA-BLH and CMA-BLH, respectively.
The Method Used to Estimate BLH
A bulk Richardson number (Ri) method was carefully applied to calculate the BLHs in this work. The Ri method was first put forward by (Vogelezang and Holtslag, 1996). The method is suitable for both stable and convective boundary layer, in which the value of Ri can be expressed as:
Here the subscript s and z indicate the surface and specific height, respectively, the variables g and θ are gravity acceleration and potential temperature, respectively, u and v are the horizontal wind velocity components, u* is the surface friction velocity, and b is a constant. In general, bu* is much smaller than the bulk wind shear term (the two other terms together in the denominator) and can be neglected. In our calculations, the surface height was assumed to be 2 m and the surface wind was approximated to be zero, and the first level at which the interpolated Ri was equal to 0.25 was interpreted as the BLH. This method has been proven to be one of the best methods for the climatological analysis of the BLH because of its applicability for both stable and convective boundary layers (Seidel et al., 2010).
Results and Discussion
Validation of ERA-BLH With CMA-BLH
This section presents an inter-comparison of the ERA-BLH with CMA-BLH data at the stations of Fuyang and Anqing in eastern China. The soundings were usually launched at 08:00 and 20:00 Beijing time (BJT), so the value of BLH were mainly compared at these two moments. Figures 2, 3 show scatter plots between the ERA-BLH with CMA-BLH in Fuyang and Anqing, respectively, the upper panels correspond to 08:00 and the lower panels to 20:00 BJT. The correlation coefficients between two kinds of BLH data were larger than 0.7° at 08:00 for most of the time, which is consistent with earlier results in the Beijing station (Guo et al., 2016). These high correlation coefficients give us confidence that ERA-BLH is an appropriate alternative approach to analyze changes in the boundary layer height. It is interesting to note that comparison results at 08:00 BJT were better than those at 20:00 BJT. A possible reason for this is that the convective boundary layer transmits to a nocturnal stable boundary layer after sunset, so that the existence of a residual layer at 20:00 may increase differences between two kinds of BLH data.
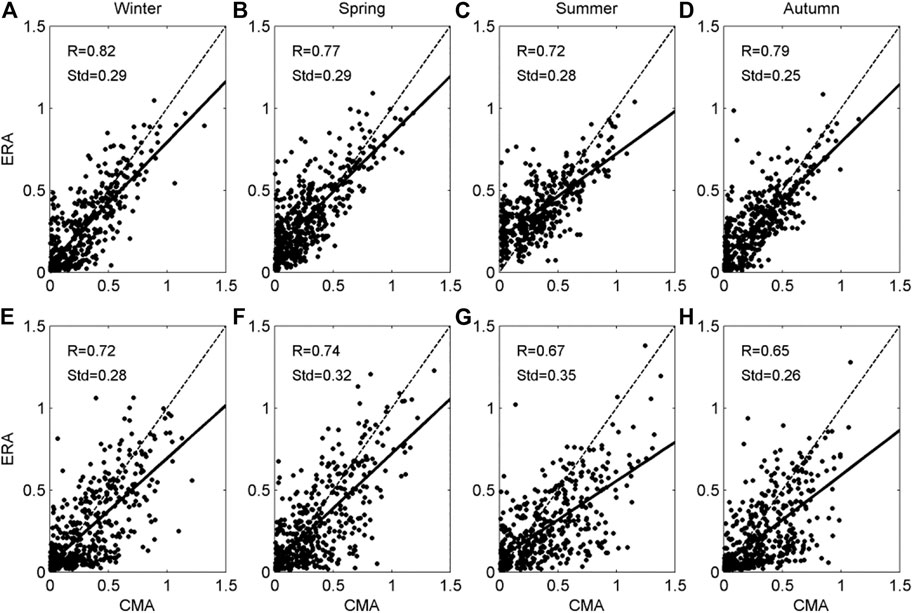
FIGURE 2. CMA-BLH and ERA-BLH at (the upper panel) 0800 and (the lower panel) 2000 BJT in (A,B) winter, (C,D) spring, (E,F) summer, and (G,H) autumn in Anqing.
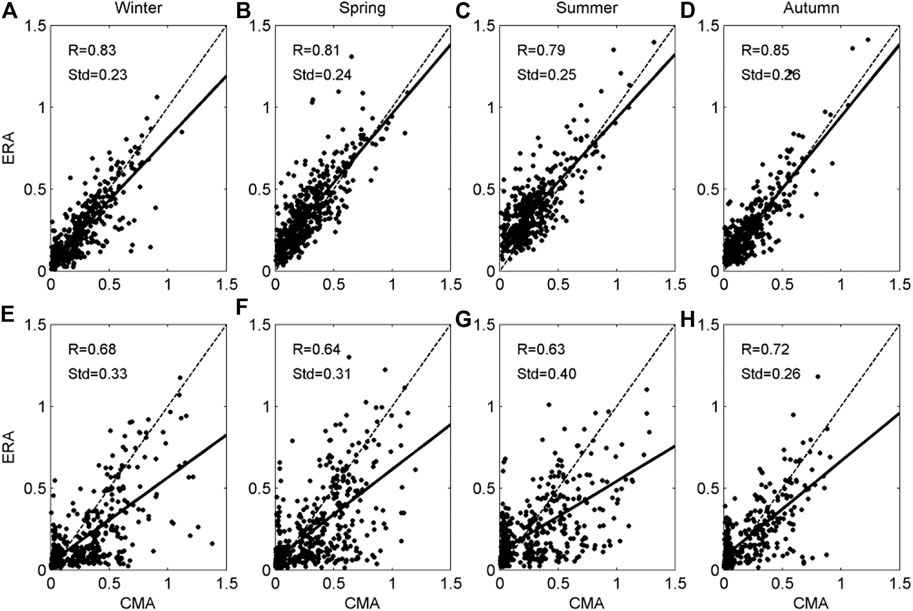
FIGURE 3. CMA-BLH and ERA-BLH at (the upper panel) 0800 and (the lower panel) 2000 BJT in (A,B) winter, (C,D) spring, (E,F) summer, and (G,H) autumn in Fuyang.
To further validate our analysis method, we compared BLH with meteorological parameters for both ERA data and measurement data from the Anqing and Fuyang stations (Figure 4). We found a good consistency between the observed and reanalysis data in terms of the couplings of meteorological conditions and BLH. The validation presented here gives confidence in applying the ERA data to the analysis of long-term interactions between the BLH and meteorological variability.
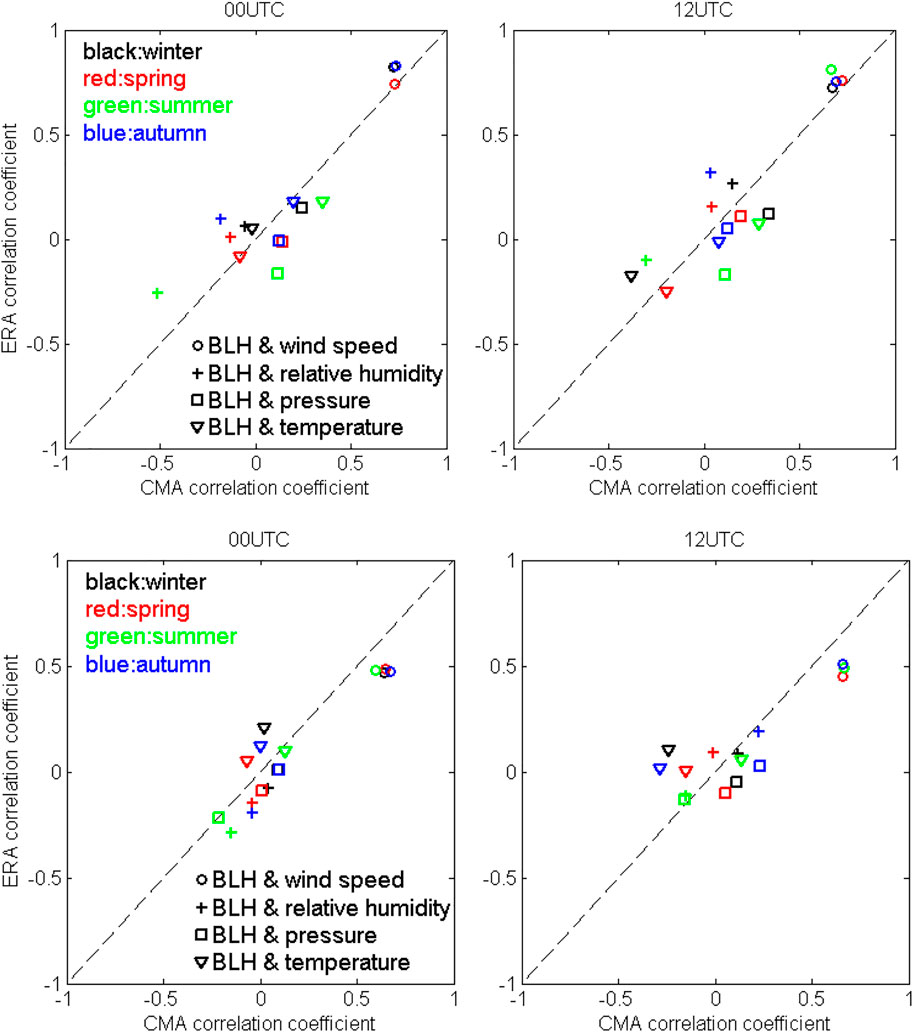
FIGURE 4. Comparison of correlation coefficient between meteorological parameters and BLH calculated from ERA reanalysis data and measurement data, the upper panel is Anqing station and the lower panel is Fuyang station.
Trends of Planetary Boundary Layer Height in Urban Cities of China
The development of the day-time boundary layer height is closely related to solar radiation reaching the surface, so the surface temperature, wind speed, relative humidity, cloud cover and aerosol concentration may be factors that directly or indirectly influence the BLH. A typical daily variation of the BLH showed a maximum at around noon due to the convective activity, whereas low values occurred during nighttime, termed the nocturnal boundary layer. Early mornings and later afternoons were transition periods between a stable boundary layer and convective boundary layer. Therefore, we used the BLH at 14:00 local time when the convective activity is the main factor influencing the BLH.
A statistical analysis of the BLH, temperature, wind speed, relative humidity and cloud cover in 26 cities in eastern China are shown in Table 1. The BLH showed an increasing trend at most of the cities, and especially so in spring and summer. The increasing trend was the highest in the city of Taiyuan, being equal to 11 m/year in spring and 9.4 m/year in summer. The variation of the BLH during the winter season was complex compared with the other seasons, showing an equal number of increasing and decreasing trends between the 26 cities. In every season, there were also cities having a decreasing trend of the BLH. The largest decreasing trend of the BLH was observed in Lanzhou, with a value of -8.6 m/year during the autumn season. It is also worth note that the decreasing trend of the BLH in Lanzhou, significant in summer, autumn and winter seasons, is very likely related to the significant increase of the relative humidity. Using 6.5 years of lidar measurements in Hong Kong, Yang et al. (2013) found a slight decreasing trend of the daily maximum mixing layer height from 2003 to 2009. We could also clearly see that the surface temperature at most of the cities increased during 1980–2015. The increase of temperature in urban cities is a combined effect of urban heat island effect and regional warming (Cao et al., 2016).
Figure 5 shows the spatial variability in the long-term trend of the BLH across eastern China. There are both positive or negative trends, as one can see, but many of the trends are not statistically significant. Based on Table 1, the BLH has higher increasing trends during the spring season than during the other seasons, whereas decreasing trends can be seen for nine stations during the summer seasons and for eight stations during the autumn season. The differences in the values of the BLH between the different seasons are related to differences in meteorological parameters and aerosol concentrations.
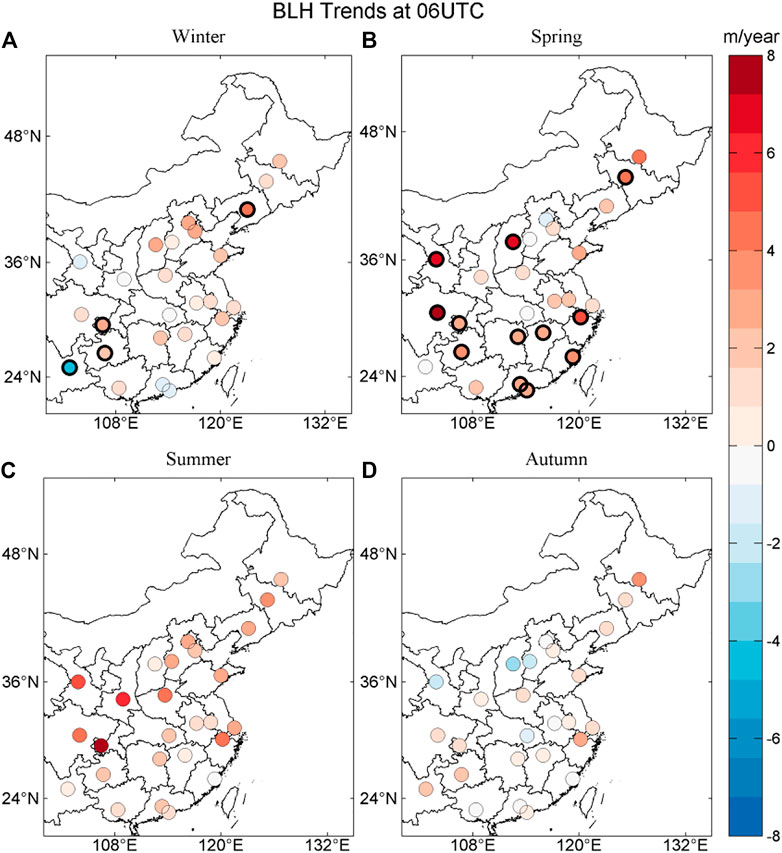
FIGURE 5. Seasonal trends of PBL height during 14:00 BJT from 1980–2018. The thick black circle represents the trend is significant at 95% confidence interval or greater.
Influence of Meteorology
A boundary layer height is closely related to the atmospheric stability, which in turn is driven by the surface temperature, wind speed, relative humidity and aerosol loading (Zhang et al., 2013). Figure 6 depicts the correlation coefficient between the BLH and surface temperate at 14:00 in 26 cities of eastern China. A positive correlation was obtained for most of the stations during the four seasons. In particular, the correlation is significant during the summer season; for example, the correlation between the BLH and surface temperature could as high as 0.6° in North China Plain and eastern China, while being lower at around 0.3°at the stations in the south area. In winter, the correlation between the BLH and surface temperature showed a different pattern, being higher in the south area and having even negative values in the north part of China. From Table 1 we can see that the surface temperature in most of the cities have increased, which is consistent with the fast urbanization and global warming (Cao et al., 2016). Elevated surface temperatures lead to increased sensitive heat flux, and as a result, the boundary layer will develop higher during daytime. In general, higher increases in the surface temperature were associated with larger increases in the boundary layer height in China (Figure 6).
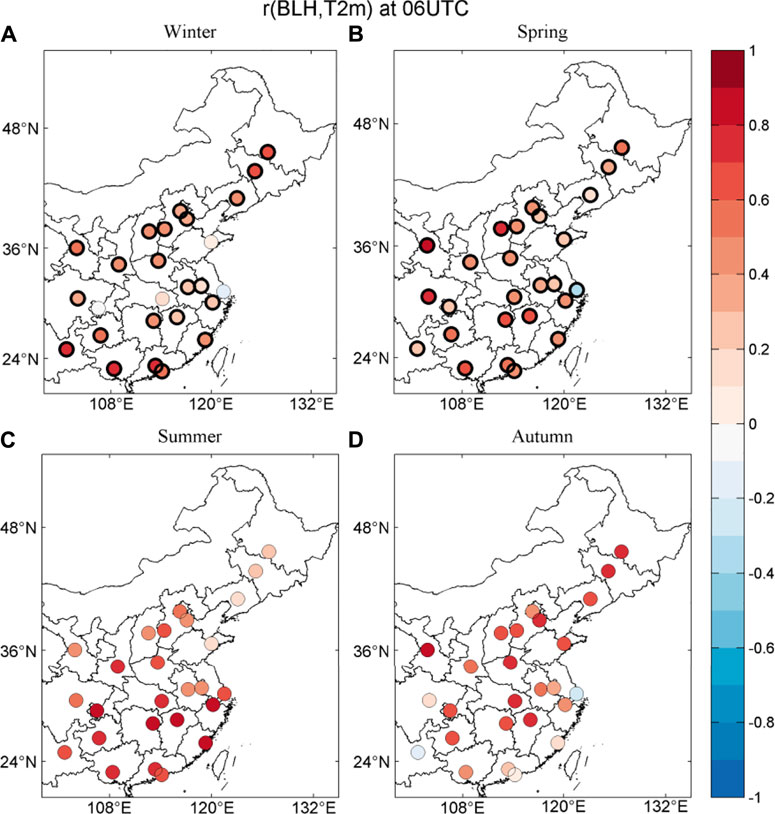
FIGURE 6. Correlations of seasonal 14 BJT BLH and temperature during 1980–2018. Thick black circle represents the trend is significant at 95% confidence interval or greater.
A high surface temperature results in a larger sensible heat flux, which lead to high boundary layer height (Stull, 1988). As presented in Figure 7, the relative humidity shows negative correlation with the BLH in all the urban stations considered here. Figure 8 shows the correlation between the wind speed and BLH, with high values over the north region of China indicating that larger wind speeds favor the development of BLH. However, a negative correlation coefficient was observed in the stations of Guangzhou and HK. A possible explanation for this is that high wind speeds usually correspond to precipitation events in Guangdong Province, as a result of which the development of BLH is suppressed due to lack of upward turbulent kinetic energy (Back and Bretherton, 2005).
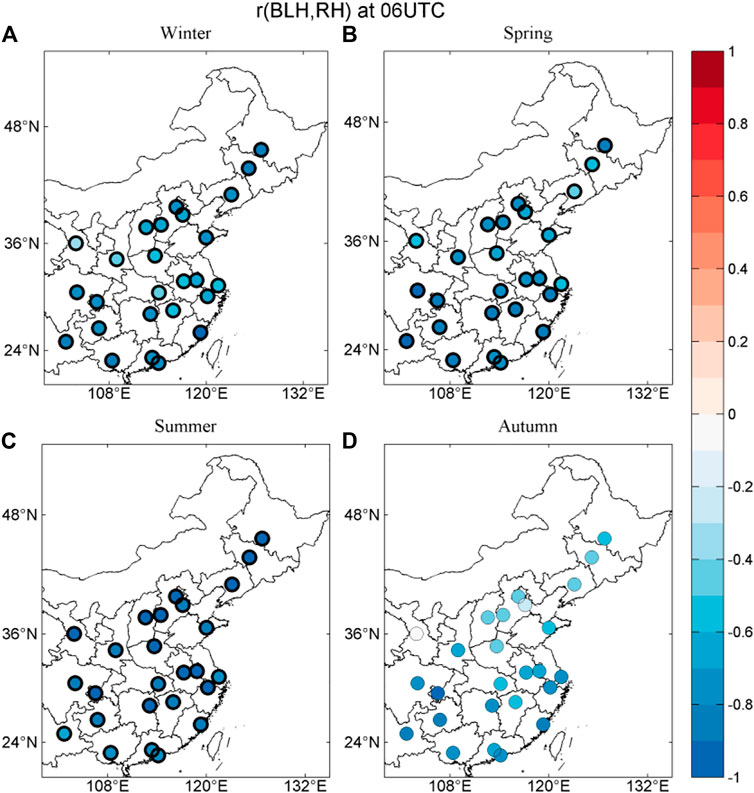
FIGURE 7. Correlations of seasonal 14 BJT BLH and relative humidity during 1980–2018. Thick black circle represents the trend is significant at 95% confidence interval or greater.
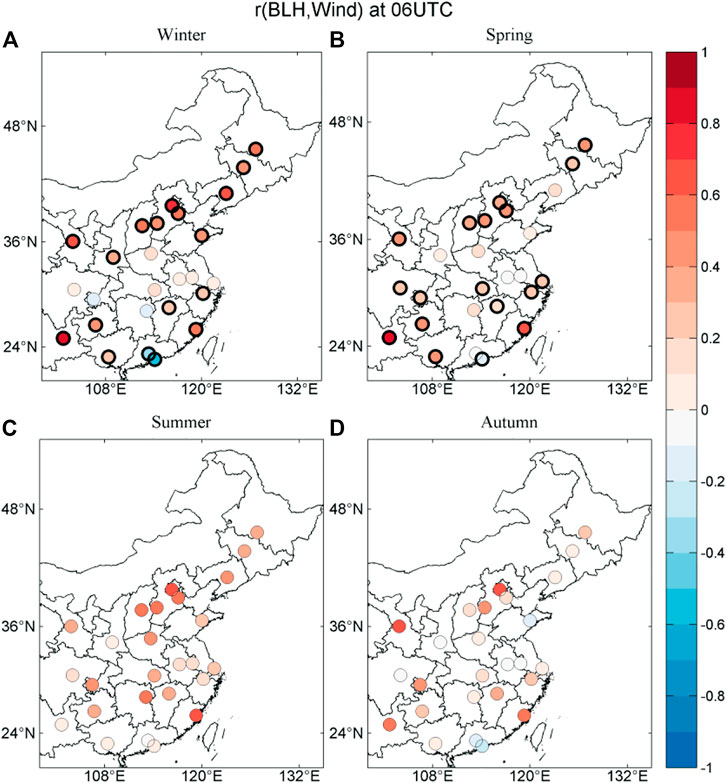
FIGURE 8. Correlations of seasonal 14 BJT BLH and wind speed during 1980–2018. Thick black circle represents the trend is significant at 95% confidence interval or greater.
Aerosol Effect on BLH
Anthropogenic emissions of aerosol particles and their precursors have decreased the atmospheric visibility in China (Che et al., 2007; Wang et al., 2009, Wang et al., 2019). Since aerosol particles also decrease the amount of solar radiation reaching the surface, they might suppress the development of the boundary layer. The degradation of surface visibility could be a good proxy of light extinction due to atmospheric aerosol. We investigated long-term trends of visibility at 14:00 local time. Figure 9 shows the correlation between the BLH and visibility during 1980–2015 in eastern China. In general, the correlation coefficient showed positive values, especially in the north area stations, with a clear variability between the different seasons. In particular, the boundary layer height seemed to be influenced more by aerosol particle during the cold season compared with the warm season. The highest correlation between the boundary layer height with visibility were observed at the stations in North China Plain. This indicates that aerosol pollution may have had a significant influence on the development of boundary layer height in North China Plain (Wang et al., 2020), even though it is also possible that the high correlation is due to aerosols being diluted more efficiently under high boundary layer conditions. The lowest correlations were observed in the south areas of China, suggesting more important role of meteorology parameters in determining the boundary layer height compared with aerosol particles.
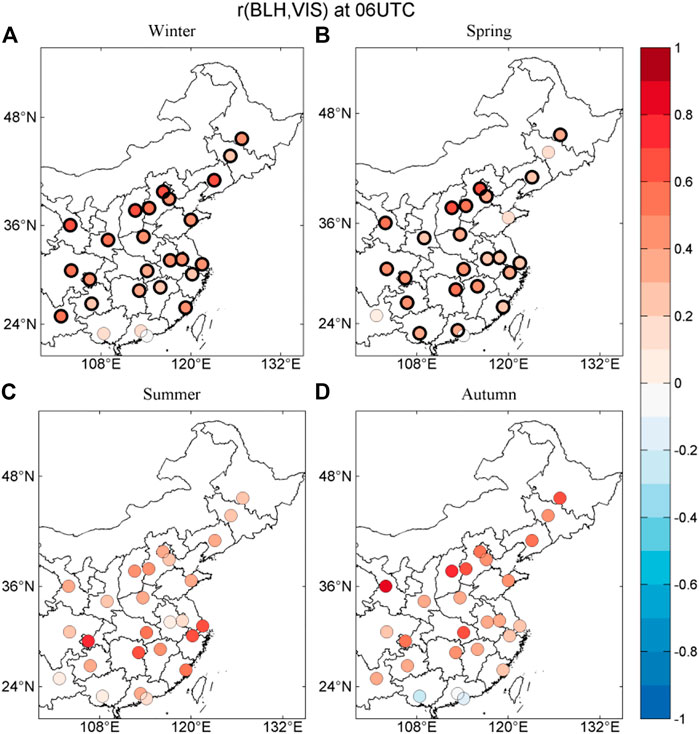
FIGURE 9. Correlations of seasonal 14 BJT BLH and surface visibility during 1980–2018. Thick black circle represents the trend is significant at 95% confidence interval or greater.
Conclusion
In this study, we analyzed long-term trends of the boundary layer height in eastern China during the 1980–2018 period from ERA-reanalysis data, after carefully validating the boundary layer height data from ERA with sounding results. The results showed a slight increasing trends of the boundary layer height in most urban stations of eastern China, especially in the spring season. The correlations of the BLH with the surface temperature, relative humidity, wind speed and visibility were presented and discussed. The results suggest that the increased temperature is the main driving force of the variation in the BLH, while aerosol particles also play important role. Our results revealed an increased trend of daytime boundary layer height under the warming climate, despite an increased loading of atmospheric pollutants.
Data Availability Statement
The raw data supporting the conclusions of this article will be made available by the author, without undue reservation.
Author Contributions
YW initiated the study. YH, YW, PP, GT, TP, VK and MK interpreted the data. YH, YW and VK wrote the article.
Funding
This work was supported by National Key Research and Development Program of China (No. 2016YFA0602001, No. 2016YFC0203302, and No. 2017YFC0209604), the National Natural Science Foundation of China (Grant No.41705014 and 41905013), and Chinese Academy of Sciences (CAS) “Light of West China” Program. The Innovation Development Program of Anhui Meteorology bureau (Grant No. CXM202102), key research and Development Program of Anhui Province (No. 202004b11020012) and Academy of Finland (311932).
Conflict of Interest
The authors declare that the research was conducted in the absence of any commercial or financial relationships that could be construed as a potential conflict of interest.
The reviewer YM declared a shared affiliation, with no collaboration, with one of the authors GT to the handling editor at the time of the review.
Publisher’s Note
All claims expressed in this article are solely those of the authors and do not necessarily represent those of their affiliated organizations, or those of the publisher, the editors, and the reviewers. Any product that may be evaluated in this article, or claim that may be made by its manufacturer, is not guaranteed or endorsed by the publisher.
Acknowledgments
We acknowledge ECMWF for the high quality data.
References
Back, L. E., and Bretherton, C. S. (2005). The Relationship between Wind Speed and Precipitation in the Pacific ITCZ. J. Clim. 18 (20), 4317–4328. doi:10.1175/JCLI3519.1
Bian, J., Chen, H., Vömel, H., Duan, Y., Xuan, Y., and Lü, D. (2010). Intercomparison of Humidity and Temperature Sensors: GTS1, Vaisala RS80, and CFH. Adv. Atmos. Sci. 28, 139–146. doi:10.1007/s00376-010-9170-8
Cao, C., Lee, X., Liu, S., Schultz, N., Xiao, W., Zhang, M., et al. (2016). Urban Heat Islands in China Enhanced by Haze Pollution. Nat. Commun. 7, 12509. doi:10.1038/ncomms12509
Che, H., Zhang, X., Li, Y., Zhou, Z., and Qu, J. J. (2007). Horizontal Visibility Trends in China 1981-2005. Geophys. Res. Lett. 34 (24). doi:10.1029/2007GL031450
Chen, X., Škerlak, B., Rotach, M. W., Añel, J. A., Su, Z., Ma, Y., et al. (2016). Reasons for the Extremely High-Ranging Planetary Boundary Layer over the Western Tibetan Plateau in Winter. J. Atmos. Sci. 73 (5). 2021–2038. doi:10.1175/jas-d-15-0148.1
Dee, D. P., Uppala, S. M., Simmons, A. J., Berrisford, P., Poli, P., Kobayashi, S., et al. (2011). The ERA-Interim Reanalysis: Configuration and Performance of the Data Assimilation System. Q.J.R. Meteorol. Soc. 137 (656), 553–597. doi:10.1002/qj.828
Ding, A. J., Huang, X., Nie, W., Sun, J. N., Kerminen, V. M., Petäjä, T., et al. (2016). Enhanced Haze Pollution by Black Carbon in Megacities in China. Geophys. Res. Lett. 43 (6), 2873–2879. doi:10.1002/2016GL067745
Guo, J., Li, Y., Cohen, J. B., Li, J., Chen, D., Xu, H., et al. (2019). Shift in the Temporal Trend of Boundary Layer Height in China Using Long‐Term (1979-2016) Radiosonde Data. Geophys. Res. Lett. 46 (11), 6080–6089. doi:10.1029/2019GL082666
Guo, J., Miao, Y., Zhang, Y., Liu, H., Li, Z., Zhang, W., et al. (2016). The Climatology of Planetary Boundary Layer Height in China Derived from Radiosonde and Reanalysis Data. Atmos. Chem. Phys. 16 (20), 13309–13319. doi:10.5194/acp-16-13309-2016
Kaser, L., Karl, T., Yuan, B., Mauldin, R. L., Cantrell, C. A., Guenther, A. B., et al. (2015). Chemistry‐turbulence Interactions and Mesoscale Variability Influence the Cleansing Efficiency of the Atmosphere. Geophys. Res. Lett. 42 (24), 810–894. doi:10.1002/2015GL066641
Ma, Y., Ye, J., Xin, J., Zhang, W., Vilà‐Guerau de Arellano, J., Wang, S., et al. (2020). The Stove, Dome, and Umbrella Effects of Atmospheric Aerosol on the Development of the Planetary Boundary Layer in Hazy Regions. Geophys. Res. Lett. 47, e2020GL087373. doi:10.1029/2020GL087373
Petäjä, T., Järvi, L., Kerminen, V.-M., Ding, A. J., Sun, J. N., Nie, W., et al. (2016). Enhanced Air Pollution via Aerosol-Boundary Layer Feedback in China. Sci. Rep. 6, 18998. doi:10.1038/srep18998
Seidel, D. J., Ao, C. O., and Li, K. (2010). Estimating Climatological Planetary Boundary Layer Heights from Radiosonde Observations: Comparison of Methods and Uncertainty Analysis. J. Geophys. Res. 115 (16), 1–15. doi:10.1029/2009JD013680
Stull, R. B. (1988). An Introduction to Boundary Layer Meteorology. Dordrecht: Kluwer Academic Publishers.
Sun, Y., Song, T., Tang, G., and Wang, Y. (2013). The Vertical Distribution of PM2.5 and Boundary-Layer Structure during Summer Haze in Beijing. Atmos. Environ. 74, 413–421. doi:10.1016/j.atmosenv.2013.03.011
Tang, G., Zhang, J., Zhu, X., Song, T., Münkel, C., Hu, B., et al. (2016). Mixing Layer Height and its Implications for Air Pollution over Beijing, China. Atmos. Chem. Phys. 16, 2459–2475. doi:10.5194/acp-16-2459-2016
Vogelezang, D. H. P., and Holtslag, A. A. M. (1996). Evaluation and Model Impacts of Alternative Boundary-Layer Height Formulations. Boundary-layer Meteorol. 81 (3–4), 245–269. doi:10.1007/BF02430331
Wang, K., Dickinson, R. E., and Liang, S. (2009). Clear Sky Visibility Has Decreased over Land Globally from 1973 to 2007. Science 323 (5920), 1468–1470. doi:10.1126/science.1167549
Wang, Y. H., Liu, Z. R., Zhang, J. K., Hu, B., Ji, D. S., Yu, Y. C., et al. (2015). Aerosol Physicochemical Properties and Implications for Visibility during an Intense Haze Episode during winter in Beijing. Atmos. Chem. Phys. 15, 3205–3215. doi:10.5194/acp-15-3205-2015
Wang, Y., Wang, Y., Wang, L., Petäjä, T., Zha, Q., Gong, C., et al. (2019). Increased Inorganic Aerosol Fraction Contributes to Air Pollution and Haze in China. Atmos. Chem. Phys. 19, 5881–5888. doi:10.5194/acp-19-5881-2019
Wang, Y., Yu, M., Wang, Y., Tang, G., Song, T., Zhou, P., et al. (2020). Rapid Formation of Intense Haze Episodes via Aerosol-Boundary Layer Feedback in Beijing. Atmos. Chem. Phys. 20 (1), 45–53. doi:10.5194/acp-20-45-2020
Wang, Z., Cao, X., Zhang, L., Notholt, J., Zhou, B., Liu, R., et al. (2012). Lidar Measurement of Planetary Boundary Layer Height and Comparison with Microwave Profiling Radiometer Observation. Atmos. Meas. Tech. 5 (8), 1965–1972. doi:10.5194/amt-5-1965-2012
Xian, T., Li, Z., and Wei, J. (2021). Changes in Air Pollution Following the COVID-19 Epidemic in Northern China: The Role of Meteorology. Front. Environ. Sci., 9. doi:10.3389/fenvs.2021.654651
Yang, D., Li, C., Lau, A. K.-H., and Li, Y. (2013). Long-term Measurement of Daytime Atmospheric Mixing Layer Height over Hong Kong. J. Geophys. Res. Atmos. 118 (5), 2422–2433. doi:10.1002/jgrd.50251
Zhang, W., Guo, J., Miao, Y., Liu, H., Zhang, Y., Li, Z., et al. (2016). Planetary Boundary Layer Height from CALIOP Compared to Radiosonde over China. Atmos. Chem. Phys. 16 (15), 9951–9963. doi:10.5194/acp-16-9951-2016
Keywords: boundary layer height, aerosol, visibility, trend, meteorology parameter
Citation: Huo Y, Wang Y, Paasonen P, Liu Q, Tang G, Ma Y, Petaja T, Kerminen V-M and Kulmala M (2021) Trends of Planetary Boundary Layer Height Over Urban Cities of China From 1980–2018. Front. Environ. Sci. 9:744255. doi: 10.3389/fenvs.2021.744255
Received: 20 July 2021; Accepted: 01 September 2021;
Published: 16 September 2021.
Edited by:
Rui Mao, Beijing Normal University, ChinaReviewed by:
Yongjing Ma, Institute of Atmospheric Physics (CAS), ChinaXiaoyan Wang, Fudan University, China
Miao Yu, Chinese Academy of Meteorological Sciences, China
Copyright © 2021 Huo, Wang, Paasonen, Liu, Tang, Ma, Petaja, Kerminen and Kulmala. This is an open-access article distributed under the terms of the Creative Commons Attribution License (CC BY). The use, distribution or reproduction in other forums is permitted, provided the original author(s) and the copyright owner(s) are credited and that the original publication in this journal is cited, in accordance with accepted academic practice. No use, distribution or reproduction is permitted which does not comply with these terms.
*Correspondence: Yonghong Wang, eW9uZ2hvbmd3YW5nQHJjZWVzLmFjLmNu