Estimating the Societal Benefits of Satellite Instruments: Application to a Break-even Analysis of the GeoXO Hyperspectral IR Sounder
 Christopher Lauer
 Joseph Conran
 Jeffery Adkins2†
- 1Performance Risk and Social Science Office, Office of the Chief Financial Officer, National Oceanic and Atmospheric Administration, Silver Spring, MD, United States
- 2Integrated Systems Solutions, Inc., Silver Spring, MD, United States
This paper describes the process, and lessons learned in a preliminary benefits study of a proposed infrared hyperspectral sounder (HSS) for NOAA’s next generation geostationary satellite program (GeoXO). The valuation of government-owned satellite systems providing a public good with a complex array of instruments is a nascent field of study. Many different sensor configurations are possible, but there are restrictions due to physical and budget constraints. Accounting for economic considerations during the design and planning phase for satellite constellations helps to ensure that the most cost effective instruments are selected. To assess whether the HSS instrument should be included on GeoXO, we applied a value of information approach and found the benefits associated with this instrument are likely to substantially outweigh the costs. Value of information studies often focus on data and information that has a direct use case. Estimating benefits for the HSS is especially challenging because data are not used directly by decision makers. Instead these data along with information from other Earth observing (EO) satellites play a key role in producing the inputs necessary for modern numerical hydrometeorological modeling. We describe strategies to assess the marginal (i.e., incremental) contribution of an instrument that is part of a complex information production process. We make several recommendations that, if implemented, would improve the quality of future studies of this kind. This includes (1) a systems approach to observing system planning, (2) improving the design of observing system experiments (OSSE and OSE), and (3) better tracking of the decisions and needs of end-users, especially those external to the agency.
Introduction
Producing accurate and timely weather, water, and climate forecasts requires an array of observing infrastructure, advanced modeling capabilities, extensive computing power, and effective communication strategies. The National Oceanic and Atmospheric Administration (NOAA) is a leading government agency responsible for providing these services to US citizens.
Many NOAA products and services rely on data from geostationary, low-Earth orbiting, and third-party satellites (Helms et al., 2016). NOAA’s current generation of Geostationary Operational Environmental Satellites is known as the GOES-R series. These satellites operate from a fixed position in the sky allowing continuous monitoring of the same location. The agency is developing a new generation of geostationary satellites (GeoXO) as a follow-on, with initial launch expected in the early 2030s and a life cycle of 20 years. The current GOES-R series includes the following sensors: Advanced Baseline Imager (ABI), Geostationary Lightning Mapper (GLM) and a suite of instruments for monitoring space weather and solar radiation. In addition to an enhanced ABI and GLM (NASA 2019), additional instruments are being considered for the GeoXO program. Alongside atmospheric composition and ocean color instruments, the Hyperspectral Infrared Sounder (HSS) will be a significant new investment for the constellation. This paper describes the initial valuation of the HSS instrument for GeoXO. We describe the assessment process and our findings; we also describe challenges, lessons learned, and recommendations for improving future studies.
In a geostationary orbit, the proposed HSS is expected to provide low-latency profiles of atmospheric wind, water vapor, and temperature to enhance situational awareness for operational meteorologists, and provide better data especially for numerical weather and water prediction models. Data from this sensor would detect and differentiate various atmospheric particles and validate land and sea surface temperatures (Menzel et al., 2018; NOAA NESDIS 2020). A similar instrument was considered for the GOES-R program but was not included in the final sensor configuration due to cost considerations and the technical limitations of the earlier instrument (Powner, 2009).
The data collected by satellites have economic value because they are used to improve or create new products that are, in turn, used to improve societal outcomes (e.g., reducing costs and increasing productivity). Thus, societal needs should play a central role in planning a suite of sensors for a new satellite. This is extraordinarily challenging because satellite data have few direct uses. Instead, they are used, often in combination with a wide range of data from satellites and other sources, in products whose use by businesses, government agencies, researchers, and individuals leads to improved societal outcomes. NOAA scientists with the greatest expertise in the capabilities of instruments and the use of data in NOAA products tend to know less about the decisions that are being influenced through the use of these products. Conversely, those who know the most about the use of NOAA products and the needs of users have less expertise in the capabilities of satellite instruments. The problem is further complicated by the fact that satellite constellations like GOES-R and GeoXO produce many discrete streams of data, each of which provides utility to multiple NOAA products, each with multiple users and uses, constituting separate pathways by which the satellites provide value to society.
As a consequence, the planning process for satellites as it currently operates tends to focus on the needs of those within NOAA who use sensor data to generate products. There are several important factors to consider in addressing this: First is the role of evolving technology. Models of hydrometeorological phenomena are continually improved. The reduced cost of computing power allows more data to be assimilated into these models and processed. Improved technology makes the private provision of environmental data possible. Second, planners must consider continuity; current models rely on certain data inputs, and maintaining the output of data over decades is a top requirement. Third, planners must also consider how different sensors can be complements or substitutes to one another. A new sensor could make certain observations redundant; alternatively, it could increase the usefulness of other observations. Finally, planning must consider the needs of external stakeholders, such as international partners, who will use the data in their own modeling efforts.
For this assessment we conducted a break-even analysis focusing on whether the potential benefits of the HSS are likely to exceed the expected costs. We did not consider alternative means for improving the production and transmission of weather information. Weather information has a wide range of impacts. While a comprehensive assessment of benefits would consider the contribution of the HSS to weather forecasting capabilities as well as other product outputs, quantifying every potential benefit is intractable. Instead we reviewed observing system experiments, worked with subject matter experts, and used value chain mapping to identify likely impacts. We selected three case studies to pursue, based on data availability and the potential to identify large benefits. Each of the three case studies identify the nature and magnitude of benefits needed to independently offset the cost of the instrument; i.e., estimating the value of each benefit needed to justify the instrument if no other benefits resulted from its use. Further studies must consider alternative improvements to be certain that the HSS instrument is the most cost effective choice.
The remainder of the paper is organized as follows: We describe the logic model and methods we use to connect this instrument to societal benefits. Next we describe the results of our initial break-even analysis. Finally, we provide several actionable recommendations that will increase the effectiveness of economic analysis for use in observing infrastructure planning and improve the quality of future studies on the value of Earth observing (EO) satellites.
Methods
Value of Information Framework
We use a microeconomic approach to establish a framework for the value of information, an approach described in detail in several studies (Macauley 2005; Pearlman et al., 2016; Bernknopf et al., 2018; Abt Associates 2018; Pearlman et al., 2019). The premise of this framework is that data have value when they are used in decision-making. Otherwise, the economic value of such information is effectively zero (Williamson et al., 2002). Assessing the value of information requires understanding the following elements of the decision-making process: what decisions are being influenced by the information, who is making those decisions, what outcomes are being improved, and to what degree are they improved? The value of new information is determined by comparing the outcomes that result from decisions that are made with and without the new information. In this case, we compare the outcomes associated with the use of different forecast products, produced with and without the use of expected data generated by the proposed sounder in a geostationary orbit.
The Value Chain Approach
The raw satellite output is in a format unusable by decision-makers. These data must be assimilated into a complex information production process, which relies on other data, physical models, high performance computing, interpretation by trained experts, and communication with decision makers. To ensure that the economic analysis reflects an accurate understanding of the capabilities of the instrument, the improvements to final products, and the needs of users, this information is organized in formal structures called value chains. A value chain is a type of logic model describing the full range of activities needed to produce a final product or service and the use of that product or service to improve societal outcomes. In NOAA, value chain mapping has been applied to study other observing assets which involve complex information production processes such as NOAA’s fleet of marine research vessels (Abt Associates 2018).
The following value chain (Figure 1) describes a simplified process of turning data from the HSS instrument into actionable information and the use of that information to improve societal outcomes. Adding a HSS to future GeoXO satellites is expected to provide better information about the state of the atmosphere. This data will be combined with other environmental data in numerical weather models and analyzed to produce forecasts and other information products, which are ultimately shared to inform decision makers (NOAA NESDIS 2020). Establishing the value chain linkages ensures we measure improvements that are associated with data from the new instrument. Understanding the different mechanisms that can lead to weather forecast improvements and reduce damage is an important part of analyzing the trade-offs and opportunity costs associated with the instrument considered.
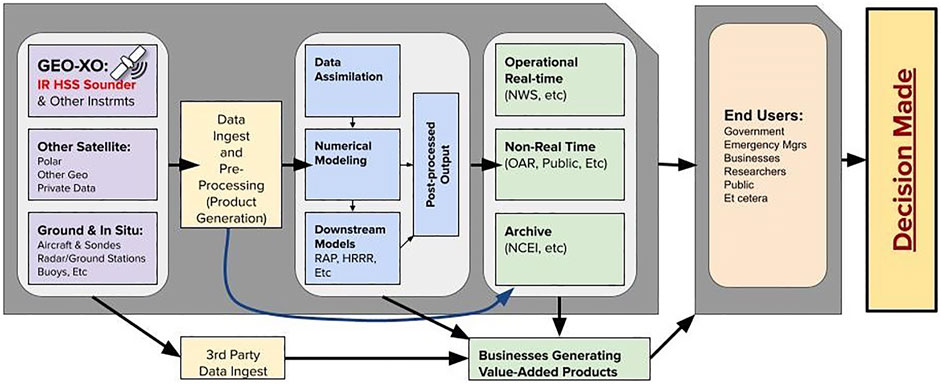
FIGURE 1. NOAA value chain depiction.
Value Chain Mapping
We used an agency-wide operational, value chain catalog named NOAA Observing System Integrated Analysis (NOSIA) to identify NOAA products and services that rely on, or have the potential to be improved by, sounding data. The NOSIA database contains information on the use of data from all operational NOAA platforms and instruments and the individual NOAA products that rely on each source of data (Helms et al., 2016). We retrieved information about the relative importance of IR sounding data and the products these data support.
The analysis showed that the HSS is highly relevant to National Weather Service products, especially those focused on coupled and Earth systems modeling such as the Climate Forecast System Reanalysis or Global Ensemble Forecast System. Climate Predictions and Projections, Environmental Modeling and Prediction, Integrated Water and Prediction Information, the Fire Weather National Service Program, and Marine Weather and Coastal Events products are also heavily reliant on IR sounder data. The results of this analysis corroborated the areas of potential benefits identified by program scientists in observing system experiments, which are described in the next section. Additionally, other areas of potential benefits were identified including aviation and volcanic ash advisories, marine and coastal weather, severe weather nowcasting, and marine transportation.
Observing System Experiments
A critical step in estimating the benefits of an observing system is to understand and measure the improvements that the new data will bring to the products that rely on those data. The three case studies described below focus on the improvements to various types of weather forecasts resulting from the use of HSS data. Observing system experiments (OSEs) and observing system simulation experiments (OSSEs) are important tools for quantifying the anticipated effects of new and improved data on the products that use those data.
OSEs and OSSEs test the use of existing data (OSE), or use simulated data (OSSE) in numerical weather models to evaluate a notional observing capability. Model runs are compared to current capabilities to assess the marginal (i.e., incremental) contribution of new observational data. Typically, operational forecasting models are used for these experiments (Masutani et al., 2010). OSSE experiments conducted for the HSS instrument found that numerical model performance improved at the regional (e.g., Aune et al., 2000; Wang et al., 2013; Jones et al., 2017; Li et al., 2018), and global (Boukabara et al., 2016; Bormann et al., 2019; McCarty et al., 2020) scales. Other studies found that data from the instrument improved hurricane track and intensity forecasts (Schmit et al., 2009; Liu and Li, 2010; Zheng et al., 2015; Lee et al., 2017; Wang et al., 2017) and severe storm prediction (Li et al., 2011; Iturbide-Sanchez et al., 2018; Gensini et al., 2020; Wang et al., 2020) (See NOAA NESDIS (2020) for a more complete description of the OSE/OSSE process and a detailed description of these findings). These studies gave us a starting point for identifying outcomes that could be affected by the provision of sounding data and the potential magnitude of improvements.
Expert Elicitation
Another important component of the economic analysis is to understand the decision-making context for end users. To this end, we engaged in outreach to experts, including NOAA service providers and external users, in areas likely to be impacted by data from the HSS instrument; several common themes emerged. Those who apply weather information in a decision making context may not have a clear understanding of how IR sounding data contributes to and improves the products and services they use. When a description of improvements was provided the experts displayed optimism, but cautioned that model improvements stemming from sounder data would take time to be implemented. Constraints like data assimilation challenges and staff training that limit the full use of existing data will also limit the use of geostationary HSS data. Furthermore, some of the OSE/OSSE results from surveys of the existing literature did not align with the timing or process for making weather forecasts and emergency planning decisions. In these cases, experts suggested that accurate forecasts contribute to trust and improved working relationships even when they come too late to influence decisions. However it is difficult to quantify the value of information that does not directly contribute to user decisions. OSE/OSSE designed with the end decision context in mind will make it easier to make a direct link to the marginal changes that result from new data.
Results
Costs
This analysis is based on preliminary cost estimates provided by the GeoXO program. Due to the preliminary nature of this information, it is not available for public release. The cost estimates have been updated since this analysis was performed, and will continue to be refined as the planning and design of GeoXO progresses, in response to a variety of engineering and technical considerations. The estimate we were provided did not include ground costs, operations, maintenance, and spacecraft accommodation, which will add another 20 to 60 percent to the costs analyzed here (NOAA NESDIS 2020). Over the lifecycle of the satellite, costs are higher during the construction and launch and lower during the operation phase; the majority of costs will be incurred between 2023 and 2040. We followed the guidance in The Office of Management and Budget’s circular A-4 (2003) and applied discount rates of 3 and 7 percent to the costs incurred in each year between 2023 and 2040 to compute present value costs. These figures are used in the break-even analysis described below, determining the magnitude of future benefits needed to offset costs. The cost estimates we use for this analysis provide reasonable initial estimates, adequate for determining whether further consideration of this instrument is warranted. However the findings in this paper will be refined based on the final instrument specifications and cost schedule.
Benefits
Based on the availability of published OSSE studies, and confirmed by value chain mapping and expert elicitations, three broad benefit categories were identified for further study:
• Improvements to Severe Weather Forecasts
• Improvements to Weather Forecast Skill1
• Improving Predicted Hurricane Track and Intensity Accuracy.
In order to estimate the potential value of these broad improvements we focused on a narrow subset of specific decision scenarios. The selection of these scenarios was based on a review of a previous study on the value and application of geostationary sounding data (NOAA 2002; Centrec Consulting Group LLC, 2007). We also considered the availability of existing data, the input of subject matter experts, and the judgment of the valuation working group.
• Scenario 1: Reductions in weather-related airline delay costs resulting from improvements to severe weather forecasts
• Scenario 2: Reductions in electric power generation and acquisition costs resulting from improvements to weather forecasting skill
• Scenario 3: Reductions in hurricane evacuation costs resulting from improved predicted hurricane track and intensity
In these scenarios, benefits resulted from avoided costs which will occur over the satellite’s operational period. For each case, we determine the nature and magnitude of benefits that would be required to independently justify the HSS. We describe the nature of forecast improvements, the mechanisms by which forecast improvements advance societal outcomes, and the specific HSS data that lead to those forecast improvements. To determine the magnitude of benefits required, we calculate the stream of benefits that would need to occur over the operational life of the satellite to match the present value for the cost described in the previous section; this varies with the discount rate. For all of the scenarios in our analysis, we assume that benefits will begin immediately upon the satellite being operational and continue through the end of the GeoXO series lifecycle. We assume that the benefits of improved weather information for each of the scenarios we explore will be constant and proportional to the number of operational instruments at any given time over the period of analysis; since the current satellites in geostationary orbit do not carry the HSS instrument, we assume that only partial benefits will be realized until both the East and West sensors are deployed. For each of our three scenarios we determined the proportion of weather related costs that would need to be mitigated in each year to match this benefit stream. Results are not adjusted to account for future changes in population, technology, economic growth, or the value of damageable property. A short summary of the data and logic models applied in the break-even analysis is provided below; a comprehensive overview and additional sensitivity analysis can be found in NOAA NESDIS (2020).
Findings
Scenario 1–Aviation Weather
Severe weather is the leading cause of delayed flights and the FAA estimates the annual cost of weather related delays was $18.9 billion annually in 2018, with costs steadily increasing with increased volumes of air travel (FAA 2020). While many of these costs are unavoidable, marginal improvements can allow air traffic to continue longer before a storm and resume more quickly after a storm passes. Although the degree of improvement has not yet been determined, the savings associated with reducing these delays by 0.2 to 0.5 percent are equal to the cost of the instrument (corresponding to 3 percent and 7 percent discount rates, respectively). OSSEs for severe storms tend to focus on individual events (Li et al., 2011; Iturbide-Sanchez et al., 2018; Gensini et al., 2020; Wang et al., 2020) making direct comparisons difficult. However discussions with experts in the industry suggest that this magnitude of improvement is achievable, and has been realized in similar cases.
Scenario 2–Electricity Demand Forecasting
Electric power producers use short term demand forecasting models, which rely heavily on 3–24 hour forecasts of temperature, wind, and humidity to plan electricity production; errors in electricity demand forecasts can increase costs for electric utilities (Hong 2014; Hong and Kim 2015; PJM 2016). A large portion of the error in forecasting energy demand is the result of error in weather forecasts. To estimate the cost of electricity demand forecast errors we use data from the US Energy Information Administration (US EIA 2020a; US EIA 2020b) to determine the total volume of electricity sold in the US. We use a study by PJM (2016), a company which coordinates the movement of wholesale electricity, to estimate the average demand forecasting error. We use the average monthly wholesale prices for electricity provided by EIA to estimate the cost of this error. Finally, we determine the proportion of the demand forecasting error that can be attributed to weather variables (Centrec Consulting Group LLC, 2007). We find that a 6–10 percent improvement in the prediction accuracy for weather variables used in electricity demand models (corresponding to 3 percent and 7 percent discount rates, respectively) over the period the sounder is operational would offset the cost of this instrument. OSSEs conducted to examine the effect of HSS data on the regional numerical weather prediction models suggest that improvements of this magnitude are possible for the relevant forecast parameters. Experiments showed a range of improvements between 4 and 33 percent for prediction of temperature, winds, and humidity from baseline scenarios (Aune et al., 2000; Wang et al., 2013; Jones et al., 2017; Li et al., 2018). This analysis relies on several important assumptions: (1) we assume that the load forecasting error is equally probable to over or underestimate the true energy demand and that the consequences of errors in either direction are equally costly. (2) We use an average price, but the wholesale prices in our data set can fluctuate substantially even over relatively short time periods. (3) Most electricity demand forecasting models used by energy companies are not available to the public. Our assumptions about the total demand forecast error and the portion that can be attributed to weather are based on a very limited number of studies. While it was clear that demand models rely heavily on weather forecast inputs, this reliance could vary based on a number of factors, and could change over the period of analysis. To address these issues, we conducted sensitivity analysis based on the extreme values in our data sets, and found a range for improvement in prediction accuracy necessary to offset the sounder cost of 3–21 percent for a 3 percent discount rate, and 5–30 percent for a 7 percent discount rate. Improvements at the upper end of these ranges are very unlikely based on the OSSE studies we reviewed.
Scenario 3–Hurricane Evacuations
Many hurricane costs are unavoidable, however improved forecasts could limit unnecessary evacuations (Reigner 2008). We use evacuation cost figures from a study by Whitehead (2003) to estimate that, if the warning and evacuation area can be reduced by one county, average savings could be $90 million/event (2020 USD). Given an average of almost 18 hurricane/tropical storm landfalls per decade (Blake and Gibney, 2011) this represents a substantial potential savings. However, this benefit alone does not offset the cost of the sounder. It is also less certain whether this magnitude of improvement is achievable for every event. As in the severe storms case, OSSEs for hurricanes tended to focus on track and intensity for individual events (Schmit et al., 2009; Liu and Li, 2010; Zheng et al., 2015; Lee et al., 2017; Wang et al., 2017); it is not clear whether the results of these studies can be generalized to all tropical cyclones. In our discussions with experts versed in issues surrounding hurricane preparation, we learned that evacuation decisions need to be made well in advance of the oncoming storm, especially for large population centers, so the most relevant portion of the improvements is on the longer time scales (48–96 hour). Furthermore, our discussion with experts revealed that emergency managers rely heavily upon storm surge modeling to inform evacuation decisions (Glahn et al., 2009). Models such as the Sea, Lake, and Overland Surges from Hurricanes (SLOSH) are expected to use data from numerical models supported by the proposed HSS but the magnitude of reliance on this data has not been established by OSSEs.
Actionable Recommendations
This work examines HSS-linked improvements in weather forecasts with the potential to reduce weather-related losses in three scenarios. We show that improvements in forecast quality that lead to relatively minor reductions in weather-related losses are sufficient to offset the cost of HSS. Several important lessons from the current effort should be incorporated into ongoing and future studies of satellite-based sensors:
1. Data provided by sensors is part of a complex information production process. Isolating the marginal contribution of an individual stream of data is challenging. Benefits associated with individual sensors often depend on improvements to other parts of the value chain, such as better data ingest, improved models, faster computers, or more effective communication. The needs of end users should be the primary factor in determining future investments in observing systems. It may be possible to address these needs at one or more points in the value chain. The use of a systems approach will help to account for the addition of new instruments to a complex, dynamic system for several reasons:
• First, the effects of adding a new instrument could ripple across the entire system or could be constrained by limitations in other parts of the system.
• Second, the system itself is continuously changing. Other instruments will be added to other new satellites. Models are in a state of continuous refinement, as are central and local data transmission and management capabilities. Changes to the system could eliminate the need for data from the new instrument or amplify its beneficial effects.
• Third, even when the addition of a new instrument can be shown to generate benefits in excess of costs, other less costly changes could produce similar benefits resulting in greater net benefits.
Many experts recognize the need for this systems approach to valuation (see Helms et al., 2016; Moigne et al., 2017; NOAA 2018; Anthes et al., 2019). Agencies that deploy Earth observing (EO) infrastructure should focus their effort on developing and improving system-focused models to optimize its investments in future satellite constellations.
2. Improving the connection between OSSE experiments and the needs of decision makers would increase the utility of OSSE results as input for economic analysis and valuation studies. According to Sec 107 of Public Law No: 115–25 Weather Research and Forecasting Innovation Act of 2017, OSSE experiments must be conducted “to assess the value and benefits of observing capabilities and systems” (italics added) for any system with a lifecycle cost of more than $500M. To meet this mandate, OSSEs should be designed from the start in collaboration with social scientists to focus on scenarios with strong implications for decision-making and societal benefits. This will help ensure that we make the most of these experiments, which are very expensive to run, requiring highly trained experts, and high performance computing. User needs are the foundation of economic valuation and should be the foundation for observing system planning. Understanding users and their decisions helps identify which forecast improvements are the most valuable. We are not aware of any case where an OSE/OSSE was specifically designed to address how the information that results from new sensors is used in a decision making process. Additionally, OSE/OSSEs should, to the maximum extent possible, be framed to anticipate the NWP modeling infrastructure to be available at the time of deployment. This framing will help ensure that OSSE/OSE studies will be aligned with improvements that create measurable value and facilitate more effective valuation studies. Finally, close collaboration between physical and social scientists will help ensure that the appropriate caveats regarding the limitations inherent in using simulated physical data are included for analysis that relies on OSSE results.
3. The long, complex value chain associated with Earth observations (EO) often prevents producers of EO from understanding how these data are applied and used. Many of the people who understand how EO data is applied in a decision making context are not within agencies that produce this data. End users may find that different components of the forecast or other products are more important in some applications than others. They may also have thresholds where small improvements in a particular dimension of the forecast or other output can lead to significant improvements in decision making and the resulting outcomes. In other cases, large improvements to the forecast may have minimal influence on the outcomes.
Additionally, future studies should investigate and account for the period of time required to realize the full benefits of a sensor. One important assumption that underlies this analysis is that benefits will begin as soon as the instrument is deployed, and that benefits will be equally distributed over the time period. This assumes that there will be no period of learning to use, assimilate, and interpret new data. Conversely, we limit the scope of our economic analysis to known or anticipated beneficial uses of data. Once data begins to be used, unanticipated and highly beneficial applications are often discovered (e.g., O’Connor et al., 2019).
The ability to address the issues above would be enhanced if information about external users of an agency’s products and services was systematically collected. This would help scientists studying sensors, building models, and communicating information to understand the decision making context from which the benefits of their work arises.
Conclusion
Using a VOI framework applied to three specific scenarios, we showed that the improvements to weather forecasts expected to result from the HSS instrument have the potential to generate value that exceeds the initial cost estimates for the instrument. When the breadth of the potential applications are considered, it is likely the HSS will generate benefits that substantially outweigh the cost. However, we identified several limitations that should be addressed to improve the quality of future studies of EO systems and sensors, including taking a systems approach, accounting for societal benefits in the design of OSEs/OSSEs, and a more comprehensive understanding of external decision makers.
Data Availability Statement
The original contributions presented in the study are included in the article/supplementary material, further inquiries can be directed to the corresponding author.
Author Contributions
All authors listed have made a substantial, direct, and intellectual contribution to the work and approved it for publication.
Conflict of Interest
Author JA was employed by the company Integrated Systems Solutions, Inc.
The remaining authors declare that the research was conducted in the absence of any commercial or financial relationships that could be construed as a potential conflict of interest.
Publisher’s Note
All claims expressed in this article are solely those of the authors and do not necessarily represent those of their affiliated organizations, or those of the publisher, the editors and the reviewers. Any product that may be evaluated in this article, or claim that may be made by its manufacturer, is not guaranteed or endorsed by the publisher.
Acknowledgments
Thank you to the members of the 2020 NOAA GeoXO HSS assessment team for sharing your extensive insights and knowledge especially Monica Coakley, Ed Gribsby, Tim Schmit, Patricia Weir, Dimitrious Vassiliadis, Phillip Ardanuy, James Yoe, Frank Alsheimer, Jordan Gerth, Daniel Lindsey, and Joel McCorkel. This manuscript was strengthened by comments provided by Monica Grasso, Jeffrey Wielgus, Michael Smith, Tadesse Wodajo, and Jennifer Zhuang, and two reviewers. Any errors or oversights are the sole responsibility of the authors.
Footnotes
1The average accuracy of the forecasts in the sample relative to the accuracy of forecasts produced by a reference method. NOAA Climate Prediction Center.
References
Abt Associates Inc. and Corona Environmental Consulting (2018). NOAA Fleet Societal Benefit Study, Final Report. Silver Spring, MD: NOAA Office of Marine & Aviation Operations.
Anthes, R. A., Maier, M. W., Ackerman, S., Atlas, R., Callahan, L. W., Dittberner, G., et al. (2019). Developing Priority Observational Requirements from Space Using Multi-Attribute Utility Theory. Bull. Am. Meteorol. Soc. 100 (9), 1753–1774. doi:10.1175/bams-d-18-0180.1
Aune, Bob., Thom, Jonathan., Bayler, Gail., and AllenHuang, Paolo. Antonelli. (2000). “Preliminary Findings from the Geostationary Interferometer Observing System Simulation Experiments (OSSE).,”. (NOAA Technical Report).
Bernknopf, R., Brookshire, D., Kuwayama, Y., Macauley, M., Rodell, M., Thompson, A., et al. (2018). The Case of GRACE-Enhanced Drought Severity Index. Weather Clim. Soc. 10 (1), 187–203. doi:10.1175/WCAS-D-16-0044.1
Blake, Eric., and Gibney, Ethan. (2011). “The Deadliest, Costliest, and Most Intense United States Tropical Cyclones from 1851 to 2010 (And Other Frequently Requested hurricane Facts),”. NOAA Technical Memorandum NWS NHC-6. Available at: https://www.nhc.noaa.gov/pdf/nws-nhc-6.pdf.
Bormann, N., Lawrence, H., and Farnan, J. (2019). Global Observing System Experiments in the ECMWF Assimilation System. England: ECMWF Technical Memorandum, 839. doi:10.21957/sr184iyz
Boukabara, S.-A., Moradi, I., Atlas, R., Casey, S. P. F., Cucurull, L., Hoffman, R. N., et al. (2016). Community Global Observing System Simulation Experiment (OSSE) Package (CGOP): Description and Usage. J. Atmos. Oceanic Technol. 33, 1759–1777. doi:10.1175/JTECH-D-16-0012.1
Centrec Consulting Group LLC (2007). “An Investigation of the Economic and Social Value of Selected NOAA Data and Products for Geostationary Operational Environmental Satellites (GOES),”. A Report to NOAA’s National Climate Data Center.
Federal Aviation Administration (2020). Air Traffic by the Numbers 2020. Available at: https://www.faa.gov/air_traffic/by_the_numbers/media/Air_Traffic_by_the_Numbers_2020.pdf.
Gensini, V. A., Barrett, B. S., Allen, J. T., Gold, D., and Sirvatka, P. (2020). The Extended-Range Tornado Activity Forecast (ERTAF) Project. Bull. Amer. Meteorol. Soc. 101, E700–E709. doi:10.1175/BAMS-D-19-0188.1
Glahn, B., Taylor, A., Kurkowski, N., and Shaffer, W. A. (2009). The Role of the SLOSH Model in National Weather Service Storm Surge Forecasting. Natl. Weather Dig. 33, 3–14. Available at: https://slosh.nws.noaa.gov/slosh/pubs/Vol-33-Nu1-Glahn.pdf.
Helms, David., Austin, Matthew., Lewis, Mccullouch., Reining, Robert., Pratt, Aaron., O'Connor, Lauraleen., et al. (2016). “NOAA Observing System Integrated Analysis (NOSIA-II) Methodology Report,”. NOAA Technical Report NESDIS 147. doi:10.729/V52V2D1H
Hong, J., and Kim, W. S. (2015). Weather Impacts on Electric Power Load: Partial Phase Synchronization Analysis. Met. Apps 22, 811–816. doi:10.1002/met.1535
Hong, W., and Dong, E. (2014). The Past, Present and Future of Breast Cancer Research in China. Cancer Lett. 351 (32), 1–5. doi:10.1016/j.canlet.2014.04.007
Iturbide-Sanchez, F., da Silva, S. R. S., Liu, Q., Pryor, K. L., Pettey, M. E., and Nalli, N. R. (2018). Toward the Operational Weather Forecasting Application of Atmospheric Stability Products Derived from NUCAPS CrIS/ATMS Soundings. IEEE Trans. Geosci. Remote Sensing 56 (8), 4522–4545. doi:10.1109/TGRS.2018.2824829
Jones, Thomas. A., Koch, Steven., and Li, Zhenglong. (2017). Assimilating Synthetic Hyperspectral Sounder Temperature and Humidity Retrievals to Improve Severe Weather Forecasts. Atmos. Res. v 186 (1), pp9–25. doi:10.1016/j.atmosres.2016.11.004
Lee, Y.-K., Li, J., Li, Z., and Schmit, T. (2017). Atmospheric Temporal Variations in the Pre-landfall Environment of Typhoon Nangka (2015) Observed by the Himawari-8 AHI. Asia-pacific J. Atmos. Sci. 53, 431–443. doi:10.1007/s13143-017-0046-z
Li, J., Li, J., Otkin, J., Schmit, T. J., and Liu, C.-Y. (2011). Warning Information in a Preconvection Environment from the Geostationary Advanced Infrared Sounding System-A Simulation Study Using the IHOP Case. J. Appl. Meteorology Climatology 50, 776–783. doi:10.1175/2010jamc2441.1
Li, Z., Li, J., Wang, P., Lim, A., Li, J., Schmit, T. J., et al. (2018). Value-added Impact of Geostationary Hyperspectral Infrared Sounders on Local Severe Storm Forecasts-Via a Quick Regional OSSE. Adv. Atmos. Sci. 35 (10), 1217–1230. doi:10.1007/s00376-018-8036-3
Liu, H., and Li, J. (2010). An Improvement in Forecasting Rapid Intensification of Typhoon Sinlaku (2008) Using Clear-Sky Full Spatial Resolution Advanced IR Soundings. J. Appl. Meteorol. Cli. 49, 821–827. doi:10.1175/2009jamc2374.1
Macauley, Molly. K. (2005). “The Value of Information: a Background Paper on Measuring the Contribution of Space-Derived Earth Science Data to National Resource Management,”. No. 1318-2016-103485.
Masutani, M., Schlatter, T. W., Errico, R. M., Stoffelen, A., Andersson, E., Lahoz, W., et al. (2010). “Observing System Simulation Experiments,” in Data Assimilation: Making Sense of Observations. Editors W. A. Lahoz, B. Khattatov, and R. Ménard (Berlin: Springer), 647–679. doi:10.1007/978-3-540-74703-1_24
McCarty, W., Privé, N., and Moradi, I. (2020). Observing System Simulation Experiments Investigating a Constellation of 4-5 μm Infrared Sounders. J. Ocean Atmos. Tech. Submitted 38. doi:10.1175/JTECH-D-20-0109.1
Menzel, W. P., Schmit, T. J., Zhang, P., and Li, J. (2018). Satellite-Based Atmospheric Infrared Sounder Development and Applications. Bull. Amer. Meteorol. Soc. 99, 583–603. doi:10.1175/BAMS-D-16-0293.1
Moigne, J. L., Dabney, P., Weck, O., Foreman, V. L., Grogan, P., and Holland, M. (2017). “Tradespace Analysis Tool for Designing Constellations (TAT-C),” in 2017 IEEE International Geoscience and Remote Sensing Symposium (IGARSS), Fort Worth, TX, USA, 23-28 July 2017 (IEEE). doi:10.1109/igarss.2017.8127168
National Aeronautics and Space Administration (NASA) GOES-R Series Program Office (2019). GOES-R Series Data Book. Greenbelt, Maryland: Goddard Space Flight Center. Available at: https://www.goes-r.gov/downloads/resources/documents/GOES-RSeriesDataBook.pdf.
National Oceanic and Atmospheric Administration (NOAA) National Environmental Satellite, Data, and Information Service (NESDIS) (2020) “Geostationary and Extended Orbits (GEO-XO) Hyperspectral InfraRed Sounder Value Assessment Report”
National Oceanic and Atmospheric Administration (NOAA) National Environmental Satellite, Data, and Information Service (NESDIS) Office of Systems Development (2002). Geostationary Operational Environmental Satellite System (GOES) GOES -R Sounder and Imager Cost/Benefit Analysis (CBA). Silver Spring, MD: Prepared for the Department of Commerce.
National Oceanic and Atmospheric Administration (NOAA) (2018). The NOAA Satellite Observing System Architecture Study Building a Plan for NOAA’s 21st Century Satellite Observing System. Available at: https://www.nesdis.noaa.gov/sites/default/files/SPRWG_Final_Report_20180325_Posted.pdf.
O’Connor, A. C., Gallaher, M. P., Clark-Sutton, K., Lapidus, D., Oliver, Z. T., Scott, T. J., et al. (2019). “Economic Benefits of the Global Positioning System (GPS),” . RTI Report Number 0215471 (Research Triangle Park, NC: Sponsored by the National Institute of Standards and TechnologyRTI International).
Office Of Mgmt. and Budget, Exec. Office Of The President, Omb Circular A-4, Regulatory Analysis (2003).
Pearlman, F., Lawrence, C. B., Pindilli, E. J., Geppi, D., Shapiro, C. D., Grasso, M., et al. (2019). Demonstrating the Value of Earth Observations-Methods, Practical Applications, and Solutions-Group on Earth Observations Side Event Proceedings. U.S. Geol. Surv. Open-File Rep. 2019– 1033, 33. doi:10.3133/ofr20191033
Pearlman, F., Pearlman, J., Bernknopf, R., Coote, A., Craglia, M., Friedl, L., et al. (2016). Assessing the Socioeconomic Impact and Value of Open Geospatial Information. Geol. Surv. Open-File Rep. 2016– 1036, 36. doi:10.3133/ofr20161036
PJM Interconnection Resource Adequacy Planning Department (2016). Load Forecasting Model Whitepaper. Available at: https://www.pjm.com/∼/media/library/reports-notices/load-forecast/2016-load-forecast-whitepaper.ashx 4/30/2020.
Powner, D. (2009). Acquisition Is under Way, but Improvements Needed in Management and Oversight. Washington, DC: United States Government Accountability Office. Available at: https://www.gao.gov/assets/gao-09-323.pdf.
Regnier, E. (2008). Public Evacuation Decisions and hurricane Track Uncertainty. Manag. Sci. 54 (1), 16–28. doi:10.1287/mnsc.1070.0764
Schmit, T. J., Li, J., Ackerman, S. A., and Gurka, J. J. (2009). High-Spectral- and High-Temporal-Resolution Infrared Measurements from Geostationary Orbit. J. Atmos. Oceanic Technol. 26, 2273–2292. doi:10.1175/2009JTECHA1248.1
US Energy Information Administration (2020a). Retail Sales of Electricity United States Monthly. Available at: https://www.eia.gov/electricity/data/browser/#/topic/5?agg=0.
US Energy Information Administration (2020b). Wholesale Electricity and Natural Gas Market Data Historical Wholesale Market Data. Available at: https://www.eia.gov/electricity/wholesale/#history.
Wang, H., Huang, X.-Y., and Chen, Y. (2013). An Observing System Simulation Experiment for the Impact of MTG Candidate Infrared Sounding Mission on Regional Forecasts: System Development and Preliminary Results. ISRN Meteorology 2013, 1–18. doi:10.1155/2013/971501
Wang, P., Li, J., and Schmit, T. J. (2020). The Impact of Low Latency Satellite Sounder Observations on Local Severe Storm Forecasts in Regional NWP. Sensors (Basel) 20 (3). 650, doi:10.3390/s20030650
Wang, P., Li, J., Li, Z., Lim, A. H. N., Li, J., Schmit, T. J., et al. (2017). The Impact of Cross-Track Infrared Sounder (CrIS) Cloud-Cleared Radiances on Hurricane Joaquin (2015) and Matthew (2016) Forecasts. J. Geophys. Res. Atmos. 122, 201–213. doi:10.1002/2017JD027515
Weather Research and Forecasting Innovation Act of (2017). PUBLIC LAW 115–25—APR. 18, 2017. Available at: https://www.govinfo.gov/content/pkg/PLAW-115publ25/pdf/PLAW-115publ25.pdf.
Whitehead, John. C. (2003). One Million Dollars Per Mile? the Opportunity Costs of hurricane Evacuation. Ocean coastal Manag. 46, 11–12. doi:10.1016/j.ocecoaman.2003.11.001
Williamson, Ray. A., Hertzfeld, Henry. R., and Joseph, Cordes. (2002). The Socio-Economic Value of Improved Weather and Climate Information. Washington, DC: Space Policy Institute, The George Washington University.
Keywords: GeoXO, hyperspectral-infrared sounder, OSSE, OSE, VOI, value-chain, earth-observations
Citation: Lauer C, Conran J and Adkins J (2021) Estimating the Societal Benefits of Satellite Instruments: Application to a Break-even Analysis of the GeoXO Hyperspectral IR Sounder. Front. Environ. Sci. 9:749044. doi: 10.3389/fenvs.2021.749044
Received: 28 July 2021; Accepted: 27 September 2021;
Published: 13 October 2021.
Edited by:
Elena Moltchanova, University of Canterbury, New ZealandReviewed by:
Paul Menzel, University of Wisconsin-Madison, United StatesZuzana Chladná, Comenius University, Slovakia
Copyright © 2021 Lauer, Conran and Adkins. This is an open-access article distributed under the terms of the Creative Commons Attribution License (CC BY). The use, distribution or reproduction in other forums is permitted, provided the original author(s) and the copyright owner(s) are credited and that the original publication in this journal is cited, in accordance with accepted academic practice. No use, distribution or reproduction is permitted which does not comply with these terms.
*Correspondence: Christopher Lauer, christopher.lauer@noaa.gov
†These authors have contributed equally to this work and share first authorship