Monitoring Progress in Citywide Sanitation
 Farhad Safi
 Claire Furlong
 Bhitush Luthra
 Suresh Kumar Rohilla4
  Damir Brdjanovic
- 1Bremen Overseas Research and Development Association (BORDA), Bremen, Germany
- 2IHE Delft Institute for Water Education, Delft, Netherlands
- 3Athena Infonomics India Pvt., Chennai, India
- 4Centre for Science and Environment, New Delhi, India
For over 10 years, citywide sanitation plans have been developed, and now, citywide inclusive sanitation is being piloted globally, yet no tools exist to monitor changes in sanitation at a citywide level. This paper explores the use of Shit Flow Diagram Graphics (SFDGs) and City Service Delivery Assessments (CSDAs) to monitor changes in sanitation at a citywide level. This was done by documenting the changes in sanitation from 2015 to 2019 in Tiruchirappalli, India, and developing SFDGs and CSDAs for those years. The changes in the SFDGs and CSDAs were then compared with the documented changes. The SFDGs captured all changes in service delivery that affected >1% of the population, and all of the interventions in the enabling environment change in terms of appropriateness, acknowledgment, or implementation were captured by the CSDAs. Therefore, units of both tools were assessed to be appropriate for monitoring purposes. Using these tools to monitor change was complex and tedious, and this was improved by the development of Trend Graphs and Citywide CSDAs. This paper highlights the potential of Trend Graphs and Citywide CSDAs to monitor sanitation at a citywide level. Additionally, this is the first paper to attempt to monitor changes in sanitation holistically at a citywide level.
Introduction
The world is rapidly urbanizing. For the first time over 50% of the world population live in urban areas and this will rise to 68% by 2050 (UN DESA, 2018). In 2017 it was estimated that 75% of those living in urban areas live in low - and middle-income countries (Ritchie et al., 2018). Furthermore, one-third of the people living in urban areas live in slum conditions (Ritchie et al., 2018), defined as housing that lacks one or more of the following: access to improved sanitation or water, sufficient living area, durability of housing and security of tenure (UN Habitat, 2018). Rapid and ongoing urban growth puts pressure on existing urban services such as sanitation.
Additionally, the international community has raised the service level for sanitation. The focus of the Millennium Development Goals (MDGs) was to increase the percentage of a country’s population with access to a certain standard of toilet, but the Sustainable Development Goals (SDGs) considers the whole sanitation service chain (SSC) (Figure 1). The SSC contains a series of steps from the capture of human excreta in the toilet through to treatment and finally disposal or end use (Figure 1). There are two categories of sanitation systems: offsite (also referred to as sewered or networked) and onsite (also referred to as non-sewered or non-networked). Offsite sanitation systems are defined as systems where excreta and wastewater are collected and transported away from where they are generated and use sewers for transport (Tilley et al., 2014). While onsite sanitation systems are defined as systems where excreta and wastewater are collected and stored or treated where they are generated (Tilley et al., 2014), then emptied and the contents are transported for treatment or buried onsite (Figure 1). In urban areas in low- and middle-income countries 56% of the population has offsite sanitation, while 38% have septic tanks or pit latrines (forms of onsite sanitation), and the remainder of the urban population use other forms of sanitation or practice open defecation (JMP, 2021). Within low- and middle-income cities, sanitation is complex as normally both types of sanitation systems are simultaneously implemented. In a study with data from 39 cities in low- and middle-income countries 72% had a combination of onsite and offsite sanitation, while the remaining cities had onsite sanitation only (Peal et al., 2020).
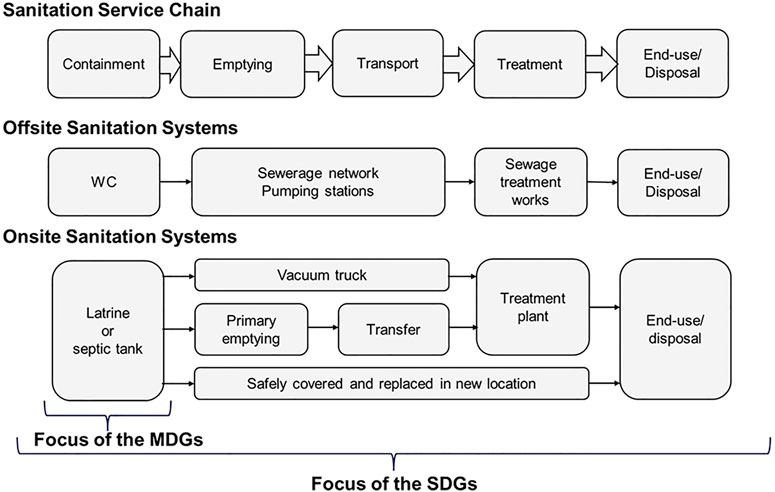
FIGURE 1. The steps of the sanitation service chain (SSC) chain and examples of these steps in offsite and onsite sanitation systems in relation to the Millennium Development Goals (MDGs) and Sustainable Development Goals (SDGs).
Traditional approaches to urban sanitation are focused on investments in offsite infrastructure, which normally serve only a part of the city (Evans et al., 2006), meaning that onsite infrastructure and the enabling environment (as defined by Lüthi et al., 2011—aspects of policies, legislations, financing, etc. that facilitate service delivery) are neglected. To meet the target for urban sanitation of the SDGs, more innovative approaches are required (Gambrill et al., 2020). The citywide sanitation approach (CSA) emerged as a response to the traditional infrastructure-focused approach (Evans et al., 2006). This approach advocates sanitation development across a city, as well as strategies and tools for a stage-wise implementation of contextually appropriate sanitation solutions (BORDA, 2016; Walther, 2016). It aims to ensure that sanitation services are equitable, and institutionally and environmentally sustainable (BORDA, 2016). CSA has been adopted in India at the national level. To date, over 165 cities have developed a citywide sanitation plan (MoUD, 2008; MoUD, 2013). CSA has developed into Citywide Inclusive Sanitation (CWIS), which has a greater focus on equity along the SSC (Narayan and Lüthi, 2020). CWIS focuses on inclusion within service provision, by prioritizing the most vulnerable in the city (Schrecongost et al., 2020). Currently, CWIS is being implemented in over 40 cities globally (Narayan and Lüthi 2019; Gambrill et al., 2020). CWIS differs from CSA as it is an overarching framework formed from seven principles (Schrecongost et al., 2020), whereas CSA is a planning tool or method. A planning framework for CWIS has been proposed by Narayan et al. (2021), but this is yet to be trialled. Within the proposed CIWS planning framework, the importance of situational analysis is highlighted, which could include the use of the tools piloted in this paper. As actions and strategies implemented in both CSA and CWIS, so there is a need to go beyond an initial situational analysis and monitor sanitation progress at the citywide level.
Although there are several tools that can be used to aid the analysis of the initial context (Schertenleib et al., 2021), limited tools and frameworks exist to monitoring urban sanitation. Key Performance Indicator Tool (a part of FSM Toolbox and no longer available) provides an overview of onsite sanitation and monitors performance using a set of service targets (FSM Toolbox, 2017). As this tool does not cover offsite sanitation, it cannot be used to monitor cities that have a combination of sanitation systems. Additionally, it does not cover the enabling environment. The Performance Assessment Tool was developed to monitor water supply and offsite sanitation in Indian cities (CEPT University, 2011). This tool again does not cover the enabling environment nor onsite sanitation, so it is also inappropriate. The authors believe that currently, no tools nor frameworks have been developed to monitor citywide sanitation.
Scott and Cotton (2020) have suggested that Shit Flow Diagram Graphics (SFDGs) and CSDAs (City Service Delivery Assessments) could be used for assessing service delivery and enabling environment aspects of CWIS. SFDGs were designed as an advocacy and decision support tool and are used to highlight existing challenges in service delivery along the SSC (SFD-PI, 2018a). To date, more than 120 SFDGs have been developed for cities globally (SFD-PI, 2018b). Whereas the CSDA is used to assess the enabling environment across the SSC in a city, it has been used less widely than the SDFGs. The original CSDA only covered onsite sanitation (Ross et al., 2016), but it has been expanded for citywide use (Safi, 2019; Blackett and Hawkins, 2020). SFDGs and CSDAs have been used together to gain an understanding of the current sanitation situation in urban areas (Peal et al., 2014a; Peal et al., 2014b). SFDGs have also been used to model future sanitation scenarios and to assess how these scenarios impact sanitation coverage across a city (Martinez, 2016). It should be noted that the outputs of these tools are intrinsically linked, as the enabling environment captured in the CSDA facilitates the service delivery captured in the SFD (Scott and Cotton, 2020). It is hypothesized that these tools, which have previously been used for situational analysis have the potential to monitor changes in sanitation service delivery and the enabling environment across the SSC of a city.
This paper, therefore, aims to pilot and evaluate the use of SFDGs and CSDAs for monitoring citywide sanitation approaches (CSA and CWIS) which are being implemented in Tiruchirappalli (Trichy), India. Trichy was chosen as a baseline SDFG exist for 2015 (Rohilla et al., 2015), a citywide sanitation plan was available (TCC, 2018) and it has adopted a CWIS approach (Safi, 2019). Therefore, it was expected that significant changes in sanitation had occurred in the city since 2015 in terms of service delivery and the enabling environment.
Methods
Case study area
Trichy is in the South of India on the banks of the Cauvery River in Tamil Nadu State (Rohilla et al., 2015). The city covers an area of 167.23 km2 and is subdivided into 65 wards, in four zones. It has a tropical climate and has no major change in temperature between summer and winter (Rohilla et al., 2015). The population of the city was calculated to be 1,104,710 with an estimated household size of four (Safi, 2019).
Recording Changes in the Sanitation Service Chain
The changes in the SSC both in the service delivery and the enabling environment from 2015 to 2019 were analyzed through reviews of secondary data, interviews of key informants with the city stakeholders, and observations (Safi, 2019). The data collection was guided by the SFD manual (SFD-PI, 2018a). It took approximately 2 months to collect the data, with the aid of a local organization that acted as a gatekeeper to the sanitation community.
Shit flow diagram graphics
The 2019 SFDG for the city was developed based on the data collected (SFD-PI, 2018a). A new SFDG for 2015 was developed as the design of the SFDG had changed; this was to enable easier visual comparison. The original SFDG (Rohilla et al., 2015) was updated in collaboration with the authors as it was known that it did not capture all the onsite sanitation systems in Trichy. Trend Graphs were also developed from the SFDG data, to assess their use when comparing data visually (Martinez, 2016).
Development of City Service Delivery Assessments scorecards
The CSDAs of 2015 and 2019 for Trichy were developed as per the CWIS CSDA Guideline (Blackett and Hawkins, 2020). The CSDA for 2015 was developed using the SFD Report data (Rohilla et al., 2015) and key informant interviews (Safi, 2019). For the 2019 CSDA, data collection was guided by the SDF Manual (SFD-PI, 2018a). Details of the data collected can be found in Safi (2019). The initial CSDAs were developed by the researcher. These were then validated in consultation with sanitation stakeholders and experts in Trichy, as documented in Safi (2019). Citywide CSDAs were developed for each year to assess their use when comparing the data visually (Safi, 2019).
Sensitivity of the tools
The SFDG shows the status of service delivery in the form of percentage population (SFD-PI, 2018a). The sensitivity of the SFDG is 1% of the population (SFD-PI, 2018a). The CSDA is more complex as each pillar is divided into three indicators (Figure 3), and then each indicator is subdivided into one to four sub-indicators which are scored 0, 0.5, or 1 (Blackett and Hawkins, 2020). Scoring is based on the existence, appropriateness, acknowledgment and implementation of each sub-indicator, e.g., 0 = not available/inappropriate, 0.5 = appropriate but not widely known, 1.0 = widely known and acknowledged, available and fully implemented (Blackett and Hawkins, 2020). The sub-indicator scores are then averaged to give the indicator score (Blackett and Hawkins, 2020). The indicator scores are then classified as either poor (red) 0–0.4, improving (yellow) 0.5–0.7, or satisfactory (green) 0.8–1.0 (Figure 3). The sensitivity of the tools is related to their original aim, so the ability of each tool to capture change needs to be assessed.
Result and discussion
Table 1 highlights the sanitation interventions in Trichy that occurred between 2015 and 2019, including changes in service delivery and enabling environment. The impact of the interventions (Table 1) on SFDGs and CSDA for 2019 was validated in stakeholder meetings.
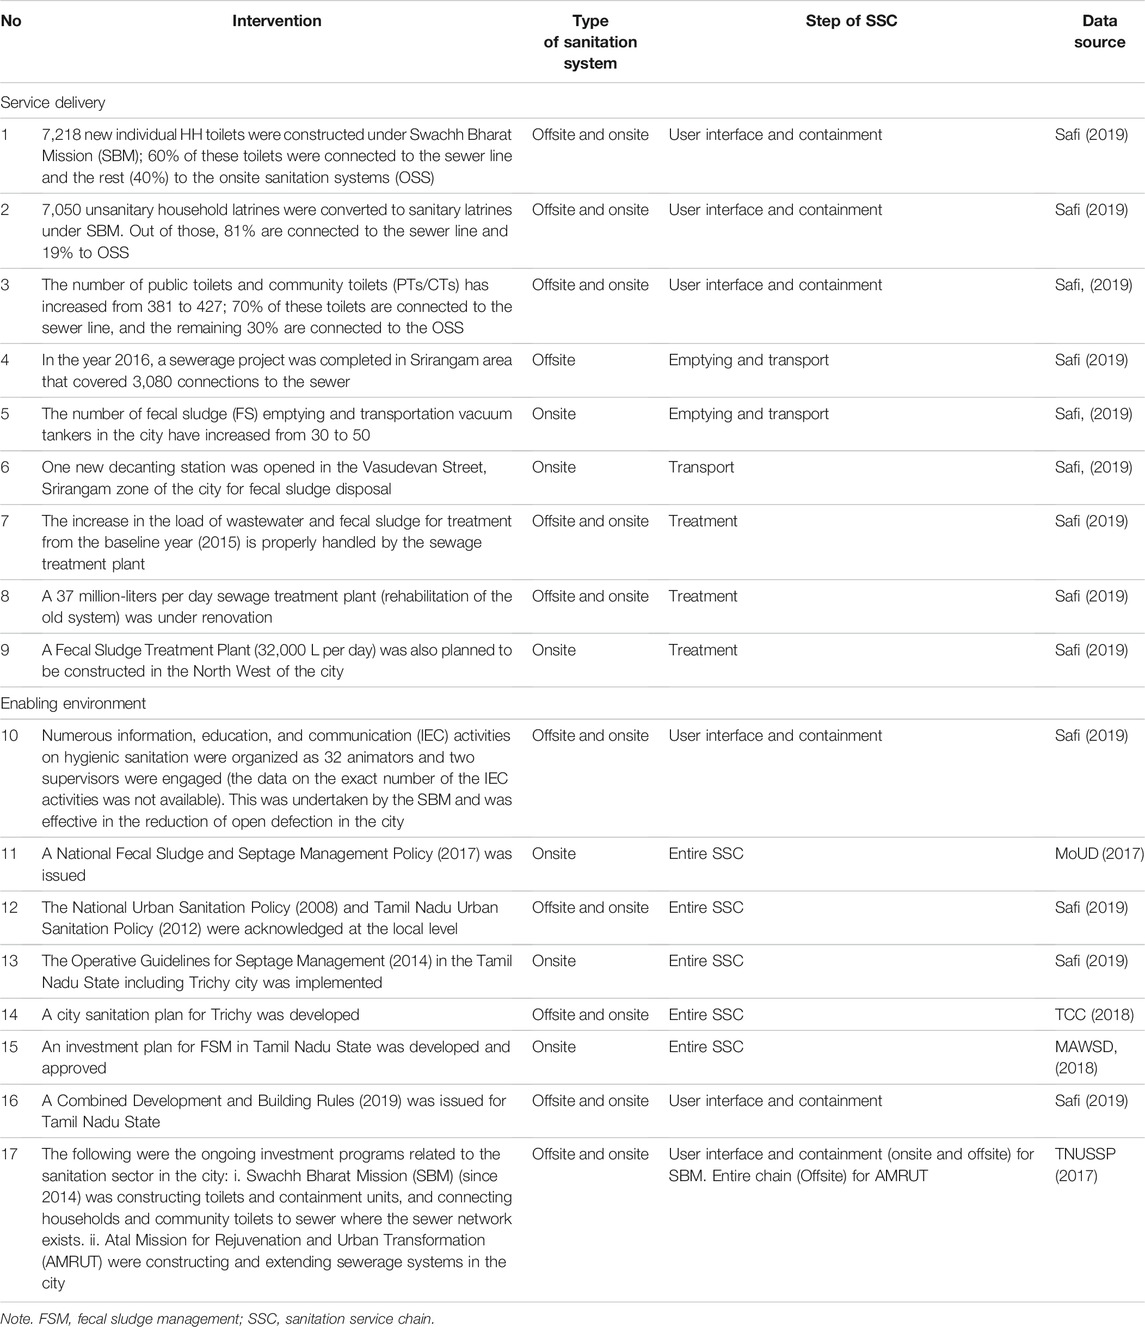
TABLE 1. Sanitation interventions in Trichy from 2015 to 2019.
Citywide Service Delivery Monitoring Shit Flow Diagram Graphics
The SFDGs for 2015 and 2019 can be found in Figures 2A,B. In Figure 2A, it can be seen that 41% of the population were using onsite sanitation and 59% offsite sanitation (Rohilla, et al., 2015), and this remained the same in 2019 (Figure 2B).
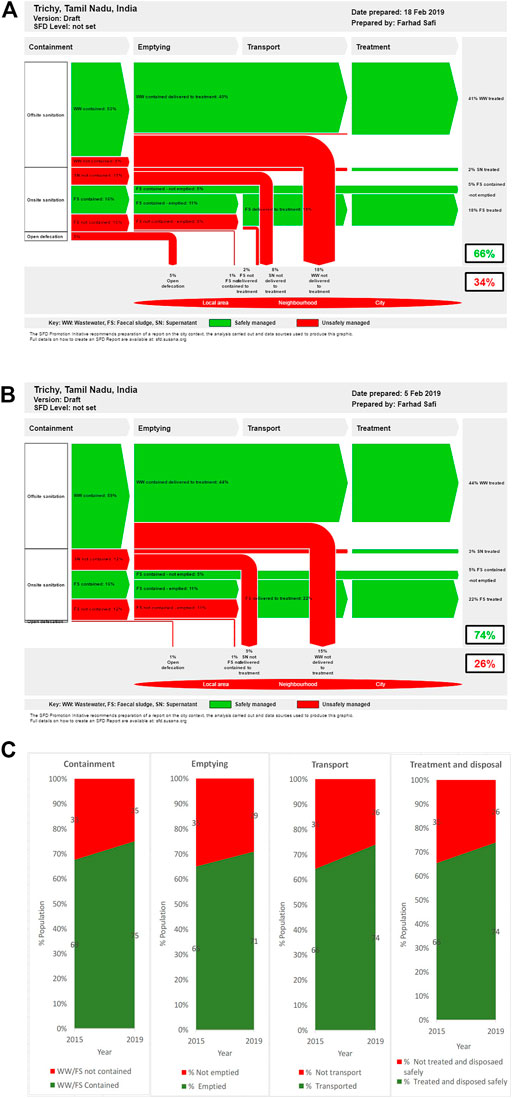
FIGURE 2. (A) New Shit Flow Diagram (SFD) for 2015, (B) SFD for 2019, (C) Trend Graphs 2015–2019.
The most noticeable change when comparing Figures 2A,B was the 8% increase (from 66% to 74%) in safely managed excreta across the city, caused mainly by the elimination of direct discharge to open drains and reduction in open defecation. This can be attributed to the following changes across the SSC:
1) Containment (6%): This improvement was due to the construction of new individual and community/public toilets, upgrading of existing unsanitary toilets, conducting information, education, and communication activities (Table 1, Interventions 1, 3, 2, and 10).
2) Emptying (6%) and transport (8%): Twenty new private vacuum tankers and a new decanting station came into operation, which increased the fecal sludge emptying and transport service (Table 1, Interventions 5 and 6). The sewer network was also extended as 3,080 new connections were made.
3) Treatment (8%): The existing sewage treatment plant was used for the treatment of the increased load of wastewater and fecal sludge transported to it (Table 1, Intervention 7). As the plant was underloaded in 2015, the increased treatment was due to improvement in the previous step of the SSC, e.g., fecal sludge and wastewater being transported to the treatment site. A small proportion of wastewater was managed onsite by septic tanks with soak pits. It is assumed that the wastewater in the septic tanks was safely managed as defined by SFD Manual (SFD-PI 2018a).
Only Interventions 8 and 9 in Table 1 were not captured in the SFDGs, as they had not been fully implemented. The visual comparison of the two SFDGs (Figures 2A,B) took skill, time, and was tedious, as some changes were not easily seen. Therefore, Trend Graphs were developed as in Martinez (2016) (Figure 2C). These graphs captured the individual impact of interventions of the service delivery as in the original SFDGs. Trend Graphs (Figure 2C) more clearly show the overall change in each of the components of the sanitation service chain. The data are not disaggregated between onsite and offsite, but as the tools are being explored to monitor citywide sanitation, this level of detail is not required.
The SFDGs and Trend Graphs only captured change at the level of ±1% population, for Trichy in 2019. This equates to 11,047 population or 2,761 households. The magnitude of the change is dependent on the scale of the intervention in relation to the population of the city, e.g., in Trichy an additional 3,080 new sewer connections, serving an approximate population of 12,320, (Table 1, Intervention 4), is approximately a 1% improvement in the safe containment in 2019. Therefore, the magnitude of any interventions needed to keep pace with population growth. The effect of population growth was noted to be a major factor when using these tools to model future sanitation scenarios, as little impact was seen with many of the proposed interventions (Martinez, 2016). These units are thought to be appropriate for citywide monitoring as it ensures services are keeping pace with population growth.
Citywide Enabling Environment Monitoring City Service Delivery Assessments
The offsite and onsite CSDAs were developed for the years 2015 and 2019 (Figures 3A,B) and were compared separately with the documented changes (Table 1).
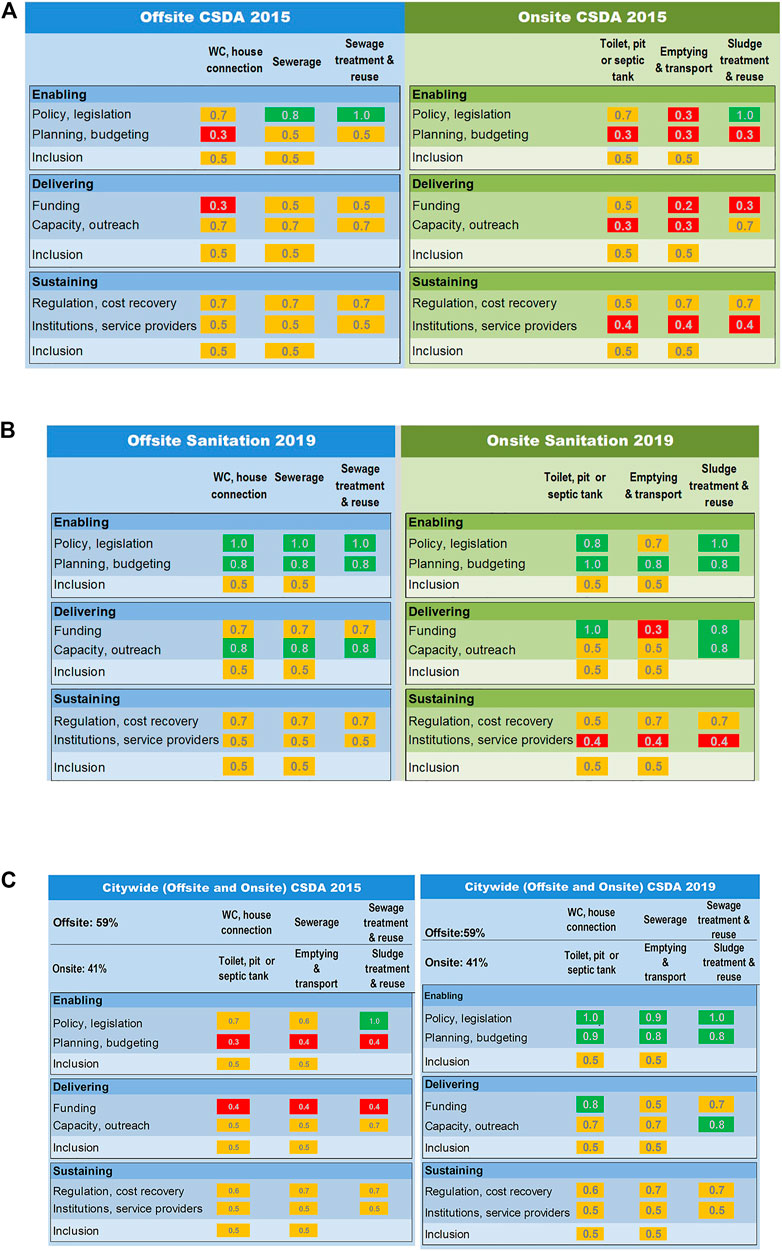
FIGURE 3. (A) City Service Delivery Assessments (CSDAs) for Trichy, offsite (blue) and onsite (green) sanitation 2015, (B) offsite (blue) and onsite (green) 2019, and (C) citywide 2015 and 2019.
Enabling Pillar-Policy and Legislation Indicators
Containment changed from 0.7 (improving) to 1.0 (satisfactory) in offsite sanitation (WC, house connection), whereas it changed from 0.7 (improving) to 0.8 (satisfactory) for onsite sanitation (toilet, pit, or septic tank) (Figures 3A,B). Emptying and transport in offsite sanitation (sewerage) changed from 0.8 to 1.0 (remained satisfactory), while in onsite, they changed from 0.3 (poor) to 0.7 (improving). For treatment and reuse, in onsite and offsite sanitation, the rating did not change as it gained the highest rating, 1.0 (satisfactory) in 2015, and it remained at this level. For onsite sanitation, these changes were linked to Interventions 11 and 13 (Table 1) and general improvement in sanitation can be attributed to the implementation of Intervention 12, Table 1.
Enabling Pillar-Planning and Budgeting Indicators
For containment, offsite sanitation changed from 0.3 (poor) to 0.8 (satisfactory) and, for onsite sanitation, from 0.3 (poor) to 1.0 (Figures 3A,B). The remaining two steps of the SSC in both systems changed to 0.8 (satisfactory) from 0.5 (improving) in offsite and 0.3 (poor) in onsite. These changes are linked to Interventions 14 and 15, but mainly 17, as this included the budget, (Table 1).
Enabling Pillar-Inclusion Indicators
This indicator remained at 0.5 (improving) for both offsite and onsite for containment, and emptying and transport (Figures 3A,B). The policy, planning, and budgetary arrangements before 2015 include some aspects of inclusion; hence, the initial scores were 0.5. Although CWIS was being implemented in Trichy in 2019, it was only at the planning stage and had not yet been implemented, so no change was captured in the CSDA for this indicator as no changes had occurred.
Delivery Pillar-Funding Indicators
For all parts of the offsite, SSC changed to 0.7 (satisfactory), from 0.5 (improving) or 0.3 (poor) (Figures 3A,B). For onsite sanitation, containment changed from 0.5 (improving) to 1.0 (satisfactory), emptying and transport changed from 0.2 to 0.3 (remaining poor), while treatment and reuse changed from 0.3 (poor) to 0.8 (satisfactory). These changes were linked to Interventions 15 and 17 (Table 1). As no significant public funds were assigned for transport and emptying in these interventions, these scores increased only slightly. The CSDAs only capture public funding, so although 20 new vacuum tankers were purchased by private operators, this was not captured.
Delivery Pillar-Capacity and Outreach Indicators
The score increased in all parts of the offsite SSC from 0.7 (improving) to 0.8 (satisfactory) (Figures 3A,B). While in onsite sanitation, the scores for containment, and emptying and transport increased from 0.3 (poor) to 0.5 (improving), and for treatment and reuse, the scores changed from 0.7 (improving) to 0.8 (satisfactory). These slight improvements were linked to the implementation of outreach activities (Intervention 10, Table 1).
Delivery Pillar-Inclusion Indicators
Remained at 0.5 (improving) from 2015 to 2019 in both the offsite and onsite for containment, and emptying and transport (Figures 3A,B). Delivery before 2015 includes some aspects of inclusion; hence, the initial score was 0.5. Although CWIS was being implemented in Trichy in 2019, it was only at the planning stage and had not yet been implemented, so no change was captured in the CSDA for this indicator as it has not occurred.
Sustaining Pillar-Regulation and Cost Recovery Indicators
For offsite sanitation, the score remained the same: 0.7 (improving) across the SSC (Figures 3A,B). This is the same for onsite sanitation for emptying and transport, treatment, and reuse, except the score for containment, remained 0.5. Although Intervention 13 (Table 1) was implemented by the municipality, it was not fully enforced, so no improvement was shown on the CSDA for onsite sanitation. As the new guidelines and rules for containment (Intervention 16, Table 1) were reiterations of previous rules and guidelines, no improvement was shown on the CSDA.
Sustaining Pillar-Institutions and Service Providers Indicators
The scores remained the same: 0.5 (improving) for offsite sanitation and 0.4 (poor) for onsite from 2015 to 2019 (Figures 3A,B). No new interventions relating to these sub-indicators could be found; the scores remained the same.
Sustaining Pillar-Inclusion Indicators
The scores remained 0.5 (improving) for containment, and emptying and transport in both onsite and offsite (Figures 3A,B). Sustaining before 2015 includes some aspects of inclusion; hence, the initial score was 0.5. Although CWIS was being implemented in Trichy in 2019, it was only at the planning stage and had not yet been implemented, so no change was captured in the CSDA for this indicator as it has not occurred.
Not all interventions on Table 1 were captured in the CSDA, due to the scoring of the sub-indicators being related to the appropriateness, level of acknowledgment, or implementation, rather than the existence of an intervention. The scoring system and its sensitivity were deemed appropriate for monitoring changes at a citywide level, as it was able to capture changes that occurred over the 4 years. Increasing the levels in scoring criteria would add additional complexity to the tool and make it harder to score, as differences between the categories would be reduced. As the CSDA only covers the public sector, this means any improvement due to the private sector such as investments were not captured. This may lead to sections of SSC on the CSDA being rated lower than they are in reality. As there is no indication of the percentage population using each type of sanitation system, the most dominant type of sanitation within the city cannot be identified. Therefore, they must be used in conjunction with an SFDG (Figures 2A,B), which contains these data. Another option is to develop a Citywide CSDA for each year by weighting the CSDA indicator scores for offsite and onsite sanitation by the percentage of the population using each type of sanitation (Safi, 2019). This CSDA then reflects the enabling environment at a citywide level for a given year (Figure 3C) and makes the comparison of the changes easier to analyze.
In general, onsite sanitation scored lower than offsite sanitation across all pillars in both 2015 and 2019 (Figures 3A,B), and 41% of the population used this type of sanitation system in both years. This is reflected in the lowering of the Citywide CSDA indicator scores (Figure 3C) compared with the score for offsite sanitation in each year. The sanitation situation in Trichy was unusual, as the percentage of the population using onsite and offsite was almost equally split (Figures 2A,B). In a study of sanitation in 39 low- and middle-income cities, similar sanitation was only found in five cities (Peal et al., 2020). Although this situation seems to be more common in India, 27% of the cities in India in this study had similar sanitation situations (Peal et al., 2020). If there was a more dominant sanitation type, the Citywide CSDA would reflect this and may hide the sanitation needs of the marginalized as they may be using a different sanitation system compared with the majority of the population. As all three pillars in the CSDAs (Figures 3A–C) have an inclusion indicator, this should capture inequalities in the sanitation focus of a city, but this needs to be evaluated further. As CSDAs and Citywide CSDAs have not been widely used, the authors recommend further piloting of these tools for monitoring purposes, paying special attention to their ability to capture inclusion. A further development would be to trial change CSDAs (Safi, 2019), which capture the change in the enabling environment on one CSDA.
Although piloting of these tools to monitor changes in citywide sanitation was deemed to be successful, several limitations or challenges were noted. Extensive data is required for both the development of the SFDGs and CSDAs. Trichy was purposively chosen for this study as data on sanitation were readily available and accessible [an initial SFDG already existed (Rohilla et al., 2015), a citywide sanitation plan was available (TCC, 2018), and it has adopted a CWIS approach (Safi, 2019)], this may not be the case in other cities. Even with these data being available, the data collection period took 2 months; in cities where less data are available, it may take longer, although it should be noted that the researcher was not from the sanitation sector in Trichy, so the data collection period stated could be an overestimation of the time required. In most cities, there is a general lack of data on sanitation, which means that some assumptions will need to be made. Guidance on these assumptions is given in the manuals of the tools (SFD-PI, 2018a; Blackett and Hawkins, 2020). All assumptions made were validated in consultation with sanitation stakeholders and experts in Trichy before the final CSDAs and SFDGs were developed (Safi, 2019). The biases of the sanitation stakeholders and experts need to be considered in this process, as there may be political reasons for them wanting the current sanitation situation to be seen as being worse or better than it is. These biases can be and were minimized by consulting with a broad range of sanitation experts and stakeholders from different organizations within a city. The final outputs of these tools could be seen as being subjective, due to the methods and assumptions that are required. This is because both tools were designed for advocacy and therefore not designed to be accurate or precise (SFD-PI, 2018a; Blackett and Hawkins, 2020). This subjectivity is and was minimized by validating the outputs of these tools with a wide range of sanitation stakeholders and experts. The analysis and comparison of the output of the tools were done by visual comparisons without guidance, and it was noted to be time consuming and tedious. Additionally, this could be seen as being subjective. Guidance for these comparisons could be developed, or software could be produced to aid this process. This software could generate a short report or graphic noting the positive and negative changes in sanitation at a citywide level. Although some of these data were in the public domain, some of the data required could be seen as being sensitive, e.g., performance of sewage treatment plant; hence, the results could also be deemed as being sensitive, as cities may not want to highlight slippages in sanitation coverage, which could be linked to the units used, e.g., the city may be increasing sanitation coverage in terms of numbers, but not keeping up with population growth. Most of the limitations in terms of subjectivity and biases discussed can be overcome or minimized by consulting and working with a wider range of sanitation stakeholders and experts, meaning that this is not a standalone process, and it should be done in conjunction with the sanitation community. This can be difficult to do if there is a lack of political buy-in or an undeveloped sanitation sector in a city. In these cities, the tools could be used to monitor changes in sanitation, but the lack of data, assumptions, and potential biases should be acknowledged. Undertaking this process may even stimulate political buy-in and the development of the sanitation sector in these cities.
Conclusion
All the service delivery changes that were fully implemented and that affected 1% of the population or more were captured on the SFDGs, but it is difficult to see these changes. Trend Graphs were then developed, which clearly showed all changes at each step of the SSC. The data in the Trend Graphs were not disaggregated, but this is not required when applying a citywide approach. The units of the SFDGs and the Trend Graphs (percentage of the population) and the sensitivity of these tools were judged to be appropriate for citywide monitoring. An advantage of these units is that interventions need to keep pace with population growth for any improvements to be recorded. All of the interventions related to the enabling environment were captured by the CSDAs if they had brought about an increase in appropriateness, level of acknowledgment, or implementation in a certain part of the SSC. It was noted that the CSDAs only capture public sector activities, and the sensitivity was assessed to be good enough to monitor change. Comparing four CSDAs to review these changes was complex and tedious. This was improved by developing citywide CSDA. As CSDAs have been used less than SFDGs, further piloting of this tool is required to assess their suitability for monitoring. The main challenges in using these tools for citywide monitoring were linked to the amount and availability of data, subjectivity, and potential biases, which were overcome by consulting with a wider range of sanitation stakeholders and experts, who were used to validate assumptions and outputs of the tools. This paper highlights the potential of Trend Graphs and Citywide CSDAs to monitor sanitation at a citywide level. Additionally, it is thought to be the first paper to attempt to monitor changes in sanitation at a citywide level.
Data Availability Statement
Publicly available datasets were analyzed in this study. These data can be found here: https://cdm21063.contentdm.oclc.org/digital/collection/masters2/id/83759.
Ethics Statement
Ethical review and approval were not required for the study on human participants in accordance with the local legislation and institutional requirements. The patients/participants provided their written informed consent to participate in this study.
Author Contributions
CF and FS contributed to the conception and design of the study, performed the analysis of data, and wrote the first draft of the manuscript. FS, CF, and BL were in charge of the development of tools and data collection. All authors contributed to manuscript revision, and read and approved the submitted version.
Funding
This research was undertaken while studying for an MSc in Sanitation at IHE Delft Institute for Water Education, Netherlands with a scholarship funded by Bill and Melinda Gates Foundation under the following grant number: OPP1157500 and INV-009151.
Conflict of Interest
BL is employed by Athena Infonomics India Private Ltd.
The remaining authors declare that the research was conducted in the absence of any commercial or financial relationships that could be constructed as a potential conflict of interest.
Publisher’s Note
All claims expressed in this article are solely those of the authors and do not necessarily represent those of their affiliated organizations, or those of the publisher, the editors, and the reviewers. Any product that may be evaluated in this article, or claim that may be made by its manufacturer, is not guaranteed or endorsed by the publisher.
Acknowledgments
The authors would also like to acknowledge the Indian Institute for Human Settlements and Tiruchirappalli City Corporation for their support during the fieldwork of the research in India.
References
Blackett, I., and Hawkins, P. (2020). City Service Delivery Assessment for Citywide Inclusive Sanitation -User Guide. UK: Inclusive Sanitation in Practice.
CEPT University (2011). Performance Measurement for Urban Water Supply and Sanitation-List and Definition of KPIs and Local Action Indicators. Gujarat, India: CEPT University.
Evans, B. E., and Saywell, D.Sanitation 21 task force (2006). Sanitation 21: Simple Approaches to Complex Sanitation - A Draft Framework for Analysis. London, UK: Report. International Water Association.
FSM Toolbox (2017). Monitor the Performance of the Project with Set Indicators. Available at: http://www.fsmtoolbox.com/fsm-workflow/07-operation-maintenance/7-2-monitor-the-performance-of-the-project-with-set-indicators/(accessed November 10, 2018).
Gambrill, M., Gilsdorf, R. J., and Kotwal, N. (2020). Citywide Inclusive Sanitation-Business as Unusual: Shifting the Paradigm by Shifting Minds. Front. Environ. Sci. 7, 201. doi:10.3389/fenvs.2019.00201JMP2021
JMP (2021). WashData. Available at: https://washdata.org/data (accessed May 22, 2021).
Martinez, L. F. (2016). Using the SFD Methodology for Modelling Future Scenarios in Kumasi, Ghana. Loughborough, UK: MSc Dissertation, WEDC.
MAWSD (2018). FSM Investment Plan. Chennai, India: Municipal Administration and Water Supply Department (MAWSD), Government of Tamil Nadu.
MoUD, (2013). Advisory Note on Septage Management in Urban India. New Delhi, India: Ministry of Urban Development (MoUD) Government of India.
MoUD, (2017). National Policy on Faecal Sludge Management (FSSM). New Delhi, India: Ministry of Urban Development (MoUD) Government of India.
MoUD, (2008). National Urban Sanitation Policy. New Delhi, India: Ministry of Urban Development (MoUD) Government of India.
Narayan, A., and Lüthi, C. (2020). Solving Urban Sanitation - Sustainably and Equitably, 43. Alexandria, VA: World Water, 18–21.
Narayan, A. S., and Lüthi, C. (2019). Citywide Inclusive Sanitation–Old Wine in New Bottle. Sandec News 20, 21–22.
Narayan, A. S., Maurer, M., and Lüthi, C. (2021). The Clean Plan: Analysing Sanitation Planning in India Using the CWIS Planning Framework. J. Water Sanitation Hy giene Develop. 11 (6), 1036–1047. doi:10.2166/washdev.2021.130
Peal, A., Evans, B., Ahilan, S., Ban, R., Blackett, I., Hawkins, P., et al. (2020). Estimating Safely Managed Sanitation in Urban Areas; Lessons Learned from a Global Implementation of Excreta-Flow Diagrams. Front. Environ. Sci. 8, 1. doi:10.3389/fenvs.2020.00001
Peal, A., Evans, B., Blackett, I., Hawkins, P., and Heymans, C. (2014a). Fecal Sludge Management (FSM): Analytical Tools for Assessing FSM in Cities. J. Water 4, 371–383. doi:10.2166/washdev.2014.139
Peal, A., Evans, B., Blackett, I., Hawkins, P., and Heymans, C. (2014b). Fecal Sludge Management (FSM): Analytical Tools for Assessing FSM in Cities. J. Water 4, 563–575. doi:10.2166/washdev.2014.026
Ritchie, R., Mispy, , and Ortiz-Ospina, (2018). Measuring Progress toward Sustainable Development Goals. https://sdg-tracker.org/(accessed April 24, 2020).
Rohilla, S. K., Luthra, B., Varma, R. S., and Padhi, S. K. (2015). Tiruchirappalli, India SFD Report, Centre for Science and Environment (CSE), SFD Promotion Initiative. Tiruchirappalli: SFD-PI.
Ross, I., Scott, R., Mujica, A., White, Z., and Smith, M. (2016). Fecal Sludge Management : Diagnostics for Service Delivery in Urban Areas- Tools and Guidelines (English). Water and Sanitation Program Technical Paper, Water and Sanitation Program (WSP). Washington DC: World Bank Group.
Safi, F. (2019). Monitoring Changes in Citywide Sanitation: An Assessment of Two Tools. Delft, Netherlands: MSc Dissertation, IHE Delft Insititute for Water Education. https://cdm21063.contentdm.oclc.org/digital/collection/masters2/id/83854.
Schertenleib, R., Lüthi, C., Panesar, A., Büürma, M., Kapur, D., Narayan, A. S., et al. (2021). A Sanitation Journey - Principles, Approaches & Tools for Urban Sanitation. Bonn: Sustainable Sanitation Alliance.
Schrecongost, A., Pedi, D., Jan, W., Shrestha, R., and Ban, R. (2020). Citywide Inclusive Sanitation: A Public Service Approach for Reaching the Urban Sanitation SDGs. Front. Environ. Sci. 8, 19. doi:10.3389/fenvs.2020.00019
Scott, P., and Cotton, A. P. (2020). The Sanitation Cityscape - toward a Conceptual Framework for Integrated and Citywide Urban Sanitation. Front. Environ. Sci. 8, 70. doi:10.3389/fenvs.2020.00070
SFD-PI (2018b). About SFD, SFD Promotion Initiative. Available at: https://sfd.susana.org (accessed October 20, 2019).
TCC (2018). Tiruchirappalli City Sanitation Plan, Tiruchirappalli City Corporation (TCC). Tiruchirappalli, India: TCC.
Tilley, E., Ulrich, L., Lüthi, C., Reymond, Ph., and Zurbrügg, C. (2014). Compendium of Sanitation Systems and Technologies. 2nd Revised Edition. Dübendorf, Switzerland: Swiss Federal Institute of Aquatic Science and Technology (Eawag).
Tnussp, (2017). Legal and Institutional Review, Tamil Nadu Urban Sanitation Support Program (TNUSSP). Chennai, India.
UN (2017). SDG Goal 6: Ensure Access to Water and Sanitation for All. Available at: https://www.un.org/sustainabledevelopment/water-and-sanitation/(accessed September 14, 2019).
Un-Habitat, (2018). SDG Indicator 11.1.1 Training Module: Adequate Housing and Slum Upgrading. United Nations Human Settlement Programme (UN-Habitat).
Keywords: enabling environment, India, sanitation tools, urban sanitation, Tiruchirappalli
Citation: Safi F, Furlong C, Luthra B, Rohilla SK and Brdjanovic D (2022) Monitoring Progress in Citywide Sanitation. Front. Environ. Sci. 9:751534. doi: 10.3389/fenvs.2021.751534
Received: 01 August 2021; Accepted: 22 November 2021;
Published: 12 January 2022.
Edited by:
Efthalia Chatzisymeon, University of Edinburgh, United KingdomReviewed by:
Shikun Cheng, University of Science and Technology Beijing, ChinaFlorin Constantin Mihai, Alexandru Ioan Cuza University, Romania
Copyright © 2022 Safi, Furlong, Luthra, Rohilla and Brdjanovic. This is an open-access article distributed under the terms of the Creative Commons Attribution License (CC BY). The use, distribution or reproduction in other forums is permitted, provided the original author(s) and the copyright owner(s) are credited and that the original publication in this journal is cited, in accordance with accepted academic practice. No use, distribution or reproduction is permitted which does not comply with these terms.
*Correspondence: Farhad Safi, farhad.safi47@gmail.com; Claire Furlong, c.furlong@un-ihe.org