Fish Assemblages in Subtidal Seagrass Meadows Surrounding the West Sand, South China Sea
 Qing-qiang Ren
 Priscilla T. Y. Leung
 Qing Xu1
  Meng Yan
 Min Liu
- 1State Key Laboratory of Marine Environmental Science, College of Ocean and Earth Sciences, Xiamen University, Xiamen City, China
- 2State Key Laboratory of Marine Pollution, City University of Hong Kong, Hong Kong, Hong Kong SAR, China
Both beach seine (BS) and line transect-based underwater visual census (UVC) methods were applied to investigate fish assemblages of the West Sand (Xisha Islands, South China Sea) seagrass meadows and their relationship with seagrass coverage. The West Sand seagrass meadows were divided into four survey areas, two (areas A and B) to the north and two (areas C and D) to the south. The average seagrass coverages (%) in the north were significantly higher than those in the south (p < 0.05). The dominant seagrass species is Thalassia hemprichii, contributing to over 70% substrate coverage in all four areas. A total of 843 individuals from 25 fish species belonging to 22 genera, 11 families, and ten orders were recorded, with five species obtained by both BS and UVC methods. The labrids Halichoeres trimaculatus and Stethojulis strigiventer were the only two species that dominated (index of relative importance IRI > 500) in both BS and UVC methods. Fish assemblages among the four areas were significantly different (BS, p = 0.002; UVC, p = 0.002); area A was significantly different from areas B−D (p < 0.05), which was mainly driven by the variation in H. trimaculatus density. Furthermore, fish assemblages of the four areas (abundance data) revealed by both BS (r2 = 0.8455) and UVC (r2 = 0.9354) methods showed high correlation with the seagrass coverage. The majority of the individuals (>93%) recorded by BS and UVC methods were shorter than the total length at maturity (TLm), with 80.36 and 46.13% of individuals less than half the sizes of their TLm, respectively. Our results, for the first time, proved the importance of seagrass meadows at the West Sand as fish nursery grounds. The ecological roles of seagrass habitats in South China Sea merit further investigation.
Introduction
Seagrass meadows, as an important part of coastal and estuarine ecosystems, mainly form in tropical and subtropical coastal and shallow reef regions (Short et al., 2011; Syukur et al., 2017; Carmen et al., 2019). Seagrass habitats support over 20% of the global largest industrial and small-scale fisheries as nursery grounds (Unsworth et al., 2018). The colonization of seagrass meadows has been proved to promote the increase in sediment mud and organic matter contents, as well as the abundance and richness of macrofaunal communities (Lundquist et al., 2018). Seagrass meadows are beneficial to the retention of eggs and spawning by mitigating the turbulent hydrodynamics (Short et al., 2011; Costa et al., 2020).
Fishes, especially coral reef fishes, usually utilize different habitats at different life stages due to the requirement of food and shelter (Galaiduk et al., 2018; Sambrook et al., 2019; Berkström et al., 2020). The high overlap (40–43%) in fish richness between coral reefs and vegetative habitats (seagrass and macroalgal habitats) indicates their important roles in homing fishes (Sambrook et al., 2019). Many coral reef fishes spend part of their lifetime in seagrass meadows as nursery, refuge, and foraging grounds (Honda et al., 2013; Whitfield, 2016; Parsons et al., 2018). Compared with coral reefs, juvenile fishes have higher densities and survival and growth rates in seagrass meadows, indicating the important nursery function of this habitat (Nagelkerken et al., 2002; Nakamura et al., 2012; Moussa et al., 2020). Seagrass meadows provide structural complexity as shelter, rich small food, and protection for juvenile fishes (Cullen-Unsworth and Unsworth, 2013).
Different seagrass meadow structures harbored distinct fish assemblages. For example, larger fishes could benefit from the open space below an Amphibolis griffithii leaf canopy, while small fishes could conceal in the foliage of Posidonia sinuosa (Hyndes et al., 2003; Sambrook et al., 2019). Meanwhile, fishes are also beneficial to the seagrass habitats through their ecological niche, especially in the transportation of nutrients and energy between different habitats and ecosystems (Burkepile et al., 2013). However, seagrass meadows have suffered great degradation from anthropogenic influences and natural disasters due to their vulnerability (Halpern et al., 2008), and attempts and measures for their conservation and restoration are essential (Carmen et al., 2019; Orth et al., 2020).
In Chinese waters, 22 seagrass species (four families and 10 genera) have been recorded among the 72 species being recorded globally (Short et al., 2011; Zheng et al., 2013; Huang et al., 2016). Seagrass meadows in China were divided into two geographic bioregions, i.e., the South China Sea Bioregion in southern China and the Bohai Sea and Yellow Sea Bioregion in northern China. The former was greater in terms of the number of species and cover area (Shi et al., 2010; Zheng et al., 2013). In the South China Sea Bioregion, 15 seagrass species were recorded, with Thalassia hemprichii dominant in Hainan and Taiwan, and Halophila ovalis was the most widely distributed in Hainan, Guangdong, Guangxi, Taiwan, and Hong Kong (Shi et al., 2010; Zheng et al., 2013). Seagrass meadows have been threatened by anthropogenic activities in southern China, including Hainan, Guangdong, and Guangxi (Huang et al., 2006). At Xisha Islands (15°47′–17°08′ N, 110°10′–112°55′ E), South China Sea, five seagrass species were recorded, namely, T. hemprichii, H. ovalis, H. minor, H. beccarii, and Thalassodendron ciliatum, and there was no information on Nansha Islands (Fan et al., 2009; Zheng et al., 2013).
Despite the important ecological services of seagrass meadows, studies regarding the fish nursery function of this important habitat in the South China Sea are few. To our best understanding, there was only one study that presented a photo evidence to document the importance of seagrass habitats as a juvenile fish refuge at Xisha Islands (Du et al., 2020). Clearly, further studies such as detailed and statistical data on fish assemblage are essential to provide robust evidence to support the importance of seagrass meadows for juvenile fishes.
The Qilianyu cluster of Xisha Islands consists of eight islands, with the West Sand being the only one significantly surrounded by a large area of seagrass meadows. The aims of this study were to examine the current status of the seagrass meadows at the West Sand in terms of both seagrass species diversity and coverage, to evaluate the fish assemblages in seagrass meadows using beach seine (BS) and line transect-based underwater visual census (UVC) methods, and to analyze the correlation between seagrass coverage and fish assemblage. The fish nursery function of the seagrass meadows at the West Sand is also discussed.
Materials and methods
Study area background
The Qilianyu cluster (Xisha Islands, South China Sea) consists of eight islands, namely, the West Sand, Zhaoshu Island, North Island, Middle Island, South Island, North Sand, Middle Sand, and South Sand (Figure 1A). The Qilianyu cluster is mainly influenced by a tropical oceanic monsoon climate with an average annual temperature of approximately 26.5°C (24–29°C) and characterized by irregular semidiurnal tides (Huang et al., 2008; Wu et al., 2018).
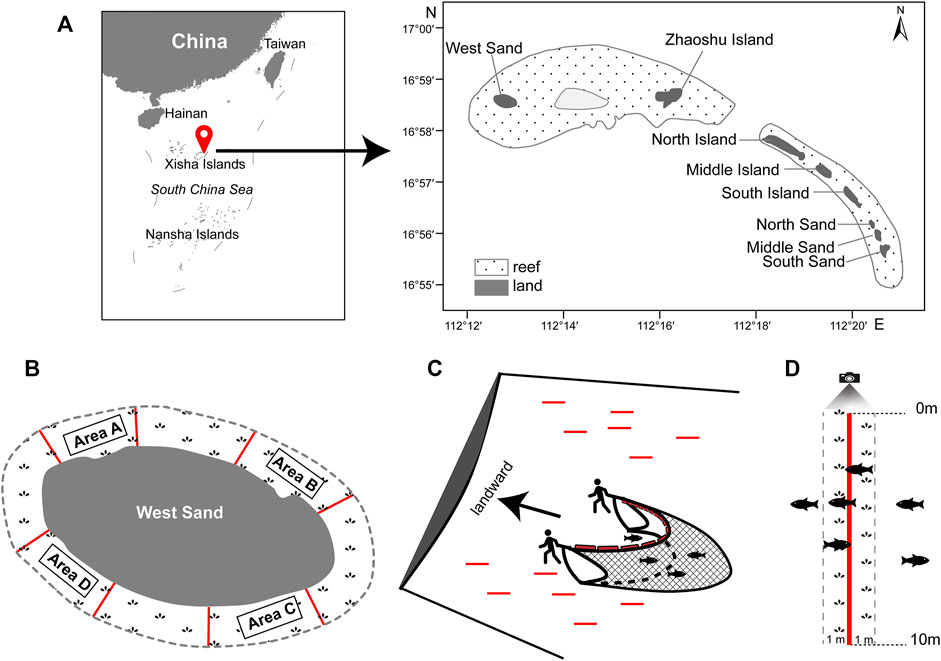
FIGURE 1. (A) Location of the Qilianyu cluster (red balloon), Xisha Islands, South China Sea. (B) The four survey areas A–D at West Sand. (C) Beach seine method (BS). Red lines indicate the 12 random 20-m line transects in a survey area. (D) Line transect-based underwater visual census method (UVC). The red line indicates one of the fourteen 10-m line transects in a survey area.
The West Sand and Zhaoshu Island are grouped into the same reef (Wu et al., 2018; Sun et al., 2021). The West Sand is an uninhabited island that has an estimated land area of 0.26 km2 and 2.1-km coastline (Jia et al., 2019) and is significantly surrounded by dense seagrass meadows. The seagrass meadows extend at least 100 m from the shore.
Survey method and design
Around the West Sand, four survey areas (A−D) were set with each approximately 27,500 m2, and the separation between each survey area was at least 200 m (Figure 1B). The fish assemblages in the seagrass meadows were investigated using BS and UVC methods in each survey area in December (winter) 2019. Samplings were conducted during daytime when the tide started to rise and the water depth was less than 1.5 m.
A trapezoid-shaped BS was used, with 6 m in upper side width, 4.5 m in lower side width, 0.9 m in height, and 4 mm in mesh size. A total of twelve 20-m line transects were randomly set in each survey area, and the distance between two transect lines was about 20 m. The BS was manually hauled by two people along each transect line against the coastline (Figure 1C). The sampling area of each haul was about 90 m2 (4.5 m × 20 m). Before every haul, there was a waiting time of at least 5 min to minimize any disturbance to fishes. All collected fishes were put in labeled plastic hermetic bags and immediately stored in cooler boxes with ice. In the laboratory, each individual was measured for the total length (TL, in mm), standard length (SL, in mm), and body weight (BW, in g). Each individual was identified to the species or genus level if possible according to the external morphological features (Fu, 2014; Allen et al., 2015; Fang and Lv, 2019) and the classification system followed Nelson et al. (2016).
UVC surveys were conducted using a GoPro Action video recorder. A total of fourteen 10-m line transects were randomly deployed in each survey area. The diver swam above the 10-m line transect and recorded the types of substrates at every 10-cm interval, i.e., a total of 100 recording points on each 10-m line transect. The seagrass coverage (%) was then calculated as the number of points with seagrass/100 points × 100. Following the substrate line transect, there was at least 5 min of waiting time to minimize the disturbance to fishes, and then the fish recording was performed. The diver swam above the 10-m line transect slowly with a speed controlled at 3–5 m per minute and recorded all fishes with a recording area of about 20 m2 (i.e., 1-m width on both sides of the 10-m line transect) (Figure 1D). The fish density (ind./m2) per 10 m line transect was calculated as the number of individual fishes/20 m2. Fish identification was conducted to the lowest taxonomic level as possible (see above), and the body sizes of recorded fishes were estimated with TL and categorized into size at every 5-cm TL interval (e.g., 0–5.0 cm, 5.1–10.0 cm, 10.1–15.0 cm).
For each species obtained by BS and UVC methods, the body size (TL) at sexual maturity (TLm) was collected from FishBase (www.fishbase.org). For the species only available with standard length (SL) at sexual maturity (SLm), the transformation to TLm was based on the relationship of TL and SL (www.fishbase.org). For the species only identified at the genus level, TLm was not applicable.
DNA Barcoding to Identify Juvenile Fish Species
DNA barcoding was also applied to ascertain the species identification of the early the juvenile fish samples. At least one specimen of each of the morphologically identified species that were collected from beach seine was randomly selected for DNA barcoding using partial sequences of cytochrome c oxidase subunit I (COI) gene. A piece of skeletal muscle was isolated from each specimen for genomic DNA extraction using Chelex® 100 resin following the instruction manual (Bio-Rad Laboratories, Inc., United States). Polymerase chain reaction (PCR) was conducted in a total volume of 25 μl, including 20 ng DNA template, 1 unit of Ex Taq DNA polymerase (Takara), 0.5 µM reverse and forward primers, 0.2 mM mixed dNTPs, 1.5 mM MgCl2, and 1 × PCR buffer (pH 8.4, 200 mM Tris-HCl and 500 mM KCl). Partial sequences of cytochrome c oxidase subunit I (COI) gene were amplified using three forward primers, VF1 (5′-TCTCAACCAACCACAAAGACATTGG-3′, Ivanova et al., 2006), Fish F1 (5′-TCAACCAACCACAAAGACATTGGCAC-3′, Ward et al., 2005), and Fish F2 (5′-TCGACTAATCATAAAGATATCGGCAC-3′), in combination with two reverse primers, Fish R1 (5′-TAGACTTCTGGGTGGCCAAAGAATCA-3′) and Fish R2 (5′- ACTTCAGGGTGACCGAAGAATCAGAA-3′) from Ward et al. (2005). PCR cycling conditions are as follows: 95°C for 2 min; 39 cycles of 95°C for 30 s, 51°C for 30 s, and 72°C for 45 s; and 72°C for 2 min. PCR products were purified and sequenced by BGI Ltd. (Hong Kong) with the Sanger sequencing method. Raw sequences were assembled using Geneious Prime v11.0.911 (Biomatters Ltd.). Identification of the assembled COI partial sequences was performed using BLAST to search against the GenBank nucleotide database of the National Center for Biotechnology Information (NCBI) and Barcode of Life Data System (BOLD).
Data analysis
The number of individual fishes per haul (x) collected using the BS method was log(x + 1) transformed to meet the assumptions of homogeneity of variance and normality prior to univariate analysis. Then, one-way ANOVA was applied to detect the spatial difference among survey areas. A non-parametric test (Kruskal–Wallis ANOVA) was used for comparisons of other variables/datasets, i.e., the number of individual fishes per 10-m line transect recorded using the UVC method, density (ind./m2) by BS and UVC, biomass (g/m2) by BS, and seagrass coverage (%), because these datasets were not normally distributed even after numerous transformations (Kolmogorov–Smirnov normality test, p < 0.05).
The index of relative importance (IRI) was applied to determine the dominant species (Pinkas et al., 1971). A species is considered dominant when IRI ≥ 500 (Wei and Huang, 2020). For the BS method, IRI was calculated as (N% + W%) × F%. For the UVC method, IRI was calculated as N% × F%. N%, W%, and F% are the relative individual, weight, and frequency of occurrence, respectively.
A Bray–Curtis similarity matrix was constructed based on the log(x + 1)-transformed fish density to reduce the influence of rare and dominant species (Clarke and Green, 1988). Subsequently, a permutational multivariate analysis of variance (PERMANOVA) was performed to test the difference in fish communities between survey areas and methods, which was visualized using non-metric multidimensional scaling (nMDS) ordination plots (Clarke, 1993; Anderson, 2005). Similarity percentage (SIMPER) analysis was used to compare the species and their contributions to the variations in fish communities. The relationship between seagrass coverage and fish abundance was detected using canonical analysis of principal coordinates (CAP).
Results
Fish species
A total of 843 individuals from 25 species belonging to 22 genera, 11 families, and ten orders were recorded (Supplementary Table S1). Fourteen species (belonging to 13 genera and eight families) were captured using the BS method, and 16 species (belonging to 14 genera and seven families) were observed using the UVC method; five species were recorded in both methods, namely, Chrysiptera biocellata, Halichoeres trimaculatus, Parupeneus barberinoides, Stethojulis bandanensis, and S. strigiventer (Figure 2A; Supplementary Table S1). Labridae was the most dominant family with eight species recorded.
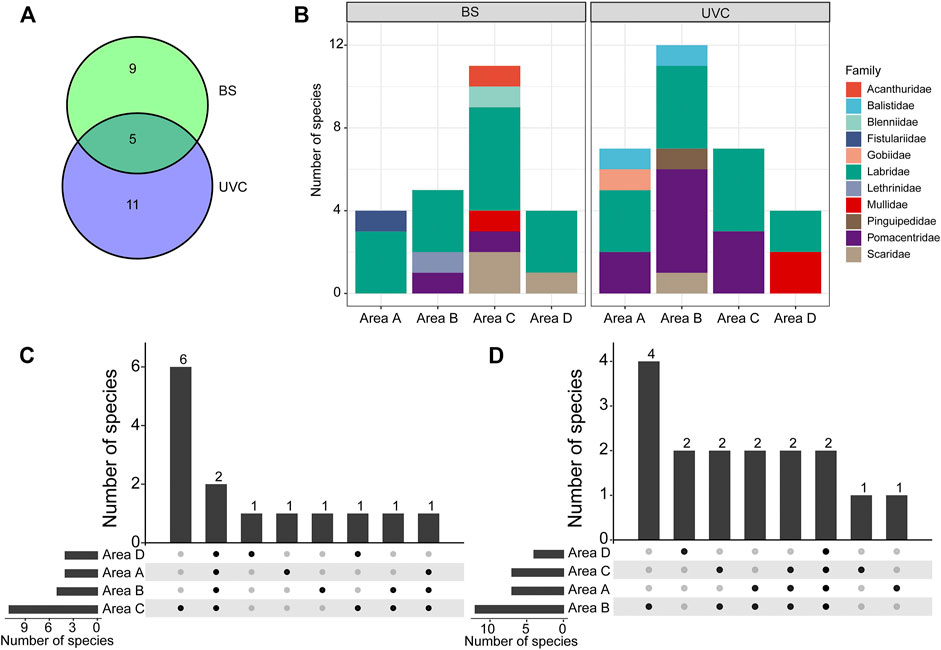
FIGURE 2. Fish species compositions in the four survey areas A–D using BS and UVC methods at West Sand. (A) Species composition. (B) The number of species at the family level. (C) Species specificity and similarity among the four areas using the BS method. (D) Species specificity and similarity among the four areas using the UVC method. BS, beach seine; UVC, underwater visual census. The numbers above bars and the solid black spots in (C) and (D) indicate the specificity and similarity in the number of species that occurred.
All specimens collected by the BS method in the four survey areas A−D were identified to species level via morphological and molecular approaches, except for a single specimen of Petroscirtes which could only be identified to the genus level. The partial COI sequences obtained were deposited in NCBI GenBank with accession numbers MZ539887−MZ539934 (Supplementary Table S1); they were 98–100% identical to the corresponding reference sequences on NCBI GenBank and BOLD. H. trimaculatus and S. bandanensis were captured in all four survey areas (Supplementary Table S1). Labridae consisted of 42.86% of the total number of species collected (Figure 2B). The highest species number (11 species) was recorded in area C; six species were collected only in area C, and one species was collected only in areas A, B, and D, respectively (Figure 2C).
By the UVC method, H. trimaculatus and S. strigiventer were observed in all four survey areas (Supplementary Table S1). Labridae and Pomacentridae accounted for the highest proportion of the total number of species, together up to 100% in area C (Figure 2B). Area B was the highest in species number (12 species); four species were recorded only in area B, two species were found only in area D, and one species was found only in area A and area C (Figure 2D).
Three dominant species, H. trimaculatus, S. bandanensis, and S. strigiventer, were determined with IRI > 500 (Table 1). In particular, H. trimaculatus was the primary dominant species in three of the four survey areas of the BS method and in all four survey areas of the UVC method.
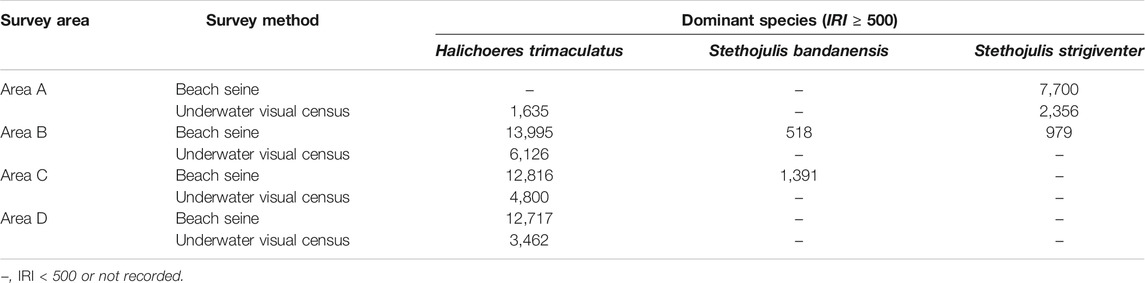
TABLE 1. Dominant species determined by the index of relative importance (IRI) ≥ 500.
Abundance and body size
A total of 494 individuals were collected from the four survey areas A−D using the BS method (Figure 3A; Supplementary Table S1). H. trimaculatus (319 individuals), S. bandanensis (49 individuals), and S. strigiventer (94 individuals) together contributed 93.52% of the total number of individuals. Area C had the highest number of individuals (18.92 ± 24.78 ind./haul), which was significantly higher than that in area A (6.50 ± 11.66 ind./haul) (one-way ANOVA, p < 0.05). No significant difference was detected among other areas (p > 0.05 or p > 0.15). Nearly all the individuals (99.80%) were shorter than their TLm, and 80.36% of the total individuals were less than half the sizes of their TLm (Supplementary Table S2). For the three dominant species, many individuals were smaller juveniles (≤5.0 cm TL), i.e., 52.66% for H. trimaculatus, 77.55% for S. bandanensis, and 21.28% for S. strigiventer (Figure 3B).
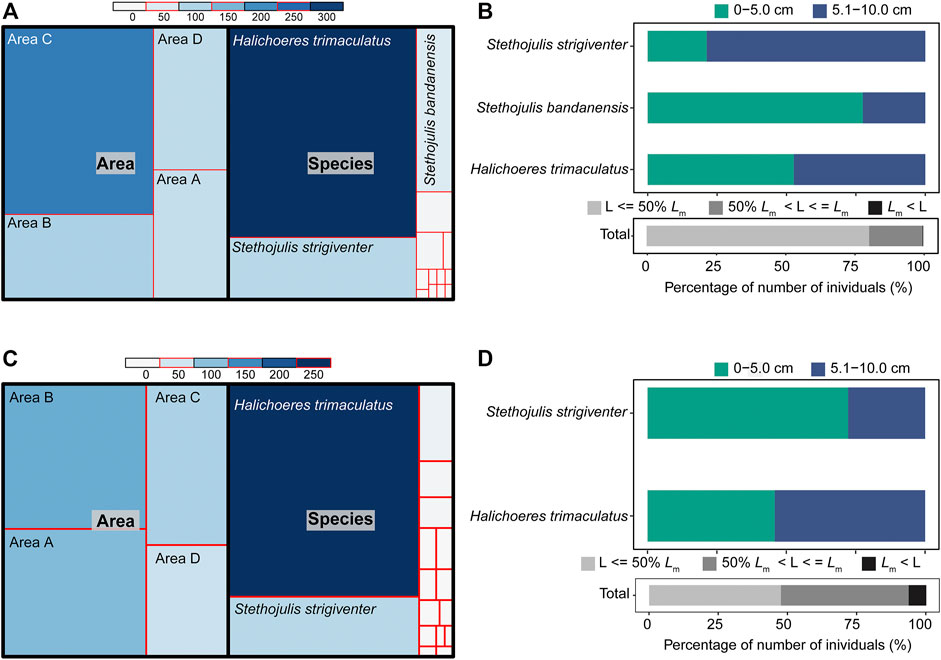
FIGURE 3. (A) The number of individuals by area and by species and (B) the proportion of individuals with sizes (total length TL, cm) compared to the size at 50% of sexual maturity (TLm) using the BS method. (C) The number of individuals by area and by species (D) and the proportion of individuals with sizes (TL, cm) compared to the size at 50% of sexual maturity (TLm) using the UVC method.
A total of 349 individuals were recorded using the UVC method (Figure 3C; Supplementary Table S1). Two species, H. trimaculatus (231 individuals) and S. strigiventer (65 individuals), contributed 84.81% of the total number of individuals. The mean number of individuals per 10-m line transect was 7.43 ± 8.08 in area A, 8.43 ± 8.63 in area B, 5.36 ± 5.97 in area C, and 3.71 ± 6.71 in area D. No significant difference in the number of individuals per transect was found among the four survey areas A−D (Kruskal–Wallis ANOVA, p > 0.15). Most individuals (93.70%) were shorter than their TLm, and 46.13% of the total individuals were less than half the sizes of their TLm (Figure 3D; Supplementary Table S3).
Density and biomass
The mean fish densities using the BS method were 0.07 ± 0.13 ind./m2 in area A, 0.09 ± 0.09 ind./m2 in area B, 0.21 ± 0.28 ind./m2 in area C, and 0.08 ± 0.12 ind./m2 in area D. Fish density was not significantly different among the four survey areas A−D (Kruskal–Wallis ANOVA, p > 0.05, Figure 4A). The mean biomasses were 0.20 ± 0.38 g/m2 in area A, 0.16 ± 0.16 g/m2 in area B, 0.48 ± 0.66 g/m2 in area C, and 0.11 ± 0.17 g/m2 in area D. Spatial variations in biomass were also not significantly different among the four areas A-D (Kruskal–Wallis ANOVA, p > 0.05, Figure 4B).
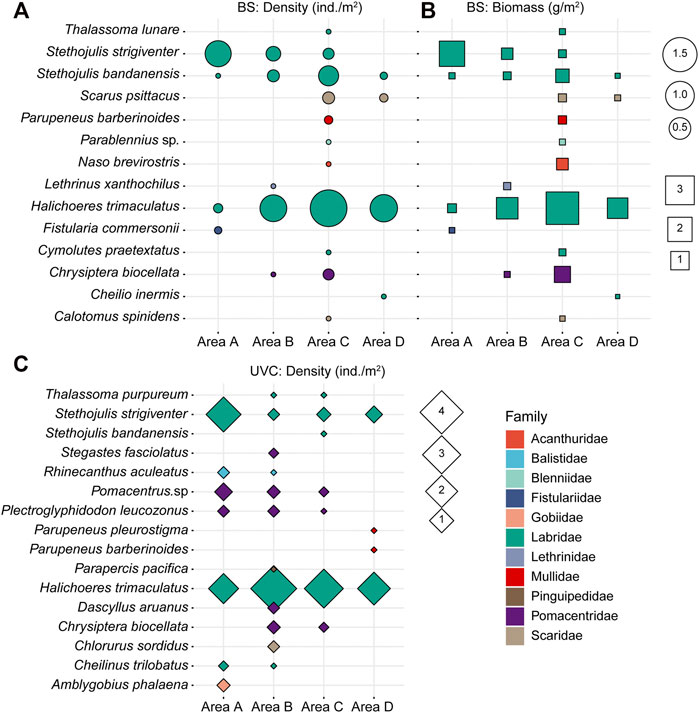
FIGURE 4. (A) Density (ind./m2) and (B) biomass (g/m2) of fish species collected using the BS method. (C) Density (ind./m2) of fish species using the UVC method.
The mean densities using the UVC method were 0.37 ± 0.40 ind./m2, 0.42 ± 0.43 ind./m2, 0.27 ± 0.30 ind./m2, and 0.19 ± 0.34 ind./m2, in areas A, B, C, and D, respectively. No significant differences in fish density were found among the four areas A-D (Kruskal–Wallis ANOVA, p > 0.15, Figure 4C).
Overall, Labridae had the highest density and biomass, contributing over 90% in density and 79% in biomass using the BS method and over 80% in density using the UVC method. For both BS and UVC methods, S. strigiventer had the highest density and biomass in area A, while H. trimaculatus had the highest density and biomass in areas B−D.
Seagrass coverage and spatial structure of fish assemblages
There are two seagrass species at the West Sand, namely, H. ovalis and T. hemprichii. The mean seagrass coverages (%) in area A (96.86 ± 3.61%) and area B (91.79 ± 6.27%) were significantly higher than those in area C (72.71 ± 12.85%) and area D (74.50 ± 13.84%) (Kruskal–Wallis ANOVA, p < 0.05, Figure 5A). The absolute dominant species was T. hemprichii, contributing to >99% seagrass coverage in areas A and B and >97% in areas C and D (Figure 5B). Other substrates included sandy bottom, macroalgae, and coral colonies (Figure 5A).
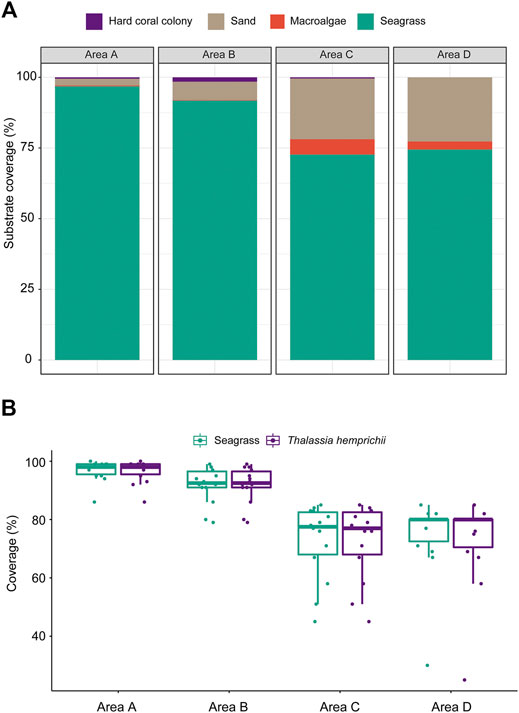
FIGURE 5. (A) The average substrate coverages (%) and (B) variations in seagrass coverage and T. hemprichii coverage of 10-m line transects (N = 14) in the four survey areas A−D at West Sand.
Fish assemblages recorded using BS and UVC methods had significant difference (PERMANOVA pairwise test, p = 0.001). Fish assemblages had significant differences among the four areas (PERMANOVA; BS, p = 0.002; UVC, p = 0.002), with area A being significantly different from areas B−D in both BS and UVC methods (PERMANOVA pairwise tests: p < 0.05) (Figures 6A,B). Furthermore, the fish assemblages of the four areas from both BS (r2 = 0.8455) and UVC (r2 = 0.9354) showed high correlation with the seagrass coverage (%) using CAP analysis (Figures 6C,D).
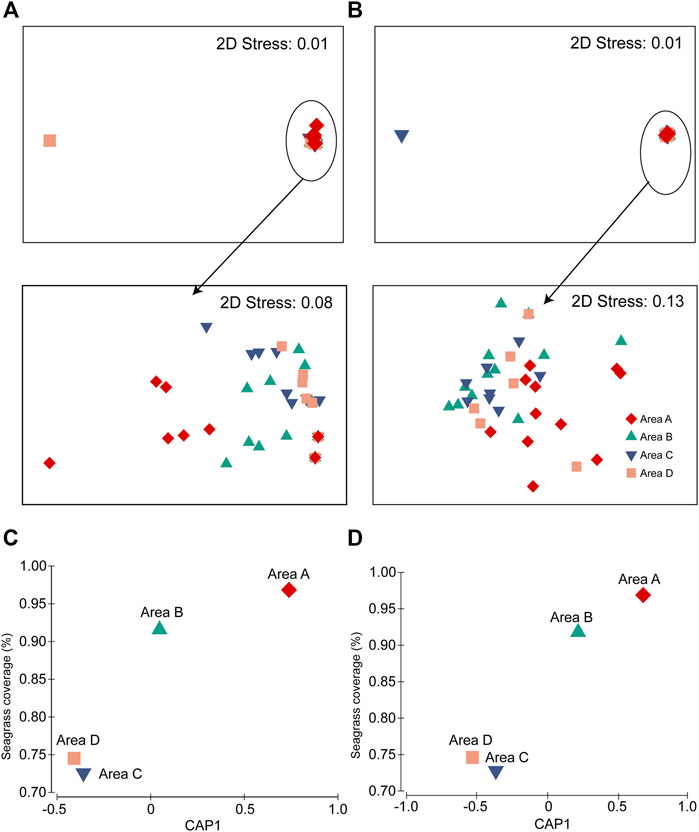
FIGURE 6. Differences in fish assemblages among the four areas A–D: (A) BS method and (B) UVC method. CAP plot showing the correlation between seagrass coverage (%) and fish abundance: (C) BS method and (D) UVC method.
SIMPER analysis revealed the fish species contributing the difference between areas. High dissimilarity of fish assemblages between areas was detected in BS (>61%) and UVC (>58%) methods (Table 2). More than 90% of dissimilarity across areas was contributed by five and 12 species from BS and UVC, respectively. Variations in fish assemblages between areas were mainly driven by the changes in the density of H. trimaculatus (BS: > 43%; UVC: > 40%).
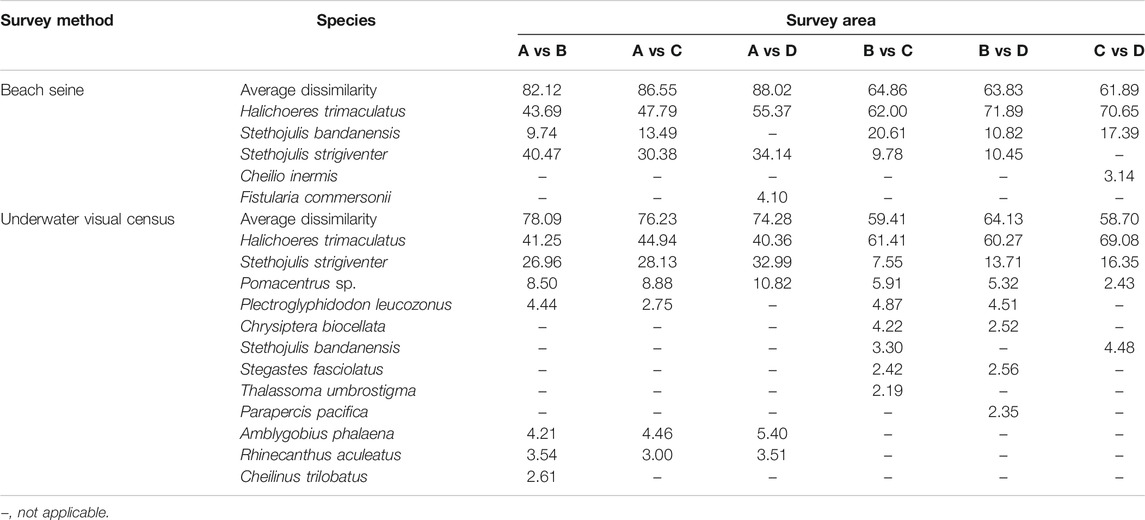
TABLE 2. Contributory influence of fish species on the dissimilarity between fish assemblages using BS and UVC methods (cumulated contribution >90%).
Discussion
Survey methods
Multiple stereo video-based and net-based methods have been commonly applied to quantify fish assemblages in nearshore waters and to further understand the ecological characteristics of fishes (Bortone et al., 1989; Saleh et al., 2020). However, fish assemblages collected by different survey methods, e.g., baited and unbaited remote underwater video (BRUV; URUV), diver-operated video (DOV), UVC, BS and beam trawling, have marked differences due to their intrinsic selection (Guest et al., 2003; Horinouchi et al., 2005; French et al., 2021). Thus, application of multiple methods has been suggested to complement each other to better assess fish assemblages, e.g., in seagrass habitats (Harmelin-Vivien and Francour, 1992; Baker et al., 2016; French et al., 2021).
This study showed that BS and UVC methods were able to sample different fish assemblages within the same area of seagrass meadow, supporting the necessity of using combined sampling methods. Our samplings took place over a relatively large surveyed area (approximately 27,500 m2 per survey area) and separated by a sufficient distance apart from each haul and each line transect; therefore, the sampling made the replicates to be not likely performed repeatedly over the same point and thus minimized the operating impact on seagrass habitats. UVC combined with line transect and video application is believed to pose less disturbance to the ecosystem; however, it has constraints in size estimation (Edgar et al., 2004), which is crucial in evaluating the nursery services of seagrass meadow. The relatively clear water (visibility about 15 m) and short length of seagrass leaves (H. ovalis and T. hemprichii) at the West Sand could reduce the potential of missing secretive species.
Seagrass meadows and fish assemblages
Two seagrass species were recorded at the West Sand, with T. hemprichii identified as the dominant species. T. hemprichii was also reported as a dominant seagrass species in the southern Philippines (Espadero et al., 2021). Interestingly, both studies reported that the family Labridae was the dominant fish taxon in these “T. hemprichii-dominating” seagrass meadows. In another study, the canopy height of seagrass meadows was proved as the paramount indictor for the density and species richness of juvenile fishes in the east coast of Zanzibar Island, Tanzania (Gullström et al., 2008). The seagrass diversity and 3-dimensional seagrass structure have great influence on fish assemblages (Hori et al., 2009; Park and Kwak, 2018). The species-specific association between the certain fish species and seagrass species would deserve further investigations.
Fish abundance can be associated with seagrass coverage. For example, in the Venice Lagoon (Italy), the abundance of Nerophis ophidion and Syngnathus typhle (Syngnathidae) was strongly correlated with seagrass coverage as revealed by canonical correspondence analysis (CCA) (Franco et al., 2006). Our results also proved the high correlation between seagrass coverage and fish abundance using both BS and UVC methods. Compared with unvegetated habitats, seagrass meadows showed not only higher fish abundance and species richness but also higher growth and survival rates (Heck et al., 2003). The morphological characteristics and the structural complexity of seagrass meadows had great influence on regulating fish assemblages (Gullström et al., 2008). Fish density and species diversity are much higher in seagrass meadows than those in unvegetated sandy bottoms (Larkum et al., 1989). According to an experiment conducted on Barker Inlet/Port River Estuary (Australia), the fish abundance in seagrass meadows even after the removal of seagrass canopy was higher than that in unvegetated areas (Connolly 1994). Hori et al. (2009) proved that the seagrass species diversity, vegetation, and canopy height of seagrass meadows affected greatly the abundance, biomass, and richness of associated fish assemblages using canonical correlation analysis (CCoA). Furthermore, fishes inhabiting the surface, inside, and bottom of seagrass meadows greatly correlated with seagrass meadow characteristics (e.g., biomass, richness, and canopy height of seagrass species) (Hori et al., 2009). This interesting topic merits further investigation.
The variations in fish assemblages between daytime and nighttime were reported. For example, higher species richness, abundance, and biomass of piscivorous fishes were found in nighttime in a seagrass bed of northern Japan (Tanaka et al., 2018). Some piscivorous fishes, Eleginus gracilis (Gadidae), Sebastes schlegelii (Sebastidae), and Myoxocephalus brandtii (Cottidae), swam to seagrass habitats from adjacent ecosystems for feeding in the night and consequently increased the predation risk for small fishes in seagrass beds (Tanaka et al., 2018). A higher proportion of large individuals were collected using seine nets in nighttime compared to that in the daytime in Zostera capricorni seagrass habitats in Moreton Bay, Australia (Guest et al., 2003). In the seagrass habitats dominated by T. testudinum in the coast of Quintana Roo, Mexico, higher fish abundance and species richness were collected in daytime using visual surveys (Yeager and Arias-Gonzalez, 2008). In this study, dominant species, H. trimaculatus, S. bandanensis, and S. strigiventer, all from Labridae, contributed most to the variations of fish assemblages in the daytime at the West Sand, all feeding on benthic invertebrates (e.g., crustaceans, mollusks, polychaetes). The comparison of fish assemblages between daytime and nighttime needs to be taken into account in future studies.
Ecological services of seagrass meadows
This study documented the importance of seagrass meadows at the West Sand as fish nursery grounds. A high number of juvenile fishes were detected in seagrass meadows of the West Sand; i.e., approximately 99.80% and 93.70% individuals were juveniles using BS and UVC methods, respectively. Moreover, 80.36% and 46.13% of total individuals collected by BS and UVC methods were earlier-stage juveniles, less than half the sizes of their TLm, respectively. Three dominant fish species, H. trimaculatus, S. bandanensis, and S. strigiventer, were realized to be primarily dominant with the major proportion of juveniles <5 cm TL. In a previous study using the UVC method in the lagoon, the coral reef habitat, between the West Sand and Zhaoshu Island with a water depth of 2–5 m, H. trimaculatus was also one of the dominant species, with some individuals beyond the size of sexual maturity based on the external morphology (Yang et al., 2018, data not shown). H. trimaculatus was, however, not a dominant species outside the lagoon, the same coral reef habitat, with 9–12 m in depth (Yang et al., 2018).
The fish nursery function of seagrass meadows has raised attention (Nordlund et al., 2018; Fulton et al., 2020). For example, 83.23% juveniles of H. trimaculatus collected from the seagrass and seaweed beds in New Caledonia were of small sizes, i.e., 1/3 to 2/3 of their TLm (Mellin et al., 2007). In the northern Sulawesi, Indonesia, over 93% individuals sampled from the seagrass meadows using the BS method were juveniles (Du et al., 2018). Using the UVC method, Moussa et al. (2020) reported that 73% of the observed individual fishes were juveniles in the seagrass beds at the coast of Mayotte Island, Indian Ocean. Gerard et al. (2015) showed that about 98% of Lutjanus griseus juveniles inhabited seagrass habitats based on carbon- and nitrogen-stable isotope and otolith analyses.
Other ecological services of seagrass meadow, such as breeding grounds and foraging grounds, were also reported. In Liusha Bay, southern China, Stethojulis trilineata laid their eggs on the entire leaf of H. ovalis and primarily fed on seagrass in winter, indicating the important spawning and early life stage feeding roles of seagrass for fishes (Jiang et al., 2020). In Plaridel and Laguindingan, the Philippines, at least 17 species foraged in seagrass beds with rising tides (Espadero et al., 2020). Fishes are also beneficial to seagrass habitats through their ecological niche, especially in the transportation of nutrients and energy between different habitats and ecosystems (Burkepile et al., 2013). These ecological services mentioned above may be also provided by seagrass meadows around the West Sand and could be analyzed in subsequent research studies.
Conclusions
The status of seagrass meadows and its association with fish assemblages in the South China Sea have been largely unknown. In this study, we applied for the first time two complementary methods (non-destructive method: UVC; destructive method: BS) to analyze fish assemblages in seagrass meadows at the West Sand. Our results revealed that more than 90% of the fish samples were undersized at sexual maturation, and most of them (about 80% by the BS method and 46% by the UVC method) were smaller juveniles (i.e., less than half the sizes of their TLm). Fish assemblage data collected from BS and UVC methods were significantly different. However, both methods have detected Labridae as the dominant group; the three dominant species, H. trimaculatus, S. bandanensis, and S. strigiventer, were nearly all juveniles. High correlations were detected between fish assemblage and seagrass coverages from both BS and UVC methods. The significant spatial difference in fish assemblage among areas A−D was mainly driven by the spatial variations in the density of dominant species. Our results support the ecological importance of seagrass meadows as nursery grounds for coral reef fishes. The roles of seagrass meadows as fish spawning grounds and the habitat shifts from seagrass meadows to nearby coral reefs with the developmental life stages merit further evaluation.
Data Availability Statement
The datasets presented in this study can be found in online repositories. The names of the repository/repositories and accession number(s) can be found below: NCBI [accession: MZ539887–MZ539934].
Ethics Statement
The animal study was reviewed and approved by Sansha Civil Government of Hainan Province, China.
Author Contributions
Q-qR wrote the first draft. Q-qR, PL, and ML revised the manuscript. Q-qR, QX, J-hW, and ML conducted fieldwork. Q-qR, PL, G-hY, QX, and ML did the data analysis. PL, MY, and J-hW performed molecular analysis. All authors contributed to the article preparation and approved the submission.
Funding
This work was supported by the Ministry of Agriculture and Rural Affairs (grant no. 171821301354051007) and the Ministry of Forestry and Grassland Administration (grant no. 2019087033), both to ML. The funders had no role in study design, data collection and analysis, decision to publish, or preparation of the manuscript.
Conflict of Interest
The authors declare that the research was conducted in the absence of any commercial or financial relationships that could be construed as a potential conflict of interest.
Publisher’s Note
All claims expressed in this article are solely those of the authors and do not necessarily represent those of their affiliated organizations, or those of the publisher, the editors and the reviewers. Any product that may be evaluated in this article, or claim that may be made by its manufacturer, is not guaranteed or endorsed by the publisher.
Acknowledgments
The authors thank J-h Song, W-d Yang, B-a Lin and Y. Jiang for field and lab assistance. The field works were approved by Sansha Civil Government of Hainan Province and by Xiamen University, China.
Supplementary Material
The Supplementary Material for this article can be found online at: https://www.frontiersin.org/articles/10.3389/fenvs.2021.765702/full#supplementary-material
References
Allen, G. R., Steene, R., Humann, P., and Deloach, N. (2015). Reef Fish Identification: Tropical Pacific. 2nd edition. USA, Floroda: New World Publications Incorporated.
Anderson, M. J. (2005). Permanova: A FORTRAN Computer Program for Permutational Multivariate Analysis of Variance, 26. New Zealand: Department of Statistics, University of Auckland, 32–46.
Baker, D. G. L., Eddy, T. D., McIver, R., Schmidt, A. L., Thériault, M.-H., Boudreau, M., et al. (2016). Comparative Analysis of Different Survey Methods for Monitoring Fish Assemblages in Coastal Habitats. PeerJ 4, e1832. doi:10.7717/peerj.1832
Berkström, C., Eggertsen, L., Goodell, W., Cordeiro, C. A. M. M., Lucena, M. B., Gustafsson, R., et al. (2020). Thresholds in Seascape Connectivity: The Spatial Arrangement of Nursery Habitats Structure Fish Communities on Nearby Reefs. Ecography 43 (6), 882–896. doi:10.1111/ecog.04868
Bortone, S. A., Kimmel, J. J., and Bundrick, C. M. (1989). A Comparison of Three Methods for Visually Assessing Reef Fish Communities: Time and Area Compensated. Negs 10 (2), 85–96. doi:10.18785/negs.1002.02
Burkepile, D. E., Allgeier, J. E., Shantz, A. A., Pritchard, C. E., Lemoine, N. P., Bhatti, L. H., et al. (2013). Nutrient Supply from Fishes Facilitates Macroalgae and Suppresses Corals in a Caribbean Coral Reef Ecosystem. Sci. Rep. 3, 1493. doi:10.1038/srep01493
de los Santos, C. B., Krause-Jensen, D., Alcoverro, T., Marbà, N., Duarte, C. M., van Katwijk, M. M., et al. (2019). Recent Trend Reversal for Declining European Seagrass Meadows. Nat. Commun. 10 (1), 3356. doi:10.1038/s41467-019-11340-4
Clarke, K., and Green, R. (1988). Statistical Design and Analysis for a 'Biological Effects' Study. Mar. Ecol. Prog. Ser. 46, 213–226. doi:10.3354/meps046213
Clarke, K. R. (1993). Non-Parametric Multivariate Analyses of Changes in Community Structure. Austral Ecol. 18 (1), 117–143. doi:10.1111/j.1442-9993.1993.tb00438.x
Connolly, R. M. (1994). Removal of Seagrass Canopy: Effects on Small Fish and Their Prey. J. Exp. Mar. Biol. Ecol. 184 (1), 99–110. doi:10.1016/0022-0981(94)90168-6
Costa, A. C. P., Garcia, T. M., Paiva, B. P., Ximenes Neto, A. R., and Soares, M. d. O. (2020). Seagrass and Rhodolith Beds Are Important Seascapes for the Development of Fish Eggs and Larvae in Tropical Coastal Areas. Mar. Environ. Res. 161, 105064. doi:10.1016/j.marenvres.2020.105064
Cullen-Unsworth, L., and Unsworth, R. (2013). Seagrass Meadows, Ecosystem Services, and Sustainability. Environ. Sci. Pol. Sustain. Dev. 55 (3), 14–28. doi:10.1080/00139157.2013.785864
Du, J., Wang, Y., Peristiwady, T., Liao, J., Makatipu, P. C., Huwae, R., et al. (2018). Temporal and Spatial Variation of Fish Community and Their Nursery in a Tropical Seagrass Meadow. Acta Oceanol. Sin. 37 (12), 63–72. doi:10.1007/s13131-018-1288-z
Du, J., Hu, W., Nagelkerken, I., Sangsawang, L., Loh, K. H., Ooi, J. L.-S., et al. (2020). Seagrass Meadows Provide Multiple Benefits to Adjacent Coral Reefs through Various Microhabitat Functions. Ecosyst. Health Sustainability 6 (1), 1812433. doi:10.1080/20964129.2020.1812433
Edgar, G. J., Barrett, N. S., and Morton, A. J. (2004). Biases Associated with the Use of Underwater Visual Census Techniques to Quantify the Density and Size-Structure of Fish Populations. J. Exp. Mar. Biol. Ecol. 308 (2), 269–290. doi:10.1016/j.jembe.2004.03.004
Espadero, A. D. A., Nakamura, Y., Uy, W. H., Tongnunui, P., and Horinouchi, M. (2020). Tropical Intertidal Seagrass Beds: An Overlooked Foraging Habitat for Fishes Revealed by Underwater Videos. J. Exp. Mar. Biol. Ecol. 526, 151353. doi:10.1016/j.jembe.2020.151353
Espadero, A. D. A., Nakamura, Y., Uy, W. H., and Horinouchi, M. (2021). Tropical Intertidal Seagrass Beds as Fish Habitat: Similarities between Fish Assemblages of Intertidal and Subtidal Seagrass Beds in the Philippines. Estuarine, Coastal Shelf Sci. 251, 107245. doi:10.1016/j.ecss.2021.107245
Fang, H., and Lv, X. (2019). Reef Fishes Indentification of Nansha Islands. China, Qingdao: China Ocean University Press.
Franco, A., Malavasi, S., Zucchetta, M., Franzoi, P., and Torricelli, P. (2006). Environmental Influences on Fish Assemblage in the Venice Lagoon, Italy. Chem. Ecol. 22 (Suppl. 1), S105–S118. doi:10.1080/02757540600571836
French, B., Wilson, S., Holmes, T., Kendrick, A., Rule, M., and Ryan, N. (2021). Comparing Five Methods for Quantifying Abundance and Diversity of Fish Assemblages in Seagrass Habitat. Ecol. Indic. 124 (4), 107415. doi:10.1016/j.ecolind.2021.107415
Fu, L. (2014). Coral Reef Fishes of the Southern China Sea: The Xisha, Nansha and Zhongsha Islands. China Beijing: China Citic Press.
Fulton, C. J., Berkström, C., Wilson, S. K., Abesamis, R. A., Bradley, M., Åkerlund, C., et al. (2020). Macroalgal Meadow Habitats Support Fish and Fisheries in Diverse Tropical Seascapes. Fish Fish 21 (4), 700–717. doi:10.1111/faf.12455
Galaiduk, R., Radford, B. T., and Harvey, E. S. (2018). Utilizing Individual Fish Biomass and Relative Abundance Models to Map Environmental Niche Associations of Adult and Juvenile Targeted Fishes. Sci. Rep. 8 (1), 9457. doi:10.1038/s41598-018-27774-7
Gerard, T., Malca, E., Muhling, B. A., Mateo, I., and Lamkin, J. T. (2015). Isotopic Signatures in the Otoliths of Reef-Associated Fishes of Southern Florida: Linkages Between Nursery Grounds and Coral Reefs. Reg. Stud. Mar. Sci. 2, 95–104. doi:10.1016/j.rsma.2015.08.014
Guest, M. A., Connolly, R. M., and Loneragan, N. R. (2003). Seine Nets and Beam Trawls Compared by Day and Night for Sampling Fish and Crustaceans in Shallow Seagrass Habitat. Fish. Res. 64 (2-3), 185–196. doi:10.1016/s0165-7836(03)00109-7
Gullström, M., Bodin, M., Nilsson, P., and Öhman, M. (2008). Seagrass Structural Complexity and Landscape Configuration as Determinants of Tropical Fish Assemblage Composition. Mar. Ecol. Prog. Ser. 363, 241–255. doi:10.3354/meps07427
Halpern, B. S., Walbridge, S., Selkoe, K. A., Kappel, C. V., Micheli, F., D'Agrosa, C., et al. (2008). A Global Map of Human Impact on Marine Ecosystems. Science 319 (5865), 948–952. doi:10.1126/science.1149345
Harmelin-Vivien, M. L., and Francour, P. (1992). Trawling or Visual Censuses? Methodological Bias in the Assessment of Fish Populations in Seagrass Beds. Mar. Ecol. 13 (1), 41–51. doi:10.1111/j.1439-0485.1992.tb00338.x
Heck, K. L., Hays, G., and Orth, R. J. (2003). Critical Evaluation of the Nursery Role Hypothesis for Seagrass Meadows. Mar. Ecol. Prog. Ser. 253, 123–136. doi:10.3354/meps253123
Honda, K., Nakamura, Y., Nakaoka, M., Uy, W. H., and Fortes, M. D. (2013). Habitat Use by Fishes in Coral Reefs, Seagrass Beds and Mangrove Habitats in the Philippines. PLoS One 8 (8), e65735. doi:10.1371/journal.pone.0065735
Hori, M., Suzuki, T., Monthum, Y., Srisombat, T., Tanaka, Y., Nakaoka, M., et al. (2009). High Seagrass Diversity and Canopy-Height Increase Associated Fish Diversity and Abundance. Mar. Biol. 156 (7), 1447–1458. doi:10.1007/s00227-009-1184-3
Horinouchi, M., Nakamura, Y., and Sano, M. (2005). Comparative Analysis of Visual Censuses Using Different Width Strip-Transects for a Fish Assemblage in a Seagrass Bed. Estuarine, Coastal Shelf Sci. 65 (1-2), 53–60. doi:10.1016/j.ecss.2005.05.003
Huang, X., Huang, L., Li, Y., Xu, Z., Fong, C. W., Huang, D., et al. (2006). Main Seagrass Beds and Threats to Their Habitats in the Coastal Sea of South China. Chin. Sci. Bull. 51 (2), 136–142. doi:10.1007/s11434-006-9136-5
Huang, H., Dong, Z., and Lian, J. (2008). Establishment of Nature Reserve of Coral Reef Ecosystem on the Xisha Islands. Trop. Geogr. 28 (6), 540–544. [in Chinese with English abstract]. doi:10.13284/j.cnki.rddl.001090
Huang, X., Jiang, Z., Fan, H., Chen, X., Zhou, Y., Zhang, J., et al. (2016). The Nomenclature of the "Algae" Name of Seagrasses in China. Oceanol. Et Limnol. Sin. 47 (1), 290–294. [in Chinese with English abstract]. doi:10.11693/hyhz20150200052
Hyndes, G. A., Kendrick, A. J., MacArthur, L. D., and Stewart, E. (2003). Differences in the Species- and Size-Composition of Fish Assemblages in Three Distinct Seagrass Habitats with Differing Plant and Meadow Structure. Mar. Biol. 142 (6), 1195–1206. doi:10.1007/s00227-003-1010-2
Ivanova, N. V., Dewaard, J. R., and Hebert, P. D. N. (2006). An Inexpensive, Automation-Friendly Protocol for Recovering High-Quality DNA. Mol. Ecol. Notes 6 (4), 998–1002. doi:10.1111/j.1471-8286.2006.01428.x
Jia, Y., Wang, J., Balazs, G. H., and Liu, M. (2019). Nest Productivity for Green Turtles (Chelonia mydas) at Qilianyu of Xuande Islands, South China Sea, P.R. China: Preliminary Findings. Chelonian Conserv. Biol. 18 (1), 116–120. doi:10.2744/CCB-1307.1
Jiang, Z., Huang, D., Fang, Y., Cui, L., Zhao, C., Liu, S., et al. (2020). Home for Marine Species: Seagrass Leaves as Vital Spawning Grounds and Food Source. Front. Mar. Sci. 7, 194. doi:10.3389/fmars.2020.00194
Larkum, A. W. D., McComb, A. J., and Shephard, S. A. (1989). Biology of Seagrasses: A Treatise on the Biology of Seagrasses with Special Reference to the Australian Region. Amsterdam: Elsevier.
Lundquist, C. J., Jones, T. C., Parkes, S. M., and Bulmer, R. H. (2018). Changes in Benthic Community Structure and Sediment Characteristics after Natural Recolonisation of the Seagrass Zostera muelleri. Sci. Rep. 8 (1), 13250. doi:10.1038/s41598-018-31398-2
Mellin, C., Kulbicki, M., and Ponton, D. (2007). Seasonal and Ontogenetic Patterns of Habitat Use in Coral Reef Fish Juveniles. Estuarine, Coastal Shelf Sci. 75 (4), 481–491. doi:10.1016/j.ecss.2007.05.026
Madi Moussa, R., Bertucci, F., Jorissen, H., Gache, C., Waqalevu, V. P., Parravicini, V., et al. (2020). Importance of Intertidal Seagrass Beds as Nursery Area for Coral Reef Fish Juveniles (Mayotte, Indian Ocean). Reg. Stud. Mar. Sci. 33, 100965. doi:10.1016/j.rsma.2019.100965
Nagelkerken, I., Roberts, C., Van Der Velde, G., Dorenbosch, M., Van Riel, M., Cocheret de la Morinière, E., et al. (2002). How Important Are Mangroves and Seagrass Beds for Coral-Reef Fish? The Nursery Hypothesis Tested on an Island Scale. Mar. Ecol. Prog. Ser. 244, 299–305. doi:10.3354/meps244299
Nakamura, Y., Hirota, K., Shibuno, T., and Watanabe, Y. (2012). Variability in Nursery Function of Tropical Seagrass Beds during Fish Ontogeny: Timing of Ontogenetic Habitat Shift. Mar. Biol. 159 (6), 1305–1315. doi:10.1007/s00227-012-1911-z
Nelson, J. S., Grande, T. C., and Wilson, M. V. H. (2016). Fishes of the World. Hoboken, New Jersey: John Wiley & Sons.
Nordlund, L. M., Unsworth, R. K. F., Gullström, M., and Cullen-Unsworth, L. C. (2018). Global Significance of Seagrass Fishery Activity. Fish Fish 19 (3), 399–412. doi:10.1111/faf.12259
Orth, R. J., Lefcheck, J. S., McGlathery, K. S., Aoki, L., Luckenbach, M. W., Moore, K. A., et al. (2020). Restoration of Seagrass Habitat Leads to Rapid Recovery of Coastal Ecosystem Services. Sci. Adv. 6 (41), eabc6434. doi:10.1126/sciadv.abc6434
Park, J. M., and Kwak, S. N. (2018). Seagrass Fish Assemblages in the Namhae Island, Korea: The Influences of Seagrass Vegetation and Biomass. J. Sea Res. 139, 41–49. doi:10.1016/j.seares.2018.06.007
Parsons, D. M., MacDonald, I., Buckthought, D., and Middleton, C. (2018). Do Nursery Habitats Provide Shelter from Flow for Juvenile Fish? PLoS One 13 (1), e0186889. doi:10.1371/journal.pone.0186889
Pinkas, L., Oliphant, M. S., and Iverson, I. L. K. (1971). Food Habits of Albacore, Bluefin Tuna, and Bonito in California Waters. Fish Bull. 152, 1–105. State of Califaria, The Resources Agency, Department of Fish and Game.
Saleh, A., Laradji, I. H., Konovalov, D. A., Bradley, M., Vazquez, D., and Sheaves, M. (2020). A Realistic Fish-Habitat Dataset to Evaluate Algorithms for Underwater Visual Analysis. Sci. Rep. 10 (1), 14671. doi:10.1038/s41598-020-71639-x
Sambrook, K., Hoey, A. S., Andréfouët, S., Cumming, G. S., Duce, S., and Bonin, M. C. (2019). Beyond the Reef: The Widespread Use of Non‐reef Habitats by Coral Reef Fishes. Fish Fish 20 (5), 903–920. doi:10.1111/faf.12383
Shi, Y., Fan, H., Cui, X., Pan, L., Li, S., and Song, X. (2010). Overview on Seagrasses and Related Research in China. Chin. J. Ocean. Limnol. 28 (2), 329–339. [in Chinese with English abstract]. doi:10.1007/s00343-010-9183-2
Short, F. T., Polidoro, B., Livingstone, S. R., Carpenter, K. E., Bandeira, S., Bujang, J. S., et al. (2011). Extinction Risk Assessment of the World's Seagrass Species. Biol. Conserv. 144 (7), 1961–1971. doi:10.1016/j.biocon.2011.04.010
Sun, Z., Zhang, H., Liu, X., Ding, J., Xu, D., and Cai, Z. (2021). Wave Energy Assessment of the Xisha Group Islands Zone for the Period 2010-2019. Energy 220, 119721. doi:10.1016/j.energy.2020.119721
Syukur, A., Wardiatno, Y., Muchsin, I., and Kamal, M. M. (2017). Threats to Seagrass Ecology and Indicators of the Importance of Seagrass Ecological Services in the Coastal Waters of East Lombok, Indonesia. Am. J. Environ. Sci. 13 (3), 251–265. doi:10.3844/ajessp.2017.251.265
Tanaka, H., Chiba, S., Yusa, T., and Shoji, J. (2018). Day-night Change in Fish Community Structure in a Seagrass Bed in Subarctic Waters. Fish. Sci. 84 (2), 275–281. doi:10.1007/s12562-017-1172-3
Unsworth, R. K. F., Nordlund, L. M., and Cullen-Unsworth, L. C. (2018). Seagrass Meadows Support Global Fisheries Production. Conserv. Lett. 12 (1), e12566. doi:10.1111/conl.12566
Ward, R. D., Zemlak, T. S., Innes, B. H., Last, P. R., and Hebert, P. D. N. (2005). DNA Barcoding Australia's Fish Species. Phil. Trans. R. Soc. B 360 (1462), 1847–1857. doi:10.1098/rstb.2005.1716
Wei, G., and Huang, G. (2020). Fish Community Structure and Species Diversity During Spring and Autumn in Xiamen Bay. J. Fish. Sci. China 28 (08), 1–12. [in Chinese with English abstract]. doi:10.12264/JFSC2020-0319
Whitfield, A. K. (2016). The Role of Seagrass Meadows, Mangrove Forests, Salt Marshes and Reed Beds as Nursery Areas and Food Sources for Fishes in Estuaries. Rev. Fish. Biol. Fish. 27 (1), 75–110. doi:10.1007/s11160-016-9454-x
Wu, L., Liu, X., Xu, L., Fu, P., Wang, X., Jin, J., et al. (2018). Paleoecology of Seabirds at Nandao, Xisha Islands, South China Sea: Sub-fossil Evidence for Ashmole's Halo during the Little Ice Age. Palaeogeogr. Palaeoclimatol. Palaeoecol. 505, 33–41. doi:10.1016/j.palaeo.2018.05.023
Yang, W., Hu, J., Lin, B., Huang, H., and Liu, M. (2018). Species Diversity of Coral Reef Fishes in Zhaoshu Island Waters, Xisha Islands. J. Xiamen Univ. (Natural Science) 57 (6), 819–826. [in Chinese with English abstract]. doi:10.6043/j.issn.0438-0479.201807002
Yeager, L. A., and Arias-Gonzalez, J. E. (2008). Preliminary Survey of Fish Community Composition in Seagrass Habitat in Two Back-Reef Lagoons of the Southern Mexican Caribbean. Gulf Caribbean Res. 20 (1), 41–47. doi:10.18785/gcr.2001.06
Keywords: beach seine, underwater visual census, juvenile fish, nursery ground, species composition, vegetative habitat, Xisha islands
Citation: Ren Q-q, Leung PTY, Xu Q, Yan M, Yang G-h, Wei J-h and Liu M (2022) Fish Assemblages in Subtidal Seagrass Meadows Surrounding the West Sand, South China Sea. Front. Environ. Sci. 9:765702. doi: 10.3389/fenvs.2021.765702
Received: 27 August 2021; Accepted: 27 December 2021;
Published: 15 February 2022.
Edited by:
Changliang Ke, Chinese Academy of Fishery Sciences (CAFS), ChinaReviewed by:
Xiaofeng Huang, Yangtze University, ChinaDingtian Yang, South China Sea Institute of Oceanology (CAS), China
Copyright © 2022 Ren, Leung, Xu, Yan, Yang, Wei and Liu. This is an open-access article distributed under the terms of the Creative Commons Attribution License (CC BY). The use, distribution or reproduction in other forums is permitted, provided the original author(s) and the copyright owner(s) are credited and that the original publication in this journal is cited, in accordance with accepted academic practice. No use, distribution or reproduction is permitted which does not comply with these terms.
*Correspondence: Min Liu, minliuxm@xmu.edu.cn