CALIPSO Aerosol-Typing Scheme Misclassified Stratospheric Fire Smoke: Case Study From the 2019 Siberian Wildfire Season
 Albert Ansmann
 Kevin Ohneiser1
  Holger Baars
- 1Leibniz Institute for Tropospheric Research (TROPOS), Leipzig, Germany
- 2Porter School of Environment and Earth Sciences, Tel-Aviv University, Tel Aviv, Israel
In August 2019, a 4-km thick wildfire smoke layer was observed in the lower stratosphere over Leipzig, Germany, with a ground-based multiwavelength Raman lidar. The smoke was identified by the smoke-specific spectral dependence of the extinction-to-backscatter ratio (lidar ratio) measured with the Raman lidar. The spaceborne CALIPSO (Cloud-Aerosol Lidar and Infrared Pathfinder Satellite Observation) lidar CALIOP (Cloud–Aerosol Lidar with Orthogonal Polarization) detected the smoke and classified it as sulfate aerosol layer (originating from the Raikoke volcanic eruption). In this article, we discuss the reason for this misclassification. Two major sources for stratospheric air pollution were active in the summer of 2019 and complicated the CALIPSO aerosol typing effort. Besides intense forest fires at mid and high northern latitudes, the Raikoke volcano erupted in the Kuril Islands. We present two cases observed at Leipzig, one from July 2019 and one from August 2019. In July, pure volcanic sulfate aerosol layers were found in the lower stratosphere, while in August, wildfire smoke dominated in the height range up to 4–5 km above the local tropopause. In both cases, the CALIPSO aerosol typing scheme classified the layers as sulfate aerosol layers. The aerosol identification algorithm assumes non-spherical smoke particles in the stratosphere as consequence of fast lifting by pyrocumulonimbus convection. However, we hypothesize (based on presented simulations) that the smoke ascended as a results of self-lifting and reached the tropopause within 2–7 days after emission and finally entered the lower stratosphere as aged spherical smoke particles. These sphercial particles were then classified as liquid sulfate particles by the CALIPSO data analysis scheme. We also present a successful case of smoke identification by the CALIPSO retrieval method.
1 Introduction
In the summer of 2019, the Raikoke volcano in the Kuril Islands (48.3°N, 153.3°E, see map in Figure 1) erupted and emitted ash and volcanic gases over the North Pacific (Kloss et al., 2021; Vaughan et al., 2021). It was expected that the conversion of the volcanic sulfur dioxide (SO2) plumes injected into the stratosphere during the eruptions on June 21–22 2019 will lead to an increasing amount of layers of sulfuric-acid-containing water droplets over the following 4–6 weeks. The maximum of the volcanically induced stratospheric perturbation was predicted to occur in mid August 2019 and afterwards a slow decay over the following months should be observable at mid to high northern latitudes. The thin aerosol layers, detected with lidar over the United Kingdom between 13 and 22 km height in July 2019 (Osborne et al., 2021; Vaughan et al., 2021), were clear indications for the steadily increasing and developing stratospheric sulfate aerosol burden. Maximum values of the sulfate-related aerosol optical thickness (AOT) of 0.025 at 500 nm were expected, about 20% higher than observed after the eruption of the neighbor volcano Sarychev which erupted in June 2009 (Haywood et al., 2010; Mattis et al., 2010).
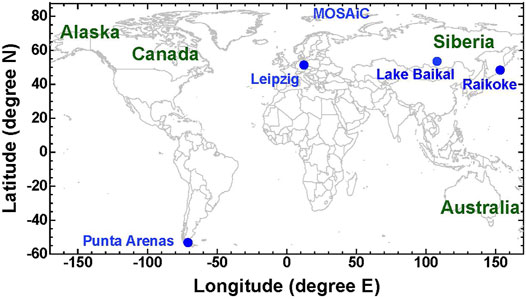
FIGURE 1. Map showing the ground-based lidar stations at Leipzig and Punta Arenas, Lake Baikal (circle indicates coordinates of lake center), the High Arctic MOSAiC measurement area, and the location of the Raikoke volcano in the Kuril Islands. Strong wildfires occurred at mid to high northern latitudes in Alaska, Canada, and Siberia in 2019 and in southeast Australia in December 2019 and January 2020.
The situation became complicated in the summer and autumn of 2019 by the strong wildfire activity at high northern latitudes (Alaska, Canada, Siberia, Figure 1). Especially the enormous, record-breaking wildfires in central and eastern Siberia, with the most intensive fire period from July 19 to August 14, 2019 (Johnson et al., 2021; Ohneiser et al., 2021), are assumed to be responsible for an increase of the stratospheric AOT towards 0.1 as observed with Raman lidar over Leipzig in August 2019, Germany, and in the High Arctic during the MOSAiC (Multidisciplinary drifting Observatory for the Study of Arctic Climate) expedition (Engelmann et al., 2021; Ohneiser et al., 2021) in autumn 2019. High tropospheric smoke AOTs, partly exceeding 3, prevailed over large areas (millions of hectars) in the central-eastern Siberia, north and northeast of Lake Baikal for several weeks in July and August. As discussed by Ohneiser et al. (2021), favorable conditions were given for the initiation of self-lifting processes (Boers et al., 2010) which caused a slow ascent of smoke layers up to the UTLS (upper tropospheric and lower stratospheric) height range within several days.
Disregarding these complex stratospheric aerosol conditions with simultaneously occurring volcanic and smoke layers in the late summer, autumn and winter of 2019, the Cloud-Aerosol Lidar and Infrared Pathfinder Satellite Observation (CALIPSO) lidar CALIOP (Cloud–Aerosol Lidar with Orthogonal Polarization) (Winker et al., 2009) classified most of the detected stratospheric aerosol layers as sulfate aerosol layers (of volcanic origin). This result perhaps is not surprising because very low values of the 532 nm particle linear depolarization ratio PLDR were measured with CALIOP, suggesting the presence of spherical, liquid sulfuric-acid-containing water droplets (Kim et al., 2018). The CALIPSO aerosol-typing scheme for stratospheric aerosol assumes that wildfire smoke particles are non-spherical, in contrast to volcanic sulfate droplets, and thus cause significantly enhanced particle linear depolarization ratios (PLDR from 0.075 to 0.15 at 532 nm, see details in Section 2). The typing method assumes that freshly emitted, irregularly shaped smoke particles reach the UTLS regime exclusively by strong pyrocumulonimbus (pyroCb) convection (Fromm et al., 2010) which develops over major fire areas and lifts the smoke up to the tropopause within a rather short time period of less than 1 hour (Rodriguez et al., 2020). After reaching the stratosphere, the smoke particles remain non-spherical for a long time. However, the smoke observed in the stratosphere in August 2019 produced low depolarization ratios, and thus was obviously spherical in shape, so that the CALIPSO aerosol-typing scheme misclassified the smoke as sulfate aerosol. The reason for the occurrence of spherical smoke particles in the lower stratosphere is explained in Section 4.2.
In contrast to CALIOP, which is a dual-wavelength standard backscatter lidar, the applied ground-based multiwavelength Raman lidar (Leipzig, MOSAiC expedition) permits an unambiguous identification of smoke aerosol by measuring the extinction-to-backscatter ratio (lidar ratio) at two wavelengths (355 and 532 nm), in addition to the particle linear depolarization ratio (Haarig et al., 2018; Ohneiser et al., 2020). Aged wildfire smoke produces an unique inverse spectral behavior of the lidar ratio with a significantly larger lidar ratio at 532 nm than at 355 nm. This rather unique optical fingerprint of aged wildfire smoke (Ansmann et al., 2021) cannot be measured with a classical standard backscatter lidar such as CALIOP.
A clear identification and separation of volcanic sulfate and wildfire smoke aerosol layers is very important in the investigation of the role of atmospheric aerosols in the climate system. Sulfate and smoke particles influence climate-relevant processes in the atmosphere very differently (e.g., radiative transfer and cirrus formation). Sulfate particles do almost do not absorb solar radiation, however effectively reflect and backscatter incoming sunlight, whereas smoke particles strongly absorb sunlight. Consequently, the impact of the two aerosol types on the radiation budget is very different (McCormick et al., 1995; Hirsch and Koren, 2021). The impact of liquid sulfate particles on cirrus evolution in the tropopause region occurs via homogeneous freezing defined as the ice nucleation process in which no solid particle phase is involved. In the case of smoke particles, heterogeneous ice nucleation is the main pathway regarding the influence on cirrus formation (with organic particles as INP) (Knopf et al., 2018; Engelmann et al., 2021; Ansmann et al., 2021). Heterogeneous and homogeneous ice nucleation lead to very different ice crystal number concentrations of <50 L−1 (heterogeneous ice nucleation) compared to >500 L−1 in the case of homogeneous freezing. As a consequence, this leads to very different ice virga characteristics and seeding effects on liquid-water-containing clouds in the middle and lower troposphere. In which way the different aerosol types (liquid sulfate vs liquid, semi-glassy, or glassy smoke particles) may even influence the nucleation of particles of PSCs and ozone depletion in the stratosphere remains an open question (Ohneiser et al., 2021). Thus, a misclassification of occurring stratospheric aerosol types can produce severe artifacts in atmospheric and climate research dealing with the impact of a variety of aerosol types on climate-relevant processes.
In this paper, we compare the ground-based Raman lidar observations of stratospheric aerosol layers at Leipzig, Germany, with respective spaceborne lidar observations of the same aerosol layer during CALIPSO satellite overflights close to Leipzig (51.3°N, 12.4°E), Germany. We show that the CALIPSO aerosol-typing worked well and successfully identified the volcanic sulfate aerosol type in July 2019 (before the Siberian smoke layer entered the stratosphere) and failed in August 2019 (when smoke layers dominated in the lowest part of the stratosphere). The lidar observations of stratospheric smoke layers at Leipzig in August 2019 and later in the High Arctic during the 2019–2020 MOSAiC winter half year suggest that large parts of the northern hemisphere (mid to high latitudes) were covered by wildfire smoke layers in the second half of 2019.
The paper is organized as follows. In Section 2, we briefly describe CALIOP and the ground-based lidar instrument, the measured aerosol properties, and discuss the differences regarding the aerosol products obtained from the standard backscatter (CALIOP) and advanced Raman lidar observations. The CALIPSO aerosol typing system (Kim et al., 2018) for stratospheric aerosols is explained in Section 3. In Section 4, two contrasting cases with lidar observations in July 2019 (pure volcanic sulfate conditions) and in August 2019 (strong impact of smoke aerosol) are discussed. We also show a case of a successful identification of stratospheric smoke by the CALIPSO aerosol classification scheme in Section 4.3. A summary and concluding remarks are given in Section 5.
2 CALIOP vs. Polly: Different Aerosol Typing Options
The spaceborne lidar CALIOP is a dual-wavelength standard backscatter lidar with three measurement channels (Winker et al., 2009). The laser transmits linearely polarized laser pulses at 532 and 1,064 nm and the detectors collect the cross- and co-polarized lidar signal components at 532 nm and the total (cross + co-polarized) backscatter signal at 1,064 nm “Cross” and “co” indicate the plane of polarization orthogonal and parallel to the plane of the linear polarization of the transmitted laser pulses. Basic measurement products are the so-called attenuated backscatter coefficients at 532 and 1,064 nm and the volume linear depolarization ratio (defined here as the ratio of the cross-to-co-polarized signal component), from which the particle linear depolarization ratio can be derived (Kim et al., 2018). The height profile of the attenuated backscatter coefficient is the calibrated range-corrected and background corrected signal profile. Atmospheric light attenuation effects are not corrected. In cases with optically thin aerosol layers in the stratosphere with AOT <0.1, the attenuated backscatter coefficient is lower by up to 10% than the true backscatter coefficient. The latest status of the basic computations of the stratospheric optical properties is given in Tackett et al. (2018) and Kar et al. (2019). The particle optical properties obtained from CALIOP observations are shown in Table 1.
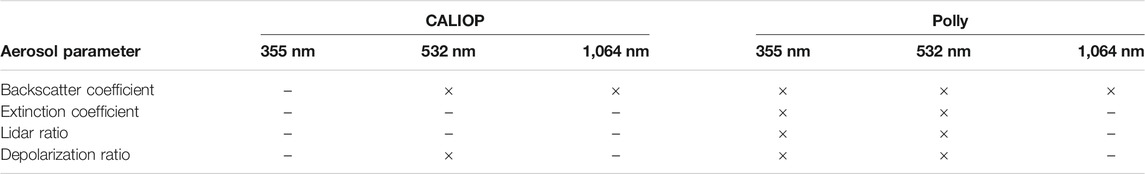
TABLE 1. Particle optical properties observable with the spaceborne dual-wavelength CALIOP (532 and 1,064 nm) and the ground-based triple-wavelength Polly (operated at Leipzig until end of August 2019 and aboard the icebreaker Polarastern since end of September 2019). Symbols × and − indicate available and missing retrievals.
The ground-based multiwavelength polarization Raman lidar Polly (POortabLe Lidar sYstem), used at Leipzig and during the MOSAiC campaign, is described in Engelmann et al. (2016). The lidar transmits linearly polarized laser pulses at 355, 532, and 1,064 nm. The receiver unit has 13 channels to collect cross-polarized signals at 355 and 532 nm, total elastic backscatter signals at 355, 532, and 1,064 nm, and inelastic (vibrational nitrogen Raman) backscatter signals at 387 nm (for the emitted wavelength of 355 nm) and at 607 nm (for the emitted wavelength of 532 nm), as well as at 407 nm (water vapor Raman signal for the emitted wavelength of 355 nm). Two telescopes (receiver sub-units) permit near-field and far-field observations. The co-polarized signal components, required to determine profiles of depolarization ratios, are obtained from the difference of the total minus the cross-polarized signal component (after careful correction of all instrumental influences on the signals) (Engelmann et al., 2016; Jimenez et al., 2020).
The lidar was operated at Leipzig, Germany, for continuous aerosol monitoring during the summer 2019 until end of August 2019, and then deployed on the German icebreaker Polarstern to participate in the MOSAiC expedition (Engelmann et al., 2016). MOSAiC was the largest Arctic research initiative in history and lasted from September 2019 to October 2020. The measurements were mostly taken between 85rcN and 88.5rcN (Figure 1).
An overview of the aerosol measurement products can be found in Baars et al. (2016) and Hofer et al. (2020a), Hofer et al. (2020b). The main and basic aerosol optical properties, derivable from the lidar observations are the particle backscatter coefficient at three wavelengths (355, 532, 1,064 nm), the particle extinction coefficient at two wavelengths (355, 532 nm), the respective extinction-to-backscatter ratio (lidar ratio) at 355 and 532 nm, and the particle linear depolarization ratio at 355 and 532 nm. To identify smoke, the most important option is the simultaneous measurement of the lidar ratio at 355 and 532 nm as will be discussed in the next section. The Raman lidar technique allows us to independently determined the particle backscatter coefficients at 355 and 532 nm (from the ratio of the total to the respective nitrogen Raman signal) and the particle extinction coefficient at 355 and 532 nm (from the 387 and 607 nm nitrogen Raman signal profiles), and thus, to obtain observed values for the extinction-to-backscatter ratio at these two wavelengths (Ansmann et al., 1992). The latest status of the computation of backscatter and extinction coefficients and lidar ratios at 355 and 532 nm for stratospheric smoke is explained in detail in Haarig et al. (2018) and Ohneiser et al. (2020), Ohneiser et al. (2021). Many measurement examples for Canadian, Australian, and Siberian smoke are shown in these publications. The Polly aerosol products are also listed in Table 1.
3 CALIPSO Aerosol Typing in the Case of Stratospheric Aerosol
The CALIPSO aerosol-typing scheme is described in Kim et al. (2018). Three different aerosol types are considered: volcanic ash, sulfate aerosol (usually of volcanic origin), and wildfire smoke. The optical properties, used to identify the prevailing aerosol type, are given in Table 2. Regarding stratopsheric wildfire smoke, the specific optical signatures used in the aerosol-typing effort were solely derived from CALIPSO observations of elevated Siberian, North American, and Australian smoke layers, detected in the upper troposphere and lower stratosphere in the years 2007 (Canadian smoke), 2009 (Australian smoke), and 2012 (Siberian smoke).
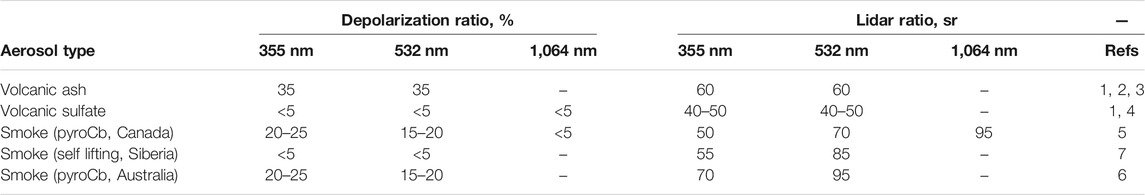
TABLE 2. Particle linear depolarization ratio and lidar ratio (extinction-to-backscatter ratio) at 355, 532, and 1,064 nm for different stratospheric aerosol types and, in the case of smoke, for different summer smoke events (Canada, 2017; Siberia, 2019; Australia, 2020). The lifting process (pyroCb activity vs self-lifting) can be identified by the depolarization ratio (sensitive to shape properties), but not by the lidar ratio (sensitive to chemical composition). The given values are taken from the literature: 1. Prata et al. (2017), 2. Groß et al. (2012), 3. Ansmann et al. (2010), 4. Mattis et al. (2010), 5. Haarig et al. (2018), 6. Ohneiser et al. (2020), 7. Ohneiser et al. (2021). The aerosol-typing scheme of Kim et al. (Kim et al., 2018) considers observations presented in 1–4. References 5–7 are not considered.
According to Kim et al. (2018), the CALIPSO aerosol-typing scheme is mainly based on the layer-integrated particle linear depolarization ratio at 532 nm (PLDR532), and the layer-integrated attenuated backscatter coefficients at 532 and 1,064 nm (AB532, AB1064) as well as the color ratio (CR1064/532), i.e., the ratio AB1064/AB532. Information about aerosol layer base and top height as well as of tropopause and temperature (from atmospheric models) is available and used in addition. In the first step, PSCs are identified by using information on latitude, month, temperature, and tropopause height. Aerosol typing is then performed in several follow-on steps: If AB532 < 0.001 sr−1, which is equivalent to an AOT of < 0.04–0.08 at 532 nm (for lidar ratios of 40–80 sr), the aerosol layer is automatically classified as sulfate layer. The depolarization ratio PLDR532 is not used. This step can already lead to a misclassification of optically thin smoke layers. If AB532 > 0.001 sr−1, which means an AOT at 532 nm > 0.04–0.08, then the depolarization ratio comes into play. If the depolarization ratio PLDR532 > 0.15, the aerosol is classified as volcanic ash. If the PLDR532 is in the range from 0.075 to 0.015, the aerosol is categorized as smoke, and if PLDR532 < 0.075, the aerosol is classified as sulfate aerosol. However, Haarig et al. (2018) and Ohneiser et al. (2020) showed that pronounced smoke layers (linked to pyroCb activity) frequently produce depolarization ratios even > 0.15 at 532 nm. On the other hand, Ohneiser et al. (2021) reported smoke layers over the high Arctic showing values of PDR532 of 0.02–0.03. So, stratospheric smoke can obviously show rather different depolarization ratio values. This variability is the reason for the misclassification.
For completeness, Kim et al., 2018) used the color ratio CR1064/532 as an additional parameter to classify smoke. However, this option was found to be not useful and will therefore not be discussed here (personal communication with M. H. Kim and J. Tackett). To conclude, for realistic backscatter Ångström exponents > 1.0 (CR1064/532 < 0.5, typical for smoke and sulfate aerosols) smoke is accurately identified only when PDR532 > 0.075 and < 0.15, if PDR532 < 0.075, the aerosol typing leads to sulfate layers and for PDR532 > 0.15 to ash layers when a significantly backscattering aerosol layer (with AOT of 0.05 at more) is detected.
4 Observations
Two contrasting cases of stratospheric aerosol observations are presented and discussed in Section 4.1 (Raikoke-related sulfate particles) and Section 4.2 (wildfire smoke). Both layers were categorized as sulfate layers. In Section 4.3, we finally discuss a case with a pryoCb-related smoke layer (Australian fires in 2020) (Ohneiser et al., 2020) which was successfully identified as fire smoke layer by the CALIPSO aerosol typing scheme.
In the following, we ignore a potential contribution of volcanic ash, emitted by the Raikoke volcano, to the stratospheric aerosol burden. The presence of non-spherical ash particles would lead to a significant increase of the depolarization ratio (PLDR > 0.2), however such an increase was not observed in July and August 2019. Vaughan et al. (2021) and Osborne et al. (2021) reported that ash layers may have reached Europe until July 3–4, 2019. Ash particles are large (mainly coarse-mode particles with sizes >1 μm) and were most likely quickly removed within a few weeks after the Raikoke eruption.
4.1 Volcanic Aerosol Layer in the Stratosphere on July 23, 2019
In Figure 2, the CALIOP observations of July 23, 2019 are shown. Volcanic sulfate aerosol was the dominant aerosol component in the stratosphere over Leipzig. Strong wildfire events and related significant lifting of smoke into the stratosphere that could have affected the lidar measurements were absent until mid of July 2019 (Kloss et al., 2021). The spaceborne lidar crossed the Leipzig latitude of 51.3°N about 450 km to the east of Leipzig (western Poland) about 75 min after midnight of July 22–23, 2019. The attenuated backscatter coefficient in Figure 2A shows aerosol structures between 9 and 16.5 km height from 35 to 70°N. The CALIPSO aerosol typing scheme classified the layer as stratospheric aerosol layer (vertical feature mask in Figure 2B), and finally as aerosol subtype 10 (sulfate aerosol) in Figure 2C because of the low particle depolarization ratio of PLDR < 0.05 (not shown here).
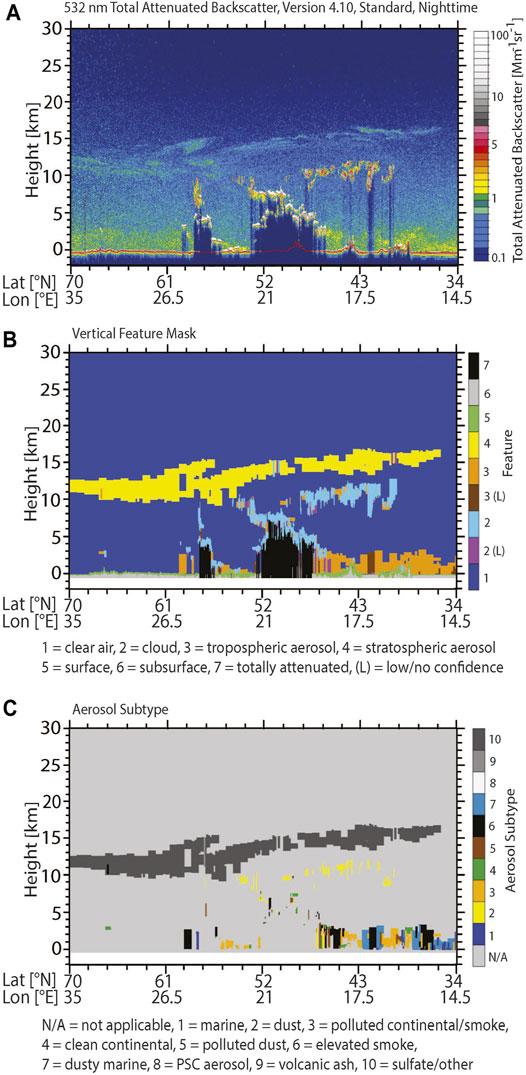
FIGURE 2. CALIOP observation of aerosol and cloud layers along the northeast-to-soutwest flight track crossing Finland, Poland, and Italy (Figure 1), about 450 km east of Leipzig on July 23, 2019, 1:02–1:17 UTC. (A) 532 nm attenuated backscatter coefficient, (B) vertical feature mask (VFM) indicating the basic layer type (aerosol or cloud layer), and (C) VFM for aerosol layers only (aerosol subtyping). The detected stratospheric aerosol layer [yellow in (B)] is correctly classified as sulfate aerosol layer [type number 10 in (C)].
This is in agreement with observations of Vaughan et al. (2021) and Osborne et al. (2021). During the first 6 weeks after the eruption on June 21–22, 2019, the emitted SO2 plumes were expected to be fully converted to sulfate aerosol (sulfuric-acid-containing water droplets) (Kloss et al., 2021). According to the lidar observations (Osborne et al., 2021; Vaughan et al., 2021), volcanic sulfate layers mainly formed in the lower stratosphere at heights < 22 km.
The aerosol-typing criteria and aerosol parameters AB532 and PLDR532 measured with CALIOP are given in Table 3. The value for AB532 was below 0.001 sr−1 and this was already sufficient to classify the aerosol as sulfate aerosol. Since AB532 is a layer-integrated quantity, the vertical extent of the detected aerosol layer as well as the backscatter intensity has an influence on the classification. Very thin layers may thus be frequently counted as sulfate layers because of a too low AB532 column backscatter value. The layer-integrated attenuated backscatter values are probably needed to guarantee a robust (less noisy) automated aerosol-typing data analysis. It should be mentioned in this context that the additional information on the backscatter color ratio CR1064/532 does not help to discriminate smoke from sulfate layers. The color ratio is typically in the range from 1/2 to 1/5 in both, sulfate and smoke cases (Jäger and Deshler, 2002; Mattis et al., 2010; Haarig et al., 2018; Ohneiser et al., 2020; Ohneiser et al., 2021).
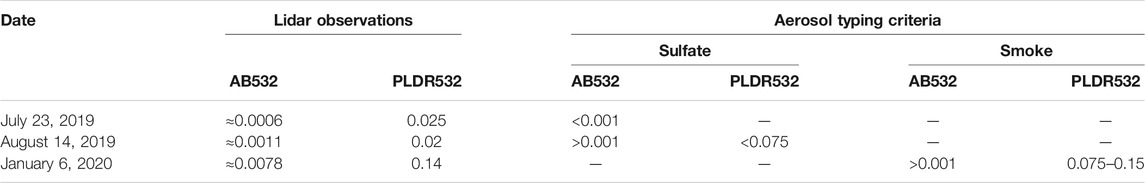
TABLE 3. CALIPSO aerosol classificiation. On 23 July and August 14, 2019, the aerosol typing criteria for sulfate aerosol were fulfilled. On January 6, 2020, smoke aerosol was successfully identified. The classification was based on mean values (lidar observations) of the 532 nm attenuated backscatter value (AB532 in sr−1) and particle linear depolarization ratio PLDR532 measured along the flight tracks within the latitudinal range from 45°–54°N and for the height range from 14 to 17 km (23 July, Figure 2), from 50°–58°N and 10.3–14.5 km height (Figure 5 August 14), and from 47°–56°N (Figure 6, January 6).
The continuously running ground-based Polly lidar at Leipzig detected the sulfate layer between 15 and 16.5 km height during the CALIPSO overflight on July 23, 2019 (in Figure 3). At lower heights, cloud layers and an optically dense haze layer reaching to about 3 km are visible and hindered optimum stratospheric observations.
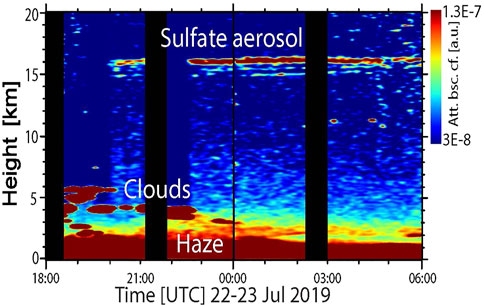
FIGURE 3. Stratospheric sulfate aerosol layer at 15–17 km height measured with ground-based lidar over Leipzig, Germany, on July 22–23, 2019. Anthropogenic haze prevailed in the lowermost 3 km. The attenuated backscatter coefficient at 1,064 nm (in arbitrary units) is shown. Black columns indicate missing observations (lidar calibration periods).
In Figure 4, profiles of the particle backscatter coefficient at three wavelengths, the layer-mean extinction coefficient and lidar ratio at 355 nm, and the layer-mean depolarization ratio at both wavelengths (355 and 532 nm) as measured during the nighttime hours are shown and compared with respective CALIOP observations of 532 and 1,064 nm particle backscatter and 532 nm depolarization ratio. The relatively low lidar ratio of 45 ± 15 sr at 355 nm and the low particle depolarization ratios of <0.03 point to non-absorbing spherical particles such as volcanic sulfate aerosols. Unfortunately, the 532 nm extinction coefficient and respective 532 nm lidar ratio could not be determined. The optical depth of the stratospheric layer was too low (about 0.01–0.015 at 532 nm estimated from the AOT of 0.025 at 355 nm and a typical Ångström exponent of 1.5) and the Raman signal profiles were too noisy because of the dense haze layers at heights below 3 km.
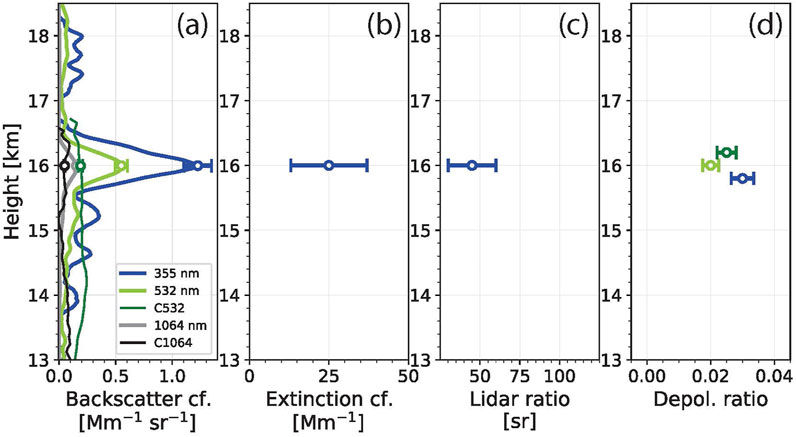
FIGURE 4. Optical properties of stratospheric sulfate particles measured with the Polly lidar at Leipzig on July 22–23, 2019, 22:45–00:15 UTC: (A) 1.5-h mean height profiles of the particle backscatter coefficient at three wavelengths, (B) respective layer-mean 355 nm particle extinction coefficient for the shallow layer from 15.5 to 16.5 km height, (C) layer-mean 355 nm lidar ratio, and (D) layer-mean particle linear depolarization ratio at 355 and 532 nm. Error bars (one standard deviation) indicate the estimated uncertainties in the observations. For comparison, mean particle backscatter coefficients (in a, C1064, C532, thin lines) and layer-mean particle depolarization ratio (in d, dark green circle) measured with CALIOP in the latitudinal band from 45–54°N (Figure 2) are shown in addition. To better see the different layer mean depolarization ratio values (all belong to 16 km height) we shifetd two of them to 15.8 and 16.2 km.
4.2 Wildfire Smoke Layer in the Stratosphere on August 14, 2019
During the last days of July and in the beginning of August 2019, the stratospheric aerosol properties over Leipzig changed and became more complex. In the lower stratosphere, a diffuse aerosol layer with base height at the tropopause and a vertical extent of several kilometers appeared. The CALIOP lidar observations of August 14, 2019 (shortly after midnight of 13–14 August) are shown in Figure 5. The satellite flew in northeast-to-southwest direction and crossed the Leipzig latitude of 51.3°N 150 km west of the city. Cirrus clouds (red spots in Figure 5A, below 10 km height, 54–65°N) indicate the local tropopause. Just above the ice clouds a coherent, but diffuse aerosol layer at latitudes >49°N is visible. Another layer at 13–15 km height extended even down to latitudes of 37°N. Further aerosol structures were found between 15 and 20 km height. Because of the low particle depolarization ratio (not shown) all stratospheric aerosol layers in Figure 5B were again classified as sulfate layers (Figure 5C). According to the CALIOP observations, a 4 km thick layer was present above the tropopause up to 14 km height from 70°N down to 48–49°N. Figure 6 shows HYSPLIT backward trajectories for this height range indicating an arrival of air masses from fire regions in North America, Alaska, and even point back to eastern Siberia. The CALIPSO flight track across Europe is also indicated in Figure 6 by a straight black line from almost north to south. According to Table 3, the aerosol was again classified as volcanic sulfate aerosol.
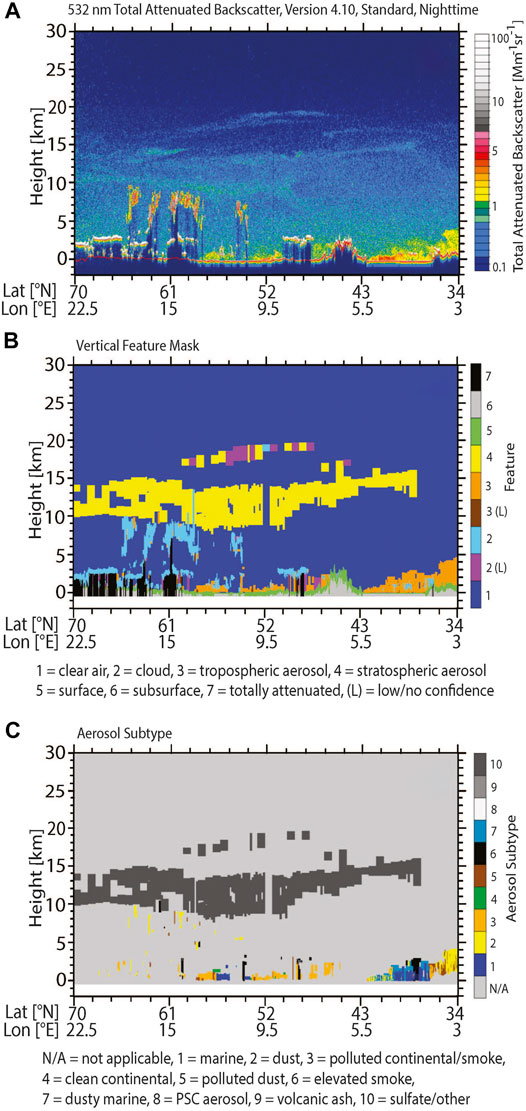
FIGURE 5. Same as Figure 2 except for the CALIOP observation along the flight track crossing Sweden, Germany, and eastern France, about 150 km west of Leipzig on August 14, 2019, 1:50–2:02 UTC. According to the CALIPSO aerosol typing a sulfate aerosol layer is present in the lower stratosphere between about 10 and 15 km height (aerosol subtype number 10 in c).
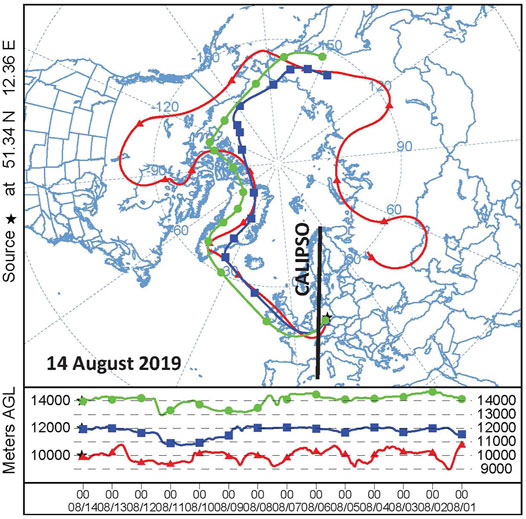
FIGURE 6. HYSPLIT 13-days backward trajectories (Stein et al., 2015; Rolph et al., 2017) for August 14, 2019, 1:00 UTC, arriving at 10 km (red), 12 km (blue) and 14 km height (green) above Leipzig (indicated by a star at 51.3°N, 12.4°E). The CALIPSO flight track of the measurements shown in Figure 5 is indicated by a straight line from northern Scandinavia to the Balearic Islands, Spain.
The time-height display of the attenuated 1,064 nm backscatter coefficient measured with the ground-based lidar is shown in Figure 7. As on July 23, 2019, a thick anthropogenic haze layer in the lower troposphere complicated the stratospheric observations. Nevertheless, the aerosol layer from the tropopause up to 14 km height is visible as well as the layer around 20 km height in agreement with the CALIOP observations.
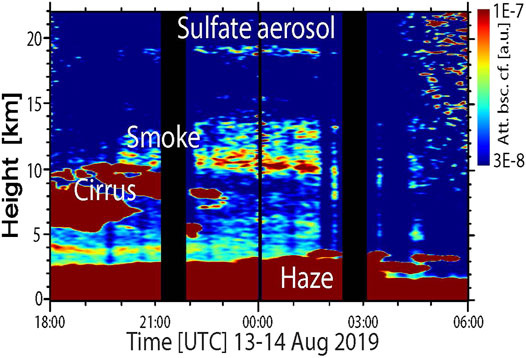
FIGURE 7. Wildfire smoke in the stratosphere between 10 and 14 km height and a volcanic sulfate aerosol layer at 19–20 km height observed with ground-based lidar over Leipzig, Germany, on August 13–14, 2019. Anthropogenic haze as well as wildfire smoke polluted the troposphere up to 7–8 km height. The attenuated backscatter coefficient at 1,064 nm (in arbitrary units) is shown. Black columns indicate missing observations (lidar calibration periods).
We used the cloud-free period from 00:00 UTC to 1:20 UTC to perform a complete data analysis for the aerosol layer located just above the tropopause. The results are shown in Figure 8. As typical for wildfire smoke (Haarig et al., 2018; Hu et al., 2019; Ohneiser et al., 2020), a pronounced wavelength dependence of the backscatter coefficient, a weak spectral behavior of the extinction coefficient, and an inverse spectral dependence of the lidar ratio (around 70 ± 10 sr at 355 nm and 95 ± 10 sr at 532 nm) was found. The inverse spectral behavior of the lidar ratio is a unique feature of aged wildfire smoke [see the reviews in Haarig et al. (2018) and Ansmann et al. (2021)] and permits the unambiguous identification of this aerosol type. The AOT at 532 nm was close to 0.09 on August 14, 2019, and thus much higher than the expected maximum Raikoke-sulfate-related AOT of 0.02–0.025 (Haywood et al., 2010; Kloss et al., 2021; Ohneiser et al., 2021). The AOT was computed by integrating the backscatter coefficients from 9.5 to 14.5 km height and multiplying this column backscatter value with a lidar ratio of 95 sr.
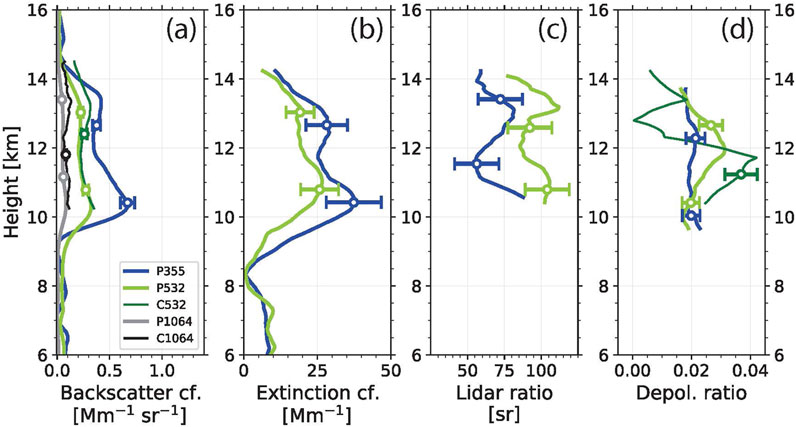
FIGURE 8. Optical properties of stratospheric wildfire smoke measured with the dual-wavelength Raman lidar Polly at Leipzig on August 14, 2019, 00:00–01:20 UTC. 80-min mean height profiles of (A) the particle backscatter coefficient at three wavelengths, (B) the particle extinction coefficient at 355 and 532 nm, (C) respective lidar ratios, and (D) of the particle linear depolarization ratio at 355 and 532 nm are shown. Vertical signal smoothing lengths of 450 m (backscatter, depolarization ratio) and 1800–2000 m (extinction, lidar ratio) are applied. Error bars (one standard deviation) indicate the estimated uncertainties. For comparison, mean particle backscatter coefficients (in a, C1064, C532, thin lines) and mean particle depolarization ratio (in d, dark green, thin line) measured with CALIOP in the latitudinal band from 50 to 58°N (Figure 5) are shown in addition.
The misclassification of the smoke aerosol by the CALIPSO aerosol typing retrieval is related to the fact that such a case of non-depolarizing smoke particles in the stratosphere is not considered in the data analysis algorithm which was developed in the years before 2018. Polarization lidar observations of spherical smoke particles in the stratosphere with an obviously perfect core-shell structure have only recently be discussed in the literature (Ohneiser et al., 2021). This does not mean that such layers did not occur before. These layers were simply not identified as smoke layers in the numerous backscatter lidar observations around the world. Low depolarization ratios were interpreted as clear indication for sulfate aerosol layers. All polarization lidar observations of wildfire smoke showed enhanced depolarization ratios in stratospheric smoke layers (around 0.2 at 355 nm, 0.15 at 532 nm, < 0.05 at 1,064 nm) (Haarig et al., 2018; Hu et al., 2019; Ohneiser et al., 2020) so that this depolarization feature (PLDR from 0.075 to 0.15) was implemented in the CALIPSO aerosol typing scheme as indicator for smoke. Additional observations of the spectral dependence of the lidar ratio with multiwavelength Raman lidars in UTLS smoke plumes have never been performed before August 2017 (Haarig et al., 2018).
An attempt to explain the more complex light-depolarizing features of smoke was undertaken by Ohneiser et al. (2021). Briefly summarized, all stratospheric cases with enhanced smoke depolarization ratios are obviously related to pryoCb convection which causes fast lifting of smoke within 30–120 min towards the tropopause region. Within this short time period the development of a spherical core-shell structure of the emitted non-spherical smoke particles seems to be not possible with the consequence that the depolarization ratio is clearly enhanced (Gialitaki et al., 2020). In contrast to the fast pyroCb-related lifting, the self-lifting-related ascent of smoke triggered by strong absorption of solar radiation by the black and brown-carbon-containing smoke particles and heating of the smoke-containing air is slow and lasts over several days before the smoke-polluted air parcels reach the tropopause region. During the relatively long residence time in the humid troposphere, substantial smoke aging can take place (condensation of gases on the smoke particles, coagulation, development of a core-shell structure) (Ansmann et al., 2021) with the result that the particles get spherical in shape so that the measured PLDR < 0.05 before they reach the UTLS height range.
We hypothesize that such a self-lifting event occurred over central-eastern Siberia in the second half of July 2019 (Figure 1) and that the changes in the stratospheric aerosol structures at the end of July and in the beginning of August 2019 observed over Leipzig were related to the severe and rather strong wildfires in Siberia from July 19, 2019 to August 14, 2019 (Johnson et al., 2021; Ohneiser et al., 2021). Figure 9 shows smoke AOTs (averaged over 1 month) for the most important burning area which was located north and northeast of Lake Baikal (indicated by an oval-shaped symbol in Figure 9). The steady increase of the daily mean AOT from 0.25 (on 20 July) to 2.7 (on 27 July), as observed with MODIS (Moderate Resolution Imaging Spectroradiometer) was related to rather stagnant conditions with weak winds over the main fire area over days up to lower stratospheric heights. These conditions probably favored the development of smoke plume self-lifting (Boers et al., 2010), in which the black smoke absorbed Sun light, warmed the ambient air in the smoke layer, which then started to ascend.
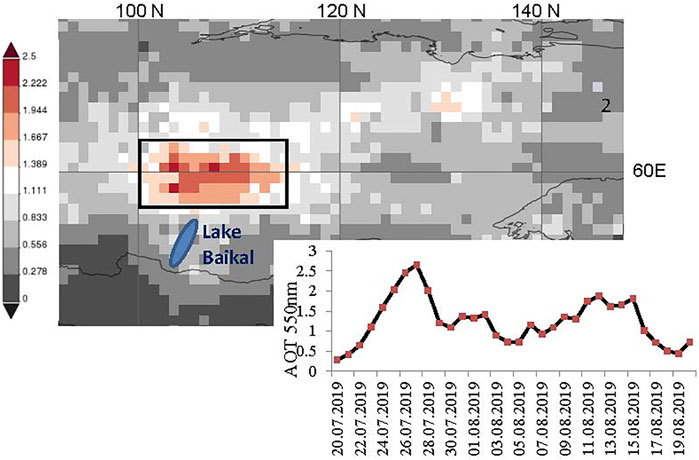
FIGURE 9. Monthly mean AOT (MODIS, 550 nm, July 20–August 20, 2019) resulting from intense Siberian wildfires north and northeast of Lake Baikal (indicated by a blue oval symbol) and time series of daily mean smoke AOT for the indicated rectangular box. The figure is taken from Ohneiser et al. (2021).
We used the radiative transfer model ecRAD (Hogan and Bozzo, 2018) to compute heating rates and subsequently ascent rates as a function of these heating rates for given potential temperature gradients (Boers et al., 2010). In Figure 10, a smoke layer (with Gaussian shape in terms of light extinction profile) initially centered at 4 km height was simulated. The daily course of the Sun for summertime conditions at 65°N was considered. The black-carbon (BC) fraction was set to 15, 7.5 and 5% during the first 12 h, the next 12 h, and for the rest of the simulation period, respectively, to roughly consider particle aging during the first 24–36 h after injection. For simplicity, we used the layer mean heating rate together with the potential temperature gradient (radiosonde, Olenek, Siberia, July-August mean temperature profile) to compute the lifting rates. More details are given in Ohneiser et al. (2021).
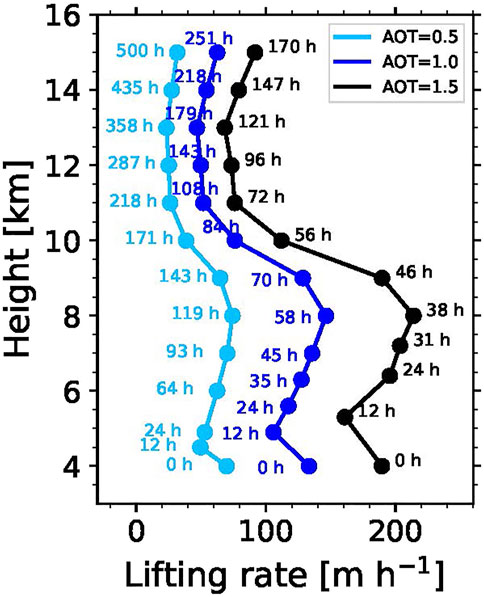
FIGURE 10. Simulation of self-lifting of Siberian wildfire smoke (injected to 3–5 km height). The 532 nm AOT of the 2-km thick smoke layer, initially centered at 4 km height, was assumed to be 0.5, 1.0, and 1.5. Cloudfree conditions are simulated. Smoke was able to reach heights of 10 km within about 2–7 days (indicated by the hours after ascent start) according to these simulations. Even under stable stratopsheric conditions further slow ascent by smoke is possible.
According to the simulations in Figure 10, lifting may last over days (2–7 days) before the smoke reaches the tropopause. The lifting speed decreases significantly in the stratosphere. After reaching the UTLS region a spread of the aerosol over the northern hemisphere, especially at latitudes >50°N, is very likely, as we know from the spread of the smoke originating from the severe Canadian fires in 2017 (Ansmann et al., 2018; Khaykin et al., 2018; Baars et al., 2019).
According to the HYSPLIT backward trajectories in Figure 6 the smoke from Siberia needed about 13–18 days from the Siberian fire places to central Europe. The smoke detected on August 14, 2019 may have been lifted over Siberia between 23 and 30 July before the long-range transport around the globe began. This smoke obviously covered the entire Arctic for a long time. During the Arctic expedition MOSAiC we observed the smoke layer until the polar vortex started to collapse end of April 2020. The measured 532 nm PLDR values were at all below 0.05.
We may conclude that a clear identification of smoke with lidar is only possible if the spectral dependence of the lidar ratio could be observed. The depolarization-ratio-based CALIPSO aerosol typing at least failed to identify the smoke layers. It remains an open question, how many of the stratospheric aerosol layers observed with CALIOP in the summer and autumn seasons in the UTLS height regime since 2006 were smoke layers.
4.2.1 Coated Ash Versus Coated BC Particles: Similar Spectral Dependence of the Lidar Ratio?
The question may arise: Could these smoke optical features (large 532 nm lidar ratios, strong difference of 25 sr between the lidar ratio at 355 and 532 nm) also be produced by a specific mixture of volcanic aerosol with a dominating fraction of spherical, non-depolarizing, but strongly light-absorbing ash particles, that are coated with a liquid sulfuric-acid water solution? Such an volcanic aerosol scenario was recently suggested by Zhu et al. (2020) and Muser et al. (2020). If so, a clear discrimination of volcanic and smoke aerosol layers would no longer be possible. The answer is as follows: If the fraction of coated ash particles in the accumulation mode with effective particle radius of 0.2 μm would be significant (e.g., around 50%) this volcanic aerosol would produce a similar lidar ratio spectrum as the smoke particles. However, all our lidar ratio observations in stratospheric volcanic layers (Ansmann et al., 1993; Wandinger et al., 1995; Ansmann et al., 1997; Mattis et al., 2010) are in full agreement with simulations of the optical properties of volcanic aerosol layers assuming a pure sulfuric-acid water aerosol (Wandinger et al., 1995; Jäger and Deshler, 2002; Jäger and Deshler, 2003), and thus neglecting any impact of coated ash particles on the optical properties. This assumption of a clearly dominating sulfate aerosol fraction and a minor fraction of coated ash (e.g. of < 10%) is supported by balloon observations of Deshler et al. (1993). Typical lidar ratios for volcanic aerosol as measured with Raman lidars are in the range of 40-60sr (at both wavelengths) in the case of small volcanic aerosol particles with effective radius around 0.2∼μm as measured after the Sayrchev eruption (same is assumed for the Raikoke aerosol) (Mattis et al., 2010). The lidar ratios are even lower (25-40sr) (Wandinger et al., 1995) in volcanic sulfate layers showing large particles effective radii of 0.4–0.5 μm which was the case during the first 3 years after the Pinatubo eruption (Ansmann et al., 1997). These values (including a missing strong wavelength dependence) are quite different from the ones we found for stratospheric smoke layers. It should be emphasized in addition that these large 532 nm lidar ratios of 70-110sr in stratospheric aerosol layers and the large difference between 355 and 532 nm of more than 25sr have only recently be observed, during the three major, record-breaking Canadian, Australian and Siberian smoke events (Haarig et al., 2018; Ohneiser et al., 2020; Ohneiser et al., 2021). All these recent smoke measurements were not available to the times when the CALIPSO aerosol typing scheme was developed by Kim et al. (2018).
4.3 A Successful Identification: Australian Wildfire Smoke Over Punta Areans, Chile, on January 6–10, 2020
We add an Australian smoke case from January 2020. This time, the CALIPSO aerosol typing scheme successfully classified the detected stratospheric aerosol as wildfire smoke from Australia. The smoke was lifted over southeastern Australia by pyroCb convection to roughly 15 km height before starting the long-range travel over 10,000 km across the Pacific Ocean to South America (Figure 1) (Ohneiser et al., 2020; Peterson et al., 2021). In Figure 11, the arrival of optically dense smoke plumes originating from the record-breaking Australian bushfires in the beginning of 2020 over the southern most part of South America is shown. The flight track on January 6, 7:01–7:09 UTC, was 1,200 km west of Punta Arenas (53.2°S, 70.9°W) in southern Chile. A first coherent field of smoke plumes crossed Punta Arenas from January 6 to 10, 2020 according to the ground-based and spaceborne lidar observations. Strong backscatter signals in Figure 11 indicate optically dense smoke layers causing AOTs of 0.1–0.5 at 532 nm and layer-integrated attenuated backscatter coefficients (AB532) clearly > 0.001 sr−1 so that these layers were not automatically classified as sulfate layers.
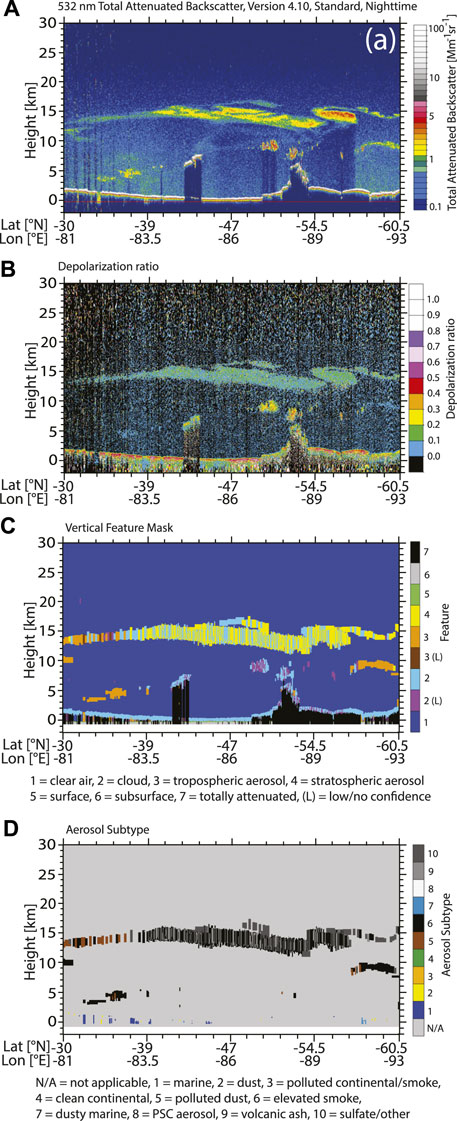
FIGURE 11. Same as Figures 2, 5, except for a CALIOP observation over the Pacific Ocean 500–1,000 km west of southern South America (1,200 km west of Punta Arenas, southern Chile) on January 6, 2020, 7:00–7:09 UTC. The volume depolarization ratio is shown in addition [in (B)]. Enhanced values around 0.1, typical for pyroCb-related smoke, were measured in the stratospheric smoke between 12 and 17 km height. The CALIPSO cloud and aerosol discrimination scheme has difficulties to clearly identify the aerosol layer [in (C)]. The aerosol typing scheme classified most of the remaining aerosol segments as smoke layers [in (D)].
CALIOP observed significantly enhanced volume depolarization ratios of around 0.1 (blue and green colors in Figure 11B) and after the correction for Rayleigh depolarization contribution, the particle depolarization ratio PLDR532 was found close to 0.15 and partly even > 0.15 so that the layers were obviously categorized as ice clouds. As can be seen in Figure 11C, the cloud/aerosol discrimination scheme failed frequently and misclassified many parts of the smoke layers as clouds. We will not discuss the complex multi-parameter cloud classification scheme here which is based on the attenuated backscatter values, the color ratio, the depolarization ratio, height, and further parameters (Liu et al., 2019). Nevertheless, the aerosol typing scheme successfully identified the smoke in the remaining aerosol layer segments. In Table 3, the aerosol typing results are shown. The conditions (in terms of AB532, PLDR532) were given to classify the layer as smoke layer. The lidar observation performed at Punta Arenas from January 6 to 10, 2020 are in full agreement with the CALIOP measurements (Ohneiser et al., 2020). On average (8–10 January 2020), we measured a smoke 532 nm AOT of 0.11, a mean 532 nm particle depolarization ratio of 0.14, and, in addition, the inverse spectral behavior of the smoke lidar ratio with values of 78 and 94 sr at 355 and 532 nm, respectively.
5 Conclusion
Distinction of volcanic sulfate and wildfire smoke particles in the stratosphere by means of the CALIPSO aerosol classification scheme is based on depolarization ratio (PLDR532) measurements in the case of prominent aerosol layers. We showed that smoke identification is then difficult because the smoke PLDR532 can be as low as 0.02 as well as close to 0.2. All aerosol layers showing low PLDR532 values are classified as (volcanic) sulfate aerosol layers. The ground-based multiwavelength Raman lidar observations allow us to clearly distinguish smoke from sulfate particles by means of the measured spectral dependence of the lidar ratio and the high 532 nm lidar ratios > 70 sr when smoke is present.
The misclassification of smoke layers as sulfate aerosol layer in the CALIPSO aerosol statistics leads to the question how many of the sulfate layers in the CALIPSO statistics (2006–2021) are smoke layers. How strong was the contribution of wildfire smoke to stratospheric aerosol perturbations during the last 15–16 years and in which way masked this misclassification a proper study of the impact of UTLS aerosols on the Earth’s radiative budget, ozone depletion, PSC evolution, and cirrus formation?
Regarding future space lidar missions, the use of the High Spectral Resolution Lidar (HSRL) technique (Burton et al., 2015) would be a clear step forward in the field of accurate stratospheric aerosol characterization. As Raman lidars, multiwavelength HSRLs permit the measurement of lidar ratios at 355 and 532 nm and thus a clear identification of aged wildfire smoke. Complex stratospheric aerosol conditions as given in 2019 may occur more frequently in the future as a consequence of climate change. As a further aspect, volcanic ash has to be considered besides sulfate and smoke aerosol types. However, ash is easily identified by the large PLDR532 value of > 0.3 (Kim et al., 2018).
It should be emphasized at the end that spaceborne lidar missions alone are not sufficient to obtain an improved view on UTLS aerosols in the climate system. A combination of spaceborne lidars, passive remote sensing, and a well-organized global network of ground-based state-of-the-art aerosol lidars, which consider the latest technical developments, is required for a trustworthy and complementary global stratospheric aerosol monitoring, similar to the study presented by Rogozovsky et al. (2021) for complex tropospheric aerosol conditions. Global coverage as well as detailed monitoring with high temporal and vertical resolution at numerous permanent sites (in key regions of climate and environmental change) are complementary approaches to explore stratospheric aerosols and their impact on climate and air-chemistry-relevant processes.
Data Availability Statement
The raw data supporting the conclusion of this article will be made available by the authors, without undue reservation.
Author Contributions
AA, AC, and KO designed the study. AA wrote the text with support by AC. KO and HB analyzed the lidar data, satellite data were provided by AC. RE and HB were resonsible for high-quality lidar observations.
Funding
This project has partly received funding from the European Union’s Horizon 2020 research and innovation program ACTRIS-2 Integrating Activities (H2020-INFRAIA-2014–2015, Grant Agreement No. 654109).
Conflict of Interest
The authors declare that the research was conducted in the absence of any commercial or financial relationships that could be construed as a potential conflict of interest.
Publisher’s Note
All claims expressed in this article are solely those of the authors and do not necessarily represent those of their affiliated organizations, or those of the publisher, the editors and the reviewers. Any product that may be evaluated in this article, or claim that may be made by its manufacturer, is not guaranteed or endorsed by the publisher.
Acknowledgments
We grateful to the TROPOS lidar team for smoothly running the entire Polly lidar network over months and years.
References
Ansmann, A., Baars, H., Chudnovsky, A., Mattis, I., Veselovskii, I., Haarig, M., et al. (2018). Extreme Levels of Canadian Wildfire Smoke in the Stratosphere over central Europe on 21–22 August 2017. Atmos. Chem. Phys. 18, 11831–11845. doi:10.5194/acp-18-11831-2018
Ansmann, A., Mattis, I., Wandinger, U., Wagner, F., Reichardt, J., and Deshler, T. (1997). Evolution of the Pinatubo Aerosol: Raman Lidar Observations of Particle Optical Depth, Effective Radius, Mass, and Surface Area over central Europe at 53.4°N. J.Atmos. Sci. 54, 2630–2641. doi:10.1029/96JD01373
Ansmann, A., Ohneiser, K., Mamouri, R. E., Knopf, D. A., Veselovskii, I., Baars, H., et al. (2021). Tropospheric and Stratospheric Wildfire Smoke Profiling with Lidar: Mass, Surface Area, CCN, and INP Retrieval. Atmos. Chem. Phys. 21, 9779–9807. doi:10.5194/acp-21-9779-2021
Ansmann, A., Tesche, M., Groß, S., Freudenthaler, V., Seifert, P., Hiebsch, A., et al. (2010). The 16 April 2010 Major Volcanic Ash Plume over central Europe: EARLINET Lidar and AERONET Photometer Observations at Leipzig and Munich, Germany. Geophys. Res. Lett. 37. doi:10.1029/2010GL043809
Ansmann, A., Wandinger, U., Riebesell, M., Weitkamp, C., and Michaelis, W. (1992). Independent Measurement of Extinction and Backscatter Profiles in Cirrus Clouds by Using a Combined Raman Elastic–Backscatter Lidar. Appl. Opt. 31, 7113–7131. doi:10.1364/AO.31.007113
Ansmann, A., Wandinger, U., and Weitkamp, C. (1993). One-year Observations of Mount Pinatubo Aerosol with an Advanced Raman Lidar over Germany at 53.5°N. Geophys. Res. Lett. 20, 711–714. doi:10.1029/93GL00266
Baars, H., Ansmann, A., Ohneiser, K., Haarig, M., Engelmann, R., Althausen, D., et al. (2019). The Unprecedented 2017–2018 Stratospheric Smoke Event: Decay Phase and Aerosol Properties Observed with the EARLINET. Atmos. Chem. Phys. 19, 15183–15198. doi:10.5194/acp-19-15183-2019
Baars, H., Kanitz, T., Engelmann, R., Althausen, D., Heese, B., Komppula, M., et al. (2016). An Overview of the First Decade of PollyNET: an Emerging Network of Automated Raman-Polarization Lidars for Continuous Aerosol Profiling. Atmos. Chem. Phys. 16, 5111–5137. doi:10.5194/acp-16-5111-2016
Boers, R., de Laat, A. T., Stein Zweers, D. C., and Dirksen, R. J. (2010). Lifting Potential of Solar-Heated Aerosol Layers. Geophys. Res. Lett. 37. doi:10.1029/2010GL045171
Burton, S. P., Hair, J. W., Kahnert, M., Ferrare, R. A., Hostetler, C. A., Cook, A. L., et al. (2015). Observations of the Spectral Dependence of Linear Particle Depolarization Ratio of Aerosols Using NASA Langley Airborne High Spectral Resolution Lidar. Atmos. Chem. Phys. 15, 13453–13473. doi:10.5194/acp-15-13453-2015
Deshler, T., Johnson, B. J., and Rozier, W. R. (1993). Balloonborne Measurements of Pinatubo Aerosol during 1991 and 1992 at 41°N: Vertical Profiles, Size Distribution, and Volatility. Geophys. Res. Lett. 20, 1435–1438. doi:10.1029/93GL01337
Engelmann, R., Ansmann, A., Ohneiser, K., Griesche, H., Radenz, M., Hofer, J., et al. (2021). Wildfire Smoke, Arctic Haze, and Aerosol Effects on Mixed-Phase and Cirrus Clouds Over the North Pole Region During MOSAiC: An Introduction. Atmos. Chem. Phys. 21, 13397–13423. doi:10.5194/acp-21-13397-2021
Engelmann, R., Kanitz, T., Baars, H., Heese, B., Althausen, D., Skupin, A., et al. (2016). The Automated Multiwavelength Raman Polarization and Water-Vapor Lidar PollyXT: the neXT Generation. Atmos. Meas. Tech. 9, 1767–1784. doi:10.5194/amt-9-1767-2016
Fromm, M., Lindsey, D. T., Servranckx, R., Yue, G., Trickl, T., Sica, R., et al. (2010). The Untold story of Pyrocumulonimbus. Bull. Am. Meteorol. Soc. 91, 1193–1210. doi:10.1175/2010BAMS3004.1
Gialitaki, A., Tsekeri, A., Amiridis, V., Ceolato, R., Paulien, L., Kampouri, A., et al. (2020). Is the Near-Spherical Shape the “New Black” for Smoke?. Atmos. Chem. Phys. 20, 14005–14021. doi:10.5194/acp-20-14005-2020
Groß, S., Freudenthaler, V., Wiegner, M., Gasteiger, J., Geiß, A., and Schnell, F. (2012). Dual-wavelength Linear Depolarization Ratio of Volcanic Aerosols: Lidar Measurements of the Eyjafjallajökull Plume over Maisach, Germany. Atmos. Environ. 48, 85–96. doi:10.1016/j.atmosenv.2011.06.017
Haarig, M., Ansmann, A., Baars, H., Jimenez, C., Veselovskii, I., Engelmann, R., et al. (2018). Depolarization and Lidar Ratios at 355, 532, and 1064nmand Microphysical Properties of Aged Tropospheric and Stratospheric Canadian Wildfire Smoke. Atmos. Chem. Phys. 18, 11847–11861. doi:10.5194/acp-18-11847-2018
Haywood, J. M., Jones, A., Clarisse, L., Bourassa, A., Barnes, J., Telford, P., et al. (2010). Observations of the Eruption of the Sarychev Volcano and Simulations Using the HadGEM2 Climate Model. J. Geophys. Res. Atmospheres 115, 1447. doi:10.1029/2010JD014447
Hirsch, E., and Koren, I. (2021). Record-breaking Aerosol Levels Explained by Smoke Injection into the Stratosphere. Science 371, 1269–1274. doi:10.1126/science.abe1415
Hofer, J., Ansmann, A., Althausen, D., Engelmann, R., Baars, H., Abdullaev, S. F., et al. (2020). Long-term Profiling of Aerosol Light Extinction, Particle Mass, Cloud Condensation Nuclei, and Ice-Nucleating Particle Concentration over Dushanbe, Tajikistan, in Central Asia. Atmos. Chem. Phys. 20, 4695–4711. doi:10.5194/acp-20-4695-2020
Hofer, J., Ansmann, A., Althausen, D., Engelmann, R., Baars, H., Fomba, K. W., et al. (2020). Optical Properties of Central Asian Aerosol Relevant for Spaceborne Lidar Applications and Aerosol Typing at 355 and 532nm. Atmos. Chem. Phys. 20, 9265–9280. doi:10.5194/acp-20-9265-2020
Hogan, R. J., and Bozzo, A. (2018). A Flexible and Efficient Radiation Scheme for the ECMWF Model. J. Adv. Model. Earth Syst. 10, 1990. doi:10.1029/2018MS001364
Hu, Q., Goloub, P., Veselovskii, I., Bravo-Aranda, J. A., Popovici, I. E., Podvin, T., et al. (2019). Long-range-transported Canadian Smoke Plumes in the Lower Stratosphere over Northern France. Atmos. Chem. Phys. 19, 1173–1193. doi:10.5194/acp-19-1173-2019
Jäger, H., and Deshler, T. (2003). Correction to “Lidar Backscatter to Extinction, Mass and Area Conversions for Stratospheric Aerosols Based on Midlatitude Balloonborne Size Distribution Measurements”. Geophys. Res. Lett. 30, 189. doi:10.1029/2003GL017189
Jäger, H., and Deshler, T. (2002). Lidar Backscatter to Extinction, Mass and Area Conversions for Stratospheric Aerosols Based on Midlatitude Balloon-Borne Size Distribution Measurements. Geophys. Res. Lett. 29. doi:10.1029/2002GL015609
Jimenez, C., Ansmann, A., Engelmann, R., Donovan, D., Malinka, A., Seifert, P., et al. (2020). The Dual-Field-Of-View Polarization Lidar Technique: a New Concept in Monitoring Aerosol Effects in Liquid-Water Clouds – Case Studies. Atmos. Chem. Phys. 20, 15265–15284. doi:10.5194/acp-20-15265-2020
Johnson, M. S., Strawbridge, K., Knowland, K. E., Keller, C., and Travis, M. (2021). Long-range Transport of Siberian Biomass Burning Emissions to North America during FIREX-AQ. Atmos. Environ. 252, 118241. doi:10.1016/j.atmosenv.2021.118241
Kar, J., Lee, K. P., Vaughan, M. A., Tackett, J. L., Trepte, C. R., Winker, D. M., et al. (2019). CALIPSO Level 3 Stratospheric Aerosol Profile Product: Version 1.00 Algorithm Description and Initial Assessment. Atmos. Meas. Tech. 12, 6173–6191. doi:10.5194/amt-12-6173-2019
Khaykin, S. M., Godin-Beekmann, S., Hauchecorne, A., Pelon, J., Ravetta, F., and Keckhut, P. (2018). Stratospheric Smoke with Unprecedentedly High Backscatter Observed by Lidars above Southern France. Geophys. Res. Lett. 45, 1639–1646. doi:10.1002/2017GL076763
Kim, M. H., Omar, A. H., Tackett, J. L., Vaughan, M. A., Winker, D. M., Trepte, C. R., et al. (2018). The CALIPSO Version 4 Automated Aerosol Classification and Lidar Ratio Selection Algorithm. Atmos. Meas. Tech. 11, 6107–6135. doi:10.5194/amt-11-6107-2018
Kloss, C., Berthet, G., Sellitto, P., Ploeger, F., Taha, G., Tidiga, M., et al. (2021). Stratospheric Aerosol Layer Perturbation Caused by the 2019 Raikoke and Ulawun Eruptions and Their Radiative Forcing. Atmos. Chem. Phys. 21, 535–560. doi:10.5194/acp-21-535-2021
Knopf, D. A., Alpert, P. A., and Wang, B. (2018). The Role of Organic Aerosol in Atmospheric Ice Nucleation: a Review. ACS Earth Space Chem. 168, 202. doi:10.1021/acsearthspacechem.7b00120
Liu, Z., Kar, J., Zeng, S., Tackett, J., Vaughan, M., Avery, M., et al. (2019). Discriminating between Clouds and Aerosols in the Caliop Version 4.1 Data Products. Atmos. Meas. Tech. 12, 703–734. doi:10.5194/amt-12-703-2019
Mattis, I., Siefert, P., Müller, D., Tesche, M., Hiebsch, A., Kanitz, T., et al. (2010). Volcanic Aerosol Layers Observed with Multiwavelength Raman Lidar over central Europe in 2008–2009. J. Geophys. Res. 115, D00L04. doi:10.1029/2009JD013472
McCormick, M., Thomason, L., and Trepte, C. (1995). Atmospheric Effects of the Mt Pinatubo Eruption. Nature 373, 399–404. doi:10.1038/373399a0
Muser, L. O., Hoshyaripour, G. A., Bruckert, J., Horváth, A., Malinina, E., Wallis, S., et al. (2020). Particle Aging and Aerosol–Radiation Interaction Affect Volcanic Plume Dispersion: Evidence from the Raikoke 2019 Eruption. Atmos. Chem. Phys. 20, 15015–15036. doi:10.5194/acp-20-15015-2020
Ohneiser, K., Ansmann, A., Baars, H., Seifert, P., Barja, B., Jimenez, C., et al. (2020). Smoke of Extreme Australian Bushfires Observed in the Stratosphere over Punta Arenas, Chile, in January 2020: Optical Thickness, Lidar Ratios, and Depolarization Ratios at 355 and 532∼nm. Atmos. Chem. Phys. 20, 8003–. doi:10.5194/acp-20-8003-2020
Ohneiser, K., Ansmann, A., Chudnovsky, A., Engelmann, R., Ritter, C., Veselovskii, I., et al. (2021). The Unexpected Smoke Layer in the High Arctic winter Stratosphere during Mosaic 2019–2020. Atmos. Chem. Phys. 21, 2021. doi:10.5194/acp-21-15783-2021
Osborne, M. J., de Leeuw, J., Witham, C., Schmidt, A., Beckett, F., Kristiansen, N., et al. (2021). The 2019 Raikoke Volcanic Eruption Part 2: Particle Phase Dispersion and Concurrent Wildfire Smoke Emissions. Atmos. Chem. Phys. Discuss.. doi:10.5194/acp-2021-448
Peterson, D. A., Fromm, M. D., McRae, R. H. D., Campbell, J. R., Hyer, E. J., Taha, G., et al. (2021). Australia’s Black Summer Pyrocumulonimbus Super Outbreak Reveals Potential for Increasingly Extreme Stratospheric Smoke Events. Npj Clim. Atmos. Sci. 4, 9. doi:10.1038/s41612-021-00192-9
Prata, A. T., Young, S. A., Siems, S. T., and Manton, M. J. (2017). Lidar Ratios of Stratospheric Volcanic Ash and Sulfate Aerosols Retrieved from CALIOP Measurements. Atmos. Chem. Phys. 17, 8599–8618. doi:10.5194/acp-17-8599-2017
Rodriguez, B., Lareau, N. P., Kingsmill, D. E., and Clements, C. B. (2020). Extreme Pyroconvective Updrafts during a Megafire. Geophys. Res. Lett. 47, 9001. doi:10.1029/2020GL089001
Rogozovsky, I., Ansmann, A., Althausen, D., Heese, B., Engelmann, R., Hofer, J., et al. (2021). Impact of Aerosol Layering, Complex Aerosol Mixing, and Cloud Coverage on High-Resolution MAIAC Aerosol Optical Depth Measurements: Fusion of Lidar, AERONET, Satellite, and Ground-Based Measurements. Atmos. Environ. 247. doi:10.1016/j.atmosenv.2020.118163
Rolph, G., Stein, A., and Stunder, B. (2017). Real-time Environmental Applications and Display sYstem: READY. Environ. Model. Softw. 95, 210–228. doi:10.1016/j.envsoft.2017.06.025
Stein, A. F., Draxler, R. R., Rolph, G. D., Stunder, B. J. B., Cohen, M. D., and Ngan, F. (2015). Noaa’s HYSPLIT Atmospheric Transport and Dispersion Modeling System. Bull. Am. Meteorol. Soc. 96, 2059–2077. doi:10.1175/BAMS-D-14-00110.1
Tackett, J. L., Winker, D. M., Getzewich, B. J., Vaughan, M. A., Young, S. A., and Kar, J. (2018). CALIPSO Lidar Level 3 Aerosol Profile Product: Version 3 Algorithm Design. Atmos. Meas. Tech. 11, 4129–4152. doi:10.5194/amt-11-4129-2018
Vaughan, G., Wareing, D., and Ricketts, H. (2021). Measurement Report: Lidar Measurements of Stratospheric Aerosol Following the 2019 Raikoke and Ulawun Volcanic Eruptions. Atmos. Chem. Phys. 21, 5597–5604. doi:10.5194/acp-21-5597-2021
Wandinger, U., Ansmann, A., Reichardt, J., and Deshler, T. (1995). Determination of Stratospheric Aerosol Microphysical Properties from Independent Extinction and Backscattering Measurements with a Raman Lidar. Appl. Opt. 34, 8315. doi:10.1364/AO.34.008315
Winker, D. M., Vaughan, M. A., Omar, A., Hu, Y., Powell, K. A., Liu, Z., et al. (2009). Overview of the CALIPSO mission and CALIOP Data Processing Algorithms. J. Atmos. Oceanic Techn. 26, 2310–2323. doi:10.1175/2009JTECHA1281.1
Keywords: Raman lidar, stratospheric aerosol, aerosol typing, lidar ratio, wildfire smoke, volcanic sulfate aerosol
Citation: Ansmann A, Ohneiser K, Chudnovsky A, Baars H and Engelmann R (2021) CALIPSO Aerosol-Typing Scheme Misclassified Stratospheric Fire Smoke: Case Study From the 2019 Siberian Wildfire Season. Front. Environ. Sci. 9:769852. doi: 10.3389/fenvs.2021.769852
Received: 02 September 2021; Accepted: 27 October 2021;
Published: 19 November 2021.
Edited by:
Corinna Kloss, UMR7328 Laboratoire de physique et chimie de l’environnement et de l’Espace (LPC2E), FranceReviewed by:
Ali Hoshyaripour, Karlsruhe Institute of Technology (KIT), GermanyGwenael Berthet, UMR7328 Laboratoire de physique et chimie de l’environnement et de l’Espace (LPC2E), France
Copyright © 2021 Ansmann, Ohneiser, Chudnovsky, Baars and Engelmann. This is an open-access article distributed under the terms of the Creative Commons Attribution License (CC BY). The use, distribution or reproduction in other forums is permitted, provided the original author(s) and the copyright owner(s) are credited and that the original publication in this journal is cited, in accordance with accepted academic practice. No use, distribution or reproduction is permitted which does not comply with these terms.
*Correspondence: Albert Ansmann, albert@tropos.de