Field Calibration and Evaluation of an Internet-of-Things-Based Particulate Matter Sensor
 Nicole Cowell
 Lee Chapman
 William Bloss
  Francis Pope
- School of Geography, Earth and Environmental Science, College of Life and Environmental Science, University of Birmingham, Birmingham, United Kingdom
This paper presents a field evaluation of IoT-enabled Plantower PMS5003 particulate matter sensors in Birmingham, United Kingdom. Commercial, off the shelf, sensors were adapted to utilise Low Power Wide Area Network (LPWAN) IoT technology enabling batteries to be used as a power source. The devices are capable of measuring and communicating data to an online platform with a battery life of ∼2 months, at a measurement interval of 15 min, allowing for automated air quality monitoring for extended periods at high density. The sensors demonstrate success at being integrated into a wireless sensor network, with a high presence of readings. The average correlation coefficients (r2) between raw PMS device data and reference instrumentation are 0.718, 0.703, and 0.543 for PM1, PM2.5, and PM10, respectively. The devices also demonstrate good intersensor consistency, with Pearson’s r values between pairs ranging from 0.92 to 0.99 across all size ranges. Relative humidity (RH) clearly influences the response of the sensors, especially for RH >85%, in keeping with previous laboratory evaluations and evaluations of similar devices. The development of a multi-linear correction factor that accounts for humidity effects on the performance of the sensors is described; using this model, Pearson’s r values range from 0.81 to 0.91 compared to 0.73–0.85 from uncorrected values. There is also some evidence of drift at high humidity over an 8-week period, suggesting that such sensors will (at least currently) need recalibration approximately bimonthly. The limit of detection (LoD) (1.60–4.75 μg m−3) calculated from this study also demonstrates that the sensors are suitable for capturing concentrations typical of a moderately polluted United Kingdom urban environment—LoDs of PM2.5 in this study would have allowed for capture of 94.7% of the concentrations recorded at a typical United Kingdom urban roadside monitoring site between 2017 and 2020.
1 Introduction
There are estimated to be 4.2 million premature global deaths as a result of exposure to ambient air pollution, specifically particulate matter (PM). PM is a major concern due to the adverse effects it has on the respiratory, cardiovascular, and cognitive functions of exposed populations (Brook et al., 2010; WHO 2019). Sources of particulate matter pollution and particle concentrations are spatio-temporally variable leading, and the limited data available for PM [particularly away from urban centers due to the high financial cost of running monitoring sites as well as a lack of space, security, and availability of trained staff (Young et al., 2014)] makes drawing a clear understanding from data challenging. Although high-income countries often have small networks of monitoring sites across the larger cities and conurbations, many low- and middle-income countries are still developing air quality management and monitoring plans (Castell et al., 2017; Gulia et al., 2020). Overall, large areas of urban and rural environments are not covered by traditional, reference-grade air quality monitors, and this increases the challenge of measuring and hence managing human exposure (De Nazelle et al., 2017).
With 80% of the population of Europe living within urban areas, urban air quality policy and management is key to reducing human exposure to pollutants (Dogeanu et al., 2019). Motor vehicles are both a prominent primary source of particulate matter from exhaust emission and mechanical wear and also a contributor to secondary particulate sources within photochemical smog, as the nitrous oxides and VOCs released can contribute to ozone and secondary aerosol formation in locations of favorable meteorology (Environment Protection Authority, 2004). Air quality management often has a multifaceted approach, including a range of hard and soft measures: active and public transport initiatives, wood/coal burning bans, green infrastructure, road/industry pollution barriers, reduced road speed limits, car sharing schemes, and low emission zones. Clean air or low emission zones are becoming increasingly popular as an air quality management technique, with cities across the United Kingdom and further afield introducing charges and restrictions for combustion engine vehicles driving within city centers (Pisoni et al., 2019; Quarmby, Santos, and Mathias 2019). While low emission zones, frequently mandated by exceedances of NO2 air quality standards, may reduce gaseous and aerosol exhaust emissions, constraints by vehicle age/EURO classification may have limited the impacts on non-exhaust particulates despite research demonstrating that non-exhaust emissions contributed 60 and 73% of primary road traffic emissions in the United Kingdom for PM2.5 and PM10, respectively (Air Quality Expert Group, 2019). The WHO guidelines estimate that, by reducing potential PM2.5 concentrations from an annual average of 35 µg m−3 to a total of 10 µg m−3, it could reduce deaths related to poor air quality by ∼15% globally (WHO 2018). Therefore, as policies evolve to encourage the uptake of lower emission combustion engine vehicles as well as electric and hybrid power, there is potential for PM emissions to become increasingly important as gaseous emissions are reduced. Electric vehicles tend to be heavier and thus generate greater non-exhaust emissions due to increased mechanical wear, which may only be partially offset by reduced brake wear through regenerative braking (Amato et al., 2014; Timmers and Achten, 2016). Beddows and Harrison (2021) found that, without the uptake of regenerative braking, there would be no reduction to PM10 when changing from a Euro6 fleet to a fully electric drive chain. Thus, it is becoming increasingly important to focus on improving the monitoring capabilities of PM, especially in heavy-traffic urban environments. Moreover, road vehicles are not the only anthropogenic source of PM, with combustion in homes, industry, and energy production, agriculture, metalworks, quarries, and waste burning being just some of the other activities contributing to particulate concentrations (Air Quality Expert Group, 2012). All of these sources will be contributing regional and wider PM concentrations, highlighting the need for wider PM monitoring.
There has been a paradigm shift in pollutant monitoring in the past decade, with low-cost (defined here as ∼>£30–500) sensors becoming increasingly prevalent (Lewis et al., 2016). The decreased size and cost, compared to traditional monitoring instrumentation, provide the potential to dramatically increase the density of monitoring sites as well provide increasingly portable monitoring solutions (Chong and Kumar, 2003; Snyder et al., 2013). However, the decreasing cost of sensing capabilities is only one part of the solution, and deployments are still often limited by the availability of a reliable power source needed to run both the sensor and communications, often significantly adding to the cost of the device.
It is here where the Internet of Things (IoT) is potentially revolutionary. The IoT refers to sensors or devices that are connected via low-power, Internet-based communication protocols. Representing a global information system comprised of hundreds of millions of objects, IoT creates a smart infrastructure by embedding sensors into objects such as power grids, train lines, and buildings (Lavric and Valentin 2017; Brady et al., 2020). These “things” are becoming increasingly critical to modern technological infrastructure, and the IoT ecosystem can allow for processing of a “things” state, thus providing decision making and management opportunities (Zhu et al., 2010; Chapman et al., 2015). As the IoT rapidly grows, wireless sensor networks are becoming increasingly prominent in advancing monitoring approaches in a range of applications. Importantly, most sensors can be run on battery power alone, which can constrain the choice of sensor (Sheng et al., 2015) but enable the sensors to be effectively positioned anywhere with sufficient mobile data coverage. Furthermore, the use of low-power wide-area networks has become a significant enabling technology, allowing for bidirectional communication on limited battery consumption, often at low subscription costs, by limiting the message size and frequency. This can allow for battery life to now extend for months to years, depending on the device (Mekki et al., 2018), which is more than adequate for the calibration cycle of instrumentation.
However, although increasingly technologically feasible, the scientific credibility of data from low-cost sensors has been debated with multiple studies into their success varying in findings (Wang et al., 2015; Crilley et al., 2018; Sayahi et al., 2019; Zou et al., 2021). The current standards for monitoring equipment are often not met by low-cost sensors as these standards were created based on the high performance of reference instrumentation. There is an increasing need for further indicative standards for devices of low-cost caliber to ensure quality when measuring with less consistent equipment. The 2008 European Air Quality directive has data quality objectives for fixed and indicative measurements of 25 and 50% uncertainty, respectively, with all measurements being expected to capture at least 90% of data for particulates. The directive suggests reference-grade instruments as standard; however, it permits the use of other methods if they can demonstrate equivalence with the reference methods (European Union, 2008 #179). Evaluations of low-cost sensors are often based on precision alone and their ability to meet equivalence standards, with many studies failing to acknowledge the potential benefits of a spatial cloud of data, even if it is of lower precision (Chapman et al., 2015). Table 1 presents an updated key comparison between traditional monitoring and low-cost IoT sensors from Kularatna and Sudantha (2008).
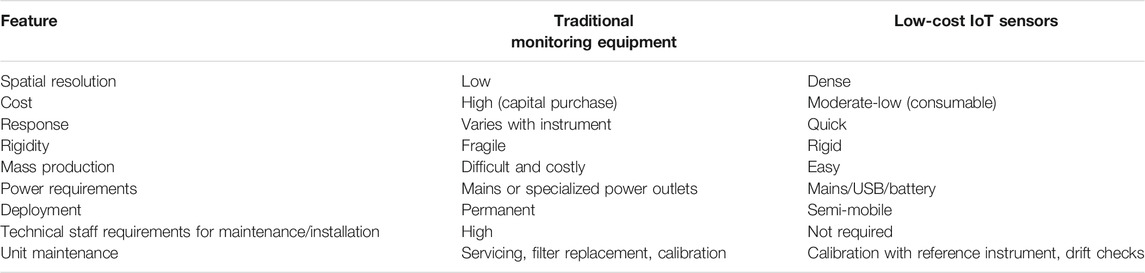
TABLE 1. Comparison of low-cost sensors vs. traditional monitoring [edited from Kularatna and Sudantha (2008)].
Guidance in what is to be expected and how to evaluate the results from low-cost sensors has a wide range of advice covering a range of potential issues from carefully considering siting, evaluating the impact of meteorology, and evaluating the results via linearity (Williams et al., 2014a; Williams et al., 2014b). It is recommended that reference instruments and low-cost sensors could share quality assurance frameworks and standards, such as the Air Quality Directive 2008/50/EC (European Union, 2008; Castell et al., 2017; Lewis et al., 2018). However, it is argued that basic correlation evaluative measures fail to represent all of the variability of performance between low-cost sensors and reference instruments or potential temporal changes in performance (Fishbain et al., 2017). Fishbain et al. (2017) present a toolkit for evaluating low-cost pollution sensors and suggest eight performance measures which include a range of classic assessments, such as correlations, alongside novel measures, such as percentage of data that a sensor successfully captures (presence), which has been drawn from in this paper.
It is clear from the literature that, in particular, the monitoring capability of gaseous low-cost sensors is of the most concern (e.g., Lewis et al., 2018); however, studies involving PM sensors are more encouraging (e.g., Crilley et al., 2018; Sayahi et al., 2019). Past evaluations of a range of sensor models have exposed both varying correlation strengths with reference instrumentation as well as contrasting relationships with meteorology—with the relative humidity impact being widely studied for optical particle counters, in particular (Zheng et al., 2018). It is suspected that measurements of the mass concentration of hygroscopic particles by light scattering instruments are influenced by relative humidity, particularly in instances of high humidity when the particles will swell significantly as they absorb water. Some optical particle counter (OPC) studies have demonstrated over-reading due to this process. Lasers within the OPCs struggle to distinguish the larger particles individually and record greater particle concentration values (Crilley et al., 2018; Sayahi et al., 2019; Zamora et al., 2019). Hygroscopicity is determined by the chemical composition of particles, and hence PM composition influences the ability of an OPC to accurately measure—especially in the presence of more hygroscopic particles such as nitrate and sulphate (Crilley et al., 2020; Zou et al., 2021).
Despite these challenges, early scientific results indicate low-cost instrumentation for PM to be consistent with reference instruments and feasible for wider deployment, with available sensors being sufficiently low-powered to be embedded into an IoT solution (Crilley et al., 2018; Zamora et al., 2019; Tryner et al., 2020a). This makes PM appear to be an ideal target for a preliminary study into IoT-enabled AQ devices. This paper presents a methodology to IoT-enable the Plantower PMS 5003 sensor, a popular optical particle counter that retails at <£30, along with a field evaluation of its performance based on methods drawn from across this literature.
2 Methods and Materials
2.1 Instrumentation
2.1.1 Plantower PMS Sensor
The Plantower PMS5003 is an optical particle counter that uses a light-scattering technique to determine the particle count and size. A photo-diode detector converts light scattered by the particles to a voltage pulse which, in turn, is converted into a particle count using an undisclosed algorithm from the manufacturer (Sayahi et al., 2019; He et al., 2020). The laser in the PMS5003 operates at a wavelength of 680 ± 10 nm, and the fan draws air through the sensor at 0.1 L m−1. The specification states uncertainty of ±10 µg m−3 for the range of 0–100 µg m−3 and ±10% for the range of 100–500 µg m−3 for PM1, PM2.5, and PM10, with two default correction factors available for mass concentration: standard particles (indoor) or atmospheric environment (Sayahi et al., 2019). Particles with diameters less than 0.3 µm do not scatter the 680-nm laser light efficiently, and particles with a diameter >10 µm are too large to draw into the sensor easily. Thus, sensor detection efficiency falls outside of this range (Bulot et al., 2019). The PMS5003 is specified to sense particles of >0.5 µm in diameter.
While there are recent laboratory evaluations of Plantower devices (Zamora et al., 2019; Tryner et al., 2020a; Zou et al., 2021), recent in-field studies have used limited numbers of sensors or have sensors spread widely across a study area, limiting the ability to assess suitability for large-scale network deployment (Bulot et al., 2019; Sayahi et al., 2019; Zou et al., 2021). Furthermore, previous studies with older Plantower models do not fit the environmental/meteorological context of which these sensors will be placed long term (Zheng et al., 2018). Results from recent studies on sensor performance can be contrasting in their findings. Some suggest the existence of a correlation between PM levels recorded by the PMS device and relative humidity (RH), while others suggest that any correlation is not significant (Bulot et al., 2019; Zamora et al., 2019)—for example, one laboratory test demonstrated that the performance of the PMS5003 for PM2.5 was weakened at >74–80% humidity, depending on particulate composition (Tryner et al., 2020b). It is unclear why this contrast of findings exists, although the results could be impacted by the environment in which they are sampled. Variance in error at high PM concentrations has also been recorded at a different level to the error reported by the manufacturer (Zheng et al., 2018).
The impact of the source of PM on accuracy has also been discussed with laboratory results demonstrating that different sources (and hence PM composition and morphology) can impact the ability of the device to correctly measure particulate concentrations (Zou et al., 2021). While this could be due to varying chemical composition affecting the refractive index of particles and thus the ability of sensors to detect them using the light-scattering techniques, the composition of the particulates was not measured. Laboratory tests have shown that the PMS5003 underestimated PM mass concentrations where PM primarily comprises ammonium sulphate and Arizona road dust but correctly recorded “urban” PM concentrations and over-estimated woodsmoke (Tryner et al., 2020b). There have been suggestions that the size variation of particulates from various sources can also impact the ability of the light-scattering measurement, with Plantower sensors generally detecting particles of larger diameters with better accuracy (Tryner et al., 2020a; He et al., 2020; Zou et al., 2021). There is contrast in the settings used on the PMS sensor, with Bulot et al. (2019) focusing on the conversion process from particle count to mass concentration and Sayahi et al. (2019) using the standard particle correction factor setting rather than the atmospheric environment setting designed for field use. The literature also reports that this sensor may not be appropriate for monitoring at >1 year of use, with laboratory-simulated aging of conditions equivalent to continuous exposure of 15 µg m−3 of PM2.5 for 1 year causing the PMS5003 to report more extremely high concentrations than at the beginning of the “year” despite the median values remaining similar, with
This paper extends upon the research by performing an assessment of four PMS5003 sensors, co-located at an urban background monitoring site, for ∼12 weeks against a PALAS FIDAS 200e Dust Aerosol Spectrometer, with data recorded using the “atmospheric environment” setting of the PMS. Data are evaluated using a range of methods, including traditional correlations and novel measures drawn from the literature (Fishbain et al., 2017; Crilley et al., 2018). An evaluation of external factors, such as humidity and particulate composition, can also be conducted, and a calibration method developed for the sensors can be used to ensure that they are suitable for deployment in an ambient-air-quality network. This analysis is performed in the context of the urban background of Birmingham, as it is important to assess the applicability of and calibrate these devices within realistic conditions which are similar to the planned deployment conditions (Sayahi et al., 2019).
2.1.2 IoT Sensor Design
In this study, the PMS5003 was adapted into a IoT-enabled device (hereafter referred to as Altasense PM). This was achieved by using an Arduino MKRFox1200 microcontroller, with data also backed onto an SD card. The Arduino MKRFox1200 utilizes the Sigfox network to send messages of up to 12 bytes to a backend. Sigfox is a radio-based global network specializing in IoT data transmission, which is operated by WND in the United Kingdom (Sigfox 2020). Previous studies suggest that Sigfox communications could be suitable for air quality monitoring—if the message sizes are small and do not breach the daily transmission limits set by the level of subscription (Knoll et al., 2018). The hex string message contains temperature, humidity, PM1, PM2.5, and PM10 data with a timestamp being called from when the message was received (due to message transmission being almost instantaneous when the values were recorded). Messages are sent to the Sigfox backend before being called by an API key to the Birmingham Urban Observatory online platform (https://birminghamurbanobservatory.com/). Tests of Sigfox in an environmental monitoring context demonstrate extremely low power consumption, with a small 90-mAh coin battery capable of sending >1,000 Sigfox transmissions (Joris et al., 2019). A further study shows that the MKRFox1200 device has a battery life of 0.87 years when transmitting 12-byte messages every 10 min and powered by a 2,400-mAh battery with a presumed self-discharge rate of 1%/year (Gomez et al., 2019). The battery life will be dependent on the other components/sensors which are connected to the MKRFox1200; however, there is clear potential for mid– to long-term field sampling campaigns as it could be self-sufficient in the (seasonal) scale of 2 to 3 months in ideal conditions.
The Altasense PM device was housed in a waterproof enclosure with the PMS device inlets drawing in air from the base of the enclosure. The PMS5003 intake inlet comprises four small round holes arranged in a straight line; air is pulled through by a fan which is located at the exhaust outlet. As the intake and exhaust are on the same side of the PMS5003, the enclosure was designed to feature a divider between the two to limit the mixing of the exhaust into the intake. To facilitate any needed corrections for RH, a low-cost temperature and humidity sensor (Sensiron SHT85) was attached near the air intake to ensure that the humidity readings reflected the air being measured within the sensor. This was to ensure that any humidity corrections replicate the condition of the monitored air, not ambient, which may be different due to warming of air from the mechanics of the PMS of the casing in various weather conditions (Crilley et al., 2018). The SHT85 is housed within a protective mesh which protects the sensor from water-related damage. While the separate inlet should limit the mixing of the intake and exhaust, some mixing may still occur as the inlet and exhaust are situated close together on the device. The sensor is programmed to turn on every 15 min and operate for 1 min, with the minute run time suggested by the manufacturer to allow for the fan to stabilize ahead of taking the reading. This sampling frequency utilizes nearly the entire allocation of Sigfox messages allowed per day by the Sigfox network and created the best compromise of data frequency and power consumption. The shutdown period between readings utilizes the low power aspect of the Arduino MKRFox1200 board via the Arduino Low Power Library deep sleep function, completely powering down not only the Plantower PMS but also all unnecessary functions on the board for a set period until power up is required, thus allowing for a prolonged battery life (Arduino 2020). The openair package in R assisted with data analysis (Carslaw and Ropkins 2012).
2.2 Sampling Method
Data collection took place at the Birmingham Air Quality Supersite (BAQS), which is based in the University of Birmingham campus, United Kingdom. This is an urban background monitoring site for the city of Birmingham, which houses a state-of-the-art array of pollutant-monitoring equipment as well as meteorology equipment. The research-grade instrument co-located with the Altasense PM devices consisted of a MCERTS (Monitoring Certification Scheme as issued by the United Kingdom Environment Agency)-certified PALAS, FIDAS 200E Dust Aerosol Spectrometer. The FIDAS draws ambient air through an inlet and dryer system and uses light-scattering techniques to detect PM. A LED light source and detector measures pulses from light scattered at a 90° angle to the source. Particle number concentration is calculated from the number of scattered light impulses, and particle size diameter is inferred by the intensity of the scattered light. A proprietary algorithm converts the signal into particle counts (spectra) and thus into mass concentrations. The FIDAS samples air from a level approximately 2.5 m above the ground, operates with a flow of 0.3 m3/h, and uses a drying line to prevent condensation to affect the measurement. The drying system removes volatile particles and compensates for the condensation of water and the related particle growth if the relative humidity is higher than 60%. It has a detection range of 0.18–100 µm and has accuracy defined as 9.7 and 7.5% for PM2.5 and PM10, respectively (PALAS, 2020). While this is research-grade instrumentation, local authority air quality guidance suggests that the results for unusually heavy or light particles may differ compared to results from monitoring equipment with size-selective inlets (IAQM, 2018). An Aerodyne Aerosol Chemical Speciation Monitor (ACSM) with a PM2.5 inlet is also located at BAQS and was used to collect organic particulate concentrations for assessing the impact of particulate composition on sensor performance. The ACSM analysis determines NH4, SO4, NO3, Chl, and organic mass loadings and has a volumetric sample flow of 85 cc min−1 and a detection limit of <0.2 µg m−3 for 30 min of signal averaging.
Four Altasense PM devices were located at the BAQS site, labeled A, B, C, and D within analysis to differentiate between devices. They were installed at a height of ∼1.5 m and attached to an open mesh fence. Data for 8 weeks of measurement were obtained and used for calibration, from February 24, 2021 to April 22, 2021. There were two calibrations performed on the FIDAS during this period, each lasting a few hours. Data from these have been removed from the data set. The measurement campaign was constrained by the battery life of the sensor, which was found to be limited to around 9 to 10 weeks. The ACSM data were obtained from March 1, 2021 onwards.
3 Results and Discussion
3.1 Comparison to Reference Instrumentation
Data presence can be an issue for low-cost sensors (Fishbain et al., 2017; Rai et al., 2017; Crilley et al., 2018). However, the Altasense PM devices performed well, capturing at least 95% of the total expected measurement for the 8-week period of monitoring. Data outages occurred due to a combination of power and communication failures.
The time series plots in Figure 1 demonstrate the capability of Altasense PM sensors in recording the broad trends in PM mass concentration detected by the FIDAS. Values from a linear regression model (Figure 2) are presented in Table 2 along with limit of detection and mean concentrations. The average correlation coefficients (r2) between PMS devices and BAQS are 0.718, 0.703, and 0.543 for PM1, PM2.5, and PM10, respectively. The slope varies from 0.98–1.2, 1.7–2 and 1.5–1.9 for PM1, PM2.5, and PM10, respectively. The Y intercept varies in the range 1.4–1.8, −0.23–0.61, and −2.1 −1.2 µg m−3 for PM1, PM2.5, and PM10, respectively, sitting within the ±10 µg m−3 uncertainty suggested by Plantower at the PM levels encountered during these measurements (mean PM2.5 concentration detected by PMS5003 devices = 18.79–22.18). PM10 fits this model the least with low R and r2. There is some variation that cannot be accounted for by the linear model—for example, all sensors have periods of over-reading, more so for PM2.5 and PM10. It is unclear why this occurs exactly, but it is hypothesized that this is due to the challenges of larger particles navigating the 90° angle at the entrance and exit the PMS sampling chamber effectively (Sayahi et al., 2019). This could vary temporally with changes in humidity and particle composition. Both (some) reference instruments and low-cost sensors measure concentration based on light-scattering principles. Thus, deviations are not caused by a different response to particles but due to an instrumental factor causing differences in the implementation of the principles.
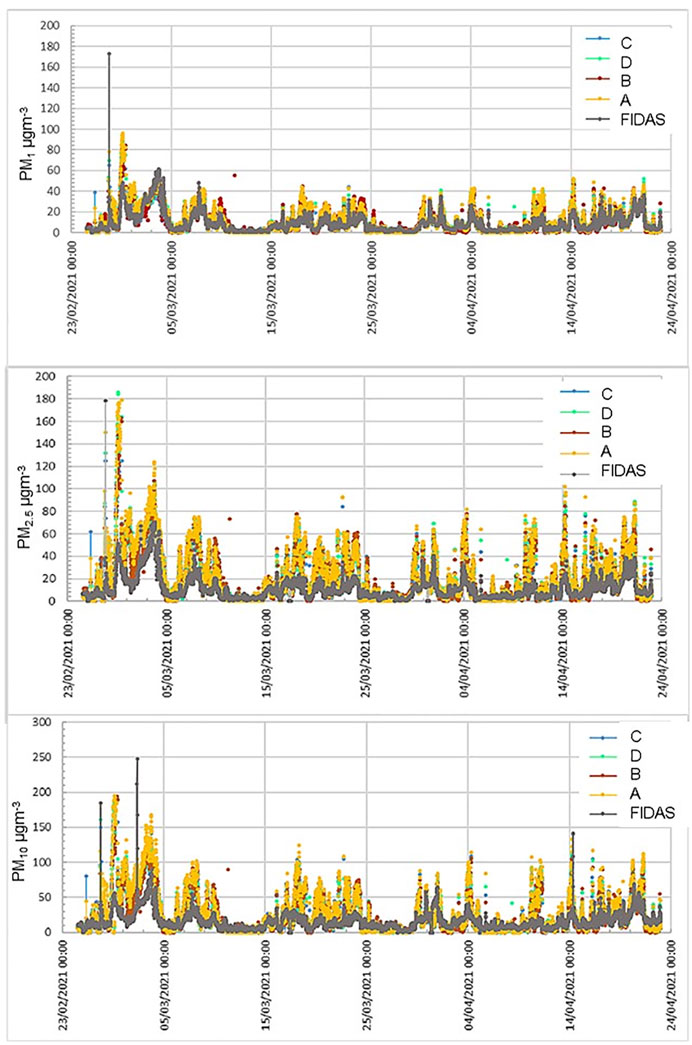
FIGURE 1. Hourly average time plot of low-cost sensors against the Birmingham Air Quality Supersite FIDAS.
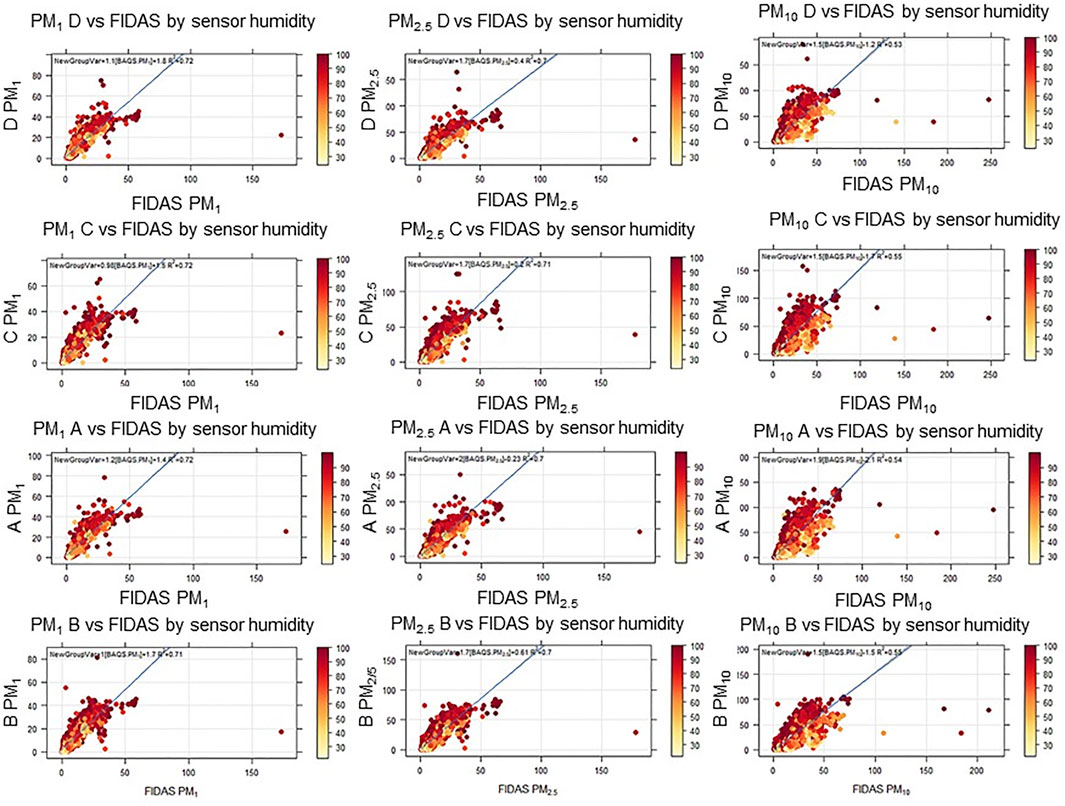
FIGURE 2. Plots of particulate matter concentrations from low-cost sensor vs. FIDAS by humidity.
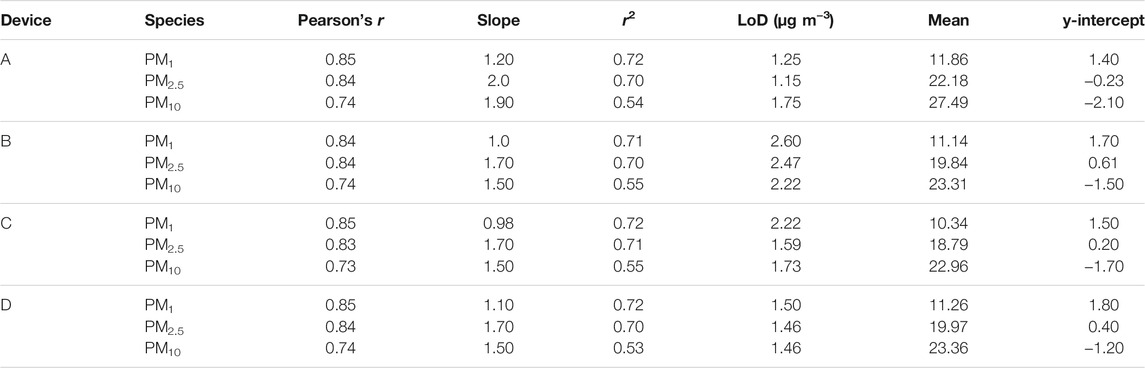
TABLE 2. Correlation coefficients and statistics for low-cost devices (R, r2, and slope are in comparison to Birmingham Air Quality Supersite FIDAS).
3.2 Device Consistency
An intercomparison between the low-cost devices demonstrates a positive relationship with all measuring similar concentrations. Good linearity between the devices is also demonstrated (Figure 3), with Pearson’s r values between pairs ranging from 0.92 to 0.99 across all species (size ranges) and devices. The range in mean concentration recorded by the devices is 1.52, 3.39, and 4.53 µg m−3 for PM1, PM2.5, and PM10, respectively. Low-cost devices experience some extreme variations from the mean, especially for PM1 and PM2.5 species, as can be seen in Figure 4. The greatest variations in performance were related to PM2.5, with a difference of maximum concentration recorded between sensors of 47 µg m−3, which is greater than the manufacturer specification of ±10 µg m−3 at <100 µg m−3 and ±10% at >100 µg m−3. The range in mean concentration recorded by the devices is 1.52, 3.39, and 4.53 µg m−3 for PM1, PM2.5, and PM10, respectively. Overall, although all size ranges show a good inter-device concentration agreement, this generally decreases with size, suggesting a size-dependent impact on sensor performance. In contrast to Zou et al. (2021), it was found that performance decreased with particle size in terms of both inter-sensor precision and linearity with respect to the reference instrument.
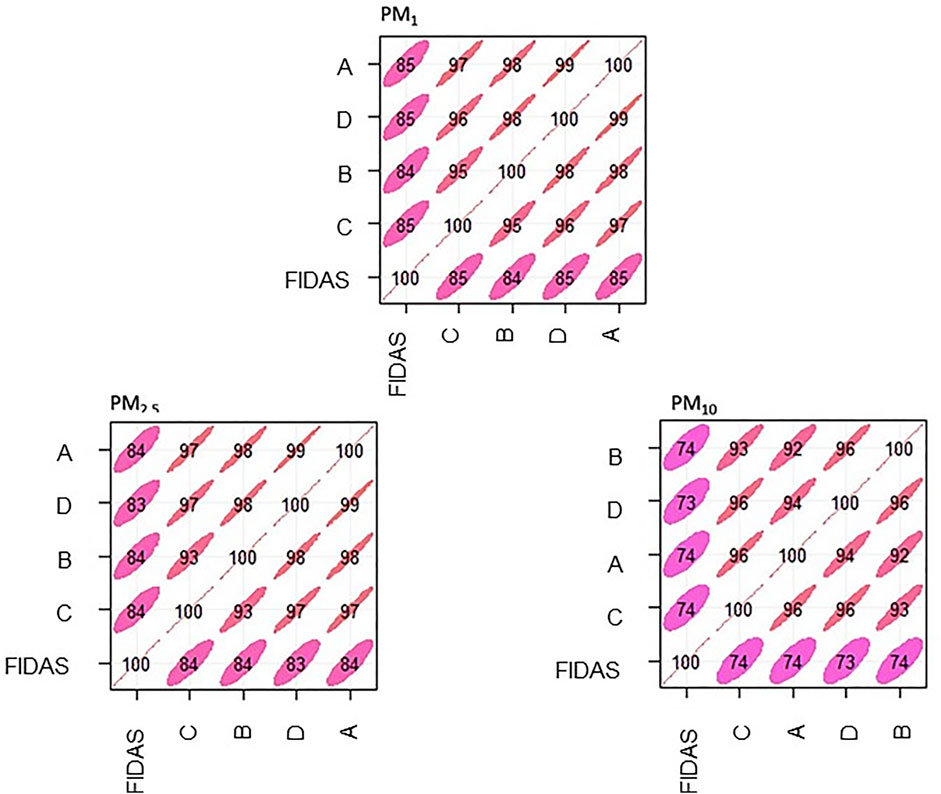
FIGURE 3. Correlation plot demonstrating inter-sensor correlation and correlation to reference instrumentation.
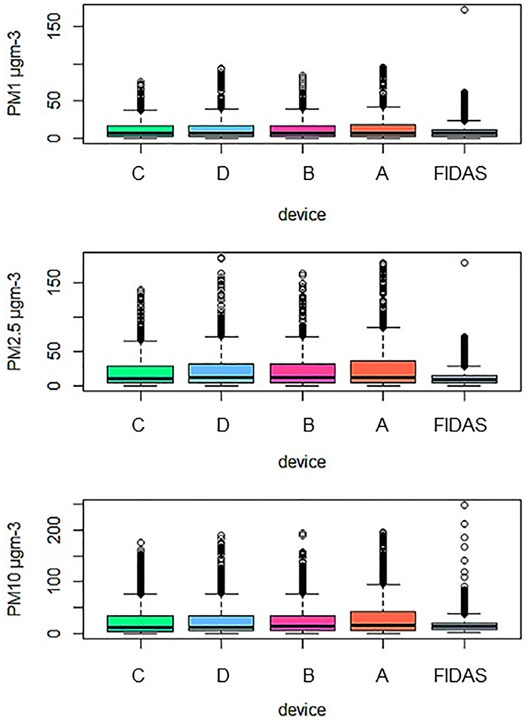
FIGURE 4. Box plot of particulate matter concentrations from low-cost sensors and FIDAS for PM1, PM2.5, and PM10.
3.3 Impact of Relative Humidity and Particle Composition
The relationship between PMS sensors and relative humidity was investigated to see if the PMS data showed significant dependencies upon humidity, especially during high humidity episodes, as suggested by prior literature (Crilley et al., 2018; Sayahi et al., 2019; Zamora et al., 2019). It is important to note that particulate composition determines the hygroscopic characteristics of PM, and this will vary between studies (Crilley et al., 2018).
From an inspection of the ratio of Altasense PM device/FIDAS PM mass concentration versus humidity in Figure 5, it appears that there is a non-linear response at high relative humidity values (∼85%+). This behavior was also seen in other studies which used an alternative low-cost PM sensor, Alphasense OPC-N2, and is consistent with the trend expected from hygroscopic particle growth curves (Pöschl 2005; Crilley et al., 2018). However, the point of inflection appears higher than that of laboratory studies of PMS5003, where humidity impacted the ratio of PMS/reference at values of 74–80%, depending on the composition of the particulate used (Tryner et al., 2020b). The higher humidity threshold may be due to composition differences between the literature lab assessments vs. this field evaluation or due to differences in the reference instrument used. For information, the ACSM at this study site during March and April 2021 recorded an average total organic mass of 1.71 µg m−3, with average NH4, SO4, and NO3 values measured at 0.8 , 0.47, and 1.23 µg m−3, respectively.
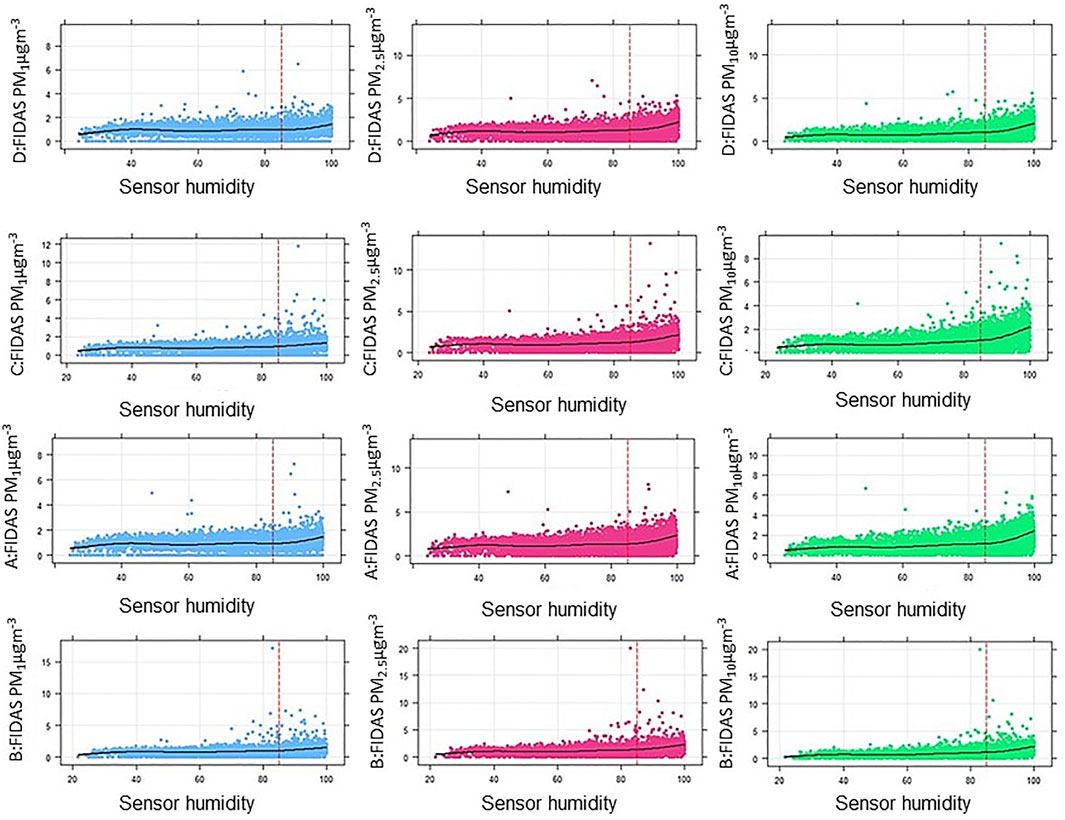
FIGURE 5. Ratio of Altasense PM concentrations/FIDAS PM concentrations vs. humidity, with 85% humidity marked in red.
As the composition of PM will determine the hygroscopicity of particles and therefore the relationship between the PM levels recorded and humidity, the impact of composition was also assessed (Figure 6).
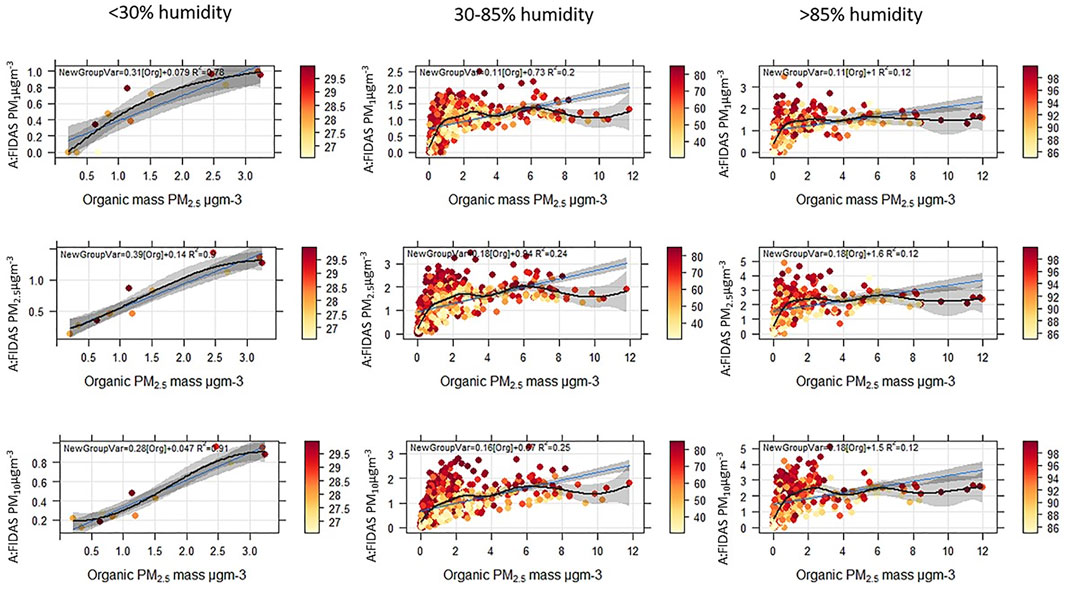
FIGURE 6. Examples of Altasense PM/reference PM concentrations from sensor A by organic concentrations from ACSM by humidity at different humidity intervals. Linear equation of ratio by organic mass concentration is shown on the plot.
At lower humidity, the ratio of Altasense PM/reference increases rapidly with increased organic content, but this increase slows down at moderate and high humidity. There is some indication that RH dominates over organic content in controlling the ratio, particularly at higher humidity. When plotting the ratio of Altasense PM/reference vs. total organic mass from the ACSM by humidity, it becomes clear that there is a large variation in Altasense PM/reference for similar organic concentrations. This suggests the importance of correcting for humidity.
While it is expected that as the reference instrument and PMS5003 may broadly react similarly to changing particle composition as both are based on the same light-scattering principle, these findings further confirm the results of the previous laboratory study of PMS5003 where varying the composition of particulates changed the relationship with the reference instrument (Tryner et al., 2020b).
3.4 Drift
It is suggested in the literature that some particles may struggle to leave the chamber of the low-cost sensor due to the 90° angle of the particle path (Sayahi et al., 2019). This may result in drift in the form of increased ratio over time at higher humidity as particle buildup in the sensor may swell at higher humidity, thus leading to further over-reading. As particle buildup increases over time, so could the amount of over-reading that occurs. Previous research indicates that the low-cost sensor used will experience a significant drift after 1 year of monitoring 15 µg m−3, with the performance starting to decrease from around 120 days at this concentration and significantly worsening by 20× by the end of a year window, with drift being measured as an increase in variation from a median in a simulated aging scenario (Tryner et al., 2020b). However, with the battery life of the Altasense PM sensor presently limited to just over 8 weeks, this would indicate that drift should not be a significant problem during this timeframe. When an Altasense PM has a battery change, it should be collocated again with reference instrumentation to not only update calibration equations but also assess for further potential drift to see if the device is stable for a further 8 weeks of data collection. The results of the weekly breakdown on the ratio of Altasense PM/reference are shown in Figure 7. As expected, the sensors demonstrated similar patterns—the slope varied across the weeks, mostly increasing weekly when humidity was over 85% and with a less clear pattern for lower-humidity periods.
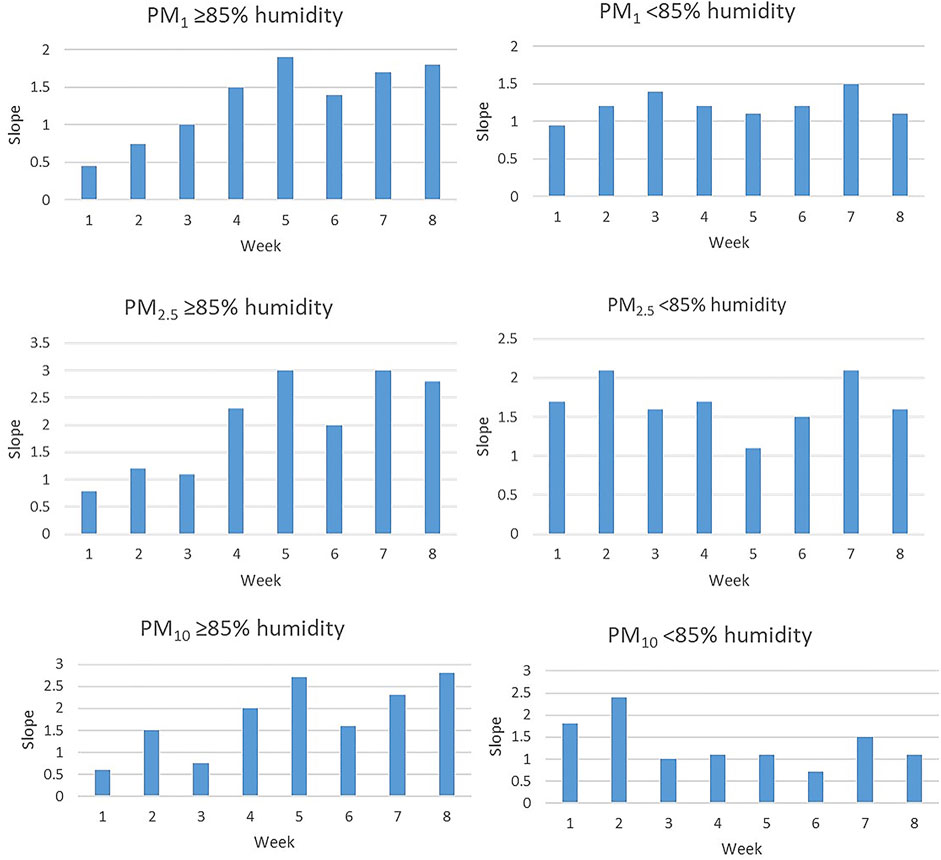
FIGURE 7. Slope of low-cost sensor PM concentrations vs. FIDAS by week, separated by readings that occurred when the sensor recorded <85% humidity and ≥85% humidity for sensor B.
3.5 Development of a Correction Factor for RH Effects
These analyses highlight that the PMS5003 cannot be corrected by a singular linear model alone and requires a more comprehensive correction for the impact of humidity. Sensors will be best calibrated in field sites near to their deployment so that corrections are developed in areas with similar particulate composition as future deployment sites to take into effect the role of hygroscopic particles in influencing readings in different meteorological environments (Crilley et al., 2018; Zusman et al., 2020). Calibration modes may need reassessing over time, not just due to potential drift but also since atmospheric composition is unlikely to remain stable across seasons, and thus models may change to reflect the altered chemical composition and hygroscopic properties of particulates (Sayahi et al., 2019).
There has been a development of correction factors in the literature founded on κ-Köhler theory for the Alphasense OPC-N2 sensor that requires either a reference instrument that can measure dry particle mass or, failing that, that can draw a generic κ value for the environment sampled from the literature (Crilley et al., 2018; Di Antonio et al., 2018). The method from the OPC evaluation of Crilley et al. (2018) suggests using a linear correction when humidity is <85% and a correction factor derived as detailed below when humidity is ≥85%:
where aw (water activity) is defined as RH/100 and with κ = 0.36 [expected κ for Europe as drawn from Pringle et al. (2010) and Crilley et al. (2018)].
However, when applying this method using either Europe- or Birmingham-specific κ values drawn from the literature (Table 3), the Altasense PM data becomes overcorrected and loses the trends from the FIDAS (Figure 8). This method may not work as it was developed using ambient RH, but this study uses humidity values from the inlet of the sensor as this reflects the air being sampled more closely. This is similar to the results found by Tryner et al. (2020b) where Köhler-based corrections for the Plantower cause an underestimation of the results—they suggest that past literature with linear correction models demonstrate better performance relative to reference instrumentation (Zusman et al., 2020).

TABLE 3. κ values drawn from Pringle et al. (2010)—column 1 and from Crilley et al.(2018)—columns 2–5.
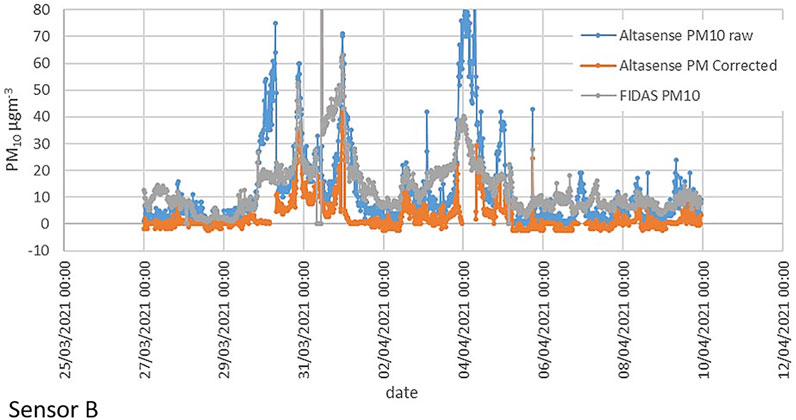
FIGURE 8. Example of over-correction when using the K-Köhler method stated above for one of the Altasense PM units for PM10 concentrations.
The final model uses one linear correction equation per PM species (PM1, PM2.5, and PM10) for values when humidity is recorded at <85% and another when humidity is ≥85% (as per Figure 9 and Table 4 which outlines the results of sensor performance post-correction). Furthermore, 85% was selected as this is the value not only at which hygroscopic growth curves suggesting changes to response should be seen but also reflective of our data as a slope of Altasense PM vs. FIDAS varies by an average of 0.25, 0.2, and 0.15 for PM1, PM2.5, and PM10, respectively, when plotting data from ≥85% humidity compared to <85% (Pöschl 2005). Using this model, Pearson’s r values range 0.81–0.91 vs. 0.73–0.85 from uncorrected values. Time series plots also demonstrate the ability of the sensor to detect trends well after these corrections—there are no longer extended periods of over-reading, with the majority of concentrations sitting very close to the reference instrument values. It is expected that, due to the drift indicators discussed above, these linear models will need recalculating as part of the 8 weeks of service when the batteries are changed. Overall, this method has promising results as well as reduces the need for environment-specific composition data, making the low-cost sensors more deployable in low/middle-income environments.
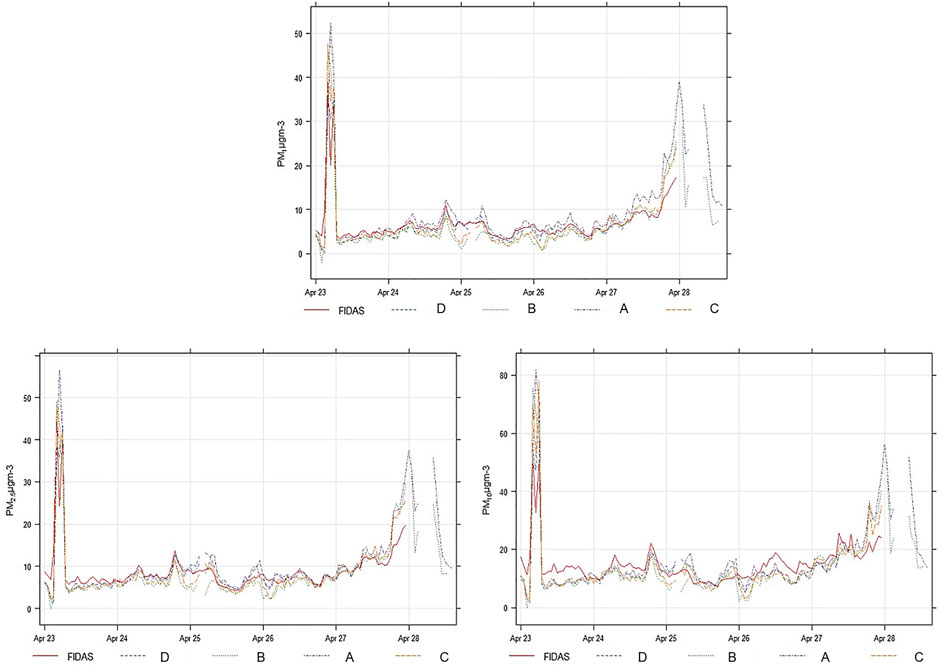
FIGURE 9. Time plots of hourly averaged PM concentrations for Altasense PM and FIDAS after correction using the multi-linear approach that differentiates correction by humidity.
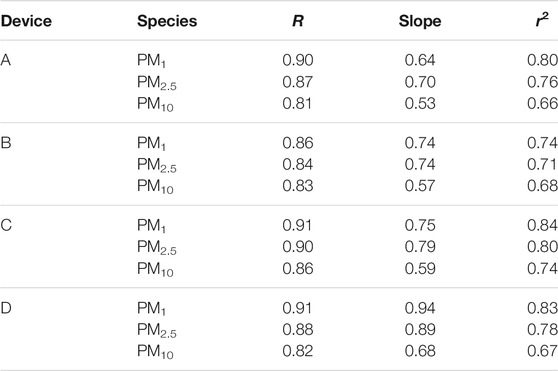
TABLE 4. Correlation results for Altasense PM vs. FIDAS for the period 23.04.21–27.04.21 after correction using the multi-linear approach. One device (B) has a tendency to underestimate compared to the other sensors. This device has performed slightly worse than the others in linearity correlations, and this demonstrates some of the concerns about the replicability of data between low-cost sensors due to the unknown manufacturing standards. Despite this, it still generally performs well.
3.6 Limit of Detection
Limit of detection (LoD) identifies the lowest concentration that a sensor can significantly differentiate from a true zero concentration (Castell et al., 2017; Rai et al., 2017). It is calculated here using the Kaiser and Specker (1956) method with definitions set as in Sayahi et al. (2019) and Wang et al. (2015):
where σblk is the standard deviation of a PMS sensor output at blank conditions. The definition of blank conditions is when the co-located FIDAS reads PM as <1 µg m−3 for each species of PM, respectively.
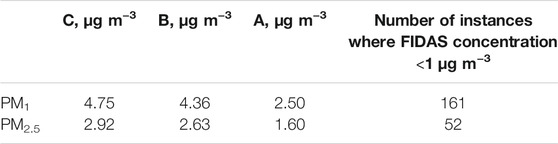
TABLE 5. LoDs for corrected data for Altasense PM devices A, B, and C for PM2.5 and PM1 (LoD for PM10 was not calculated due to the limited number of instances where the FIDAS concentration was <1 µg m−3).
The literature suggests that higher LoDs may be expected with smaller particle sizes due to their inability to scatter light efficiently, causing under-reading, and this is reflected within these results, with PM1 experiencing larger LoDs than PM2.5 (Bulot et al., 2019). The LoDs found here are much lower than those reported by Sayahi et al. (2019) which reported up to 5.37 µg m−3 for PM2.5. Indeed LoD values also sit lower than the ranges reported for other low-cost PM devices (Wang et al., 2015). This suggests that the ability of the sensors to detect PM at extremely low concentrations may be limited; however, given the application for urban monitoring [the 2016 average PM2.5 concentration in London was 13.3 µg m−3 (Greater London Authority 2019), whereas Delhi has experienced monthly PM2.5 averages >200 µg m−3 (Gorai et al., 2018)], this is not seen as a significant concern. In the context of Birmingham, the average PM2.5 LoD for the Altasense PM device would have been able to capture 94.7% PM2.5 of concentrations recorded at the Birmingham A4540 ring road DEFRA site between 2017 and 2020.
4 Conclusion
The Plantower PMS5003, modified as an IoT-capable device, provides the opportunity to monitor air quality at a low cost. The underpinning IoT philosophy enables this device to be deployed in large networks and provides an opportunity to monitor particulates at an unprecedented spatial resolution. The simple design of the sensors allows for a semi-permanent approach, with the sensors being able to be easily moved and the networks adjusted according to end-user requirements. The low power aspect of the IoT Sigfox integration and the ability to limit power draw from the PMS5003 with shutdown time allow for frequent communication of near-real-time data to an online platform, without compromising location by requiring main power. Data can be accessed and assessed remotely and instantly, without the need for staff at an air quality station. This means that, with the correct data contract, units can be deployed anywhere with a Sigfox connection—currently, over 80 countries worldwide, including low-, middle-, and high-income countries, enable low-cost PM monitoring in many different environmental and anthropogenic contexts.
The results from this study demonstrates the ability of the Plantower PMS5003 to detect PM trends and concentrations relative to the research-grade PALAS FIDAS instrumentation over an 8-week period and with improvements after applying a correction factor. The inter-sensor variability is low, and there are strong correlations between the reference instrument and low-cost units, as expected from instruments based on the same light-scattering principle. It has been demonstrated that humidity and particulate composition play a role in sensor performance, but the results can be improved by minimal calibration efforts. After correction, the low-cost devices perform well, particularly at recording peaks in particulate concentrations when they match extremely well with the reference measurements. This may be because the data used to train the model experienced several periods of higher concentrations (>20 µg m−3), generating a correction that is favorable to these conditions. This is also highlighted by Zusman et al. (2020). It is important that sensors are calibrated in an environment similar to which they will be deployed to allow for corrections to be appropriate for the particulate composition and environmental factors.
Future work designing a custom PCB to increase the durability and replicability of the unit will allow for easier deployment of large numbers of sensing units. Extending the battery life will also be a key priority, after which it will be imperative to revisit drift assessments to take into account the extended monitoring periods (Sayahi et al., 2019). Overall, this study has highlighted the feasibility of using the IoT for dense sensor networks to monitor PM. Once deployed at scale, longitudinal studies will provide unprecedented insights into the spatial distribution of PM.
Data Availability Statement
The raw data supporting the conclusion of this article will be made available by the authors without undue reservation.
Author Contributions
NC was responsible for initial data, analysis, and writing. LC and WB supervised the project, provided guidance for analysis, and supported in editing the paper. FP was a supporting editor and supported with data analysis.
Funding
This work was funded as part of the NERC RISE WM-Air project (NE/S003487/1), EPSRC UKCRIC Urban Observatories project (EP/P016782/1), and EPSRC IAA funding which helped support the translation. BAQS is supported through the NERC project OSCA (NE/T001976/1).
Conflict of Interest
The authors declare that the research was conducted in the absence of any commercial or financial relationships that could be construed as a potential conflict of interest.
Publisher’s Note
All claims expressed in this article are solely those of the authors and do not necessarily represent those of their affiliated organizations or those of the publisher, the editors, and the reviewers. Any product that may be evaluated in this article or claim that may be made by its manufacturer is not guaranteed or endorsed by the publisher.
Acknowledgments
The assistance of Siqi Hou and colleagues at the Birmingham Air Quality Supersite at the University of Birmingham in the colocation of sensors as part of this project is also acknowledged.
References
Air Quality Expert Group (2012). Fine Particulate Matter (PM2.5) in the United Kingdom. Editor DEFRA (London: DEFRA).
Air Quality Expert Group (2019). Non-Exhaust Emissions from Road Traffic. Editor DEFRA (London: DEFRA).
Amato, F., Cassee, F. R., Denier van der Gon, H. A. C., Gehrig, R., Gustafsson, M., Hafner, W., et al. (2014). Urban Air Quality: the challenge of Traffic Non-exhaust Emissions. J. Hazard. Mater. 275, 31–36. doi:10.1016/j.jhazmat.2014.04.053
Beddows, D. C. S., and Harrison, R. M. (2021). PM10 and PM2.5 Emission Factors for Non-exhaust Particles from Road Vehicles: Dependence upon Vehicle Mass and Implications for Battery Electric Vehicles. Atmos. Environ. 244, 117886. doi:10.1016/j.atmosenv.2020.117886
Brady, J., Nolan, K., Nolan, M., and Kelly, M. (2020). Alert System for Internet of Things (IoT) Devices. Google Patents US20200357259A1.
Brook, R. D., Rajagopalan, S., Pope, C. A., Brook, J. R., Bhatnagar, A., Diez-Roux, A. V., et al. (2010). Particulate Matter Air Pollution and Cardiovascular Disease. Circulation 121 (21), 2331–2378. doi:10.1161/cir.0b013e3181dbece1
Bulot, F. M. J., Johnston, S. J., Basford, P. J., EastonEaston, N. H. C., Apetroaie-Cristea, M., Foster, G. L., et al. (2019). Long-term Field Comparison of Multiple Low-Cost Particulate Matter Sensors in an Outdoor Urban Environment. Sci. Rep. 9 (1), 1–13. doi:10.1038/s41598-019-43716-3
Carslaw, D. C., and Ropkins, K. (2012). Openair - an R Package for Air Quality Data Analysis." Environ. Model. Softw. 27-28, 52–61. doi:10.1016/j.envsoft.2011.09.008
Castell, N., Dauge, F. R., Schneider, P., Vogt, M., Lerner, U., Fishbain, B., et al. (2017). Can Commercial Low-Cost Sensor Platforms Contribute to Air Quality Monitoring and Exposure Estimates? Environ. Int. 99, 293–302. doi:10.1016/j.envint.2016.12.007
Chapman, L., MullerMuller, C. L., Young, D. T., Warren, E. L., Grimmond, C. S. B., CaiFerranti, X.-M., et al. (2015). The Birmingham Urban Climate Laboratory: An Open Meteorological Test Bed and Challenges of the Smart City. Bull. Am. Meteorol. Soc. 96 (9), 1545–1560. doi:10.1175/bams-d-13-00193.1
Chee-Yee Chong, Chee-Yee., and Kumar, S. P. (2003). Sensor Networks: Evolution, Opportunities, and Challenges. Proc. IEEE 91, 1247–1256. doi:10.1109/JPROC.2003.814918
Crilley, L. R., Singh, A., Kramer, L. J., Shaw, M. D., Alam, M. S., Apte, J. S., et al. (2020). Effect of Aerosol Composition on the Performance of Low-Cost Optical Particle Counter Correction Factors. Atmos. Meas. Tech. 13 (3), 1181–1193. doi:10.5194/amt-13-1181-2020
Crilley, L. R., Shaw, M., Pound, R., Kramer, L. J., Price, R., Young, S., et al. (2018). Evaluation of a Low-Cost Optical Particle Counter (Alphasense OPC-N2) for Ambient Air Monitoring. Atmos. Meas. Tech. 11, 709–720. doi:10.5194/amt-11-709-2018
De Nazelle, A., Bode, O., and Orjuela, J. P. (2017). Comparison of Air Pollution Exposures in Active vs. Passive Travel Modes in European Cities: A Quantitative Review. Environ. Int. 99, 151–160. doi:10.1016/j.envint.2016.12.023
Di Antonio, A., Popoola, O., Ouyang, B., Saffell, J., and Jones, R. (2018). Developing a Relative Humidity Correction for Low-Cost Sensors Measuring Ambient Particulate Matter. Sensors 18 (9), 2790. doi:10.3390/s18092790
Dogeanu, A., Nastase, I., Ursu, I., Enciu, D., Bode, F., Sandu, M., et al. (2019). “Real Time Monitoring Network Demonstrator for Air Quality Management,” in 2019 International Conference on ENERGY and ENVIRONMENT (CIEM), Timisoara, Romania, October 17-18, 2019. doi:10.1109/ciem46456.2019.8937625
Environment Protection Authority (2004). Photochemical Smog—What it Means for Us Adelaide. Victoria: EPA.
European Union (2008). Directive 2008/50/EC of the European Parliament and of the Council of 21 May 2008 on Ambient Air Quality and Cleaner Air for Europe. Official Journal of the European Union.
Fishbain, B., Lerner, U., Castell, N., Cole-Hunter, T., Popoola, O., Broday, D. M., et al. (2017). An Evaluation Tool Kit of Air Quality Micro-sensing Units. Sci. total Environ. 575, 639–648. doi:10.1016/j.scitotenv.2016.09.061
Gomez, C., Veras, J. C., Vidal, R., Casals, L., and Paradells, J. (2019). A Sigfox Energy Consumption Model. Sensors 19 (3), 681. doi:10.3390/s19030681
Gorai, A. K., Tchounwou, P. B., Biswal, S., and Tuluri, F. (2018). Spatio-Temporal Variation of Particulate Matter(PM2.5) Concentrations and its Health Impacts in a Mega City, Delhi in India. Environ. Health Insights 12, 1178630218792861. doi:10.1177/1178630218792861
Greater London Authority (2019). PM2.5 in London:Roadmap to Meeting World Health Organization Guidelines by 2030. London: City Hall.
Gulia, S., Khanna, I., Shukla, K., and Khare, M. (2020). Ambient Air Pollutant Monitoring and Analysis Protocol for Low and Middle Income Countries: An Element of Comprehensive Urban Air Quality Management Framework. Atmos. Environ. 222, 117120. doi:10.1016/j.atmosenv.2019.117120
He, M., Kuerbanjiang, N., and Dhaniyala, S. (2020). Performance Characteristics of the Low-Cost Plantower PMS Optical Sensor. Aerosol Sci. Tech. 54 (2), 232–241. doi:10.1080/02786826.2019.1696015
IAQM (2018). IAQM Guidance on Air Quality Monitoring in the Vicinity of Demolition and Construction Sites. London, UK: Institute of Air Quality Management.
Joris, L., Dupont, F., Laurent, P., Bellier, P., Stoukatch, S., and Redoute, J.-M. (2019). An Autonomous Sigfox Wireless Sensor Node for Environmental Monitoring. IEEE Sens. Lett. 3 (7), 01–04. doi:10.1109/lsens.2019.2924058
Kaiser, H., and Specker, H. (1956). Bewertung und Vergleich von Analysenverfahren. Z. Anal. Chem. 149, 46–66. doi:10.1007/bf00454145
Knoll, M., Breitegger, P., and Bergmann, A. (2018). Low-Power Wide-Area Technologies as Building Block for Smart Sensors in Air Quality Measurements. Elektrotech. Inftech. 135 (6), 416–422. doi:10.1007/s00502-018-0639-y
Kularatna, N., and Sudantha, B. H. (2008). An Environmental Air Pollution Monitoring System Based on the IEEE 1451 Standard for Low Cost Requirements. IEEE Sensors J. 8 (4), 415–422. doi:10.1109/jsen.2008.917477
Lavric, A., and Valentin, P. (2017). “Internet of Things and LoRa™ Low-Power Wide-Area Networks: a Survey,” in 2017 International Symposium on Signals, Circuits and Systems (ISSCS), Iasi, Romania, July 13-14, 2017.
Lewis, A. C., Lee, J. D., Edwards, P. M., Shaw, M. D., Evans, M. J., Moller, S. J., et al. (2016). Evaluating the Performance of Low Cost Chemical Sensors for Air Pollution Research. Faraday Discuss. 189 (0), 85–103. doi:10.1039/C5FD00201J
Lewis, A., Richard Peltier, W., and von Schneidemesser, E. (2018). Low-cost Sensors for the Measurement of Atmospheric Composition: Overview of Topic and Future Applications. Research Report. Geneva, Switzerland: World Meteorological Organization (WMO).
Mekki, K., Bajic, E., Chaxel, F., and Meyer, F. (2018). “Overview of Cellular LPWAN Technologies for IoT Deployment: Sigfox, LoRaWAN, and NB-IoT,” in 2018 ieee international conference on pervasive computing and communications workshops (percom workshops), Athens, Greece, March 19-23, 2018. doi:10.1109/percomw.2018.8480255
Pisoni, E., Christidis, P., Thunis, P., and Trombetti, M. (2019). Evaluating the Impact of “Sustainable Urban Mobility Plans” on Urban Background Air Quality. J. Environ. Manag. 231, 249–255. doi:10.1016/j.jenvman.2018.10.039
Pöschl, U. (2005). Atmospheric Aerosols: Composition, Transformation, Climate and Health Effects. Angew. Chem. Int. Edition 44 (46), 7520–7540. doi:10.1002/anie.200501122
Pringle, K. J., Tost, H., Pozzer, A., Pöschl, U., and Lelieveld, J. (2010). Global Distribution of the Effective Aerosol Hygroscopicity Parameter for CCN Activation. Atmos. Chem. Phys. 10 (12), 5241–5255. doi:10.5194/acp-10-5241-2010
Quarmby, S., Santos, G., and Mathias, M. (2019). Air Quality Strategies and Technologies: A Rapid Review of the International Evidence. Sustainability 11 (10), 2757. doi:10.3390/su11102757
Rai, A. C., Kumar, P., Pilla, F., Skouloudis, A. N., Di Sabatino, S., Ratti, C., et al. (2017). End-user Perspective of Low-Cost Sensors for Outdoor Air Pollution Monitoring. Sci. Total Environ. 607-608, 691–705. doi:10.1016/j.scitotenv.2017.06.266
Sayahi, T., Butterfield, A., and Kelly, K. E. (2019). Long-term Field Evaluation of the Plantower PMS Low-Cost Particulate Matter Sensors. Environ. Pollut. 245, 932–940. doi:10.1016/j.envpol.2018.11.065
Sheng, Z., Mahapatra, C., Zhu, C., and Leung, V. C. M. (2015). Recent Advances in Industrial Wireless Sensor Networks toward Efficient Management in IoT. IEEE access 3, 622–637. doi:10.1109/access.2015.2435000
Sigfox (2020). What Is Sigfox? | Sigfox Build. Available at: https://build.sigfox.com/sigfox (Accessed June 4, 2020).
Snyder, E. G., Watkins, T. H., Solomon, P. A., ThomaThoma, E. D., Williams, R. W., Hagler, G. S. W., et al. (2013). The Changing Paradigm of Air Pollution Monitoring. Environ. Sci. Technol. 47 (20), 11369–11377. doi:10.1021/es4022602
Timmers, V. R. J. H., and Achten, P. A. J. (2016). Non-exhaust PM Emissions from Electric Vehicles. Atmos. Environ. 134, 10–17. doi:10.1016/j.atmosenv.2016.03.017
Tryner, J., L'Orange, C., Mehaffy, J., Miller-Lionberg, D., Hofstetter, J. C., Wilson, A., et al. (2020a). Laboratory Evaluation of Low-Cost PurpleAir PM Monitors and In-Field Correction Using Co-located Portable Filter Samplers. Atmos. Environ. 220, 117067. doi:10.1016/j.atmosenv.2019.117067
Tryner, J., Mehaffy, J., Miller-Lionberg, D., and Volckens, J. (2020b). Effects of Aerosol Type and Simulated Aging on Performance of Low-Cost PM Sensors. J. Aerosol Sci. 150, 105654. doi:10.1016/j.jaerosci.2020.105654
Wang, Y., Li, J., Jing, H., Zhang, Q., Jiang, J., and Biswas, P. (2015). Laboratory Evaluation and Calibration of Three Low-Cost Particle Sensors for Particulate Matter Measurement. Aerosol Sci. Tech. 49 (11), 1063–1077. doi:10.1080/02786826.2015.1100710
WHO (2019). Air Pollution. Available at: https://www.who.int/health-topics/air-pollution#tab=tab_1 (Accessed March 24, 2020).
Williams, R., Kilaru, V., Snyder, E., Kaufman, A., Dye, T., Rutter, A., et al. (2014a). Air Sensor Guidebook. Washington DC: U.S Environmental Protection Agency.
Williams, R., Kaufman, A., Hanley, T., Rice, J., and Garvey, S. (2014b). Evaluation of Field-Deployed Low Cost PM Sensors. Washington DC: US Environmental Protection Agency.
Young, D. T., Chapman, L., Muller, C. L., Cai, X.-M., and Grimmond, C. S. B. (2014). A Low-Cost Wireless Temperature Sensor: Evaluation for Use in Environmental Monitoring Applications. J. Atmos. Oceanic Tech. 31 (4), 938–944. doi:10.1175/jtech-d-13-00217.1
Zamora, M. L., Xiong, F., Gentner, D., Kerkez, B., Kohrman-Glaser, J., and Koehler, K. (2019). Field and Laboratory Evaluations of the Low-Cost Plantower Particulate Matter Sensor. Environ. Sci. Technol. 53 (2), 838–849. doi:10.1021/acs.est.8b05174
Zheng, T., Bergin, M. H., Johnson, K. K., Tripathi, S. N., Shirodkar, S., Landis, M. S., et al. (2018). Field Evaluation of Low-Cost Particulate Matter Sensors in High- and Low-Concentration Environments. Atmos. Meas. Tech. 11 (8), 4823–4846. doi:10.5194/amt-11-4823-2018
Zhu, Q., Wang, R., Chen, Q., Liu, Y., and Qin, W. (2010). “Iot Gateway: Bridgingwireless Sensor Networks into Internet of Things,” in 2010 IEEE/IFIP International Conference on Embedded and Ubiquitous Computing, Hong Kong, China, December 11-13, 2010. doi:10.1109/euc.2010.58
Zou, Y., Clark, J. D., and May, A. A. (2021). Laboratory Evaluation of the Effects of Particle Size and Composition on the Performance of Integrated Devices Containing Plantower Particle Sensors. Aerosol Sci. Tech. 55 (7), 1–14. doi:10.1080/02786826.2021.1905148
Keywords: nephelometer, IoT—Internet of things, particulate matter, sensor networks, low-cost sensor, air quality
Citation: Cowell N, Chapman L, Bloss W and Pope F (2022) Field Calibration and Evaluation of an Internet-of-Things-Based Particulate Matter Sensor. Front. Environ. Sci. 9:798485. doi: 10.3389/fenvs.2021.798485
Received: 20 October 2021; Accepted: 22 December 2021;
Published: 07 February 2022.
Edited by:
Pedro Oyola, Centro Mario Molina, ChileReviewed by:
Ivo Allegrini, Independent researcherEduardo Landulfo, Instituto de Pesquisas Energéticas e Nucleares (IPEN), Brazil
Copyright © 2022 Cowell, Chapman, Bloss and Pope. This is an open-access article distributed under the terms of the Creative Commons Attribution License (CC BY). The use, distribution or reproduction in other forums is permitted, provided the original author(s) and the copyright owner(s) are credited and that the original publication in this journal is cited, in accordance with accepted academic practice. No use, distribution or reproduction is permitted which does not comply with these terms.
*Correspondence: Nicole Cowell, n.h.cowell@bham.ac.uk