A bibliometrics review of hotspots in water footprint research based on co-words network analysis
 Yun Sun
 Zhibin Wang
 Lien-Chieh Lee
 Xinming Li
 Yuan Wang
- 1School of Environmental Science and Engineering, Tianjin University, Tianjin, China
- 2North China Design and Research Institute of China Municipal Engineering, Tianjin, China
- 3School of Environmental Science and Engineering, Hubei Polytechnic University, Huangshi, China
The uneven distribution of water resources and production fragmentation make the study of water footprint an important part of water resources management and environmental research. This paper provides a bibliometrics analysis of 3822 papers related to the water footprint topic before 2021, including 2381 English papers from the Science Citation Index (SCI) database and 1441 Chinese papers from the China National Knowledge Infrastructure (CNKI) database. We applied the method of co-word analysis to study the changes in hot research fields in four stages and represented a comparative analysis of highly cited papers and the application of water footprint theory in various sectors. First, water footprint can be divided into two categories: “volumetric” water footprint and “impact-oriented” water footprint. “Volumetric” water footprint methodology focuses on water consumption while “impact-oriented” water footprint methodology focuses more on the environmental impact of water use. Water scarcity, carbon footprint, and grey water are the high-frequency keywords of both two databases. The research linkage of papers related to water footprint from the SCI database has gradually shifted to climate change and carbon emission, while, those from the CNKI database are more closely linked to ecological footprint and sustainable development. Second, SCI’s highly cited papers prefer to study the water footprint through scientific experiments from a bottom-up perspective, while CNKI’s highly cited papers prefer to combine economics and management theories to study the water footprint from a top-down perspective. In addition, water footprint theory is mainly applied in agriculture and industrial sectors and less in service sectors. This paper provides a review of water footprint research on a large scale and a reference for future research on water footprint.
1 Introduction
With the development of society, the scarcity of freshwater resources in the world has become increasingly prominent (Gleick 2000; Mekonnen and Hoekstra 2016). As the population continues to grow and dietary habits change, the shortage of freshwater resources will become increasingly serious (Rosegrant and Ringler 2000; Liu et al., 2008). Many scholars propose to study water footprint. The concept of virtual water is an important theoretical basis for the water footprint. Allan (1997) first proposed the concept of “virtual water”, and used imported virtual water as a strategy to alleviate water scarcity in the Middle East. Based on the study of virtual water, Hoekstra (2003) further proposed the concept of “water footprint” in 2002 to describe the impact of human activities on water resources. His idea originated from the ecological footprint theory proposed by Canadian scholars in the 1990s. The fragmentation of production is increasing internationally. The water footprint concept aims at illustrating the hidden links between human consumption and water use and between global trade and water resources management (Galli et al., 2012). Therefore, the water footprint has important practical significance to evaluate the environmental impact and allocation of water resources.
According to the methodologies of water footprint, water footprint can be divided into two categories: “volumetric” water footprint and “impact-oriented” water footprint (Berger & Finkbeiner 2013; Ren et al., 2020; Wu et al., 2022). The older methodology is the “volumetric” water footprint developed by professor Hoekstra and is based on the “Water Footprint Assessment Manual”, while “impact-oriented” or life cycle assessment (LCA) water footprint is a younger methodology that based on ISO 14046 (Berger & Finkbeiner, 2013). “Volumetric” water footprint methodology focuses on water consumption while “impact-oriented” water footprint methodology focuses more on the environmental impact of water use (Gerbens-Leenes et al., 2021). “Volumetric” water footprint, proposed by Hoekstra has three components: blue water, green water, and gray water (Hoekstra et al., 2011). The " green water” footprint refers to the rainwater consumed; the “blue water” footprint is the amount of freshwater consumption from rivers, lakes, and groundwater; “grey water footprint” refers to the amount of freshwater required to absorb the pollutant load generated during the production based on the existing water environmental quality standards (Hoekstra and Mekonnen 2012). Allan proposed the concept of embedded water, and later the more popular one of virtual water (Allan 1997). The importance of virtual water is that Allan has changed the way the world thinks about water and global trade by highlighting the role of ‘embedded water’ and its transfer between regions through international trade (Jägerskog and Lundqvist, 2022). In addition, the theoretical basis of water footprint research consists of resource flow, resource substitution, regional association and inter-regional coordination, comparative advantage, and ecological security (Chapagain et al., 2006). These studies have promoted the development of the concept of water footprint, from theory to method and practice.
With the development of water footprint, the related research has been increasing, and the bibliometric method has been applied in the field of water footprint. In 1969, Pritchard first introduced bibliometrics (Glänzel 2003). The definition of bibliometrics is “the quantitative study of physical published units, or of bibliographic units, or of the surrogates for either” (Broadus 1987). Bibliometrics is mainly used to reveal the structure of knowledge in specific fields (Samiee and Chabowski 2012). According to published papers of the water footprint, the information related to countries, institutions, journals, categories, top publications, keywords, hot issues, and research trends were studied in these papers by bibliometric method (Zhang et al., 2017; Zhu et al., 2019; Ma et al., 2020; Adetoro et al., 2021; Çaloğlu Büyükselçuk, 2021). Mubako (2018) provides an overview of blue, green, and grey water quantification approaches. In addition, some studies have focused on important sectors such as industry sector (Pires et al., 2018) and agricultural production sector (Xiao et al., 2022). What’s more, some studies have focused on specific countries and regions. Ansorge et al. (2019) compared the water footprint research in the Czech Republic and in abroad. Ansorge et al. (2021) presented a systematic overview of water footprint research in countries of former Yugoslavia. Zhu et al. (2019) and Zhuo et al. (2020) studied China’s water footprint.
However, the published literature on bibliometric analysis of water footprint seldom makes a comparative analysis of the characteristics of different databases. In addition, the published papers paid less attention to the changes in the hot areas of water footprint research at different stages. Thus, this paper compared the research situation of the water footprint of the SCI database and CNKI database before 2021 and analyzed the high-frequency keywords, application sectors, and highly cited papers. It is worth noting that we analyzed the characteristics and trends of the water footprint research in four stages were analyzed by using the co-word analysis method. These results provide a deeper understanding of the characteristics of water footprint theory and support a useful reference for future studies.
2 Data sources and methodology
According to PRISMA (Preferred Reporting Items for Systematic Reviews and Meta-Analyses) 2020 Checklist, we retrieved the papers from the SCI (https://www.webofscience.com/) and CNKI (https://www.cnki.net) databases related to the water footprint. The research methods of this paper are as follows: 1) data download. We entered the SCI database and typed “water footprint” in the topic field, and filtered the database as Web of Science Core Collection. Then we entered the CNKI database, typed “water footprint” in the topic field, and selected exact retrieval. Metadata was downloaded on 2 March 2022. Microsoft Excel was used for metadata analysis. The obtained information included authors, title, year of publication, abstracts, keywords, countries of publications, institutions, journals, and so on. 2) Data consolidation. By further screening the retrieved papers and removing papers irrelevant to water footprint research. In addition, to exclude non-traceable articles, the search only included original articles and reviews thereby eliminating other documents, because they are mostly viewed as an original contribution to the body of knowledge. We finally retrieved 1441 papers of CNKI and 2381 papers of SCI, and 44 papers were excluded from the analysis. 3) Data sorting. We combined keywords that have similar meanings, such as life cycle assessment and LCA, and singular or plural keywords such as emission and emissions. We classified the retrieved data according to the year of publication of the papers. Considering that the number of papers published before 2010 is far less than that of other years, we divided the year of the publication into four stages: before 2010, 2010–2013, 2014–2017, and 2018–2021.
This paper uses the co-word analysis method to analyze the research trends and characteristics of water footprint. Co-word analysis is a content analysis technique, which can effectively reflect the correlation strength of various information in text data. The results of the co-word analysis are based on the assumption that each area of study can be described by the most important keywords (Börner et al., 2003). The existence of two keywords in the same paper shows the connection between the topics (Ding et al., 2001). There are two steps in the co-word analysis as follows: first, select high-frequency keywords; then calculate the frequency of two different keywords appearing in an article (Wang et al., 2014). Because the co-word network analysis can reveal a research topic’s evolution trend, it has been widely applied in many research fields (Choi et al., 2011). Currently, many scholars use co-word analysis to visualize the internal structure of a particular field. For example, de la Hoz-Correa et al. (2018) analyzed the evolution of medical tourism (MT) research from 1931 to 2016 from a longitudinal perspective using bibliometrics and co-word analysis and visualized all potential and interrelated sub-fields. Olawumi and Chan (2018) made use of the papers on sustainable development research from 1991 to 2016 to generate the research network and geospatial map of this type of research by using co-word analysis.
The co-word network is composed of three elements: node, line, and cluster. Each node has a degree representing the number of lines connected to a node and is visualized as the node’s size. A larger node means that it is more interconnected with other nodes and plays a more important role. The lines between nodes represent the connection between them. Clusters are also called groups, and the nodes of the same cluster have a strong correlation (Li et al., 2017). Cluster analysis can divide the high-frequency keywords into a cluster, which is easy to find the research hotspots (Wang et al., 2019). There are many co-word network analysis tools such as Gephi, VOSviewer, and Pajek. Gephi is a free and open-source complex network visualization analysis software based on JVM (Java Virtual Machine), which has the function of cluster analysis and can visualize the co-word network. This study uses the Gephi network analysis tool because of its ability to handle different data formats; it has powerful filtering techniques and can manipulate large datasets in addition to its ability to develop visual illustrations for large networks which hastens the exploration work (Kiani Mavi et al., 2020). In this paper, Gephi is used to cluster the co-occurrence content in the literature information and draw the network map of the keyword co-occurrence relationship, which can reveal the research status and development trend of the discipline.
3 Result
3.1 Hotspot analysis of water footprint research from SCI
3.1.1 Analysis of SCI’s high-frequency keywords
In order to reveal the hotspots of water footprint research, this paper compared the top eight high-frequency keywords which appear most frequently in SCI’s papers Figure 1. The high-frequency keywords in the SCI mainly include water scarcity, carbon footprint, water consumption, grey water, China, blue water, and input-output analysis. The most frequent is water scarcity, which occurred with similar frequency in the four stages. The frequency of carbon footprints, blue water and water consumption varies widely across different stages. For example, the frequency of carbon footprint is very low before 2010, while blue water is very high in 2010. In addition, the frequency of grey water was very high from 2018 to 2021, which has become a recent research hotspot.
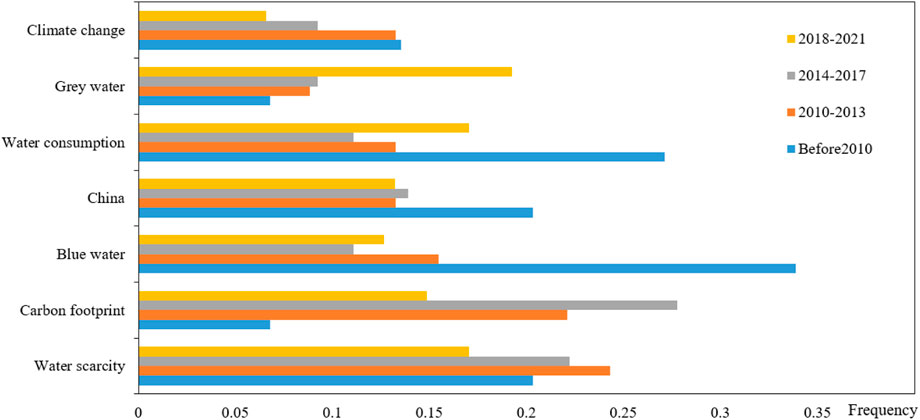
FIGURE 1. Top eight high-frequency keywords from SCI.
Research content mainly includes this category includes water scarcity, carbon footprint, water consumption, grey water, and blue water. These keywords are concepts related to environmental problems. Gray water footprint and blue water footprint are important parts of water footprint. Water scarcity and consumption are related to the water resource pressure that social development faces. The carbon footprint is an indicator of Climate change. A literature review indicates that the major categories of footprints developed to date are carbon, ecological, and water footprints, forming the so-called “footprint family” (Čuček et al., 2012). Many other lesser-known footprints exist, including nitrogen, phosphorus, energy, and biodiversity footprints. Such integration is important for a comprehensive understanding of environmental issues, policy formulation, and assessment of trade-offs between different environmental concerns (Vanham et al., 2019). The water footprint cannot fully assess the environmental impact of a product, so it is often used together with the carbon footprint to measure environmental stress. For example, Bonamente et al. (2016) proposed an assessment method that combines the carbon and water footprint to assess the environmental impact of Italian red wine. Vanham et al. (2019) assessed how the footprint family delivers on measuring progress toward Sustainable Development Goals (SDGs), considering its ability to quantify environmental pressures along the supply chain and relating them to the water-energy-food-ecosystem (WEFE) nexus and ecosystem services.
In addition, a large percentage of the papers studied the water footprint in China. This is because China’s water resources are unevenly distributed (about 66% of water resources are located in South China) and many parts of China are suffering from severe water shortages as a result (Liu et al., 2019). Moreover, the water demand is growing in China, exacerbating water scarcity issues (Distefano and Kelly, 2017). Therefore, China has attracted the attention of many scholars.
3.1.2 The co-word network analysis of SCI’s keywords
To study the trend of SCI’s hot research field, we conducted a co-word analysis of SCI high-frequency keywords. The top 30 SCI high-frequency keywords related to water footprint were selected and the “modular” function in Gephi was used for cluster analysis. We use the name of the central node as the cluster name. The analysis results were shown in Figure 2.
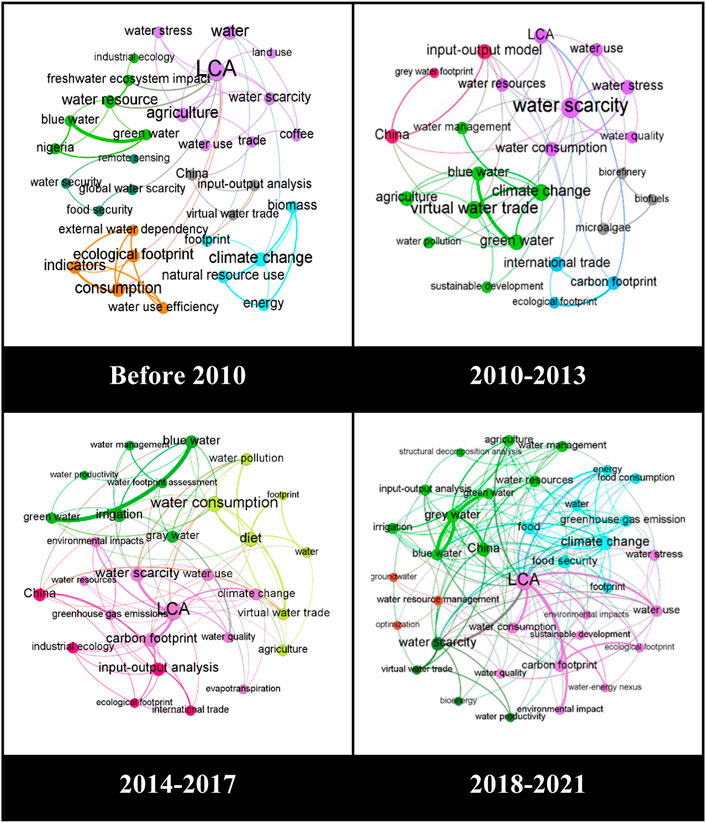
FIGURE 2. The evolutionary co-words network of water footprint from SCI.
Before 2010, there were 6 clusters in this stage, with weak connections between each cluster and a low degree of nodes, indicating that the research on water footprint is in its infancy. The 6 clusters are agriculture, consumption, water scarcity, climate change, ecological footprint, and virtual water trade. LCA method is the important node connecting clusters. Agriculture is the hottest topic at this stage.
From 2010 to 2013, there were 5 clusters in this stage, and the number of clusters decreased, indicating that many research fields have been continuously integrated after development. For example, the green water footprint cluster and blue water footprint cluster were integrated into a new cluster with the newly added virtual water trade as the central node. Two new clusters of biofuels and regional trade were added in this stage, and the carbon footprint appeared in the regional trade cluster for the first time.
From 2014 to 2017, there were 5 clusters in this stage. The water consumption cluster is gradually becoming the hot research field of water footprint. At this stage, carbon footprint and biofuels clusters were shrunk. A new cluster of irrigation was born.
From 2018 to 2021, there are four clusters in this stage, and the number of clusters is further reduced, and the relationship between each cluster is strong, some immature clusters disappear or merge with the mainstream cluster. The green water footprint cluster integrates the input-output analysis cluster, and the number of nodes in the cluster increases significantly, which may become a new hot research field in the future. Climate change has been a newly formed cluster. And food safety, food consumption and other nodes have been added to the climate change cluster.
With time, the content of the co-word network analysis of SCI’s keywords becomes richer and richer, and the network becomes more and more complex. This may be due to changes in the use of natural resources and the awareness of the environment as a whole.
3.1.3 Analysis of SCI’s highly cited papers
This paper retrieved the 10 SCI papers with the highest citation frequency in the water footprint field, as shown in Table 1. The research content of the paper is mainly divided into the following four categories:
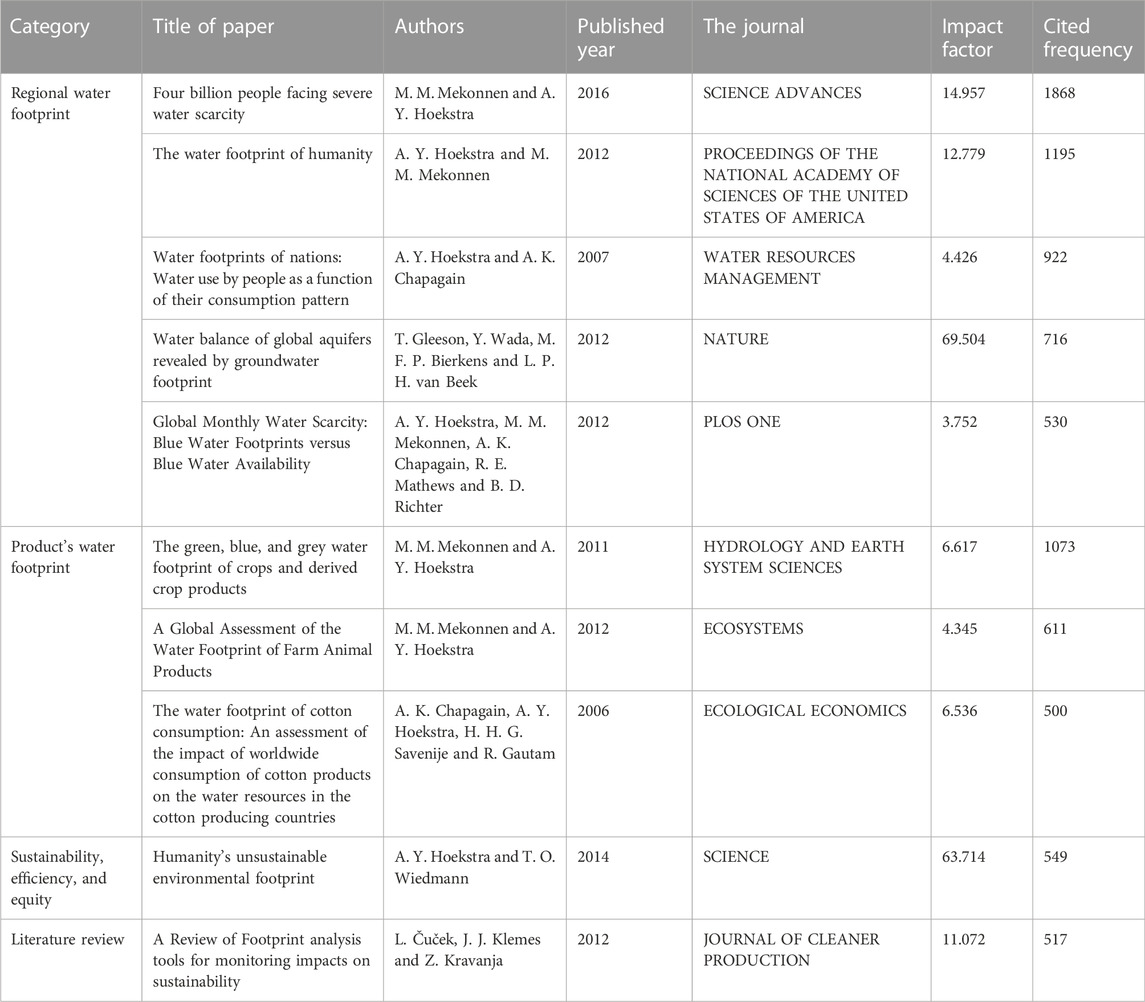
TABLE 1. SCI highly cited papers.
The first category of papers mainly studies the spatial and temporal differences of the global or regional water footprint on a macro scale. Mekonnen and Hoekstra (2016) assessed the global blue water shortage with high spatial resolution every month. They found that 4 billion people in the world live under severe water shortage for at least 1 month every year, and nearly half of them live in India and China. Hoekstra and Mekonnen (2012) estimated the global water footprint from the perspective of production and consumption. This study revealed that some countries are heavily dependent on foreign water resources and many countries have a significant impact on water consumption and pollution elsewhere. Hoekstra and Chapagain (2007) calculated the global water footprint from 1997 to 2001, and the global average water footprint was 1240 m3/year. It is suggested that the four main direct factors that determine a country’s water footprint are consumption, consumption patterns, climate, and actual crop production. Gleeson et al. (2012) found that the size of the global footprint of groundwater was about 3.5 times the basis of the actual area at present, about 1.7 billion people live in groundwater resources or rely on groundwater ecosystem threatened areas. They put forward a calculation method that uses groundwater footprint to assess agricultural yield potential. Hoekstra et al. (2012) analyzed 405 river basins between 1996 and 2005. The results showed that in 201 basins with 2.67 billion inhabitants, severe water shortages occur for at least 1 month each year.
The second category of papers is mainly about the product’s water footprint. Mekonnen and Hoekstra (2011) estimated the water footprint of 126 crops on a grid cell of 5 × 5 arc minute using a high-resolution method. They also calculated the water footprint of more than 200 derived crop products, including various types of flour, beverages, fiber, and biofuels. One year later, Mekonnen and Hoekstra (2012) estimated the water footprint of animal products, considering different production systems and feed composition per animal type and country. Chapagain et al. (2006) studied the water footprint of cotton production and found that on average 44% of the world’s water used for the growing and processing of cotton is not used for the domestic market, but for export. This means that nearly half of the world’s water problems related to the growth and processing of cotton can be attributed to foreign demand for cotton products.
The third category of the papers discussed the sustainability, efficiency, and equity of water footprint. Hoekstra and Wiedmann (2014) assessed the water footprints along supply chains as paramount in understanding the sustainability, efficiency, and equity of resource use from the perspective of producers, consumers, and government.
The fourth category of papers is the review of water footprint research. Čuček et al. (2012) presented the definition and measurement unit of footprints. They also presented an overview of several tools for footprint evaluation.
In terms of time scale, six out of ten were published from 2010 to 2013. This indicates that during this period, there was a breakthrough in water footprint, and the research was very hot. Before 2010, there were two related papers. This is the initial stage of water footprint development. Similarly, from 2014 to 2017, there were two papers involved and one of which was the highest cited. It shows that at this stage, the water footprint research has entered a more mature and innovative stage. Since 2018, no relevant papers have been included in the top 10 most-cited papers. Studies show that the average cited half-life (CdHL) of journal is generally 6–7 years (Dang and Wang, 2007; Gilyarevskii et al., 2021). That is, for the papers after 2018, there are not enough published papers cited them, so it is difficult to enter the top 10 cited papers.
3.1.4 Analysis of the number of papers published by different countries
Among the 2381 papers published in the SCI, the number of papers from the main publishing countries (including the number of papers published by researchers in that country alone and the number of papers published with authors from other countries) was retrieved, as shown in Table 2. The results indicated that China was the country that published the most papers, with a total of 589 papers, followed by the United States and the Netherlands. Therefore, the following comparative study on Chinese article databases CNKI may be of vital importance.
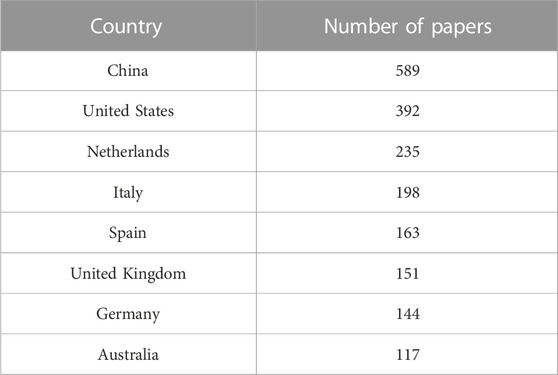
TABLE 2. The number of papers published by major countries.
3.2 Hotspot analysis of water footprint research from CNKI
3.2.1 Analysis of CNKI’s high-frequency keywords
In order to reveal the research hotspot of the water footprint in CNKI’s papers, we analyzed the top six keywords that appear most frequently: Water scarcity, Ecological footprint, Virtual water trade, Carbon footprint, grey water footprint, and Sustainable development. What’s more, input-output method is a popular method to study water footprint in CNKI’s papers (Xu et al., 2018).
Research content mainly contains water scarcity, ecological footprint, virtual water trade, carbon footprint, gray water footprint, and sustainable development. Some of these keywords are the same as the SCI high-frequency keywords, such as water scarcity, carbon footprint, and gray water footprint. Although sustainable development, virtual water trade, and ecological footprint are high-frequency keywords of CNKI’s papers. It could be because sustainable development is an important strategy for China to solve its environmental problems and ecological footprint and water footprint are often used to evaluate ecological and sustainable development capabilities.
3.2.2 The co-word network analysis of CNKI’s keywords
In order to study the trend of CNKI’s hot research field, we conducted a co-word analysis of CNKI high-frequency keywords. The top 30 CNKI high-frequency keywords related to water footprint were selected and the modular function in Gephi was used for cluster analysis. The analysis results were shown in Figure 3.
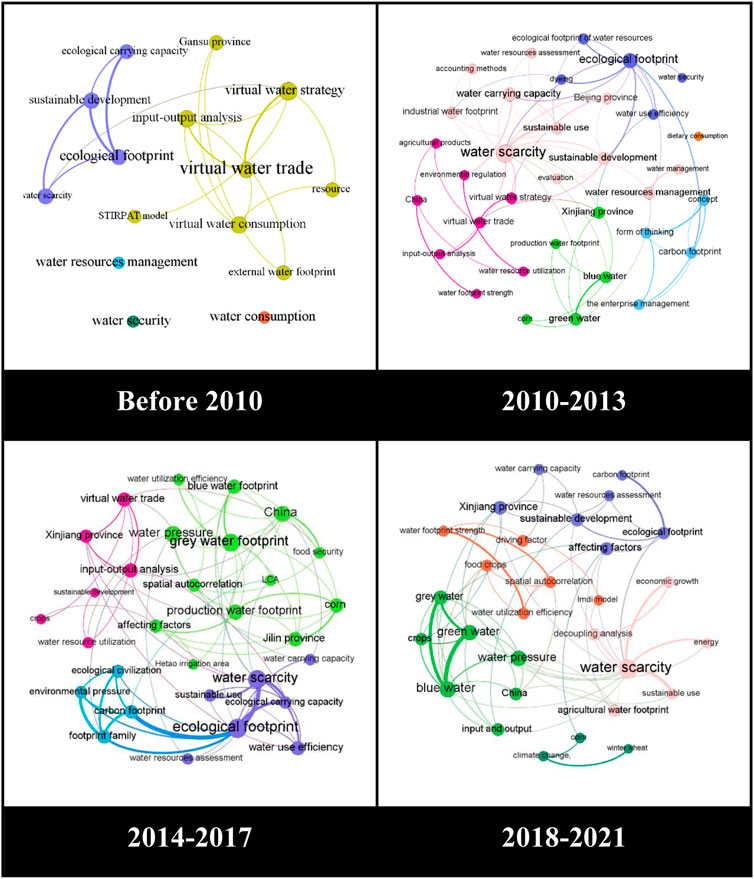
FIGURE 3. The evolutionary co-words network of water footprint from CNKI.
Before 2010, there were 5 clusters in this stage, with almost no connection between each cluster and only 15 nodes, indicating that the research on China’s water footprint is in its infancy. The virtual water trade cluster is the largest in this stage, which is the focus of researchers. This indicated that CNKI’s papers are problem-oriented while SCI’s papers are method-oriented.
From 2010 to 2013, there were six clusters and the number of nodes also increased significantly, indicating an increase in researchers’ interest in the field. The water footprint is often used to assess water use and water stress. The new Water scarcity cluster in this stage indicates that water shortage is a major environmental problem in China. The blue water footprint cluster and carbon footprint cluster also appeared for the first time in this phase, representing the beginning of researchers’ attention to these two areas.
From 2014 to 2017, there were 4 clusters in this stage, and each cluster was strongly connected. Compared with the previous stage, the number of clusters was reduced, and some small clusters were merged into new large clusters, indicating that the research on China’s water footprint was becoming mature. At this stage, the water shortage cluster integrates into the ecological footprint cluster. In the blue water footprint cluster, gray water footprint was added and became the central node of the cluster. This revealed that China’s water environment problem is very serious. China, spatial autocorrelation, and other nodes were added to the gray water footprint cluster, which became the most popular research direction in this stage.
From 2018 to 2021, there are five clusters in this phase. The ecological footprint cluster produced a new central node - sustainable development and some new nodes were added. The Water scarcity cluster is separated from the ecological footprint cluster and becomes an independent cluster. In addition, the grey water footprint cluster in the previous stage changed internally, and the blue water footprint became the central node of the cluster again in this stage. This indicates that the research focus shifted from the water environment to water resources again.
Compared with SCI, the research on water footprint in CNKI started late but developed rapidly. On the one hand, it depends on the rapid development of China’s economy, culture and education; on the other hand, it may be due to the serious environmental deterioration in the rapid development, which makes people have to pay attention to the water footprint and related environmental problems.
3.2.3 Analysis of CNKI’s highly cited papers
This paper retrieved the 10 CNKI’s papers with the highest citation frequency in the water footprint field, as shown in Table 3. According to the research content of the paper, it is mainly divided into the following four categories:
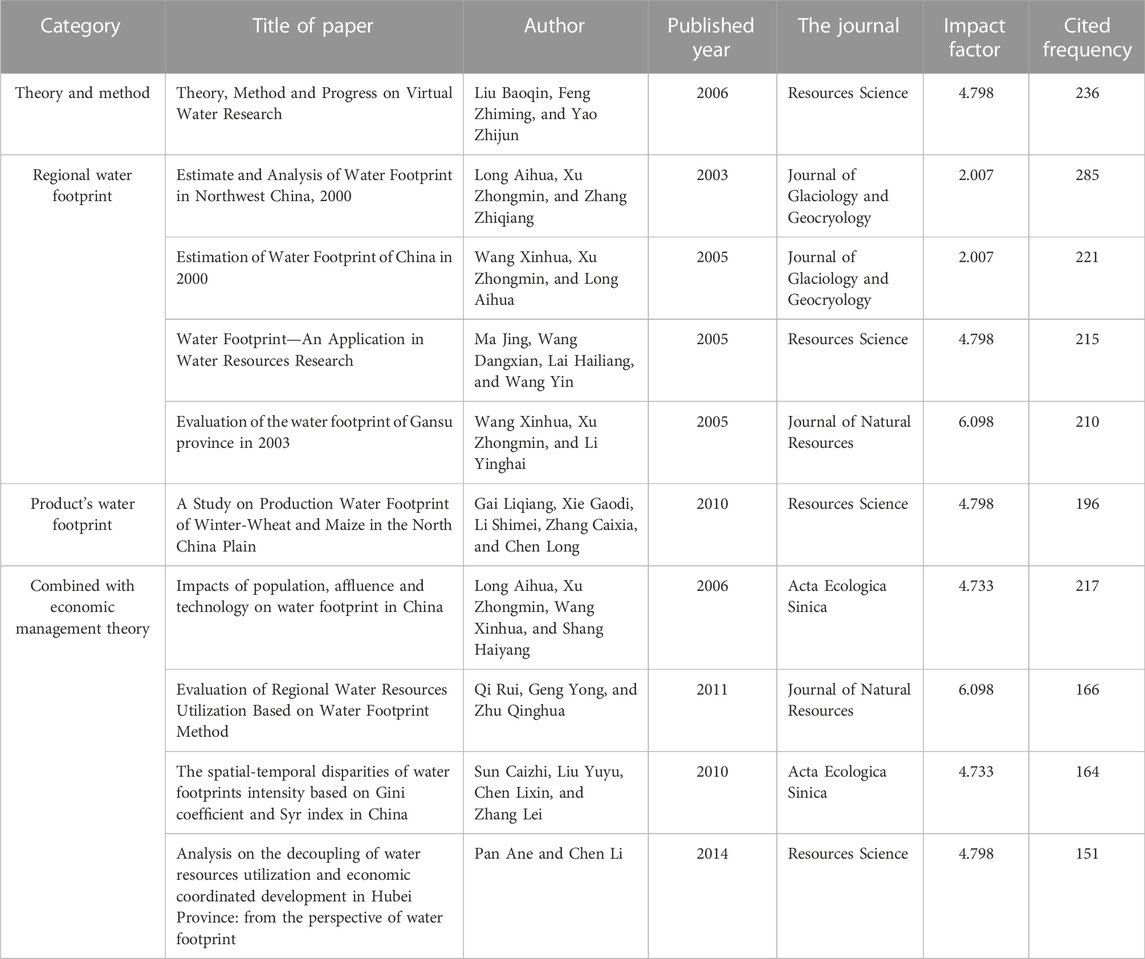
TABLE 3. CNKI highly cited papers.
The first category of papers mainly studies the theory and methods of water footprint. Liu et al. (2006) systematically introduced the basic concepts and quantitative methods of virtual water research and expounded the theoretical basis of virtual water research from three aspects: resource flow, resource substitution, and comparative advantage.
The second category of papers mainly studies the calculation of regional water footprint. The research results of Long et al. (2003) showed that the total water footprint of the four northwestern provinces (Xinjiang, Qinghai, Gansu, and Shaanxi) in 2000 was 613.3 × 10⁸ m3, and the per capita water footprint was 1952 L·person−1·d−1, which was higher than the statistical water resource utilization. Wang X. et al. (2005) analyzed the per capita water footprint of Chinese provinces in 2000. The results showed that the water footprint of northwest provinces is larger, while that of south and east-central provinces is smaller. Ma et al. (2005) calculated the virtual water flow rate, water footprint, and water self-sufficiency rate of domestic regions and international trade in China. The results exposed that China is a highly self-sufficient country in water resources, but there are large regional differences. Wang X. H. et al. (2005) calculated and analyzed the water footprint of Gansu province in 2003. The results showed the total water footprint of Gansu province in 2005 and the water footprint per capita, which caused great pressure on the ecological environment of Gansu province.
The third category of papers is mainly about the product’s water footprint. Gai et al. (2010) calculated the water footprint of wheat and corn in the North China Plain (Hebei, Beijing, and Tianjin). The results indicated that reducing the water footprint of wheat and corn production was of great significance to the North China Plain.
The fourth category of papers uses economic theoretical methods to study the water footprint. Long et al. (2006) used the STIRPAT model to analyze the influencing factors of China’s water footprint and decomposed the environmental impacts of population, wealth, and technology on China’s water resources. Qi et al. (2011) constructed a set of index systems to evaluate and analyze the current situation and sustainability of regional water resource utilization based on water footprint and took Dalian city as a case to evaluate its water resources utilization. Based on the Gini coefficient, Syr index, and separation coefficient, Sun et al. (2010) analyzed the variation rules of water footprint intensity in China. The results show that the main factors that cause the difference in water footprint are regional development strategy, economic development level, and market development degree. Pan and Chen (2014) calculated the water footprint and water resources utilization index of Hubei Province from 1995 to 2010, identified its water resources utilization situation, and analyzed the pressure caused by social production and life on the water resources system.
We compared and analyzed the high-cited papers of SCI and CNKI. From the perspective of research content, both of them research the calculation of regional water footprint and product’s water footprint. However, SCI’s papers pay more attention to the research of the product’s water footprint. CNKI’s papers focus more on combining the water footprint theory with economics and management theory. This indicated that SCI’s highly cited papers prefer to study the water footprint theory through scientific experiments from a bottom-up perspective, while CMKI’s highly cited papers prefer to combine economics and management theories to study water footprint from an up-bottom perspective.
In terms of time scale, six out of ten were published before 2010. This period is the flourishing period of the theoretical basis and typical research on water footprint. From 2010 to 2013, there were three papers involved, and the water footprint research moved in a new direction, that is, combined with economic management theory. However, from 2014 to 2017, there was only one paper. This indicates that compared with the SCI database, the development of water footprint research in CNKI database is slower. Since 2018, no relevant papers have been included in the top 10 most-cited papers. This is similar to the reason mentioned in 3.1.3, i.e., the law of cited half-life. It is worth noting that the most recent year in the top 10 most-cited papers in CNKI database is 2014, while SCI database is 2016. It can be seen that the water footprint related papers in CNKI database have a slow aging speed, and at the same time, the development speed is also slow.
3.3 Application of water footprint theory in various sectors
To study the application of water footprint theory in various economic sectors, this paper searched the number of papers published in the primary, secondary and tertiary industries, i.e., agriculture, industry, and services sectors. The number of papers related to water footprint for each sub-sector of agriculture, industry and service was retrieved from the CNKI and SCI databases, and the results were shown in Figures 4–6. In the agricultural sector, the water footprint theory has been published a large number of papers in plant-products industry and animal husbandry. The water footprint theory has been widely applied in the agricultural field. This is mainly because 80% of the water footprint of human consumption comes from agricultural products. Therefore, water resources are the most important factor restricting agricultural development. According to different stages, there were only a few related to plant-products industry and animal husbandry before 2010, and no study about forests and fishery industry. From 2010 to 2013, studies considering forests and fishery industry appeared. Both 2014–2017 and 2018–2021 have a large number of studies focusing on the plant-products industry and animal husbandry.
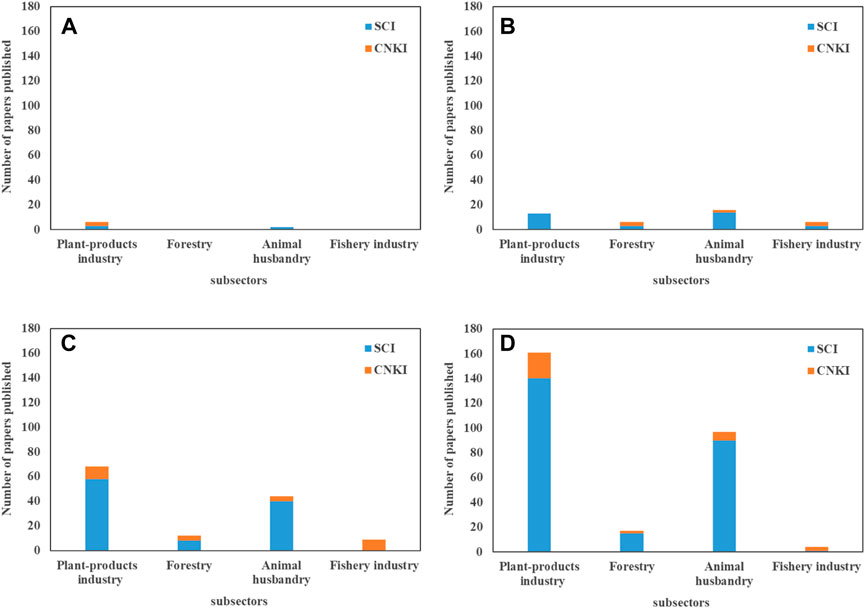
FIGURE 4. The number of relevant papers related to the agricultural sector (A) Before 2010. (B) 2010–2013. (C) 2014–2017. (D) 2018–2021.
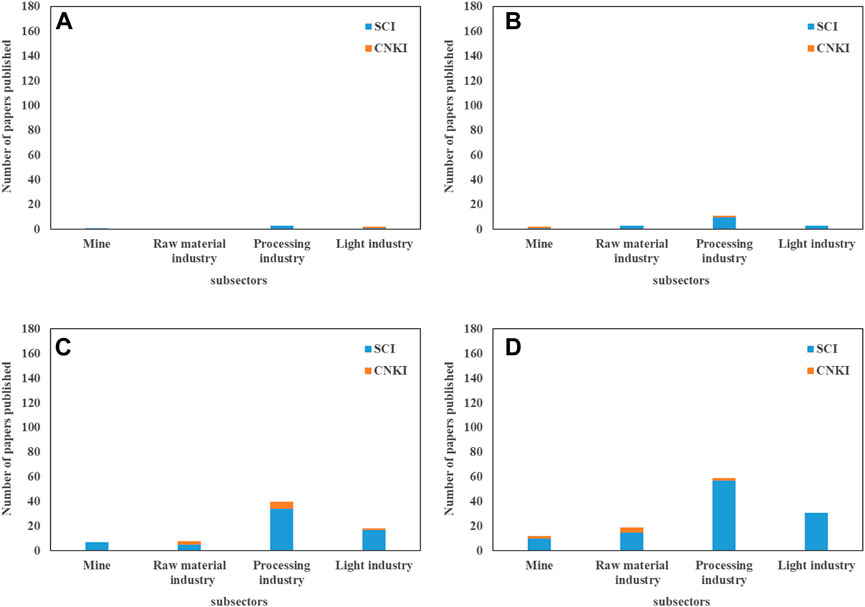
FIGURE 5. The number of relevant papers related to the industrial sector (A) Before 2010. (B) 2010–2013. (C) 2014–2017. (D) 2018–2021.
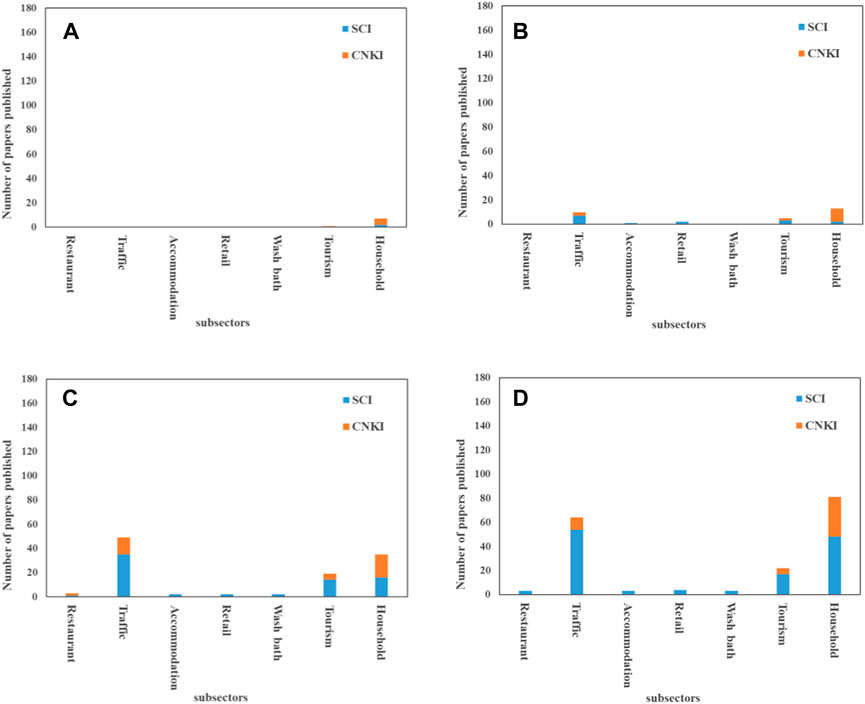
FIGURE 6. The number of papers related to the service sector (A) Before 2010. (B) 2010–2013. (C) 2014–2017. (D) 2018–2021.
In the industrial sector, the water footprint theory only published fewer papers than agriculture sector. This is mainly because industry is the second large sector of water use and the water pollution caused by production is very serious, such as sewage discharge from heavy industry and so on. Therefore, grey water footprint is a key issue in the industry sector. In the industrial sector, the water footprint theory has been published a large number of papers in processing industry sector. According to different stages, there were only a few related to mine, industry processing industry, and light industry sectors before 2010, and no study about raw material sector. From 2010 to 2013, studies considering raw material appeared. Both 2014–2017 and 2018–2021 have a bloom in all sectors.
The water footprint theory has been published in the household, traffic and tourism sectors in a relatively large number of papers. The results indicated that in the tourism and traffic sectors, where the water footprint theory is most widely used in the service sector, the number of related papers is still less than that in industry and agriculture sectors. The application of water footprint theory in the service industry needs to be strengthened. According to different stages, there were only a few related to household and tourism sectors before 2010. From 2010 to 2013, the studies added the traffic, accommodation and retail sectors. Both 2014–2017 and 2018–2021 have a large number of studies focusing on the household, traffic and tourism sectors.
4 Conclusion
In order to study the hotspots in the application of water footprint theory, this paper studied 2381 papers published in the SCI and 1441 papers published in the CNKI, analyzed the high-frequency keywords, co-words network, and application sector of these papers, and revealed the evolution process of hot spots in the study of water footprint theory.
When evaluating the consumption and utilization of water resources in a country or region, the sum of water used in daily life, agriculture and industry is usually taken as the main indicator. However, this method neglects the utilization of soil water in agricultural production and the influence of virtual water trade between regions. In contrast, the concept of water footprint is more realistic to the water resources. Water footprint research is mainly divided into the following stages: theoretical concept stage, accounting tool stage, and accounting tool application stage. Water footprint can be divided into two categories: “volumetric” water footprint and “impact-oriented” water footprint. “Volumetric” water footprint methodology focuses on water consumption while “impact-oriented” water footprint methodology focuses more on the environmental impact of water use. In addition to quantitative estimation of water footprint, current research hotpot is more about issues related to water footprint, such as carbon emissions, climate change, sustainable development and so on.
The literature associated with water footprint research has grown significantly in the last 20 years. Water scarcity, carbon footprint, and grey water are the high-frequency keywords of both two databases. The research focus of papers from SCI has gradually shifted to climate change and carbon emission, while, papers of SCI more focus on ecological footprint and sustainable development. With time, the content of the co-word network analysis of SCI’s keywords becomes richer and richer, and the network becomes more and more complex. This may be due to changes in the use of natural resources and the awareness of the environment. Compared with SCI, the research on water footprint in CNKI started late but developed rapidly. On the one hand, it depends on the rapid development of China’s economy, culture and education; on the other hand, it may be due to the serious environmental deterioration in the rapid development, which makes people have to pay attention to the water footprint and related environmental problems. And the underlying driving reasons may need more research.
This paper analyzed SCI and CNKI’s high-cited published papers and compared their differences. Both of their high-cited papers mainly studied regional water footprints. In addition, CNKI’s research is mainly combing the water footprint theory with economics and management theory, SCI’s research content is primarily concerned with the product’s water footprint. This suggested that SCI’s highly cited papers are more focused on the product’s water footprint theory by scientific experiments, while CNKI’s highly cited papers tend to combine economics and management theories to study water footprint from a macroscopic perspective.
The application of water footprint theory in various industries was analyzed by searching the number of papers published in each field. The water footprint theory has been widely applied in the agricultural sector. In the industry sector, water footprint theory is often used to analyze environmental problems in the light industry and processing industry. However, the application of water footprint theory in the service industry is far less than that in industry and agriculture. Scholars should do more research on water footprint related to the service sector to promote the development of the water footprint theory. Further water-footprint simulation studies and field tests are also needed. In addition, the water footprint could be regionally different, so comparative analyses of water footprint studies between countries and regions can be done in the future.
Author contributions
YS: conceptualization, formal analysis, methodology, data curation, writing— original draft, writing—review and editing. ZW: data curation, writing — review and editing, drew the figures. L-CL: data curation, writing — review and editing. XL: data curation. YW: conceptualization, formal analysis, methodology, writing—review and editing.
Funding
This research has been supported by the National Natural Science Foundation of China (Grant No. 41871211, 71834004, and 71673198). National Key Research and Development Program of China (Grant No. 2018YFF0215704).
Conflict of interest
The authors declare that the research was conducted in the absence of any commercial or financial relationships that could be construed as a potential conflict of interest.
Publisher’s note
All claims expressed in this article are solely those of the authors and do not necessarily represent those of their affiliated organizations, or those of the publisher, the editors and the reviewers. Any product that may be evaluated in this article, or claim that may be made by its manufacturer, is not guaranteed or endorsed by the publisher.
References
Adetoro, A. A., Ngidi, M., Nyam, Y. S., and Orimoloye, I. R. (2021). Temporal evaluation of global trends in water footprint, water sustainability and water productivity research. Sci. Afr. 12, e00732. doi:10.1016/j.sciaf.2021.e00732
Allan, J. A. (1997). 'Virtual water': A long term solution for water short Middle eastern economies? London: School of Oriental and African Studies, University of London, 24–29.
Ansorge, L., Stejskalová, L., and Vološinová, D. (2019). Comparison of water footprint research in the Czech Republic and in abroad – bibliometric analysis. Water Manag. Tech. Econ. Inf. J. 61 (6), 60–62. Available at: https://www.vtei.cz/en/2019/12/comparison-of-water-footprint-research-in-the-czech-republic-and-in-abroad-bibliometric-analysis/.
Ansorge, L., Stejskalová, L., and Voloinová, D. (2021). Bibliometric analysis of water footprint research in countries of former Yugoslavia. Acta Hydrotech. 34 (61), 93–102. doi:10.15292/acta.hydro.2021.07
Berger, M., and Finkbeiner, M. (2013). Methodological challenges in volumetric and impact-oriented water footprints. J. Industrial Ecol. 17 (1), 79–89. doi:10.1111/j.1530-9290.2012.00495.x
Bonamente, E., Scrucca, F., Rinaldi, S., Merico, M. C., Asdrubali, F., and Lamastra, L. (2016). Environmental impact of an Italian wine bottle: Carbon and water footprint assessment. Sci. Total Environ. 560, 274–283. doi:10.1016/j.scitotenv.2016.04.026
Börner, K., Chen, C., and Boyack, K. W. (2003). Visualizing knowledge domains. Ann. Rev. Info. Sci. Tech. 37 (1), 179–255. doi:10.1002/aris.1440370106
Broadus, R. N. (1987). Toward a definition of “bibliometrics”. Scientometrics 12 (5-6), 373–379. doi:10.1007/bf02016680
Çaloğlu Büyükselçuk, E. (2021). Bibliometric analysis of water footprint. Tasar. Mimar. ve Mühendislik Derg. 1 (1), 42–53. Available at: https://dergipark.org.tr/en/pub/dae/issue/65804/1024124.
Chapagain, A. K., Hoekstra, A. Y., Savenije, H. H., and Gautam, R. (2006). The water footprint of cotton consumption: An assessment of the impact of worldwide consumption of cotton products on the water resources in the cotton producing countries. Ecol. Econ. 60 (1), 186–203. doi:10.1016/j.ecolecon.2005.11.027
Choi, J., Yi, S., and Lee, K. C. (2011). Analysis of keyword networks in MIS research and implications for predicting knowledge evolution. Inf. Manag. 48 (8), 371–381. doi:10.1016/j.im.2011.09.004
Čuček, L., Klemeš, J. J., and Kravanja, Z. (2012). A review of footprint analysis tools for monitoring impacts on sustainability. J. Clean. Prod. 34, 9–20. doi:10.1016/j.jclepro.2012.02.036
Dang, Y., and Wang, L. (2007). Analysis on the changes of the journal half life in the science JCR. Inf. Sci. 25 (6), 804–810. doi:10.3969/j.issn.1007-7634.2007.06.002
De la Hoz-Correa, A., Muñoz-Leiva, F., and Bakucz, M. (2018). Past themes and future trends in medical tourism research: A co-word analysis. Tour. Manag. 65, 200–211. doi:10.1016/j.tourman.2017.10.001
Ding, Y., Chowdhury, G. G., and Foo, S. (2001). Bibliometric cartography of information retrieval research by using co-word analysis. Inf. Process. Manag. 37 (6), 817–842. doi:10.1016/s0306-4573(00)00051-0
Distefano, T., and Kelly, S. (2017). Are we in deep water? Water scarcity and its limits to economic growth. Ecol. Econ. 142, 130–147. doi:10.1016/j.ecolecon.2017.06.019
Gai, L., Xie, G., and Li, S., (2010). Research on the water footprint of wheat and corn production in North China Plain. Resour. Sci. 32 (11), 2066–2071.
Galli, A., Wiedmann, T., Ercin, E., Knoblauch, D., Ewing, B., and Giljum, S. (2012). Integrating Ecological, Carbon and Water footprint into a "Footprint Family" of indicators: Definition and role in tracking human pressure on the planet. Ecol. Indic. 16, 100–112. doi:10.1016/j.ecolind.2011.06.017
Gerbens-Leenes, W., Berger, M., and Allan, J. A. (2021). Water footprint and life cycle assessment: The complementary strengths of analyzing global freshwater appropriation and resulting local impacts. Water 13 (6), 803. doi:10.3390/w13060803
Gilyarevskii, R. S., Libkind, A. N., Libkind, I. A., and Bogorov, V. G. (2021). The obsolescence of cited and citing journals: Half-lives and their connection to other bibliometric indicators. Autom. Doc. Math. Linguist. 55 (4), 152–165. doi:10.3103/s0005105521040026
Glänzel, W. (2003). Bibliometrics as a research field--A course on theory and application of bibliometric indicators. (Leuven: Course Handouts).
Gleeson, T., Wada, Y., Bierkens, M. F., and Van Beek, L. P. (2012). Water balance of global aquifers revealed by groundwater footprint. Nature 488 (7410), 197–200. doi:10.1038/nature11295
Gleick, P. H. (2000). A look at twenty-first century water resources development. Water Int. 25 (1), 127–138. doi:10.1080/02508060008686804
Hoekstra, A. Y., and Chapagain, A. K. (2007). “Water footprints of nations: Water use by people as a function of their consumption pattern,” in Integrated assessment of water resources and global change (Dordrecht: Springer), 35–48.
Hoekstra, A. Y., and Mekonnen, M. M. (2012). The water footprint of humanity. Proc. Natl. Acad. Sci. U. S. A. 109 (9), 3232–3237. doi:10.1073/pnas.1109936109
Hoekstra, A. Y., Chapagain, A. K., Mekonnen, M. M., and Aldaya, M. M. (2011). The water footprint assessment manual: Setting the global standard. Milton Park, Abingdon-on-Thames, Oxfordshire, England, UK: Routledge.
Hoekstra, A. Y., Mekonnen, M. M., Chapagain, A. K., Mathews, R. E., and Richter, B. D. (2012). Global monthly water scarcity: Blue water footprints versus blue water availability. PloS one 7 (2), e32688. doi:10.1371/journal.pone.0032688
Hoekstra, A. Y. (2003). Virtual water trade: A quantification of virtual water flows between nations in relation to international crop trade. Proc. Int. Expert Meet. Virtual Water Trade 12, 25–47.
Hoekstra, A. Y., and Wiedmann, T. O. (2014). Humanity’s unsustainable environmental footprint. Science 344 (6188), 1114–1117. doi:10.1126/science.1248365
Jägerskog, A., and Lundqvist, J. (2022). Water wars, conflict and cooperation – how the virtual water concept helped change the discourse. Water Int. 47 (6), 901–904. doi:10.1080/02508060.2022.2118388
Kiani Mavi, R., Goh, M., Kiani Mavi, N., Jie, F., Brown, K., Biermann, S., et al. (2020). Cross-docking: A systematic literature review. Sustainability 12 (11), 4789. doi:10.3390/su12114789
Li, Y., Wang, Y., Rui, X., Li, Y., Li, Y., Wang, H., et al. (2017). Sources of atmospheric pollution: A bibliometric analysis. Scientometrics 112 (2), 1025–1045. doi:10.1007/s11192-017-2421-z
Liu, B. Q., Feng, Z. M., and Yao, Z. J. (2006). Theory, method and progress on virtual water research. Resour. Sci. 28 (1), 120–122. doi:10.3321/j.issn:1007-7588.2006.01.020
Liu, J., Yang, H., and Savenije, H. H. G. (2008). China's move to higher-meat diet hits water security. Nature 454 (7203), 397. doi:10.1038/454397a
Liu, X., Du, H., Zhang, Z., Crittenden, J. C., Lahr, M. L., Moreno-Cruz, J., et al. (2019). Can virtual water trade save water resources? Water Res. 163, 114848. doi:10.1016/j.watres.2019.07.015
Long, A., Xu, Z., and Zhang, Z. (2003). Estimate and Analysis of Water Footprint in Northwest China, 2000. J. Glaciol. Geocryol. 25 (06), 692–700. doi:10.3969/j.issn.1000-0240.2003.06.017
Long, A., Xu, Z., and Wang, X., (2006). Impacts of population, affluence and technology on water footprint in China. Acta Ecol. Sin. 26 (10), 3358–3365. doi:10.3321/j.issn:1000-0933.2006.10.027
Ma, J., Wang, D., Lai, H., and Wang, Y. (2005). Water Footprint—An Application in Water Resources Research. Resour. Sci. 27 (05), 96–100. doi:10.3321/j.issn:1007-7588.2005.05.015
Ma, W., Opp, C., and Yang, D. (2020). Past, present, and future of virtual water and water footprint. Water 12 (11), 3068. doi:10.3390/w12113068
Mekonnen, M. M., and Hoekstra, A. Y. (2011). The green, blue and grey water footprint of crops and derived crop products. Hydrol. Earth Syst. Sci. 15 (5), 1577–1600. doi:10.5194/hess-15-1577-2011
Mekonnen, M. M., and Hoekstra, A. Y. (2012). A global assessment of the water footprint of farm animal products. Ecosystems 15 (3), 401–415. doi:10.1007/s10021-011-9517-8
Mekonnen, M. M., and Hoekstra, A. Y. (2016). Four billion people facing severe water scarcity. Sci. Adv. 2 (2), e1500323. doi:10.1126/sciadv.1500323
Mubako, S. T. (2018). Blue, green, and grey water quantification approaches: A bibliometric and literature review. J. Contemp. Water Res. Educ. 165 (1), 4–19. doi:10.1111/j.1936-704x.2018.03289.x
Olawumi, T. O., and Chan, D. W. (2018). A scientometric review of global research on sustainability and sustainable development. J. Clean. Prod. 183, 231–250. doi:10.1016/j.jclepro.2018.02.162
Pan, A., and Chen, L. (2014). Decoupling and Water Footprint Analysis of the Coordinated Development Between Water Utilization and the Economy in Hubei. Resour. Sci. 36 (02), 328–333.
Pires, L. F., Bernardo, C. H. C., Satolo, E. G., Queiróz, T. R., and Morales, A. G. (2018). Pegada hídrica no ambiente industrial: UMA revisão bibliográfica sistemática de 2011 a 2016. Rev. Agro. Amb. 11, 1217–1237. doi:10.17765/2176-9168.2018v11n4p1217-1237
Qi, R., Geng, Y., and Zhu, Q. H. (2011). Evaluation of regional water resources utilization based on water footprint method. J. Nat. Resour. 26 (3), 486–495. doi:10.11849/zrzyxb.2011.03.015
Ren, Y., Huang, K., Yu, Y., and Hu, J. (2020). Inter-regional agricultural virtual water flow in China based on volumetric and impact-oriented multi-regional input-output (MRIO) approach. Water 12 (1), 251. doi:10.3390/w12010251
Rosegrant, M. W., and Ringler, C. (2000). Impact on food security and rural development of transferring water out of agriculture. Water Policy 1 (6), 567–586. doi:10.1016/s1366-7017(99)00018-5
Samiee, S., and Chabowski, B. R. (2012). Knowledge structure in international marketing: A multi-method bibliometric analysis. J. Acad. Mark. Sci. 40 (2), 364–386. doi:10.1007/s11747-011-0296-8
Sun, C., Liu, Y., Chen, L., and Zhang, L. (2010). The spatial-temporal disparities of water footprints intensity based on Gini coefficient and Syr index in China. Acta Ecol. Sin. 30 (05), 1312–1321.
Vanham, D., Leip, A., Galli, A., Kastner, T., Bruckner, M., Uwizeye, A., et al. (2019). Environmental footprint family to address local to planetary sustainability and deliver on the SDGs. Sci. Total Environ. 693, 133642. doi:10.1016/j.scitotenv.2019.133642
Wang, X., Xu, Z., and Long, A. (2005a). Estimation of Water Footprint of China in 2000. J. Glaciol. Geocryol. 27 (05), 774–780.
Wang, X. H., Xu, Z. M., and Li, Y. H. (2005b). A rough estimate of water footprint of Gansu Province in 2003. J. Nat. Resour. 6, 015. doi:10.3321/j.issn:1000-3037.2005.06.016
Wang, X. D., Liu, J. J., and Sheng, F. S. (2014). Analysis of hotspots in the field of domestic knowledge discovery based on co-word analysis method. Cybern. Inf. Technol. 14 (5), 145–158. doi:10.2478/cait-2014-0051
Wang, Y., Li, J., Lee, L. C., Wang, M., and Du, H. (2019). A review of input-output model application hot spots in the energy and environment fields based on co-words network analysis. Environ. Rev. 27 (4), 567–574. doi:10.1139/er-2018-0110
Wu, L., Huang, K., Ren, Y., Yu, Y., and Huang, B. (2022). Toward a better understanding of virtual water trade: Comparing the volumetric and impact-oriented virtual water transfers in China. Resour. Conservation Recycl. 186, 106573. doi:10.1016/j.resconrec.2022.106573
Xiao, J., Wei, J., Wu, M., and Cao, X. (2022). Bibliometric and visual analysis of crop water footprint: A widely used agricultural water resources evaluation method. Water 14 (18), 2866. doi:10.3390/w14182866
Xu, S., Ma, S., and Fu, Y. (2018). Calculation of water footprint and virtual water in Liaoning province with input-output analysis model. J. Shenyang Normal Univ. 36 (01), 58–62.
Zhang, Y., Huang, K., Yu, Y., and Yang, B. (2017). Mapping of water footprint research: A bibliometric analysis during 2006–2015. J. Clean. Prod. 149, 70–79. doi:10.1016/j.jclepro.2017.02.067
Zhu, Y., Jiang, S., Han, X., Gao, X., He, G., Zhao, Y., et al. (2019). A bibliometrics review of water footprint research in China: 2003–2018. Sustainability 11 (18), 5082. doi:10.3390/su11185082
Keywords: bibliometric analysis, co-word network, sector, water footprint, virtual water
Citation: Sun Y, Wang Z, Lee L-C, Li X and Wang Y (2022) A bibliometrics review of hotspots in water footprint research based on co-words network analysis. Front. Environ. Sci. 10:1027936. doi: 10.3389/fenvs.2022.1027936
Received: 25 August 2022; Accepted: 29 November 2022;
Published: 12 December 2022.
Edited by:
Yaoping Wang, The University of Tennessee, Knoxville, United StatesReviewed by:
Kai Huang, Beijing Forestry University, ChinaLibor Ansorge, T. G. Masaryk Water Research Institute, Czechia
Copyright © 2022 Sun, Wang, Lee, Li and Wang. This is an open-access article distributed under the terms of the Creative Commons Attribution License (CC BY). The use, distribution or reproduction in other forums is permitted, provided the original author(s) and the copyright owner(s) are credited and that the original publication in this journal is cited, in accordance with accepted academic practice. No use, distribution or reproduction is permitted which does not comply with these terms.
*Correspondence: Zhibin Wang, 184885837@qq.com; Yuan Wang, wyuan@tju.edu.cn