Capturing the rapid response of sediments to low-oxygen conditions with high temporal resolution gas concentration measurements
 Emily J. Chua
 Robinson W. Fulweiler
- 1Department of Earth and Environment, Boston University, Boston, MA, United States
- 2Department of Biology, Boston University, Boston, MA, United States
Low-oxygen conditions plague coastlines worldwide. At present, little is known about how the transition from normoxic to low or even no oxygen conditions alters sediment biogeochemical cycling and ultimately ecosystem functioning. Conventional sediment core incubations cannot capture rapid (<hourly) changes in biogenic gas fluxes that may occur due to oxygen depletion. To better constrain the response of sediments to hypoxia, we employed a novel flow-injection system coupled to a membrane inlet mass spectrometer to quantify fluxes oxygen, dinitrogen, and methane across the sediment-water interface from a temperate estuary (Narragansett Bay, Rhode Island, United States). We evaluated how sediments from a site more impacted by nitrogen pollution compare to one less impacted by nitrogen in response to organic matter addition. Our system is able to sample every 10 minutes, allowing us to cycle through triplicate core measurements roughly every 30 minutes to track the response of sediments to increasing hypoxic severity. The high temporal-resolution data revealed dynamic changes in sediment-water gas fluxes, suggesting that reactive nitrogen removal is enhanced under mild hypoxia but dampened under prolonged hypoxia to anoxia. Further we found that organic matter loading enhances both net denitrification and methane emissions. Ultimately, our approach represents a powerful new tool for advancing our knowledge of short-term temporal dynamics in benthic biogeochemical cycling.
1 Introduction
In coastal waters worldwide, oxygen levels are declining. Zones of low oxygen overwhelmingly occur near human population centers and developed watersheds that discharge nutrient-laden water into the ocean. These low oxygen conditions are primarily driven by excess nutrient loading and rising temperatures (Breitburg et al., 2018). In particular, elevated nutrient concentrations in coastal waters stimulate the growth of phytoplankton and macroalgae, which in turn promotes microbial respiration and the drawdown of water column oxygen. This enhanced respiration is exacerbated by warming water temperature, which stratifies the water column, decreasing oxygen replenishment from mixing. Rising water temperatures also decreases the solubility of oxygen, lowering water column oxygen concentrations while simulatenously increasing metabolic oxygen demands (Breitburg et al., 2018).
Oxygen availability dictates the survival of marine life and exerts a strong influence on the cycling of nutrients and gases important for both local ecosystem function and global climate. As such, waters that are hypoxic (low in oxygen, Vaquer-Sunyer and Duarte, 2008) or anoxic (devoid of oxygen) can lead to the loss of biomass, biodiversity, and habitat, as well as alter energy and biogeochemical cycling in coastal systems (Diaz et al., 2019). While overlooked in global ocean nutrient budgets (Chua et al., 2022), coastal and continental shelf sediments are key sites of nitrogen and carbon cycling. Low dissolved oxygen in bottom waters can interfere with the ability of sediments to provide key ecosystem services such as reactive nitrogen removal and greenhouse gas regulation.
In general, the magnitudes and mechanisms behind marine sediment nitrogen and carbon cycling are not well constrained (e.g., Rosentreter et al., 2021; Chua et al., 2022), and even less is known about how coastal hypoxia impacts sediment biogeochemical processes. The available work suggests that biogeochemical responses vary widely and depend on the severity and duration of oxygen depletion. For example, previous studies have found that sediment nitrogen removal through denitrification can be enhanced (e.g., Gardner and McCarthy, 2009), diminished (e.g., McCarthy et al., 2015), or remain unchanged (e.g., Foster and Fulweiler, 2019) by hypoxic conditions. Similarly, sediment methane emissions exhibit variable responses to low oxygen (e.g., Damgaard, Revsbech and Reichardt, 1998; Foster and Fulweiler, 2019). Moreover, a recent metaanalysis found that methane emissions from estuaries, mangroves, and salt marshes increase with eutrophication (Rosentreter et al., 2021). It is likely that sediment denitrification and methane production respond dynamically and non-linearly to increasing oxygen depletion, and that factors such as the environmental legacy of the sediment (i.e., whether it is accustomed to received high organic matter loads or not) can influence this response.
Measuring sediment fluxes is challenging for a host of reasons, one of which is that current methods do not allow us to examine fluxes of multiple biogeochemically important gases over time as conditions change. In fact, we often assume and/or wait for steady state conditions. Thus, when we try to determine how sediments respond to low oxygen (or any perturbation) we often treat it as a binary—normal condition versus impacted condition. While useful, this misses critical transition periods and leaves us with an incomplete picture of how sediments respond to the dynamic conditions they experience. Here we had an opportunity to apply a previously described, novel mass spectrometer-based system (Chua et al., 2021) that analyzes dissolved gas content in near real time, enabling us to obtain measurements at a much higher temporal resolution than possible in conventional laboratory incubations. We used this system to assess the influence of oxygen depletion on reactive nitrogen removal and methane emission in coastal sediments by quantifying sediment fluxes of dissolved oxygen (O2), dinitrogen (N2), and methane (CH4) continuously over 24 h in a series of laboratory experiments. We compared differences in emissions of these gas fluxes over time from sediments collected from a more nutrient-enriched and productive site to a less nutrient-impacted site. Additionally, we investigated how sediment fluxes from each site would respond to a pulse of labile organic matter. Using these high-resolution gas concentration data we modeled gas fluxes over time, capturing the response of sediments as they crossed hypoxic and anoxic thresholds. Based on these results and the current literature we then discuss possible explanations for what we observed to stimulate future research.
2 Materials and methods
2.1 Field site description
For these experiments we used sediments from Narragansett Bay, Rhode Island, United States. Narragansett Bay is a small (328 km2), well-mixed, phytoplankton-dominated temperate estuary (Nixon et al., 2008). Narragansett Bay is characterized by a strong north-to-south gradient in anthropogenic pollutants as most of the wastewater and land drainage enters at the head of the bay. Low-oxygen conditions occur intermittently in upper Narragansett Bay, especially in Providence River Estuary bottom waters (Bergondo et al., 2005; Codiga et al., 2009). The bay has a mean low water depth of 8.6 m and a mean residence time of 26 days (Pilson, 1985; Nixon et al., 1995). The majority of the sediments are clayey silt and sand-silt-clay (McMaster, 1960).
We collected intact, subtidal sediment cores from Narragansett Bay for laboratory measurements from two sites: one in the Providence River Estuary (PRE) and one in mid-Narragansett Bay (MNB). PRE is an urban estuary where 60%–70% of the total sewage load that enters Narragansett Bay was directly discharged to this estuary. Because of this major anthropogenic perturbation, a variety of environmental factors such as chlorophyll and nutrient concentrations (Oviatt et al., 2002) are highest here and decrease down the bay. Additionally low oxygen conditions are more frequent in PRE compared to MNB (Codiga et al., 2009). PRE and MNB have similar sediment characteristics (∼75% silt/coarse silt) but C:N is more variable (Fulweiler and Nixon 2012). Six intact cores were collected by divers from MNB on 9 November 2021, and another six cores were collected using a pull corer off the side of a boat from PRE on 19 November 2021. The cores were collected in clear PVC tubes measuring 10 cm (inner diameter) and 30 cm (height). Following collection, cores were loosely capped and placed upright in a cooler. Bottom water was also collected from each site and immediately filtered (0.2 micron) to remove water column biota, as our subsequent measurements were focused on processes occurring at the sediment-water interface. On both dates, the cores and filtered site water were immediately transported from the field to the laboratory (within 6 h), where they were kept in the dark at room temperature (∼20oC).
2.2 Benthic flux incubations
Following both field sampling events, we conducted 24-h incubations on the collected cores in the laboratory to measure fluxes of dissolved gases across the sediment-water interface. For each site, we conducted an “amended” incubation, in which labile organic matter was added to the cores (n = 3), and a “control” incubation, in which the cores (n = 3) were left unamended. Cores were stored uncapped in a cooler with the overlying water gently bubbled with air at least overnight to equilibrate to laboratory conditions (e.g., Hopkinson, Giblin and Tucker, 2001; Fulweiler et al., 2007). The carboy of site water was also gently bubbled with air.
During the incubations, we employed a newly developed flow-injection mass spectrometer system (Chua et al., 2021) to make measurements of dissolved gases directly in the overlying water of the cores in near-real time and at high temporal resolution. While we originally developed this instrument to measure porewater dissolved gases in highly permeable sandy sediments, it can also be used to make measurements in the overlying water of sediment with no modification. The instrument has been described elsewhere in detail (Chua et al., 2021). In brief, it comprises a flow-injection system that collects water samples, and a commercially available mass spectrometer (Transpector MPH, Inficon) that analyzes the dissolved gas content of the collected samples in real-time. The instrument measures sample dissolved gas concentrations relative to some known reference, e.g., air-equilibrated deionized water. While it can measure a suite of dissolved gases simultaneously, here we were interested in capturing net changes in dissolved oxygen (O2), methane (CH4), and dinitrogen gas (N2). Quantifying net fluxes of these gases across the sediment-water interface provides insights into key benthic biogeochemical processes: O2 provides a measure of photosynthesis and respiration, net N2 production indicates denitrification (i.e., the N2/Ar technique gives a net measurement of denitrification minus nitrogen fixation), and CH4 production suggests methanogenesis.
At the start of an incubation, the overlying water of each core was carefully siphoned off, leaving the surface sediment undisturbed (Fulweiler et al., 2007). For the amended incubations, 1 g of commercial spray-dried marine phytoplankton with a C:N ratio of 8.0 (PhytoPlan, Two Little Fishies, Inc.) was added to each core (Fulweiler et al., 2007). The cores were then slowly refilled with water from the carboy of site water to ensure the same initial conditions for the overlying water. The cores were sealed with air-tight caps, taking care to avoid introducing bubbles. The caps had an outlet port with tubing leading to the automated flow-injection sampling system, and an inlet port connected to an elevated reservoir of site water open to air. As the flow-injection system extracted discrete samples of overlying water (∼1.5 ml volume), the water was replenished by the gravity feed. The overlying water was gently mixed (∼45 rpm) with magnetic stirrer bars to prevent concentration gradients from forming (Foster and Fulweiler, 2019). Air-equilibrated deionized water, contained in the same cooler as the cores, was used as the reference. Reference water temperature was monitored continuously (1 s resolution) with a FireSting probe (Ohio Lumex). Flow-injection measurements were automated with a custom MATLAB routine (Chua et al., 2021) that produced a time-stamped sampling log upon termination. Each of the three replicate cores was sampled every 10 min, resulting in timeseries data for each core at half-hour resolution. Incubations were left to run for 24 h in the dark and monitored intermittently (e.g., to measure flow rate to the mass spectrometer).
Following the control and amended incubations for each site, calibrations for O2 and CH4 were conducted using the water collected from that site. Calibration conditions were kept as similar as possible to incubation conditions—i.e., the calibrations were conducted at room temperature and using the same flow-injection timing and mass spectrometer parameters as during the incubations. Calibration standards were created by bubbling site water with dry gas mixtures containing known mole fractions of O2 and CH4. For each gas, five calibration standards spanning the expected concentration range for that gas were created. The corresponding dissolved gas concentrations for each calibration standard were calculated using solubility equations for O2 (Garcia and Gordon, 1992) and CH4 (Wiesenburg and Guinasso, 1979). Each calibration standard was sampled by flow injection (three replicate measurements per standard), and the impulse inputs were integrated to relate peak areas to concentration differentials. Linear regressions fit to the calibration data were used to relate flow-injection mass spectrometer measurements to gas concentrations in the subsequent data analysis. For N2, we used a modified N2/Ar method that did not require calibration (see below).
2.3 Flow injection-mass spectrometer data analysis
The data from the flow-injection mass spectrometer system were processed using custom scripts written in MATLAB. We used the peak area (as opposed to peak height) to characterize peak size, as this metric is less sensitive to factors such as sample dispersion (O’Haver, 2020).
The data processing for O2 and CH4 proceeded as follows. First, the log from the automated MATLAB sampling routine was used to locate the start and stop indices and baseline signals for each peak in the mass spectrometer data. Next, the peaks were baseline-corrected and integrated to obtain peak areas (units: Coulombs). Then, the flow-injection calibration curves were applied to the raw peak area data to obtain gas concentration differentials from the reference water (units: μmol L−1). Reference water gas concentrations as a function of time were calculated with gas-specific solubility equations (O2: Garcia and Gordon, 1992; CH4: Wiesenburg and Guinasso, 1979), using the measured salinity and the FireSting temperature timeseries data. Absolute gas concentrations C) were then computed by adding the concentration differential (∆C) to the reference water concentration (CRef):
For N2, we modified the N2/Ar technique for conventional membrane inlet mass spectrometry data (Kana et al., 1994) for our flow-injection data. Argon is an inert gas that is not influenced by biological processes; changes in its concentration are therefore diagnostic of changing physical conditions. Because N2 typically has a low flux compared to its background concentration, normalizing the N2 signal to the Ar signal permits measurements with higher precision. Analysis of the N2/Ar ratio data is similar as for the other gases, except that after integrating the peaks (units: seconds), the peak areas are divided by the integration time period. This quantity is then multiplied by the Ar concentration, which is assumed to be at equilibrium at the measured temperature and salinity of the sample water, to obtain ∆N2 (μmol L−1).
2.4 Flux modeling
We used the concentration timeseries data to estimate continuous fluxes of the gases over the 24-h incubation period. This flux modelling was conducted in MATLAB. To better reveal overall trends in the timeseries, we first smoothed the raw concentration data using the smoothn function (Garcia, 2010, 2011) which automatically determines the smoothing parameter by minimizing the generalized cross-validation score, with the “robust” option specified. Next, we fit curves to the smoothed concentration data using the built-in fit function, with smoothing splines as the model type. We selected a smoothing parameter of one so that the curves fit through all of the smoothed data. The fitted curves were then differentiated at 0.01 h intervals to estimate rates of change as a function of time [C′(t); μmol L−1 h−1] over the 24-h incubation period, starting at hour two. To convert to fluxes (J(t); μmol m−2 h−1), the first derivatives were multiplied by the height of the overlying water (hOLW; m) for the respective core and a volume conversion factor of 103 (from L to m3):
Positive fluxes indicate net production of the gas by the sediment (i.e., an efflux from the sediment into the water column), while negative fluxes indicate net sediment consumption (i.e., an influx into the sediment).
In order to put our results into context with the literature, we took our fitted concentration curves and calculated average fluxes for three oxygen “regimes”. We defined the “normoxic” regime as measurements made above the hypoxic threshold (O2 > 94 μM; Vaquer-Sunyer and Duarte, 2008), the “hypoxic” regime between the hypoxic and anoxic thresholds (0 < O2 < 94 μM), and the “anoxic” regime below the anoxic threshold (O2 = 0 μM). Hypoxia is often operationally defined as water with an oxygen concentration at or below 63 μM, based on when fisheries collapse (Renaud et al., 1986). We chose a marginally higher oxygen concentration because other studies demonstrate that a variety of organisms experience hypoxia at higher oxygen levels (Vaquer-Sunyer and Duarte, 2008). The averaged fluxes for each gas were estimated from the difference in fitted concentrations between the beginning and end of each oxygen regime.
3 Results and discussion
3.1 Concentration and flux timeseries
The high-resolution gas concentration measurements (Figures 1, 2) enabled calculation of continuous fluxes of O2, N2, and CH4 over the 24-h experiments, which in turn revealed complex, dynamic changes (Figure 2; Tables 1, 2).
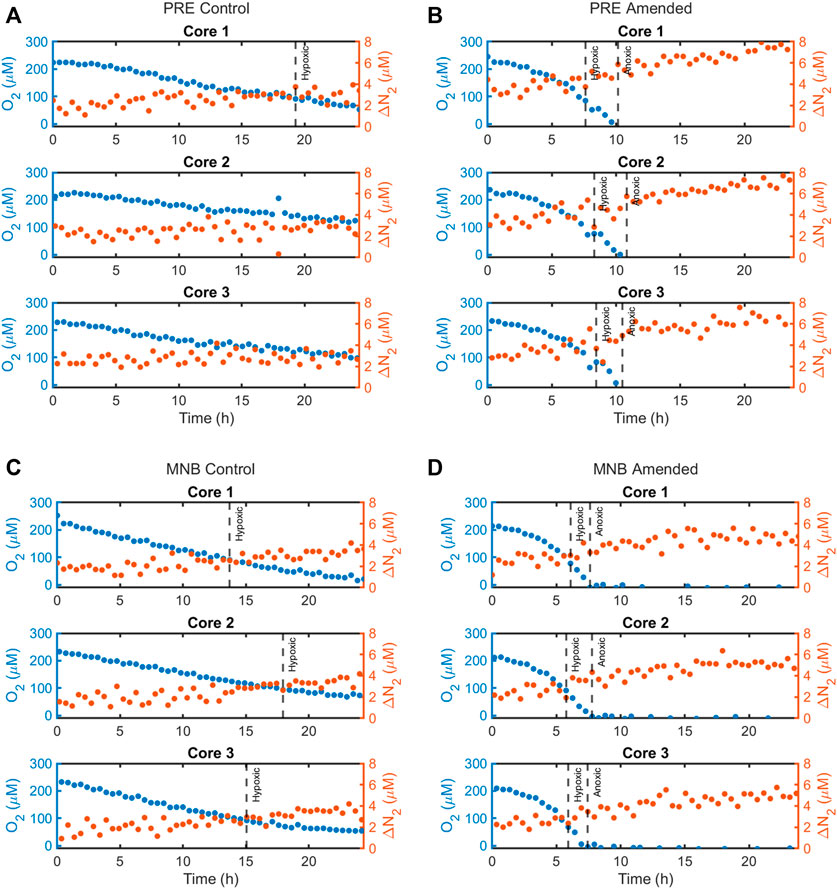
FIGURE 1. Calibrated concentration timeseries data for ΔN2 (in red) compared to O2 (blue), as measured by the flow-injection mass spectrometer system during the 24-h incubations for the four site and treatment combinations: (A) Providence River Estuary—Control treatment, (B) Providence River Estuary—Amended treatment, (C) Mid-Narragansett Bay—Control treatment, and (D) Mid-Narragansett Bay—Amended treatment. ΔN2 represents the difference in concentration from the reference and was calculated from the modified N2/Ar technique (described in the main text).
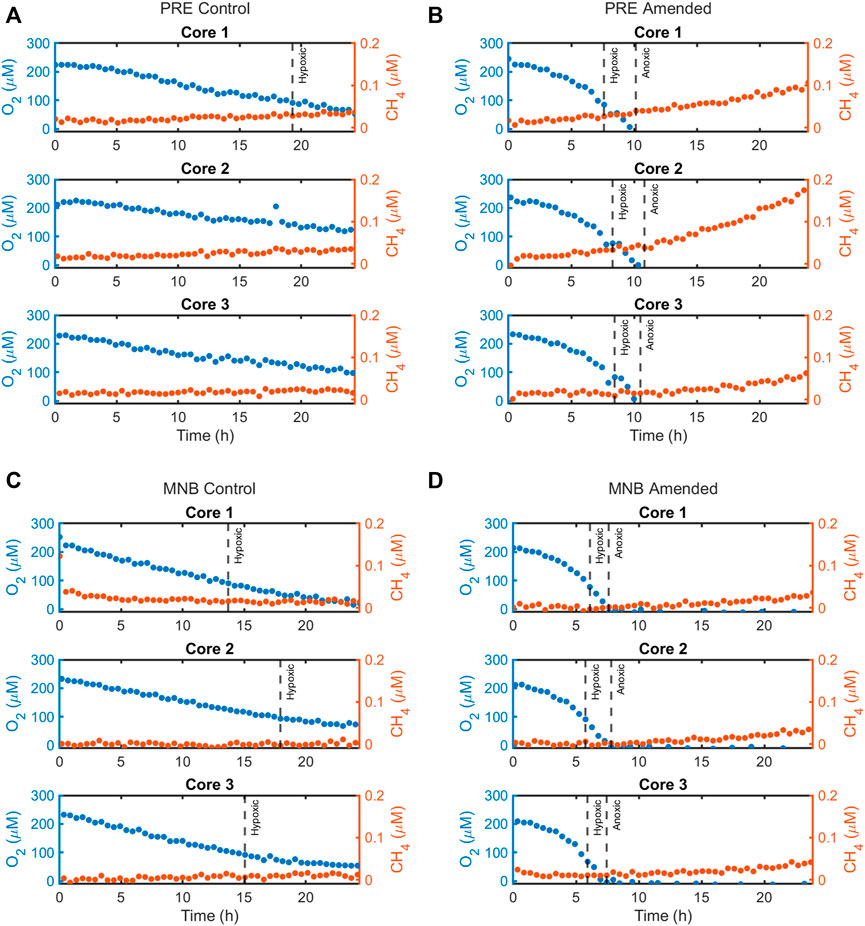
FIGURE 2. Calibrated concentration timeseries data for CH4 (in red) compared to O2 (blue), as measured by the flow-injection mass spectrometer system during the 24-h incubations for the four site and treatment combinations: (A) Providence River Estuary—Control treatment, (B) Providence River Estuary—Amended treatment, (C) Mid-Narragansett Bay—Control treatment, and (D) Mid-Narragansett Bay—Amended treatment.
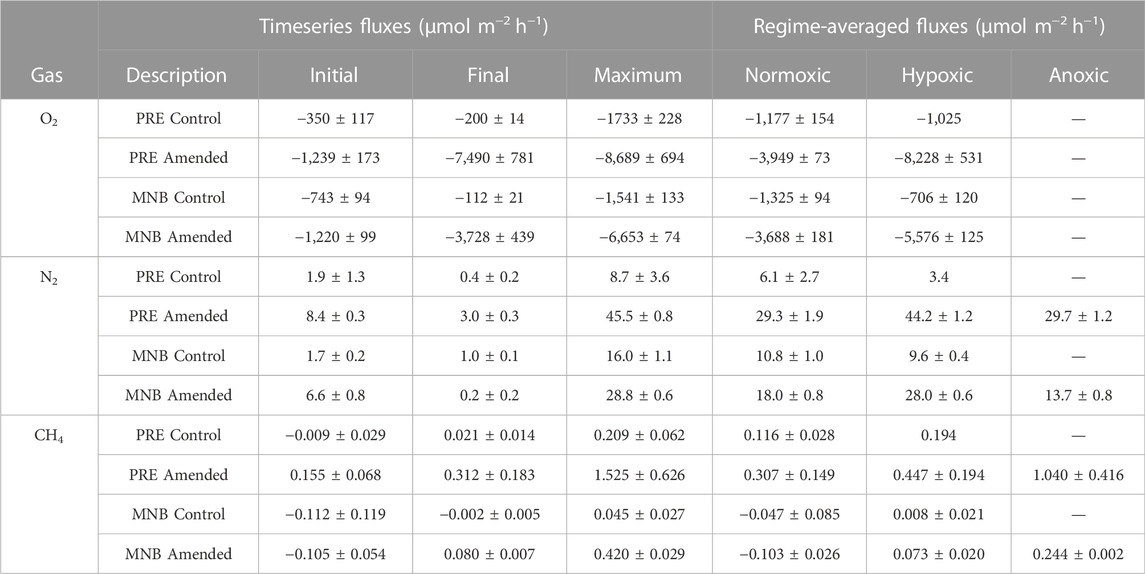
TABLE 1. Comparison of benthic gas fluxes for each site and treatment during normoxic, hypoxic (≤94 μM), and anoxic conditions. Values represent the mean ± standard error of the fluxes measured for the up to three replicate cores in each incubation. For the timeseries fluxes, the initial flux is that measured 1 h into the incubation, the final flux is that measured at the end of the incubation, and the maximum flux is the maximum influx (O2) or efflux (N2 and CH4) attained during the incubation. The regime-averaged fluxes were calculated from the difference in fitted concentrations between the beginning and end of each oxygen regime. If no standard error is reported then only one core reached hypoxia. If no value is reported then none of the cores reached anoxia.

TABLE 2. Times at which each incubation reached the hypoxic (≤94 μM) and anoxic thresholds. Values represent the mean ± standard error of up to three replicate cores.
While aerobic respiration led to declines in O2 in all cores, there were large variations in whether and when a core reached hypoxia or anoxia, even within a given site and treatment (Figures 1, 2; Table 2). All three control cores from MNB reached hypoxia, after 15.6 ± 1.2 h, while only one PRE control core went hypoxic, after 19.3 h. As expected, our addition of organic matter to cores in the amended treatment intensified aerobic respiration, resulting in a rapid O2 depletion to anoxia in sediments from both sites (2Figures 1B, D and Figures 2B, D). Amended cores from the less impacted site (MNB) reached the hypoxic and anoxic timepoints on average 1.7 and 2.4 h faster respectively than those from the more impacted site (PRE). For the control cores, the O2 consumption rate reached maximal values of −1,541 ± 133 μmol m−2 h−1 (MNB) and −1,733 ± 228 μmol m−2 h−1 (PRE). For the amended cores, the O2 consumption rate peaked at −6,653 ± 74 μmol m−2 h−1 at 5.9 ± 0.2 h into the incubation for MNB, and −8,689 ± 694 μmol m−2 h−1 at 9.5 ± 0.2 h for PRE (Figure 3).
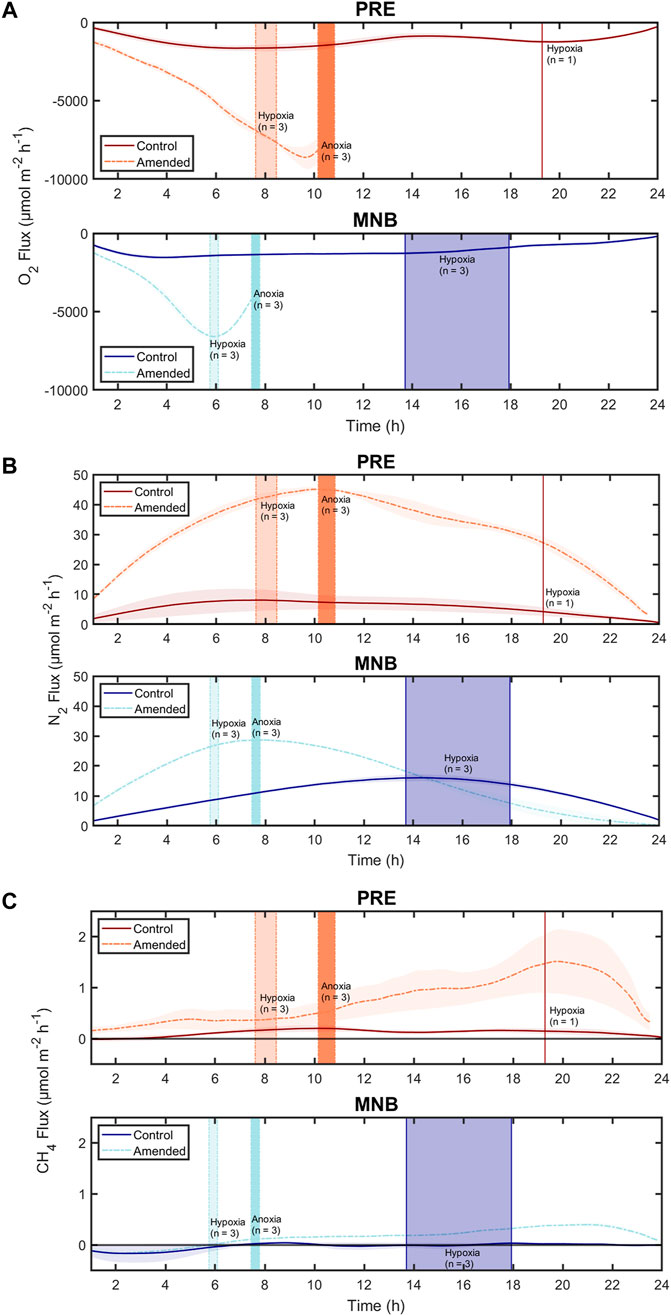
FIGURE 3. Variation of fluxes of (A) oxygen (O2), (B) dinitrogen (N2), and (C) methane (CH4) from sediments incubated over 24 h. Sediments were collected either from a more nutrient-enriched and productive site (Providence River Estuary, PRE) or a less productive site (Mid-Narragansett Bay, MNB) and incubated under ambient conditions (control) or treated with an initial pulse of organic matter (amended). Curve shading around the continuous fluxes represents the standard error (for up to three cores). The vertical bars highlight the times at which hypoxia or anoxia was reached for the cores in each treatment. While each treatment included three cores, not all cores in each treatment reached hypoxia or anoxia so we include the number of cores (n) represented by each vertical line. The thickness of the vertical bars corresponds to the range in time for when the cores reached hypoxia or anoxia. Here we define hypoxia as water column dissolved oxygen of ≤94 μM and anoxia as 0 μM.
N2 production was measured in all sites and treatments, indicating that net denitrification occurred throughout the incubation period (Figure 3B). The general trend of the N2 fluxes for MNB control and both amended treatments was similar: all initially showed an increase in N2 flux, which continued until the onset of hypoxia (for MNB control) or anoxia (for the amended treatments), at which point the N2 efflux started to decline. However, between both sites and treatments, there were differences in the magnitudes of N2 fluxes and the timing of maximum efflux. The MNB control cores had low initial N2 flux of 1.7 ± 0.2 μmol m−2 h−1 which increased to a maximum of 16.0 ± 1.1 μmol m−2 h−1, then declined again to 1.0 ± 0.1 μmol m−2 h−1. These rates are on par with those measured previously at this site (Fulweiler and Heiss 2014). The PRE control core N2 efflux started at 1.9 ± 1.3 μmol m−2 h−1, increased to 8.7 ± 3.6 μmol m−2 h−1, then returned to 0.4 ± 0.2 μmol m−2 h−1. Overall, the control cores from MNB displayed elevated N2 fluxes compared to those from PRE. In contrast, the amended cores from PRE showed more rapid and higher N2 production than those from MNB. For MNB amended, N2 fluxes reached 28.8 ± 0.6 μmol m−2 h−1 after 7.7 ± 0.6 h, and the PRE amended cores attained an even higher level of 45.5 ± 0.8 μmol m−2 h−1 after 10.5 ± 0.5 h. These amended rates represent a 180% and 523% increase over the maximum N2 fluxes in the control treatment for MNB and PRE, respectively.
CH4 fluxes exhibited dramatic responses to organic matter loading (Figure 3C). Under the initially oxic conditions, the MNB cores in both treatments had negative fluxes (at hour one: 0.112 ± 0.119 μmol m−2 h−1 (control) and −0.105 ± 0.054 μmol m−2 h−1 (amended)), indicating methane consumption within the core. After the onset of hypoxia approximately 6 hours into the incubation, the amended cores switched to a net CH4 efflux. At around the same time for the control cores, the CH4 consumption ceased and the CH4 flux remained near zero for the duration of the incubation. In contrast, the PRE control cores started out with zero CH4 fluxes, then increased to a fairly constant level (maximum flux: 0.209 ± 0.062 μmol m−2 h−1). PRE amended cores emitted CH4 even under oxic conditions, and CH4 production ramped up around the time at which the anoxic threshold was crossed (10.5 ± 0.5 h), reaching a maximum of 1.525 ± 0.626 μmol m−2 h−1 before rapidly decreasing in magnitude to 0.312 ± 0.183 μmol m−2 h−1 at the end of the incubation.
Our observation of faster O2 depletion in MNB sediments compared to PRE is perhaps surprising. One possible explanation could be due to legacy effects from varying organic matter loads. Since the 1800s, PRE has been intensively fertilized with nitrogen from anthropogenic sources, primarily wastewater (Nixon et al., 2008). Management efforts to reduce nitrogen inputs only began in 2006, and while N loads have since decreased to the lowest ever measured in Narragansett Bay, the system is still contending with a long history of human impacts (Oczkowski et al., 2018). We hypothesize that the sediment microbial community in PRE has adapted to process high loads of organic matter more efficiently than in MNB. Traditionally, the assumption has been that dissolved O2 must be depleted before facultative anaerobes (organisms that can switch between aerobic and anaerobic respiration) will begin to use alternative electron acceptors such as nitrate (NO3−). However, recent work in permeable sediments, which are supplied with organic- and oxygen-rich overlying water via advective flows, has found that denitrification can occur under oxic conditions (Rao et al., 2008; Marchant et al., 2017)—in other words, denitrifiers can co-respire O2 and NO3− in order to capitalize on changing supplies of electron acceptors. By extension we propose that at PRE, denitrifiers may have adapted by adjusting their respiratory strategies and using O2 and NO3− concurrently to process high loads of organic matter. This may explain the slower O2 depletion and faster N2 production that we observed in PRE sediments. Because MNB is located farther down bay, it receives less of the brunt of nutrients; moreover, organic matter must sink through a deeper water column before reaching the sediments (Fulweiler and Nixon, 2012). Since MNB sediments are typically more starved in organic carbon and nitrogen, a sudden pulse of labile organic matter may fuel high rates of aerobic respiration, inducing the observed faster oxygen depletion.
We hypothesize that the variations in N2 effluxes over time can be explained by a competition between aerobic and anaerobic processes whose predominance is influenced by dissolved oxygen levels. Under normoxic and even hypoxic conditions, nitrification can occur, supplying the nitrate required for dentrification. We propose that in the amended treatments, the pulse of labile organic matter was degraded by aerobic bacterial respiration, providing another source of reactive nitrogen to fuel high rates of coupled nitrification-denitrification. As oxygen depletion increased in severity, however, nitrification would have ceased, any remaining nitrate would have be consumed and thus denitrification would decline. It is also important to remember that here we measured a net flux of N2 across the sediment-water interface. Thus it is possible that sediment nitrogen fixation could have increased, which would show up first as a decline in N2 production. Sediment nitrogen fixation has been measured at both sites previously (Fulweiler and Heiss 2014). Additionally, the pulse of organic matter could have stimulated dissimilatory nitrate reduction to ammonium (DNRA), which may begin to outcompete denitrification for the remaining nitrate (An et al., 2001; Gardner and McCarthy, 2009). Of course, none of these is mutually exclusive and thus it is possible that any or a combination of these processes were occurring. Future work capturing the microbial composition and activity or using isotopic labels would help untangle these processes.
At PRE, both the control and amended cores exhibit CH4 efflux, while at MNB we observed a small uptake of CH4 in the control core at the beginning of the incubation, and small effluxes in the amended cores (similar to the efflux in the PRE control cores). Because we measured a net flux of CH4 across the sediment water interface, we cannot know what mechanism are driving these results. CH4 fluxes are ultimately controlled by methane-producing processes (i.e., methanogenesis) and methane-consuming processes (i.e., methanotrophy). While it has traditionally been assumed that coastal sediments will not produce CH4 because sulfate is abundant and sulfate reducers will outcompete methanogens for organic matter, a variety of newer studies have highlighted that this might not be the case. For example, methylotrophic methanogenesis can readily occur, especially in organic-rich muddy sediments (Schorn et al., 2022). When oxygen is present either at the sediment-water interface or within the overlying water then it is likely that aerobic methane oxidation is occurring (Fenchel et al., 1995). However, when the overlying water becomes anoxic then other methane consuming processes are likely dominating such anaerobic oxidation of methane (AOM). AOM can occur via different electron acceptors, such as nitrate and nitrite (AOM coupled to NOx− reduction), sulfate (AOM coupled to sulfate reduction), and metals.
There is an unusual pattern in CH4 efflux in the PRE cores and the MNB amended core—methane appears to decrease towards the end of the 24-h incubation. This is unexpected because we would assume that the low to no oxygen conditions in the cores would stimulate CH4 production. We do not know why this decrease occurred. But we note that we see a similar decline in N2 production and in sediment oxygen uptake. We propose that this decline could indicate the labile organic matter was rapidly consumed leaving more recalcitrant material behind, thus slowing the overall pace of benthic metabolism (Henrichs and Reeburgh, 1987).
3.2 Influence of oxygen on gas fluxes
Because O2 concentration is easier to measure than N2 or CH4 concentrations, and O2 data is more prevalent We examined the ability of O2 concentrations as a function of N2 and CH4 fluxes. This is helpful to show any relationships between O2 and other gas fluxes as. If strong relationships existed, they could help inform benthic models. Accordingly, we plotted the flux data pooled for the cores in each site and treatment combination against the respective oxygen concentrations until the onset of anoxia (Figure 4). This analysis revealed that changing O2 conditions induce different behaviors for the control vs. amended cores. In the control treatment, N2 effluxes were low to zero at normoxic and anoxic conditions, and attained maxima at an O2 concentration of ∼200 μM for PRE (Figure 4A) and ∼120 μM for MNB (Figure 4C). For the amended treatment, the N2 effluxes were low under oxic conditions, then displayed an increase to a high, constant level upon crossing the hypoxic threshold for both sites Figures 4B, D). These data suggest that organic matter and or nitrate may be limiting denitrification at these sites and may hint at the reason why studies on the impact of low oxygen events on sediment denitrification report such variable results. For example, some studies report an increase in denitrification under hypoxia (Neubacher et al., 2011; Caffrey et al., 2019; Huang and An, 2022) while others found a decrease in denitrification (Song et al., 2021), and others no change at all (Foster and Fulweiler 2019). One potential reason for this variation could be the availability of organic matter during the hypoxic episodes. For example, in the unamended sediment cores here we see low rates of dentification that rapidly decline under hypoxia (Figures 3A, C). Conversely, when fresh, labile organic matter was present denitrification increases as oxygen levels decline (Figures 3B, D). This organic matter could fuel the heterotrophic process of denitrification directly. Additionally, aerobic organic matter decomposition could release ammonium that is subsequently nitrified thus stimulating coupled nitrification-denitrification. A recent paper found that their observed increase in sediment denitrification under hypoxia was driven by enhanced nitrification that was not inhibited by weak hypoxia (Huang and An 2022).
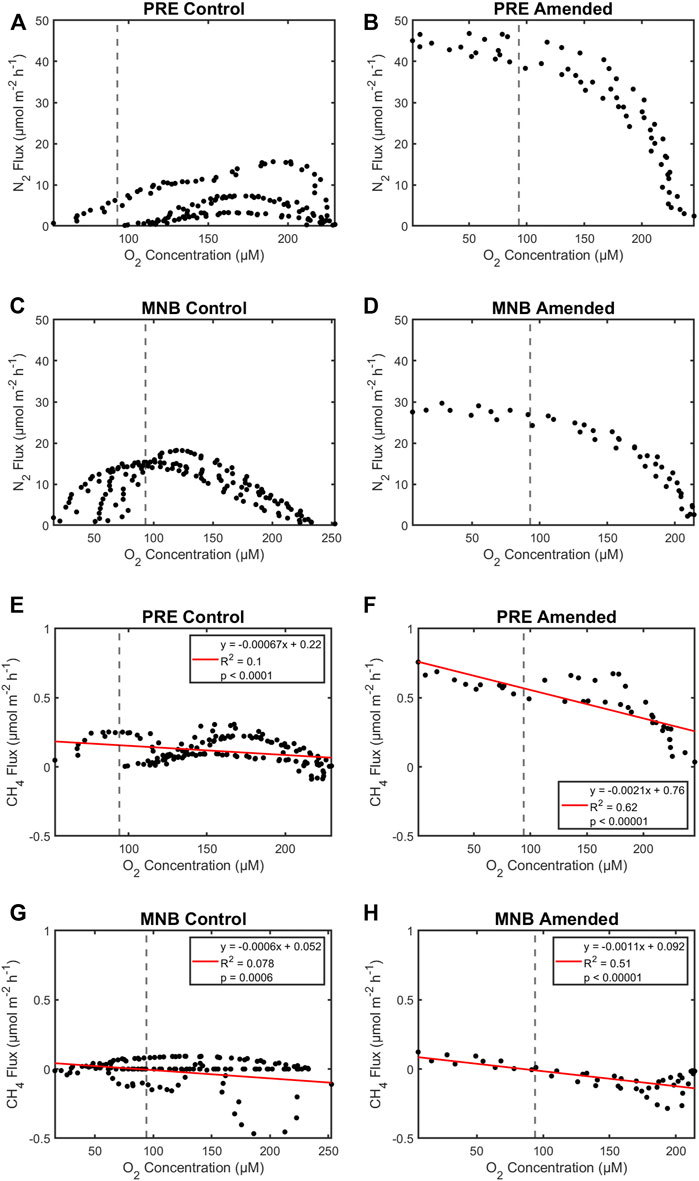
FIGURE 4. Dinitrogen (N2; A–D) and methane (CH4; E–H) fluxes as a function of oxygen concentration. Data from triplicate cores in each site and organic matter treatment are pooled. Vertical dashed lines denote the defined hypoxic threshold used in this study (≤94 μM). Here we do not show any fluxes that occurred once the cores went anoxic (Supplementary Figure S1 has all the fluxes).
We observed a similar pattern for CH4, where methane fluxes were low regardless of oxygen concentrations in the control cores (Figures 4E, G). Yet in the amended cores methane flux significantly increased at low oxygen conditions (Figures 4F, H). In fact, water column oxygen concentration was able to predict more than 50%–60% of the variability in CH4 fluxes in the amended cores. The increase in organic matter appears to be a mechanism for decreasing the filters (i.e., aerobic and anerobic oxidation of methane) that usually keep methane fluxes low in estuaries (Myllykangas et al., 2020).
Together these data have important implications for how we understand how hypoxia and anoxia will alter nitrogen removal and greenhouse gas emissions. For example, if the low oxygen event is driven by phytoplankton bloom senescence, then that pulse of organic matter might stimulate denitrification and methane emissions. In contrast, if the low oxygen event is the product of warming induced water column stratification, then we might expect a decrease in dentification and methane emissions. Unfortunately, in this study we do not have additional data (e.g., nutrient fluxes, microbial community activity) that can help us elucidate these mechanisms—But the patterns are interesting and provide strong motivation for future research.
4 Conclusion
As coastal hypoxia increases in intensity and duration globally, there will be profound impacts on benthic biogeochemical cycling. These may include changes to microbial processes occurring in the sediment, and in the magnitude and direction of sediment-water nutrient fluxes (e.g., Jilbert et al., 2011; Pratihary et al., 2014; Foster and Fulweiler, 2019). At present, there is insufficient evidence to conclude whether hypoxia hinders the ability of sediments to provide important ecosystem services, such as nutrient recycling, carbon sequestration, and greenhouse gas emission regulation (Middelburg and Levin, 2009). Here, we have demonstrated that benthic fluxes of N2 and CH4 respond rapidly and in complex ways to oxygen depletion. These responses vary depending on the organic matter availability (i.e., whether the sediments are provided with a source of labile organic matter or not) and legacy (i.e., whether the sediments were collected from a more or less productive site). Our results suggest that reactive nitrogen removal may initially be enhanced under short-term hypoxia but that this effect is temporary and diminishes under prolonged hypoxia to anoxia, and that organic matter loading enhances methane effluxes from sediments, especially as oxygen depletion increases in severity.
Our use of a novel flow-injection mass spectrometer system for gas concentration measurements during the laboratory incubations enabled us to capture transient changes as the sediments crossed various oxygen thresholds. While we cannot quantify the individual processes responsible for the observed biogeochemical responses from net gas flux measurements alone, our data do reflect the changing overall balance in the competition between aerobic and anaerobic processes across a spectrum of dissolved oxygen levels. Given our findings that gas fluxes can change depending on whether the sediment is experiencing normoxic, hypoxic, or anoxic conditions, our results highlight the nuances not represented by one flux number across oxygen regimes, as typically reported. Application of our method in future benthic flux incubation studies has considerable potential to improve our understanding of how key sediment biogeochemical processes respond to oxygen depletion.
Data availability statement
The raw data supporting the conclusions of this article will be made available by the authors, without undue reservation.
Author contributions
RF conceived of this study. EC and RF modified the study. EC carried out the experiment and performed the data analysis. EC wrote the initial draft of the manuscript with contributions from RF. RF and EC edited the manuscript. All authors contributed to the critical review of this manuscript.
Funding
This work was funded by the National Science Foundation through a grant (OCE-1435690) to RF in Ocean Technology and Interdisciplinary Coordination. EC was supported in part by a Graduate Writing Fellowship from Boston University. EC and RF were supported by NOAA ECOHAB grant. RF was supported by a grant from RI Sea Grant.
Acknowledgments
The authors thank Amanda Vieillard, Cat Mahoney, and Melissa Hagy for assistance in the field, Joel Sparks for technical support, Tim Short for helpful discussions about the mass spectrometer data analysis, and Russell Goebel for invaluable guidance on the statistical analysis.
Conflict of interest
The authors declare that the research was conducted in the absence of any commercial or financial relationships that could be construed as a potential conflict of interest.
Publisher’s note
All claims expressed in this article are solely those of the authors and do not necessarily represent those of their affiliated organizations, or those of the publisher, the editors and the reviewers. Any product that may be evaluated in this article, or claim that may be made by its manufacturer, is not guaranteed or endorsed by the publisher.
Supplementary material
The Supplementary Material for this article can be found online at: https://www.frontiersin.org/articles/10.3389/fenvs.2022.1028405/full#supplementary-material
References
An, S., Gardner, W. S., and Kana, T. (2001). Simultaneous measurement of denitrification and nitrogen fixation using isotope pairing with membrane inlet mass spectrometry analysis. Appl. Environ. Microbiol. 67, 1171–1178. doi:10.1128/aem.67.3.1171-1178.2001
Bergondo, D. L., Kester, D. R., Stoffel, H. E., and Woods, W. L. (2005). Time-series observations during the low sub-surface oxygen events in Narragansett Bay during summer 2001. Marine Chemistry. 97. doi:10.1016/j.marchem.2005.01.006
Breitburg, D., Levin, L. A., Oschlies, A., Grégoire, M., Chavez, F. P., Conley, D. J., et al. (2018). Declining oxygen in the global ocean and coastal waters. Science 80, eaam7240. doi:10.1126/science.aam7240
Caffrey, J. M., Bonaglia, S., and Conley, D. J. (2019). Short exposure to oxygen and sulfide alter nitrification, denitrification, and DNRA activity in seasonally hypoxic estuarine sediments. FEMS Microbiol. Lett. 366, fny288. doi:10.1093/femsle/fny288
Hopkinson, C., Giblin, A. E., and Tucker, J. (2001). Benthic metabolism and nutrient regeneration on the continental shelf of Eastern Massachusetts. USA 224, 1–19.
Chua, E. J., Huettel, M., Fennel, K., and Fulweiler, R. W. (2022). A case for addressing the unresolved role of permeable shelf sediments in ocean denitrification. Limnol. Oceanogr. Lett. 7, 11–25. doi:10.1002/lol2.10218
Chua, E. J., Short, R. T., Cardenas Valencia, A. M., Savidge, W., and Fulweiler, R. W. (2021). A mass spectrometer based pore water sampling system for sandy sediments. Limnol. Oceanogr. Methods. 19, 769–784. doi:10.1002/lom3.10460
Codiga, D. L., Stoffel, H. E., Deacutis, C. F., Kiernan, S., and Oviatt, C. A. (2009). Narragansett Bay hypoxic event characteristics based on fixed-site monitoring network time series: Intermittency, geographic distribution, spatial synchronicity, and interannual variability. Estuaries Coasts 32, 621–641. doi:10.1007/S12237-009-9165-9
Damgaard, L. R., Revsbech, N. P., and Reichardt, W. (1998). Use of an oxygen-insensitive microscale biosensor for methane to measure methane concentration profiles in a rice paddy. Appl. Environ. Microbiol. 64, 864–870. doi:10.1128/AEM.64.3.864-870.1998
Diaz, R. J., Rosenberg, R., and Sturdivant, K. (2019). Ocean deoxygenation everyone’s probl, 20. Available at: https://portals.iucn.org/library/node/48892.
Fenchel, T., Bernard, C., Esteban, G., Finlay, B. J., Hansen, P. J., and Iversen, N. (1995). Microbial diversity and activity in a Danish fjord with anoxic deep water. Ophelia 43, 45–100. doi:10.1080/00785326.1995.10430576
Foster, S. Q., and Fulweiler, R. W. (2019). Estuarine sediments exhibit dynamic and variable biogeochemical responses to hypoxia. J. Geophys. Res. Biogeosciences 124, 737–758. doi:10.1029/2018JG004663
Fulweiler, R. W., Nixon, S. W., Buckley, B. A., and Granger, S. L. (2007). Reversal of the net dinitrogen gas flux in coastal marine sediments. Nature 448, 180–182. doi:10.1038/nature05963
Fulweiler, R. W., and Nixon, S. W. (2012). Net sediment N2 fluxes in a southern New England estuary: Variations in space and time. Biogeochemistry 111, 111–124. doi:10.1007/s10533-011-9660-5
Fulweiler, R. W., and Heiss, E. M. (2014). (Nearly) a decade of directly measured sediment N2 fluxes: What can Narragansett Bay tell us about the global ocean nitrogen budget? Oceanography 27 (1), 184–195. doi:10.5670/oceanog.2014.22
Garcia, D. (2011). A fast all-in-one method for automated post-processing of PIV data. Exp. Fluids 50, 1247–1259. doi:10.1007/s00348-010-0985-y
Garcia, D. (2010). Robust smoothing of gridded data in one and higher dimensions with missing values. Comput. Stat. Data Anal. 54, 1167–1178. doi:10.1016/j.csda.2009.09.020
Garcia, H. E., and Gordon, L. I. (1992). Oxygen solubility in seawater: Better fitting equations. Limnol. Oceanogr. 37, 1307–1312. doi:10.4319/lo.1992.37.6.1307
Gardner, W. S., and McCarthy, M. J. (2009). Nitrogen dynamics at the sediment-water interface in shallow, sub-tropical Florida Bay: Why denitrification efficiency may decrease with increased eutrophication. Biogeochemistry 95, 185–198. doi:10.1007/s10533-009-9329-5
Henrichs, S. M., and Reeburgh, W. S. (1987). Anaerobic mineralization of marine sediment organic matter: Rates and the role of anaerobic processes in the oceanic carbon economy. Geomicrobiol. J. 5, 191–237. doi:10.1080/01490458709385971
Huang, Y., and An, S. (2022). Weak hypoxia enhanced denitrification in a dissimilatory nitrate reduction to ammonium (DNRA)-Dominated shallow and eutrophic coastal waterbody, jinhae bay, South Korea. Mar. Sci. 9, doi:897474doi:10.3389/fmars.2022.897474
Jilbert, T., Slomp, C. P., Gustafsson, B. G., and Boer, W. (2011). Beyond the Fe-P-redox connection: Preferential regeneration of phosphorus from organic matter as a key control on Baltic Sea nutrient cycles. Biogeosciences 8, 1699–1720. doi:10.5194/BG-8-1699-2011
Kana, T. M., Darkangelo, C., Hunt, M. D., Oldham, J. B., Bennett, G. E., and Cornwell, J. C. (1994). Membrane inlet mass spectrometer for rapid high-precision determination of N2, O2, and Ar in environmental water samples. Anal. Chem. 66, 4166–4170. doi:10.1021/ac00095a009
Marchant, H. K., Ahmerkamp, S., Lavik, G., Tegetmeyer, H. E., Graf, J., Klatt, J. M., et al. (2017). Denitrifying community in coastal sediments performs aerobic and anaerobic respiration simultaneously. ISME J. 11, 1799–1812. doi:10.1038/ismej.2017.51
McCarthy, M. J., Newell, S. E., Carini, S. A., and Gardner, W. S. (2015). Denitrification dominates sediment nitrogen removal and is enhanced by bottom-water hypoxia in the northern gulf of Mexico. Estuaries Coasts 38, 2279–2294. doi:10.1007/s12237-015-9964-0
McMaster, R. (1960). Sediments of Narragansett bay system and Rhode Island sound, Rhode Island. SEPM J. Sediment. Res. 30, 249–274. doi:10.1306/74d70a15-2b21-11d7-8648000102c1865d
Middelburg, J. J., and Levin, L. A. (2009). Coastal hypoxia and sediment biogeochemistry. Biogeosciences 6, 1273–1293. doi:10.5194/bg-6-1273-2009
Myllykangas, J.-P., Hietanen, S., and Jilbert, T. (2020). Legacy effects of eutrophication on modern methane dynamics in a boreal estuary. Estuaries Coasts 43, 189–206. doi:10.1007/s12237-019-00677-0
Neubacher, E. C., Parker, R. E., and Trimmer, M. (2011). Short term hypoxia alters the balance of the nitrogen cycle in coastal sediments. Limnol. Oceanogr. 56, 651–665. doi:10.4319/lo.2011.56.2.0651
Nixon, S. W., Buckley, B. A., Granger, S. L., Harris, L. A., Oczkowski, A. J., Fulweiler, R. W., et al. (2008). “Nitrogen and phosphorus inputs to Narragansett bay: Past, present, and future,” in Science for ecosystem-based management (New York, NY: Springer), 101–175. doi:10.1007/978-0-387-35299-2_5
Nixon, S. W., Granger, S. L., and Nowicki, B. L. (1995). An assessment of the annual mass balance of carbon, nitrogen, and phosphorus in Narragansett Bay. Biogeochemistry 33, 217. doi:10.1007/bf00000805
Oczkowski, A., Schmidt, C., Santos, E., Miller, K., Hanson, A., Cobb, D., et al. (2018). How the distribution of anthropogenic nitrogen has changed in Narragansett Bay (RI, USA) following major reductions in nutrient loads. Estuaries Coasts 41, 2260–2276. doi:10.1007/s12237-018-0435-2
O’Haver, T. (2020). Pragmatic introduction to signal processing A retirement project by. Available at: http://bit.ly/1TucWLfWebaddresshttp://bit.ly/1NLOlLRInteractiveMatlabTools:http://bit.ly/1r7oN7bSoftwaredownloadlinkshttp://tinyurl.com/cey8rwhAnimatedexampleshttps://terpconnect.umd.edu/%7B∼%7Dtoh/spectrum/ToolsZoo.html.
Oviatt, C. A., Keller, A., and Reed, L. (2002). Annual primary production in Narragansett Bay with no bay-wide winter–spring phytoplankton bloom Estuar. Coast Shelf Sci 54 (6), 1013–1026. doi:10.1006/ecss.2001.0872
Pilson, M. E. Q. (1985). On the residence time of water in Narragansett Bay. Estuaries 8, 2–14. doi:10.2307/1352116
Pratihary, A. K., Naqvi, S. W. A., Narvenkar, G., Kurian, S., Naik, H., Naik, R., et al. (2014). Benthic mineralization and nutrient exchange over the inner continental shelf of Western India. Biogeosciences 11, 2771–2791. doi:10.5194/BG-11-2771-2014
Rao, A. M. F., McCarthy, M. J., Gardner, W. S., and Jahnke, R. A. (2008). Respiration and denitrification in permeable continental shelf deposits on the south atlantic bight: N2:Ar and isotope pairing measurements in sediment column experiments. Cont. Shelf Res. 28, 602–613. doi:10.1016/j.csr.2007.11.007
Rosentreter, J. A., Borges, A. V., Deemer, B. R., Holgerson, M. A., Liu, S., Song, C., et al. (2021). Half of global methane emissions come from highly variable aquatic ecosystem sources. Nat. Geosci. 14, 225–230. doi:10.1038/s41561-021-00715-2
Schorn, S., Ahmerkamp, S., Bullock, E., Weber, M., Lott, C., Liebeke, M., et al. (2022). Diverse methylotrophic methanogenic archaea cause high methane emissions from seagrass meadows. Proc. Natl. Acad. Sci. U. S. A. 119, 21066281199–e2106628212. doi:10.1073/pnas.2106628119
Song, G., Liu, S., Zhang, J., Zhu, Z., Zhang, G., Marchant, H. K., et al. (2021). Response of benthic nitrogen cycling to estuarine hypoxia. Limnol. Oceanogr. 66, 652–666. doi:10.1002/lno.11630
Vaquer-Sunyer, R., and Duarte, C. M. (2008). Thresholds of hypoxia for marine biodiversity. Proc. Natl. Acad. Sci. U. S. A. 105, 15452–15457. doi:10.1073/pnas.0803833105
Keywords: estuary, hypoxia, nitrogen, methane, greenhouse gas, mass spectrometry
Citation: Chua EJ and Fulweiler RW (2023) Capturing the rapid response of sediments to low-oxygen conditions with high temporal resolution gas concentration measurements. Front. Environ. Sci. 10:1028405. doi: 10.3389/fenvs.2022.1028405
Received: 26 August 2022; Accepted: 12 December 2022;
Published: 04 January 2023.
Edited by:
Marta Sebastian, Institut de Ciències del Mar, CSIC, SpainReviewed by:
Moritz Felix Lehmann, University of Basel, SwitzerlandHaryun Kim, Korea Institute of Ocean Science and Technology (KIOST), South Korea
Copyright © 2023 Chua and Fulweiler. This is an open-access article distributed under the terms of the Creative Commons Attribution License (CC BY). The use, distribution or reproduction in other forums is permitted, provided the original author(s) and the copyright owner(s) are credited and that the original publication in this journal is cited, in accordance with accepted academic practice. No use, distribution or reproduction is permitted which does not comply with these terms.
*Correspondence: Emily J. Chua, ejchua@bu.edu; Robinson W. Fulweiler, rwf@bu.edu