Revisiting EKC hypothesis in context of renewable energy, human development and moderating role of technological innovations in E-7 countries?
 Najia Saqib1
  Muhammad Usman2*
  Magdalena Radulescu3,4
  Crenguta Ileana Sinisi5
  Carmen Gabriela Secara5
  Claudia Tolea5
- 1Department of Finance, College of Business Administration, Prince Sultan University, Riyadh, Saudi Arabia
- 2China Institute of Development Strategy and Planning, and Center for Industrial Economics, Wuhan University, Wuhan, China
- 3Department of Finance, Accounting and Economics, University of Pitesti, Pitesti, Romania
- 4Institute for Doctoral and Post-Doctoral Studies, University “Lucian Blaga” Sibiu, Sibiu, Romania
- 5Department of Management and Business Administration, University of Pitesti, Pitesti, Romania
The present study examines the potential of the traditional environmental Kuznets curve (EKC) with an extension for growing industrialized economies, including Brazil, China, India, Indonesia, Russia, Mexico and Turkey (E-7 economies) spanning from 1995 to 2019. Since the E-7 economies are still in a growing phase, this study adds to the EKC phenomenon by taking into description human development, the use of renewable energy, and technological innovations for investigation. Second-generational panel econometrics techniques, such as cross-sectional augmented autoregressive distributive lag (CS-ARDL), Augmented Mean Group (AMG), and Dumitrescu-Hurlin causality tests, form the basis of the experimental framework’s design. The study confirms the existence of the EKC phenomena in E-7 economies, where income expansion is prioritized in relation to environmental sustainability. The study’s findings demonstrate that technological modernization helps to mitigate pollution level. Therefore, human development, technological innovation, and the use of renewable energy are held up as the panacea for reducing carbon emissions over the time period under study. Finally, some further policy suggestions are provided.
1 Introduction
Global environmental threats have emerged in recent years due to pollution’s rapid expansion. CO2 is the primary cause of this contamination; and it increased from 3.80 to 4.50 metric tons (Mt) per capita annually between 1995 and 2019 (WDI, 2022). The combustion of non-renewable energy resources like natural gas, oil, and coal for purposes like energy production and hauling is a large contribution to carbon dioxide (CO2) emissions, despite the fact that energy utilization is a key component in income growth (Raza et al., 2015; Phong, 2019). In order to address the problem of pollution on a worldwide scale, every nation will need to switch to alternative energy sources like renewable and cleaner energy. This is a prudent step in that direction to make sure the transition has an as little adverse effect on the economy as possible. However, every nation on Earth is susceptible to pollution’s impacts. It is logical to assume that the nations that produce the most of the world’s largest CO2 emissions will also be expected to do the most to solve the problem (IPCC, 2007; Shahbaz et al., 2013). The U.S., China, India, and Russia are among the top polluting nations; their cooperation is crucial to a worldwide effort to improve air quality. China (22.40%), India (15.6%), Brazil (2.0%), Russia (5.3%), and Indonesia (1.60%) together account for 46.9% of global energy demand, so the high level of emissions in 2019 not surprising. The U.S. population accounted for only 4% of the global population yet used 16% of all energy. China and India, on the other hand, consumed more than 22% and 6% of global energy, respectively (IEA, 2018).
The priority of COP27 will be on converting commitments made at past conferences into concrete measures during the 2020’s. In light of this, the underlying technical and political challenges of these agenda items will not be resolved by COP27. However, it is maintained that any progress, no regardless how small, in each of these agenda topics will help improve the global response to the effects of climate change. At COP27, low and middle-income countries will be forefront and centered as the world discusses how to best address the effects of climate change. To further complicate problems, low- and middle-income countries have historically and currently contributed minimally to global greenhouse gas emissions, the main source of climate change. But because of their climate and their acute impoverishment, low-middle income nations are especially at risk from climate change. The implications for low- and middle-income countries in global climate change governance have risen as a result of this dilemma.
Between 2016 and 2050, pollution is expected to keep rising at a rate of 2.6% per year. Most of this increase will come from the E-7 economies’ rapidly developing countries, which include Brazil, India, China, Indonesia, Russia, Mexico, and Turkey, where growth rates are expected to average 3.5% per year (PWC, 2017). The methodology behind the E-7 economy’s growth projection out to 2050 is based on a reliable long-run model of income growth (Solow, 1957), which facilitates growth projections by factoring in developments related to a wide range of factors like capital accumulation, human development, and technological innovations. Some other growth studies have also conducted empirical investigations of the applied growth model such as (Barro and Lee, 2001; Hao and Wei, 2015). Moreover, according to Hawksworth and Cookson (2006), the E-7 economies are those with the highest potential for population increase among developing nations, making them ultimately as economically powerful as the G-7 countries. By the end of 2018, these nations accounted for the global population (47%), global GDP (26%), global energy use (40%), and global CO2 emissions (45%). Understanding the association between the factors of CO2 emissions in E-7 economies is crucial because of the extreme vulnerability they face to the risks of climate change and CO2 emissions as a consequence of their, GDP growth, energy use, and CO2 emissions. Emissions of carbon dioxide per person reflect the total number of tons of CO2 emissions released due to the deployment of non-renewable energy sources (i.e., coal, natural gas, crude oil, and other fossil fuels) divided by the population in the world. The carbon output of Russia is the greatest of the E-7 economies, whereas India has the lowest carbon output. According to Figure 1, the E-7 economies have a relatively high CO2 output.

FIGURE 1. Trend of total CO2 emissions in E-7 economies in million tons per capita in 2019.
There is progress being made toward a low-carbon economy, but this trend must be extended to include social and environmental considerations. The Human Development Index (HDI) is a composite measure of a country’s health, income, and education that is based on the Sen’s capacity approach (UNDP, 1990). Improvements in people’s standards of living are seen as a consequence of the HDI rising. Every nation strives to develop its people to their fullest potential. The guarantee of energy utilization and the need for CO2 emissions, nevertheless, are necessary for the actualization of the right to human development (Pan, 2002). The human development report included a new indicator, the Planetary Pressures-adjusted Human Development Index (PHDI), to highlight the way in which human behaviors exert tremendous pressure on the planet’s environment and biodiversity. As a result of human development, these factors will cause climate change and species annihilation that will reduce or eliminate HDI (UNDP, 2020). Thus, policymakers will have greater evidence for attaining sustainable development if the connection between CO2 emissions and human development is studied (Hossain and Chen, 2022).
A transition to a world without atmospheric carbon requires renewable energy sources for instance wind, hydro, solar, geothermal, and biomass. Two recent studies support this theory (Cheng et al., 2019; Kirikkaleli and Sowah, 2020). Natural capital stocks and the generation of energy from renewable sources are essential to sustaining economic growth, which in turn necessitates their frequent monitoring (Schmalensee, 2012). To further promote the consumption of alternative and cleaner energy sources, the Kyoto Agreement also mandates that countries lessen their negative effects on the environment (Becker and Posner, 2005). One of these benefits is eliminating the need to import non-renewable resources, which is why the deployment of renewable energy sources is so essential (Saqib et al., 2022b; 2022c). Since the costs of imported non-renewable energy sources are extremely unpredictable, stabilizing oil prices on the international market is another way to ensure consistent growth of the economy (Menyah and Wolde-Rufael, 2010). Another study discovered a favorable association between per capita use of alternative energy sources and income growth per person (Saqib, 2022).
Developing new environmental technologies (TECH) is an example of innovation. It illustrates patents that fall under the category of environmental technology, such as those that deal with groundwater adaptability or mitigation of global warming. The number of patents issued is often used as a proxy for innovation in previously existing literature (Hagedoorn and Cloodt 2003; Wurlod and Noailly, 2018). The frequency of environmental innovations is calculated as a ratio of high-value inventions per million inhabitants living in a given region. Figure 2 displays the TECH time series for the E-7 economies for the year 2019 and also shows that in 2019, Brazil kept its highest TECH while Turkey maintained a low TECH.
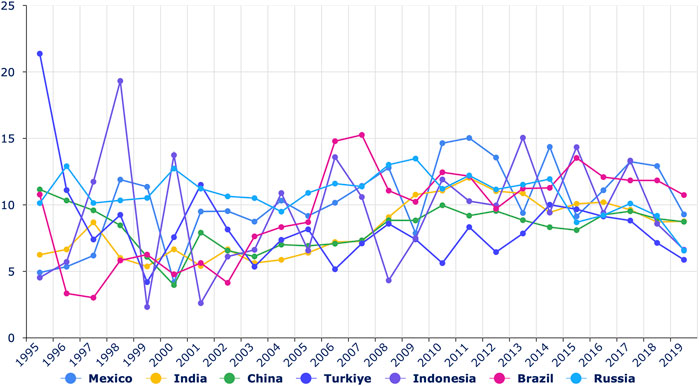
FIGURE 2. Tend of patents in E-7 countries (1995–2019).
Figure 2 shows the number of environmental patents filed in the E-7 economies has increased over the past year, while the E-7 economies’ combined CO2 emissions continue to rise. Consequently, the E-7 economies should implement climate change policies with the assistance of research that analyzes the impact environmental patents have on carbon emissions. Given the importance of environmental patents in combating environmental problems, this research aspires to reveal the interaction between carbon emissions, human development, economic growth, and renewable energy usage in the E-7 economies. In order to establish policies that would support economic development, particularly in the E-7 economies, policymakers need to understand the consequences of technical innovation, deployment patterns of renewable energy, and HDI on CO2 emissions. This research stands out from the rest because it adds fresh information to the EKC framework by examining the influence of technology innovation, human development index, and renewable energy. The E-7 economies are prioritized because of their lack of recorded documentation in the aforementioned literature and the E-7 nations are responsible for a substantial percentage of the world’s overall energy consumption and carbon emissions. We also provide an extensive empirical analysis of second-generational panel methods and findings for future policy directions. After a thorough empirical investigation of how well SDGs 3, 4, 7, 8, and 13 are being met, the E-7 countries are given a set of new and effective policy suggestions.
The remaining sections of this study are structured as follows: Section 2 reviews an earlier literature. Sections 3, 4 describe the data and econometric modeling strategy respectively. Section 5 discusses and interprets the results. The policy recommendations and last thoughts are reported in Section 6.
2 Review of literature
The EKC hypothesis is the initial assertion regarding the link between carbon emissions and their determining variables to be made (Kuznets, 1955). Based on these data, Kuznets established the EKC hypothesis, which states that carbon emissions are negatively associated with economic growth (as measured by GDP). Some researchers further examined the EKC theory with scientific investigations, exploring at how high-rise influences CO2 emissions and other variables (Holtz-Eakin and Selden, 1995; Dinda and Coondoo, 2006). Conventional hypotheses for CO2 emissions emphasize population growth, economic growth, and technological progress (Ehrlich and Holdren, 1971) The EKC, a quadratic link between pollution and income growth, provides strong evidence for the importance of economic prosperity (Doytch and Uctum, 2016; Pham et al., 2020; Balsalobre-Lorente et al., 2022). The minimum level of energy consumption during the pre-industrialization phase, the high level of emissions during modernization and manufacturing sector development, and the low level of emission levels during the deindustrialization and shift to a services-based economy are all assumed to occur as the economy expands and undergoes modernization. Energy consumption and CO2 emissions have also been shown to exhibit a similar quadratic relationship (Baloch et al., 2021; Doytch and Ashraf, 2021; Adebayo et al., 2022).
EKC can be explained as affluence rises, people demand a better environment, while industrialization and output raise environmental pressure. This leads to legislation and technologies to improve efficiency and reduce emissions. Many EKC studies employ ecological footprints as an environmental quality proxy, and past research suggests that higher-income countries are more likely to support the EKC hypothesis (Hashmi et al., 2021). While there was some variation in findings, the EKC hypothesis was generally supported by high-income countries (Pata, 2021). The turning point (TP) was higher in countries with higher incomes than in those with lower incomes. According to the inverted U-shaped EKC hypothesis, environmental damage rises alongside economic growth until rising income inequality mitigates the impact. Further, the study’s findings indicate that E7 economies’ income growth has a moderating effect on their carbon emissions. The results corroborate the research of (Dong et al., 2018; Pata 2018; Gyamfi et al., 2021a; Pata, and Caglar. 2021; Ali Talib et el. 2022; Yang et al., 2022), showing that an increase in national income, as a result of economic growth, is likely to help drive these economies toward environmental sustainability. The E-7 economies are mostly low-middle-income countries and the low-middle-income countries have not yet reached income levels high enough to be able to derive their turning points, which is consistent with (Dinda, 2004).
Human development (HDI) is the primary goal of economic progress, and as a result, all nations strive to improve their HDI. To achieve this goal, we need to understand what factors have an effect on HDI. The HDI has received a lot of concentration from environmentalists already. Various samples, econometric methods, and contextual factors were used. As a result of these studies, we know that both economic development (Ranis et al., 2000; Suri et al., 2011; Shah, 2016) and carbon dioxide emissions (Bedir and Yilmaz 2015) have an impact on human development. In addition to the things listed above, the HDI also looks at the energy consumption as a separate variable. In the past, it was believed that increasing fuel consumption would result in better human development. Nevertheless, as the environmental issues connected with fuel usage are rising, this perspective would be no more appropriate. The use of more fuel doesn’t really inevitably result in more HDI (Tran et al., 2019). The following is a discussion of some studies that compare energy consumption and HDI. Over 200 countries were included in the study developed by (Martnez and Ebenhack, 2008), and the results indicate a correlation between fuel consumption and HDI. Furthermore, Ouedraogo (2013) evaluated 15 emerging economies from 1988 to 2008 by using Pedroni cointegration, and FMOLS analysis, which revealed an adverse and one-way Granger causality association between CO2 emissions and HDI. In contrast to the previous study, Tran et al. (2019) examined the link for 93 economies using 1990–2014 statistics by utilizing the GMM (generalized method of moments) and found fuel consumption doesn’t affect HD improvement in emerging and developed nations. Martnez and Ebenhack, 2008 discovered a statistically significant relationship between HDI and per capita energy use. Low-HDI countries that are energy-poor can benefit greatly from even a moderate quantity of energy support. Low-HDI countries should be provided the most attention in consultation about global atmospheric variations to protect their human development rights (Pan, 2002).
One of the most environmentally and economically sustainable measures is the proportion of energy consumed that comes from alternative sources. Multiple analyses of this situation have identified fossil fuel-based energy as a major source of environmental degradation. In the case of Nigeria, Ali et al. (2018) examined that energy use significantly posits a slew of environmental and health issues. Contrarily, a number of reports showed that replenishing energy supplies contributed to environmental dominance. The AMG method was used by (Saqib et al., 2022) and others to investigate how advances in renewable energy and technology have affected the environmental impact of the G-7 economies. The empirical research looked into how renewable energy considerably enhances environmental eminence. The earlier literature by (Wu et al., 2022; Yang Q. et al., 2022; Zhang et al., 2022; Wang et al., 2023) finds similar conclusions, stating that cleaner energy and technological innovation have a substantial influence on carbon emissions.
Studies typically ignore the development of environmental patents, despite their value in reducing CO2 emissions. Only a significant handful of empirical research uses econometric tools to investigate how environmental patents affect CO2 emissions. The influence of technological development on reducing energy intensity has been researched and the role of environmental patents in eliminating carbon emissions has been investigated and found that patents are significant indicators of innovation and industrial transformation, which is consistent with the conclusion of an empirical study (Mendonça et al., 2004; Wurlod and Noailly, 2018). In a similar vein, this paper aims to assess the impact of patents on environmental pollution levels to fill in the voids in our knowledge of how patents in environmental technology might spur unique, sophisticated technology that minimizes CO2 emissions. Environmental pollution can be minimized by the use of environmentally friendly technologies. In many fields, including environmental protection, it is crucial to employ the most appropriate innovative deployment channel. It is important to invent new ideas and discover new methods for creating them. According to empirical research, innovation affects CO2 emissions through several channels. Innovation affects CO2 emissions through productivity gains. Patenting global inventions and innovations boosts technological innovation. Efficiency in resource use can accelerate technological progress. In order to reduce CO2 emissions, industries, organizations, and employees must adopt innovative technologies. Instead of developing carbon-reducing products and services, firms can duplicate a successful idea, industry, or corporation. Global concerns can slow environmental technology development. Patents on environmental innovation technology reveal its technical knowledge, which can be used to analyze its progress. To address global needs, new technologies must be developed and adopted. Patents show how far an invention has come, who invented it, and who wants to use it. This can help develop new technologies.
Research and development (R&D) spending is often applied as a surrogate for innovation in existing research that aims to capture its environmental consequences. Macro investigations have yielded contradictory findings (Churchill et al., 2018), and (Petrovi and Lobanov, 2020) discover contradictory findings for dissimilar spans and countries, whereas (Fernández Fernández et al., 2018) find that R&D expenses lead to reduce the level of environmental pollution. This study reveals that the CO2-lowering effect depends on country-specific factors (Acemoglu et al., 2012) and that this effect tends to recover over time, which stops long-run ecological eminence increase from green technological innovations (Braungardt et al., 2016; Sharif el al. 2022). The effect of environmentally friendly technologies on global emissions of CO2 is the subject of research. For green innovations to begin significantly lowering CO2 emissions, they must discover a critical income level at which to do so. Du et al. (2019) evaluated that the high costs of spreading new green technology make this a somewhat high-income threshold, especially for people who live in underdeveloped countries. This conclusion is corroborated by the research (Popp, 2012), which notes that organizations in undeveloped countries cannot afford the high start-up fixed costs associated with green technology discoveries. Carbon capture technologies have been studied and documented in recent times (Luis Mguez et al., 2018). Some analyses compare alternative and cleaner energy and ecological patents for carbon emissions reduction purposes (Cheng et al., 2018). A small number of studies suggest that CO2 emissions can stimulate green patent filings and R&D investment (Cho and Sohn, 2018).
When applied to the context of the EKC hypothesis, the literature fails to provide evidence of a connection between human development, technological innovation, renewable energy, and ecological footprint. This research aims to close that gap in the existing literature. Further, this link must be examined from the SDGs’ point of view, as E-7 countries are currently experiencing difficulties achieving the SDG targets, and the findings of this study may help close the policy-level gaps that now exist in E-7 countries. The study’s significance at this level of policymaking is contained therein.
3 Data description and econometric models
This study utilizes the data from the World Bank compiled by WDI, the UNDP, and the OECD environment database from 1995 to 2019 for the E-7 economies. This allows the authors to examine the influence of environmental patents, renewable energy, and human development on CO2 emissions. Table 1 reports a summary of the panel-selected variables that were used in this investigation. These variables were the amount of carbon dioxide released per person, the gross domestic product (Y), the human development index (HDI), renewable energy (RE), and technological progress in areas related to the environment (TECH). The mathematical expressions of the econometric function are presented in Eqss (1), (2) as follows:
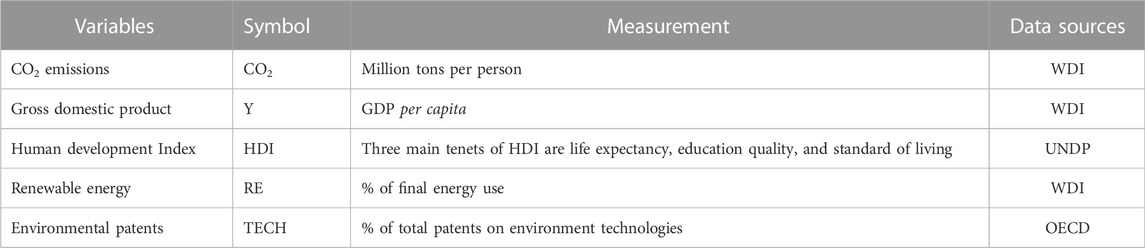
TABLE 1. Data variables and sources (1995–2019).
CO2 emission = f (Economic growth, Human development, Renewable energy, Technological innovations)
CO2 Emission = f [Economic Growth, Human Development, Renewable Energy, Technological Innovations (Renewable Energy Consumption* Technological Innovations)]
4 Econometric modelling strategy
4.1 Cross-sectional dependence tests
Five econometric steps estimate reliable and robust findings. First, this paper applies four cross-sectional dependence (CSD) approaches. The CSD is a major issue in longitudinal data analysis, causing issues with stationarity, long-run cointegration tests, and dimensional deformation. Panel data model disruptions are usually cross-sectionally independent when the number of observations (N) is large as compared to the time period (T). Breusch and Pagan, (1980), Pesaran, (2020) scaled LM; bias-corrected scaled LM, and (Pesaran, 2020) CSD are applied in the current research to test for cross-sectional dependency. Where, the null and alternative hypotheses can be tested by considering Eqs 3, 4 respectively.
CSD test proved by (Pesaran, 2020) developed a customized description, which is provided Eqs 5, 6:
Where the current research estimated the model using cross-sectional fixed effects for the E-7 nations, the biased corrected LM test statistic was also estimated. The LM test statistic is the most developed CD diagnostic proposed by Breusch and Pagan (1980) in null hypothesis in Eq. 7:
Where
However, another CSD test developed by Baltagi et al. (2012) provide a undemanding asymptotic bias alteration for the scaled LM approach
The
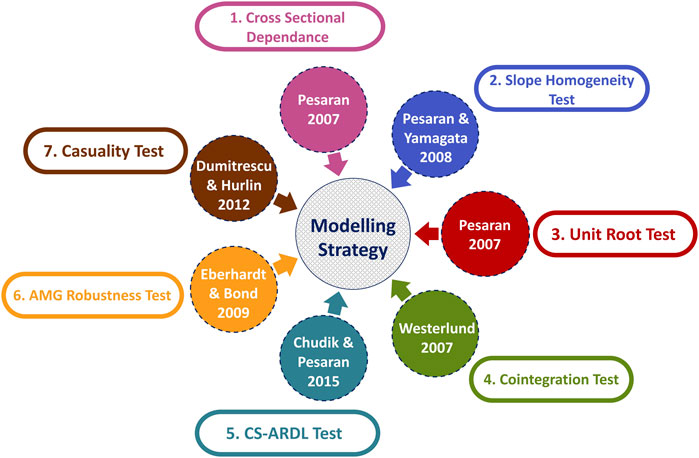
FIGURE 3. Econometric modelling strategy.
4.2 Slope homogeneity tests
The stability of panel estimators could be impacted by the non-existence or existence of slope homogeneity or heterogeneity in the underlying panel data. By default, conventional estimators assume that all models have the same slope. Therefore, the slope heterogeneity of the model needs to be investigated first, before moving on to the experimental approximation. Due to these considerations, the slope heterogeneity test created is applied in this study (Pesaran and Yamagata, 2008). The test mathematical expression of the delta tilde
4.3 Unit root tests
Traditional unit root tests assume model slope homogeneity and cross-section independence, which may lead to inaccurate results (Pesaran, 2007, 2020). The test tackles CSD and slope heterogeneity. CIPS and CADF applied in Eqs. 12, 13, 14:
4.4 Long-run cointegration test
This study examines the long-run Cointegration among the selected series in both functions using cointegration tests (Westerlund, 2007). Westerlund’s cointegration method is significant since it can be applied to slope heterogeneous models. The test also considers cross-section dependency. In Eq. 15, Eq. 16, Eq. 17, and Eq. 18, Westerlund’s test employs the different four statistics: two-group test statistics (Gt and Ga) and two panel statistics (Pt and Pa).
where,
4.5 Cross-section augmented autoregressive distributed lag test
In order to test the effect of technological innovation on carbon emissions in the context of control factors, because it takes into consideration the slope heterogeneity, CSD, and endogeneity concerns, this strategy is more effective than others (Chudik and Pesaran, 2013). Additionally, this approach produces reliable outcomes even when there are only a small number of economies available to serve as the sample, the CS-ARDL strategy is the one that we chose to implement as indicated in CS-ARDL Eq. 19:
Where
4.6 Augmented mean group robustness test
The cointegration correlation testing in the demonstration is a prelude to model estimation. The current paper employs the augmented mean group (AMG) test, proposed by (Eberhardt and Bond, 2009). The CSD, non-stationarity, endogeneity, and slope heterogeneity are all features of longitudinal data that the AMG technique can help remedy. The first and second stage AMG implication, expressed by Eq. (21) and Eq. 22) as:
4.7 Panel causality test
Stepping back and trying to figure out which variable caused the other is the econometric procedure’s end objective. A panel causality test developed by Dumitrescu and Hurlin (2012) was used to arrive at this conclusion. In order to present a test for the causality hypothesis (Dumitrescu and Hurlin, 2012), modified the causality test proposed by (Granger, 1969), as shown in Eq. 22.
Wald statistics provides a reliable way of analysis. Eq. 24 presents Wald statistics:
The z-test test statistic provided in Eq. 25 proposed by (Dumitrescu and Hurlin, 2012) for large time (T) instead of cross-sections (N):
5 Results and discussion
5.1 Descriptive and correlation matrix information
Table 2 describes the findings of descriptive and correlation matrix information. In the first strand of Table 2, the authors calculate the average, lowest, highest, standard deviation, skewness, kurtosis, and their respective probabilities distribution values. The average values of selected time series like CO2, Y, HDI, RE, and TECH are 2.9587, 11.8273, 0.7954, 1.0351, and 1.1132 respectively. The standard deviations for CO2, Y, HDI, RE, and TECH are impressive as 0.5987, 1.7554, 0.1067, 1.0277, and 1.0102 respectively. The selected variables such as Y, HDI, RE, and TECH all have a strong correlation with CO2 emissions. However, HDI, RE, and TECH are negatively linked whereas Y is found to have a positive linear association with CO2 emissions. The correlation matrix of the variables demonstrates the positive correlation in between income and CO2 emissions but negative correlation with human development index, renewable energy and technological innovation. We also investigate the degree of multicollinearity that exists between the variables, and the VIF coefficients indicate that this does not pose a challenge to the estimate process.

TABLE 2. Descriptive statistics and pairwise correlation matrix.
5.2 Findings of cross-sectional dependence tests
In study utilized CSD tests to look at the possibility of CSD. Table 3 contains the results of the four CSD tests. Statistically significant p-values in the outcomes of the cross-sectional CSD tests indicate the presence of the CSD. Accordingly, it is necessary to move on to creating a stationarity test of the second generation that can address the CSD problem.
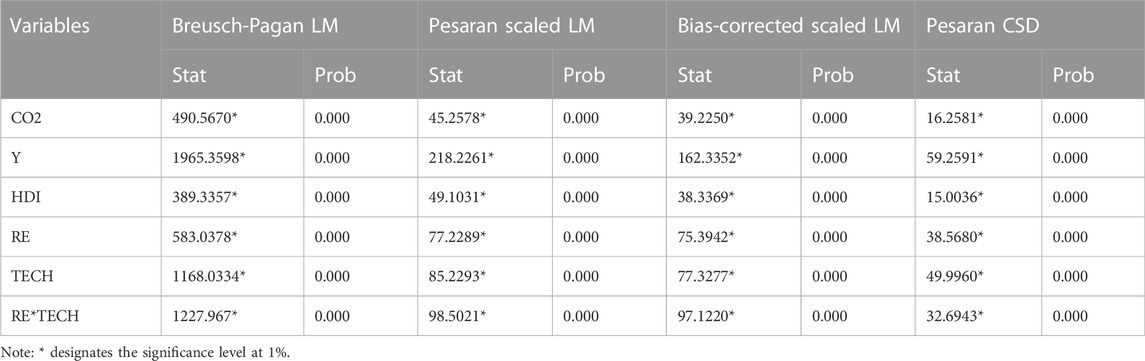
TABLE 3. CSD test results.
5.3 Findings of slope homogeneity test
The Pesaran and Yamagata (2008) method is useful for examining the scatter in slope coefficients. Slope heterogeneity testing explores that both functions are suffering from this issue. The massive delta and the adjusted delta amount both make this very evident. Slope heterogeneity is demonstrated in both models 1 and 2 as indicated in Table 4:
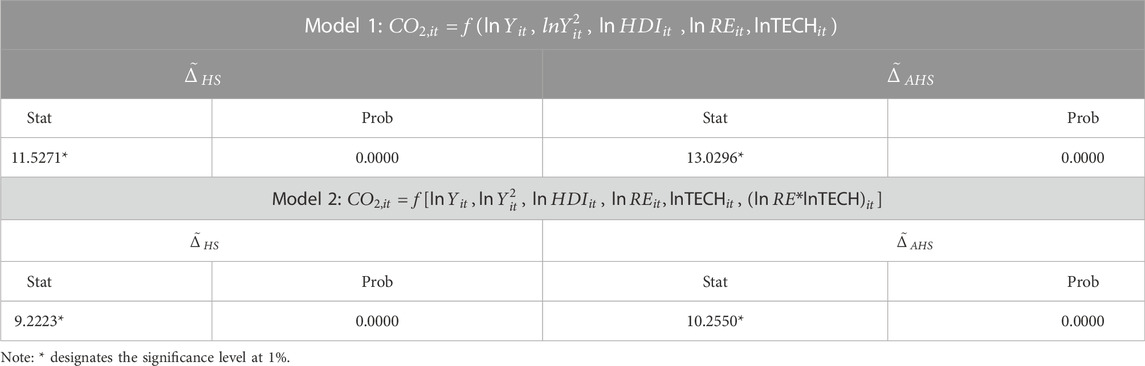
TABLE 4. Slope-homogeneity test results.
5.4 Findings of panel unit root test
This research employs a CIPS unit root test of the second generation to handle the panel data difficulties brought on by the CSD and slope variability. The alternative hypothesis is valid at their first integration order such as I (1), as shown by the results of the CIPS unit root test, which show that all variables having no unit root at that level. Mean and standard deviation values for both models are shown to fluctuate over time in Table 5.
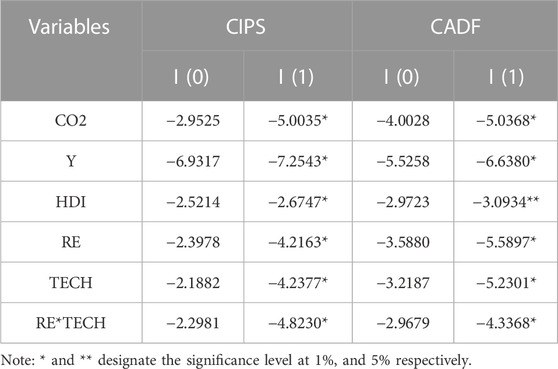
TABLE 5. Unit root test results.
5.5 Findings of panel long-run cointegration test
Based on the evidence of the cointegration test reported in Table 6, there seems to be a connection that lasts over a longer period of time between the variables in models 1 and 2. This is valid, as demonstrated by the group and panel statistics compiled by Westerlund. Since these tests are meant to handle cross-sectional dependency in a panel investigation, their use has been extensively reported in the scholarly literature (Chudik et al., 2016; Baloch et al., 2021; Nathaniel et al., 2021).
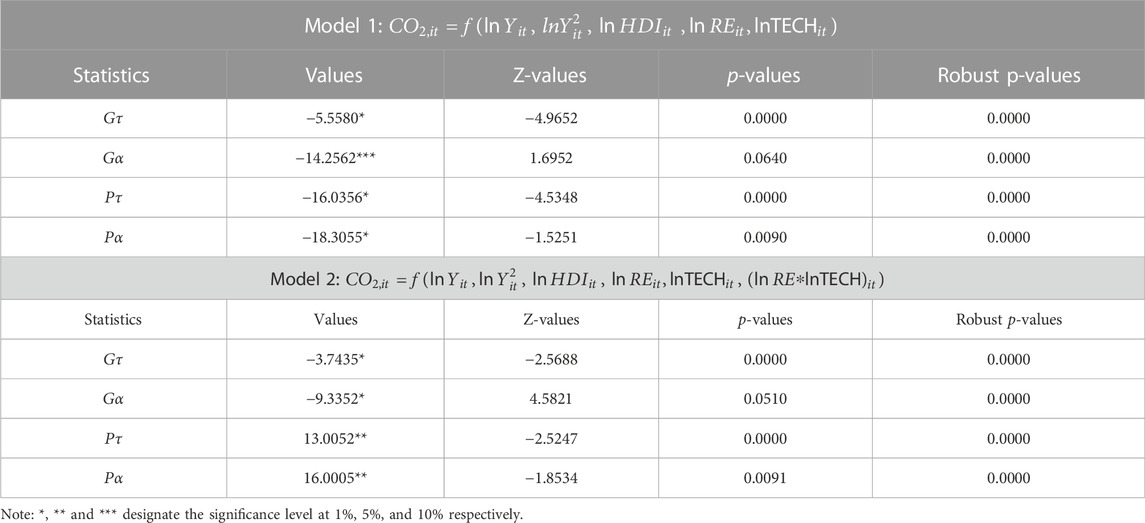
TABLE 6. Cointegration test results.
5.6 CS-ARDL test results
This research makes use of the CS-ARDL methodology to investigate how eco-friendly technological innovation affects carbon emissions when certain variables are held constant. Table 7 displays the outcomes of applying the CS-ARDL method. It is not surprising that the Y, Y2, HDI, REN, and TECH of the E-7 economies all play significant functions in formative planet health. With the exception of GDP, every other variable has an adverse influence on the pollution levels in the region. The negative value of the ECM coefficient provides support for the hypothesis that there is a long-run link between the candidate time series variables. It is encouraging to see the E-7 countries working to lessen their pollution levels. However, the E-7 countries collectively contribute a lot more CO2 to the atmosphere than the rest of the world combined. The E-7 countries’ carbon footprints might be significantly reduced if they adopted a renewable energy policy and technological innovation. Similar findings are found (Mehmood, 2022) regarding the importance of increasing the HDI, and the share of energy that comes from alternative and renewable energy sources, in South Asian nations in order to reduce pollution, and (Umar et al., 2020) agree that technological advancements have helped lower pollution rates by increasing the use of greener, more energy-efficient methods. Further evidence that human capital can reduce an organization’s CO2 emission is provided by Huang et al. (2022) and Usman and Radulescu. (2022).
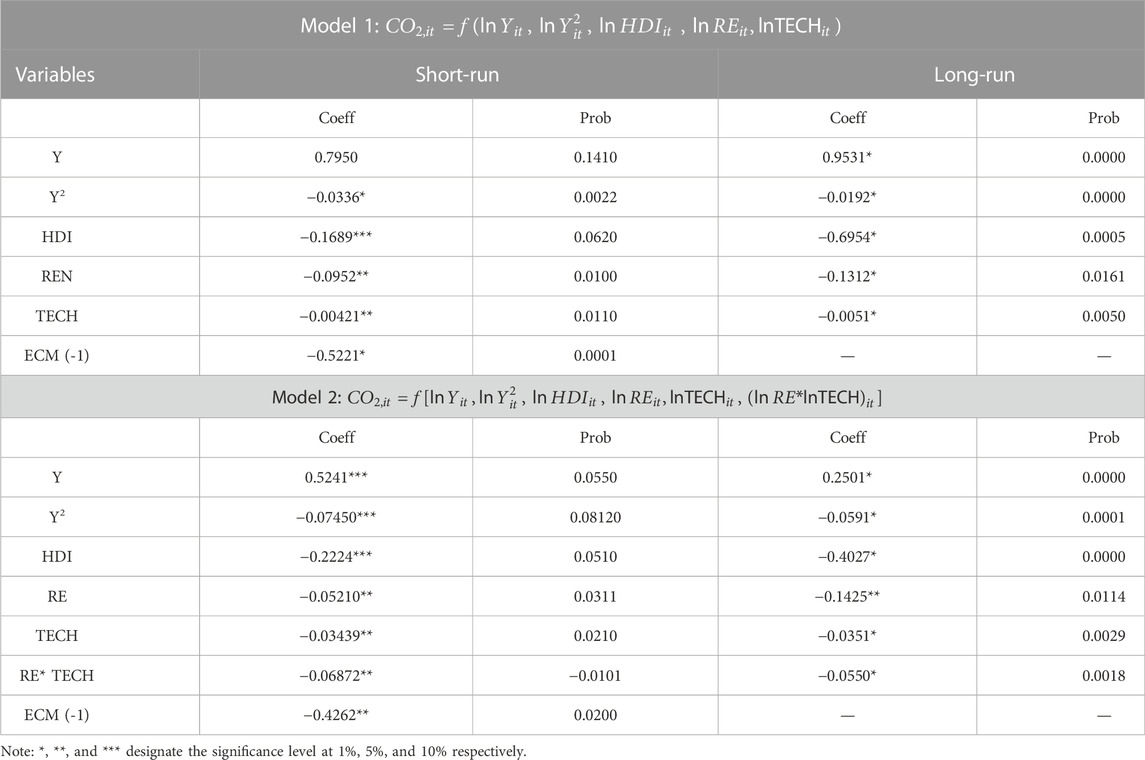
TABLE 7. Findings of CS-ARDL test.
The positive and adverse signs of the coefficient for Y and Y2 relative to CO2 emissions articulate the impression of the EKC hypothesis. More precisely, when real income rises by 1%, carbon emissions will lead to a boost of 0.9531% in the long run, alternatively, a 1% augmentation in Y2 reduces the pollution level by 0.0192% in the region. These associations recommend that in initial phases, high/lofted real income growth in E-7 economies will boost the pollution level to a threshold point (in this case it is 0.9531%) however after reaching this point, carbon emissions levels will initiate reducing with the more enhancement in income growth. This empirical outcome carries the EKC relationship in the E-7 economies. The primary reason behind this phenomenon is that in starting phase of income growth, economies are first and foremost anxious about their economic development, and the candidate economies overlook the environmental consequences, spotlighting the enhancement of their trade pattern with other economies and communications expansion in the course of financial development, and globalization. Overall investment level augments and per capita income increases, consequently, the demand for primary energy boosts and ecological damages rises. Ultimately, the increase in economic growth levels carries environmental, economic, and social consciousness that assists to decrease ecological contamination (Huang et al., 2022). At this phase, countries are additionally increased when more foreign investment inflows, with the least harm to the atmosphere. This EKC influence develops due to the large-scale productivity with superior technologies and demand for ecological eminence from the populace. This study’s outcomes are in line with those of Gyamfi et al. (2022), Nosheen et al. (2021), Dogan and Turkekul, (2016), Balsalobre-Lorente et al. (2022).
The econometric estimated results declare with confirmation that a superior level of human development is painstaking to be vital in mitigating carbon emissions in the region. Particularly, for each percentage augment in human development level, there is descending environmental contamination by 0.6954% and 0.1689% in the long- and short-run respectively. The analogous proposition is provided by Huang et al. (2022) and Hao et al. (2021). This defends the squabble that humanizing the human development eminence with facilitates education and related other ventures could enhance society’s awareness towards the utilization of modern and new technologies and power resources that have an inferior ecological collision. As a result, such innovations can significantly assist in curbing environmental deficits. Several earlier articles have justified the negative effect of human development on environmental pollution (Huang et al., 2022, Zhongwei and Liu, (2022), Saqib et al. (2022). Moreover, under the umbrella of both short-run and long-run findings, the influence of human development on CO2 emission is established towards mitigating pollution levels and also it deals with many sustainability problems. In this pursuit, Sarkodie et al. (2020) observed that the enhancement in human development figures is favorable in commencing with ecological contamination and acceleration of the overall emissions, particularly in the context of E-7 economies.
Renewable energy has an adverse effect on carbon emissions in the E-7 countries. By inference, alternative and renewable energy sources can play a significant role in achieving the carbon neutrality arrangement in these economies. For that reason, cleaner energy utilization has a lot of potentials to diminish carbon emissions in these countries. This finding is usually accurate transversely to all the stipulations, both for the long-run and short-run. Following the newly developed studies developed by Gyamfi et al. (2022) and Usman and Radulescu (2022), who had analogous results for the E-7 and top nuclear energy-producing countries, increase and investment in the proportion of alternative energy use will assist to reduce the environmental consequences and, in sequence, protect environmental quality in the mounting efforts in the block.
Finally, this study analyzes how renewable energy and technological advancement (RE*TECH) in model 2 mitigate the impact on CO2 emissions. It can be observed in Table 7, when (RE*TECH) increased, CO2 emissions diminished. Indeed, data showed that RE and TECH interacted in a substantial manner. At the 5% significance level, this interaction shows that the E-7 economies can expect a large reduction in carbon pressure from the mixture of renewable energy and technological innovation. Dahmani et al. (2022) came to similar conclusions on how technological innovation and the use of renewable energy sources can be seen as major factors in achieving better standards of environmental sustainability.
5.7 Robustness analysis results
The CS-ARDL method robustness was also evaluated using the AMG method. The AMG and CS-ARDL long-term estimates have identical signals. With these exceptions, the dimensions are virtually comparable. When comparing the CS-ARDL technique to the AMG method, the magnitude of the coefficients in the CS-ARDL approach is larger. Zhongwei and Liu (2022) also used the CS-ARDL method to determine the association between variables in the short run and the long run, and they used the AMG method to determine the robustness of their findings.
The econometric findings of the AMG technique suggest that a wide range of factors may impact CO2 emissions in the E-7 economies. Reliable and consistent with the results from the CS-ARDL method, Table 8 demonstrates that all variables except of Y have an adverse effect on pollution levels. The other variables like Y2, HDI, RE, and TECH are all shown to have a substantial impact on shifts in CO2 emissions by the causality test. Invention, alternative energy sources, and human development can all benefit greatly from improved environmental conditions and the outcomes confirm the study (Tran et al., 2019; Gyamfi et al., 2021b). AMG Robustness test results for the study in Table 8, while interpreted graphical schema presentation of the overall empirical findings, relied on the applied econometric results are reported in Figure 4 accordingly.
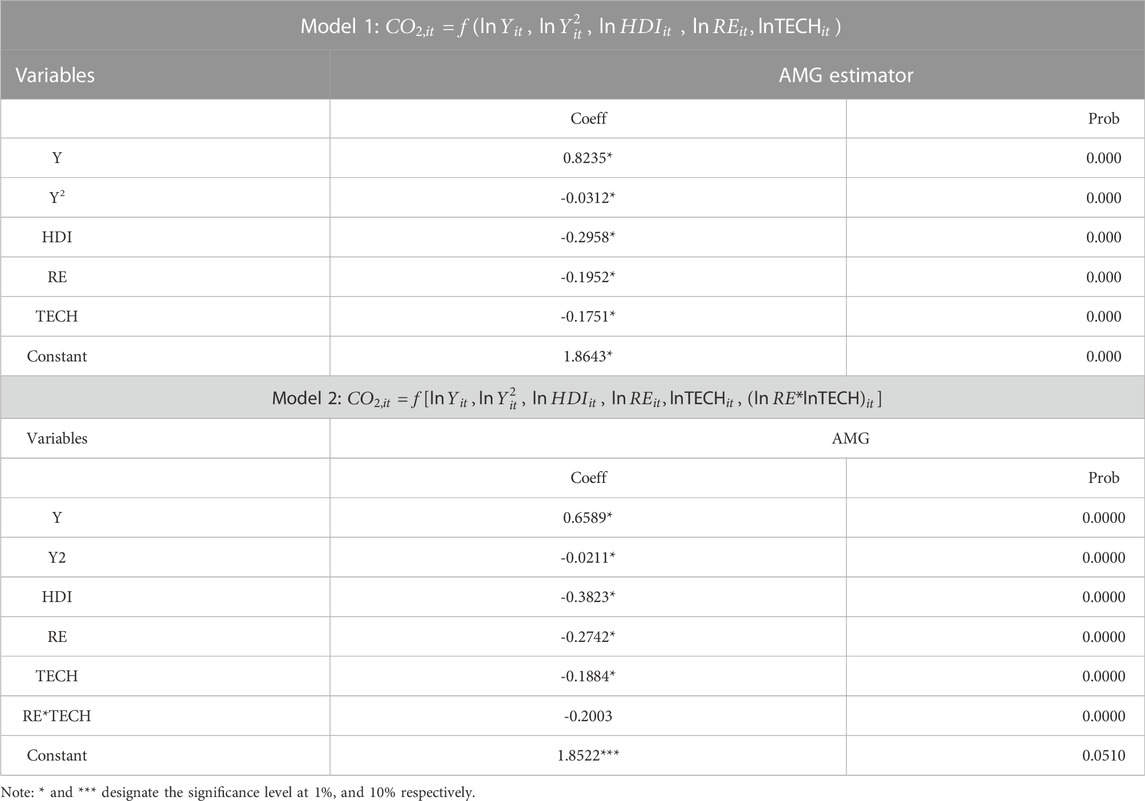
TABLE 8. AMG test results.
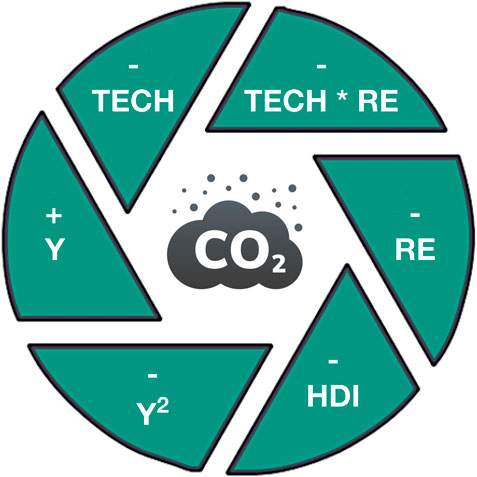
FIGURE 4. AMG-based empirical scheme.
5.8 Panel causality test results
Table 9 presents the Granger causality outcomes of this paper. In this regard, to account for the fact that the panel estimators used in the study may produce estimates that may not accurately imitate the causality direction between the selected panel series, the authors present causality test results for the variables in the present study (Onifade et al., 2020). The D–H causality approach is reliable and robust adjacent to CSD applied to establish the causal association between technological development, income growth, human development, renewable energy, and carbon emissions. The findings of the D–H causality approach shown in Table 9 discover that two-way causality presents between human development, renewable energy, and technological innovations with CO2 emissions, while one-way causality is observed from income growth to carbon emissions, human development, renewable energy, and technological innovations. The causality tests findings explore that a two-way causality link between the renewable energy use and technological innovation with carbon emission. This implies that these indicators cause the carbon emission. These results are in line with the previous literature proposed by Raza et al. (2015), and Usman and Radulescu (2022). All declared causality findings have policy suggestions as technological innovations are seen to encourage the protection of environmental sustainability without hindering the pace of economic growth trajectory. This relationship (between CO2 emission and GDP growth) is evidenced by (Apergis and Payne 2015; Dogan and Turkekul 2016). This theory is supported by the literature, and it is crucial to highlight the fact that renewable energy and technological innovations are increasing ecological integrity in E-7 economies (Kasman and Duman 2015; Jiang at. el., 2022). Even though such findings have many ecological implications, as vigilance is recommended for the G-7 policymakers and their respective government officials, there is require to coast from non-renewable intensive energy blends to cleaner and alternatives that are presumed to be greener and eco-friendly.
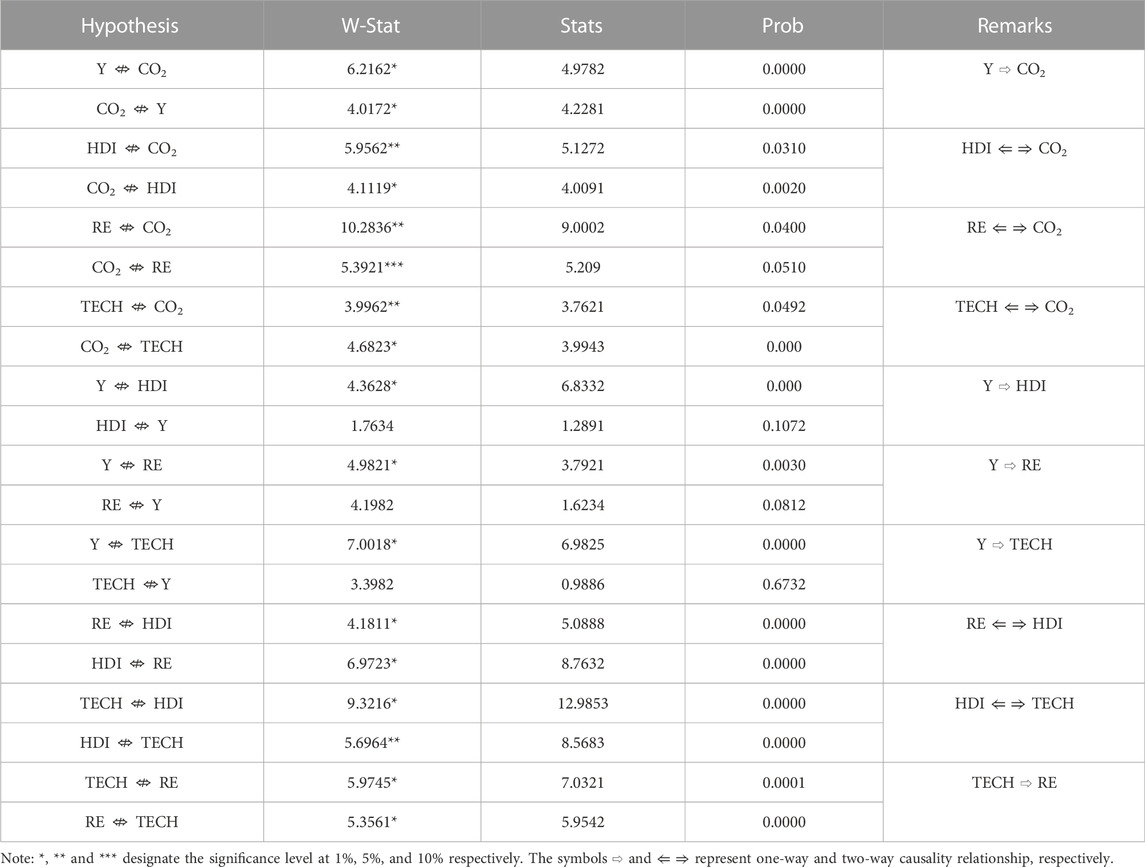
TABLE 9. Findings of D-H causality test.
6 Conclusion and policy options
6.1 Conclusion
This paper investigates the impact of renewables and technology innovation in the EKC framework for E-7 nations spanning from 1995 to 2019 from the perspective of the SDG 13 campaigns to mitigate the influence of climate change. This paper applies a battery of second-generation modeling estimators that tackle the issue of CSD and heterogeneity in order to produce credible empirical results. This research employs the CS-ARDL method, as well as the AMG method, and the D-H causality test. The level of environmental degradation in E-7 economies is explained by a number of interrelated factors, and a Westerlund long-run relationship test validates the existence of a long-run link between these factors. The findings from this study provide further evidence of the EKC phenomena in E-7 economies. This finding is consistent with the group’s understanding of emerging and industrialized nations as places where economic activities are carried out without regard to a sustainable environmental. Economic growth appears to be prioritized in comparison to environmental quality in this bloc. The empirical findings also showed that renewables and technological advancements enhance environmental quality. This suggests that within the tide of global and economic interconnectedness, a consciousness of environmental issues is making its way into the blocs. We must make a concerted effort to switch to renewable energy sources like biomass, hydro and solar power because of their proven environmental benefits.
6.2 Policy recommendations
Furthermore, the results of this study provided additional sustain for the importance of implementing the recommended policies. The recommendation for action comprises the following:
The EKC proposition in E-7 economies needs to diminish pollution levels on its course for boosts real income growth levels in the region. The benefits of a cleaner environment make it imperative that we make the switch to renewable energy sources. Therefore, all people concerned, including public officials, should work toward a new paradigm of clean energy technology by shifting the bloc’s energy balance away from conventional energy sources like fossil fuels. Tree-planting initiatives, for example, can help lessen the impact of deforestation and are one way in which the blocs might work to prevent environmental degradation. The results acquired in this paper are in line with predictable findings. Comparable to this research, the empirical outcomes of various research papers explore that technological innovation significantly diminishes energy deployment and the level of environmental pollution level by saving energy.
Increasing R&D expenses and supporting scientific investigation in E-7 economies contribute to the expansion of new and modern technologies and the perfection of accessible technologies. In this pursuit, technological advancement also enhances production levels and diminishes environmental deficit influences on real GDP growth. The installment of technological progress at the sectoral level (i.e., agriculture, services, and industrial) offers the prospect to get hold of higher productivity with less ecological cost employing the identical input. Furthermore, the deployment of energy-saving modern technology commonalities at all phases of each sector’s life cycle resources a lessening in total pollution level. The support for the adoption of environmental legislation and the impediments that prevent patents from being completely utilized in the related industries should be decomposed by environmental regulations that the E-7 economies should adopt. The E-7 economies should also implement various policies to spur the development of environmental patents and promote their dissemination. Moreover, the government of these economies should also redesign strategies to enhance the proportion of renewable and alternative energy deployment in the total energy mix, progressively reinstating fossil fuel energy sources with alternative and renewable/cleaner energy sources. The central authorities of E-7 economies should reduce the utilization of fossil fuels and non-renewable power sources and search to develop the impending of cleaner and alternative power sources. Developing responsiveness and awareness of these alternative power sources, supporting the deployment of renewable energy, escalating investment levels in the cleaner and alternative power sector, and exempting the preliminary tax for renewable energy schemes should be put into practice.
As a future line of inquiry, this study examined the EKC phenomenon’s applicability for E-7 economies; other scholars can broaden the EKC argument by taking into account covariates like population and urbanization in an asymmetric frame-work for other blocs like G-20, ASEAN, BRICS, and others. Moreover, this research can be comprehensively extended by examining the influences of financial development, population, green growth, and some other technological, and socio-economic determining of resources management and environmental sustainability on dissimilar proxies of environmental pollution. In addition, a country and sector-wise analysis can also be performed for redesigning specific policy-making objectives. Besides, the indirect influences of technological development on carbon emissions in the E-7 economies can be investigated within the model.
Data availability statement
Publicly available datasets were analyzed in this study. This data can be found here: https://www.databank.worldbank.org/indicator/NY.GDP.PCAP.CD/1ff4a498/PopularIndicators. Accessed date: (02 September 2022).
Author contributions
NS: conceptualization, software, methodology, interpreted results, and writing-original draft preparation. MU: conceptualization, formal analysis, validation, project administration. MR: abstract, supervision, conclusion, and review and editing. CS: literature review, review, and editing; CS: introduction, visualization, and review and editing CT: results improvement, data curation, review, and editing.
Conflict of interest
The authors declare that the research was conducted in the absence of any commercial or financial relationships that could be construed as a potential conflict of interest.
Publisher’s note
All claims expressed in this article are solely those of the authors and do not necessarily represent those of their affiliated organizations, or those of the publisher, the editors and the reviewers. Any product that may be evaluated in this article, or claim that may be made by its manufacturer, is not guaranteed or endorsed by the publisher.
Abbreviations
AMG, Augmented Mean Group; CO2, CO2 Emissions; CS-ARDL, Cross-sectional augmented autoregressive distributive lag; CSD, Cross-sectional dependency; E-7, Brazil, China, India, Indonesia, Russia, Mexico and Turkey; ECM, Error Correction Model; EKC, environmental Kuznets curve; G-7, Canada, France, Germany, Italy, Japan, United Kingdom, and United States; GDP, Economic growth; GMM, generalized method of moments; HDI, Human Development Index; OECD, The Organization for Economic Cooperation and Development; PHDI, Planetary Pressures-adjusted Human Development Index; R&D, Research and Development; RE, Renewable energy; SDGs, Sustainable Development Goals; TECH, Environmental Technologies; UNDP, United Nation Development Program; Y, GDP per capita.
References
Acemoglu, D., Gancia, G., and Zilibotti, F. (2012). Competing engines of growth: Innovation and standardization. J. Econ. Theory 147 (2), 570–601. doi:10.1016/J.JET.2010.09.001
Adebayo, T. S., Bekun, F. V., Rjoub, H., Agboola, M. O., Agyekum, E. B., and Gyamfi, B. A. (2022). Asymmetric effect of structural change and renewable energy consumption on carbon emissions: Designing an SDG framework for Turkey. Environ. Dev. Sustain., 1–29. doi:10.1007/s10668-021-02065-w
Ali, H. S., Law, S. H., Lin, W. L., Yusop, Z., Chin, L., and Bare, U. A. A. (2018). Financial development and carbon dioxide emissions in Nigeria: Evidence from the ARDL bounds approach. GeoJournal 84 (33), 641–655. doi:10.1007/S10708-018-9880-5
Ali Talib, D. M. N., Hashmi, S. H., Aamir, M., and Khan, M. A. (2022). Testing non-linear effect of urbanization on environmental degradation: Cross-country evidence. Front. Environ. Sci. 1361. doi:10.3389/fenvs.2022.971394
Apergis, N., and Payne, J. E. (2015). Renewable energy, output, carbon dioxide emissions, and oil prices: Evidence from South America. Energy Sources, Part B Econ. Plan. Policy 10 (3), 281–287. doi:10.1080/15567249.2013.853713
Baloch, M. A., Ozturk, I., Bekun, F. V., and Khan, D. (2021). Modeling the dynamic linkage between financial development, energy innovation, and environmental quality: Does globalization matter? Bus. Strategy Environ. 30 (1), 176–184. doi:10.1002/BSE.2615
Balsalobre-Lorente, D., Ibáñez-Luzón, L., Usman, M., and Shahbaz, M. (2022). The environmental Kuznets curve, based on the economic complexity, and the pollution haven hypothesis in PIIGS countries. Renew. Energy 185, 1441–1455. doi:10.1016/j.renene.2021.10.059
Baltagi, B. H., Feng, Q., and Kao, C. (2012). A Lagrange Multiplier test for cross-sectional dependence in a fixed effects panel data model. J. Econ. 170 (1), 164–177. doi:10.1016/J.JECONOM.2012.04.004
Barro, R. J., and Lee, J. W. (2001). International data on educational attainment: Updates and implications. Oxf. Econ. Pap. 53 (3), 541–563. doi:10.1093/OEP/53.3.541
Becker, G., and Posner, R. (2005). Nuclear power: Has its time come (Again)?. Available at: https://www.becker-posner-blog.com/2005/05/nuclear-power-has-its-time-come-again-becker.html.
Bedir, S., and Yilmaz, V. M. (2015). CO2 emissions and human development in OECD countries: Granger causality analysis with a panel data approach. Eurasian Econ. Rev. 6 (11), 97–110. doi:10.1007/S40822-015-0037-2
Braungardt, S., Elsland, R., and Eichhammer, W. (2016). The environmental impact of eco-innovations: The case of EU residential electricity use. Environ. Econ. Policy Stud. 18 (2), 213–228. doi:10.1007/S10018-015-0129-Y
Breusch, T. S., and Pagan, A. R. (1980). The Lagrange multiplier test and its applications to model specification in econometrics. Rev. Econ. Stud. 47 (1), 239–253. doi:10.2307/2297111
Cheng, C., Ren, X., Wang, Z., and Shi, Y. (2018). The impacts of non-fossil energy, economic growth, energy consumption, and oil price on carbon intensity: Evidence from a panel quantile regression analysis of EU 28. Sustainability 10 (11), 4067. doi:10.3390/SU10114067
Cheng, C., Ren, X., Wang, Z., and Yan, C. (2019). Heterogeneous impacts of renewable energy and environmental patents on CO2 emission - evidence from the BRIICS. Sci. Total Environ. 668, 1328–1338. doi:10.1016/J.SCITOTENV.2019.02.063
Cho, J. H., and Sohn, S. Y. (2018). A novel decomposition analysis of green patent applications for the evaluation of R&D efforts to reduce CO2 emissions from fossil fuel energy consumption. J. Clean. Prod. 193, 290–299. doi:10.1016/J.JCLEPRO.2018.05.060
Chudik, A., Mohaddes, K., Pesaran, M. H., and Raissi, M. (2016). Long-run effects in large heterogeneous panel data models with cross-sectionally correlated errors. Adv. Econ. 36, 85–135. doi:10.1108/S0731-905320160000036013
Chudik, A., and Pesaran, M. H. (2013). Large panel data models with cross-sectional dependence: A survey.Oxford Acadamic Cypress, CA, USA
Churchill, S. A., Inekwe, J., Ivanovski, K., and Smyth, R. (2018). The environmental Kuznets curve in the OECD: 1870–2014. Energy Econ. 75, 389–399. doi:10.1016/J.ENECO.2018.09.004
Dahmani, M., Mabrouki, M., and Ben Youssef, A. (2022). The ICT, financial development, energy consumption and economic growth nexus in MENA countries: Dynamic panel CS-ardl evidence. Appl. Econ., 1–15. doi:10.1080/00036846.2022.2096861
Dinda, S., and Coondoo, D. (2006). Income and emission: A panel data-based cointegration analysis. Ecol. Econ. 57 (2), 167–181. doi:10.1016/J.ECOLECON.2005.03.028
Dinda, S. (2004). Environmental Kuznets curve hypothesis: A survey. Ecol. Econ. 49 (4), 431–455. doi:10.1016/j.ecolecon.2004.02.011
Dogan, E., and Turkekul, B. (2016). CO2 emissions, real output, energy consumption, trade, urbanization and financial development: Testing the EKC hypothesis for the USA. Environ. Sci. Pollut. Res. 23 (2), 1203–1213. doi:10.1007/s11356-015-5323-8
Dong, K., Sun, R., Li, H., and Liao, H. (2018). Does natural gas consumption mitigate CO2 emissions: Testing the environmental Kuznets curve hypothesis for 14 asia-pacific countries. Renew. Sustain. Energy Rev. 94, 419–429. doi:10.1016/j.rser.2018.06.026
Doytch, N., and Ashraf, A. (2021). The ecological footprints of greenfield FDI and cross-border M&A sales. Environ. Model. Assess. (Dordr). 27, 935–951. doi:10.1007/S10666-021-09777-3
Doytch, N., and Uctum, M. (2016). Globalization and the environmental impact of sectoral FDI. Econ. Syst. 40 (4), 582–594. doi:10.1016/J.ECOSYS.2016.02.005
Du, K., Li, P., and Yan, Z. (2019). Do green technology innovations contribute to carbon dioxide emission reduction? Empirical evidence from patent data. Technol. Forecast. Soc. Change 146, 297–303. doi:10.1016/J.TECHFORE.2019.06.010
Dumitrescu, E. I., and Hurlin, C. (2012). Testing for Granger non-causality in heterogeneous panels. Econ. Model. 29 (4), 1450–1460. doi:10.1016/J.ECONMOD.2012.02.014
Eberhardt, M., and Bond, S. (2009). Cross-section dependence in nonstationary panel models: A novel estimator. University Library of Munich, Munich Germany
Ehrlich, P. R., and Holdren, J. P. (1971). Impact of population growth. Science 171 (3977), 1212–1217. doi:10.1126/SCIENCE.171.3977.1212
Fernández Fernández, Y., Fernández López, M. A., and Olmedillas Blanco, B. (2018). Innovation for sustainability: The impact of R&D spending on CO2 emissions. J. Clean. Prod. 172, 3459–3467. doi:10.1016/J.JCLEPRO.2017.11.001
Granger, C. W. J. (1969). Investigating causal relations by econometric models and cross-spectral methods. Econometrica 37 (3), 424. doi:10.2307/1912791
Gyamfi, B. A., Adedoyin, F. F., Bein, M. A., Bekun, F. V., and Agozie, D. Q. (2021b). The anthropogenic consequences of energy consumption in E7 economies: Juxtaposing roles of renewable, coal, nuclear, oil and gas energy: Evidence from panel quantile method. J. Clean. Prod. 295, 126373. doi:10.1016/J.JCLEPRO.2021.126373
Gyamfi, B. A., Adedoyin, F. F., Bein, M. A., and Bekun, F. V. (2021a). Environmental implications of N-shaped environmental Kuznets curve for E7 countries. Environ. Sci. Pollut. Res. 28 (25), 33072–33082. doi:10.1007/s11356-021-12967-x
Gyamfi, B. A., Bein, M. A., Udemba, E. N., and Bekun, F. V. (2022). Renewable energy, economic globalization and foreign direct investment linkage for sustainable development in the E7 economies: Revisiting the pollution haven hypothesis. Int. Soc. Sci. J. 72 (243), 91–110. doi:10.1111/issj.12301
Hagedoorn, J., and Cloodt, M. (2003). Measuring innovative performance: Is there an advantage in using multiple indicators? Res. Policy 32 (8), 1365–1379. doi:10.1016/S0048-7333(02)00137-3
Hao, L. N., Umar, M., Khan, Z., and Ali, W. (2021). Green growth and low carbon emission in G7 countries: How critical the network of environmental taxes, renewable energy and human capital is? Sci. Total Environ. 752, 141853. doi:10.1016/j.scitotenv.2020.141853
Hao, Y., and Wei, Y. M. (2015). When does the turning point in China’s CO2 emissions occur? Results based on the green solow model. Environ. Dev. Econ. 20 (6), 723–745. doi:10.1017/S1355770X15000017
Hashem Pesaran, M., and Yamagata, T. (2008). Testing slope homogeneity in large panels. J. Econ. 142 (1), 50–93. doi:10.1016/J.JECONOM.2007.05.010
Hashmi, S. H., Fan, H., Habib, Y., and Riaz, A. (2021). Non-linear relationship between urbanization paths and CO2 emissions: A case of South, south-east and east asian economies. Urban Clim. 37, 100814. doi:10.1016/j.uclim.2021.100814
Hawksworth, J., and Cookson, G. (2006). The world in 2050. How big will the major emerging market economies get and how can the OECD compete. PricewaterhouseCoopers. Chennai, Tamil Nadu
Holtz-Eakin, D., and Selden, T. M. (1995). Stoking the fires? CO2 emissions and economic growth. J. Public Econ. 57 (1), 85–101. doi:10.1016/0047-2727(94)01449-X
Hossain, M. A., and Chen, S. (2022). The decoupling study of agricultural energy-driven CO2 emissions from agricultural sector development. Int. J. Environ. Sci. Technol. (Tehran). 19 (5), 4509–4524. doi:10.1007/S13762-021-03346-7
Huang, Y., Haseeb, M., Usman, M., and Ozturk, I. (2022). Dynamic association between ICT, renewable energy, economic complexity and ecological footprint: Is there any difference between E-7 (developing) and G-7 (developed) countries? Technol. Soc. 68, 101853. doi:10.1016/j.techsoc.2021.101853
IEA (2018). World energy outlook 2018. IEA. Paris, France Retrieved from https://www.iea.org/reports/world-energy-outlook-2018.
IPPC (2007). The physical science basis. Contribution of working group I to the fourth assessment report of the intergovernmental Panel on climate change (IPCC). Cambridge University, Cambridge, UK 996.
Jiang, Q., Rahman, Z. U., Zhang, X., and Islam, M. S. (2022). An assessment of the effect of green innovation, income, and energy use on consumption-based CO2 emissions: Empirical evidence from emerging nations BRICS. J. Clean. Prod. 365, 132636. doi:10.1016/j.jclepro.2022.132636
Kasman, A., and Duman, Y. S. (2015). CO2 emissions, economic growth, energy consumption, trade and urbanization in new EU member and candidate countries: A panel data analysis. Econ. Model. 44, 97–103. doi:10.1016/j.econmod.2014.10.022
Kirikkaleli, D., and Sowah, J. K. (2020). A wavelet coherence analysis: Nexus between urbanization and environmental sustainability. Environ. Sci. Pollut. Res. 27 (242724), 30295–30305. doi:10.1007/S11356-020-09305-Y
Luis Míguez, J., Porteiro, J., Pérez-Orozco, R., Patiño, D., and Rodríguez, S. (2018). Evolution of CO2 capture technology between 2007 and 2017 through the study of patent activity. Appl. Energy 211, 1282–1296. doi:10.1016/J.APENERGY.2017.11.107
Martínez, D. M., and Ebenhack, B. W. (2008). Understanding the role of energy consumption in human development through the use of saturation phenomena. Energy Policy 36 (4), 1430–1435. doi:10.1016/J.ENPOL.2007.12.016
Mehmood, U. (2022). Investigating the linkages of female employer, education expenditures, renewable energy, and CO2 emissions: Application of CS-ardl. Environ. Sci. Pollut. Res. 29, 61277–61282. doi:10.1007/s11356-022-20275-1
Mendonça, S., Pereira, T. S., and Godinho, M. M. (2004). Trademarks as an indicator of innovation and industrial change. Res. policy 33 (9), 1385–1404. doi:10.1016/j.respol.2004.09.005
Menyah, K., and Wolde-Rufael, Y. (2010). CO2 emissions, nuclear energy, renewable energy and economic growth in the US. Energy Policy 38 (6), 2911–2915. doi:10.1016/J.ENPOL.2010.01.024
Nathaniel, S. P., Nwulu, N., and Bekun, F. (2021). Natural resource, globalization, urbanization, human capital, and environmental degradation in Latin American and Caribbean countries. Environ. Sci. Pollut. Res. 28 (5), 6207–6221. doi:10.1007/S11356-020-10850-9
Nosheen, F., Kouser, R., Anjum, S., and Akhter, M. J. (2021). Control of carbon emissions by promoting economic growth and renewable energy in newly emerging economic block. Rev. Educ. Adm. LAW 4 (2), 409–420. doi:10.47067/real.v4i2.153
Onifade, S. T., Çevik, S., Erdoğan, S., Asongu, S., and Bekun, F. V. (2020). An empirical retrospect of the impacts of government expenditures on economic growth: New evidence from the Nigerian economy. J. Econ. Struct. 9 (1), 6. doi:10.1186/S40008-020-0186-7
Ouedraogo, N. S. (2013). Energy consumption and human development: Evidence from a panel cointegration and error correction model. Energy 63, 28–41. doi:10.1016/J.ENERGY.2013.09.067
Pan, J. (2002). A conceptual framework for understanding human development potential—with empirical analysis of global demand for carbon emissions. Soc. Sci. China 6, 15–25.
Pata, U. K. (2021). Renewable and non-renewable energy consumption, economic complexity, CO2 emissions, and ecological footprint in the USA: Testing the EKC hypothesis with a structural break. Environ. Sci. Pollut. Res. 28 (1), 846–861. doi:10.1007/s11356-020-10446-3
Pata, U. K., and Caglar, A. E. (2021). Investigating the EKC hypothesis with renewable energy consumption, human capital, globalization and trade openness for China: Evidence from augmented ARDL approach with a structural break. Energy 216, 119220. doi:10.1016/j.energy.2020.119220
Pata, U. K. (2018). Renewable energy consumption, urbanization, financial development, income and CO2 emissions in Turkey: Testing EKC hypothesis with structural breaks. J. Clean. Prod. 187, 770–779. doi:10.1016/j.jclepro.2018.03.236
Pesaran, M. H. (2007). A simple panel unit root test in the presence of cross-section dependence. J. Appl. Econ. Chichester. Engl. 22 (2), 265–312. doi:10.1002/JAE.951
Pesaran, M. H. (2020). General diagnostic tests for cross-sectional dependence in panels. Empir. Econ. 60 (11), 13–50. doi:10.1007/S00181-020-01875-7
Petrović, P., and Lobanov, M. M. (2020). The impact of R&D expenditures on CO2 emissions: Evidence from sixteen OECD countries. J. Clean. Prod. 248, 119187. doi:10.1016/J.JCLEPRO.2019.119187
Pham, N. M., Huynh, T. L. D., and Nasir, M. A. (2020). Environmental consequences of population, affluence and technological progress for European countries: A malthusian view. J. Environ. Manag. 260, 110143. doi:10.1016/J.JENVMAN.2020.110143
Phong, L. H. (2019). Globalization, financial development, and environmental degradation in the presence of environmental Kuznets curve: Evidence from ASEAN-5 countries. Int. J. Energy Econ. Policy 9 (2), 40–50. doi:10.32479/IJEEP.7290
Popp, D. (2012). The role of technological change in green growth. World Bank Policy Res. Work. Pap. doi:10.1596/1813-9450-6239
PWC (2017). The Long view, How will the global economic order change by 2050? Retrieved from https://www.pwc.com/gx/en/world-2050/assets/pwc-world-in-2050-summary-report-feb-2017.pdf.
Ranis, G., Stewart, F., and Ramirez, A. (2000). Economic growth and human development. World Dev. 28 (2), 197–219. doi:10.1016/S0305-750X(99)00131-X
Raza, S. A., Shahbaz, M., and Nguyen, D. K. (2015). Energy conservation policies, growth and trade performance: Evidence of feedback hypothesis in Pakistan. Energy Policy 80, 1–10. doi:10.1016/J.ENPOL.2015.01.011
Saqib, N., Duran, I. A., and Sharif, I. (2022b). Influence of energy structure, environmental regulations and human capital on ecological sustainability in EKC framework; evidence from MINT countries. Front. Environ. Sci. 10, 968405. doi:10.3389/fenvs.2022.968405
Saqib, N. (2022). Green energy, non-renewable energy, financial development and economic growth with carbon footprint: Heterogeneous panel evidence from cross-country. Econ. Research-Ekonomska Istraživanja,35 1–20. doi:10.1080/1331677X.2022.2054454
Saqib, N., Mahmood, H., Siddiqui, A. H., and Shamim, M. A. (2022c). The link between economic growth and sustainable energy in G7-countries and E7-countries: Evidence from a dynamic panel threshold model. Int. J. Energy Econ. Policy 12 (5), 294–302. doi:10.32479/ijeep.13435
Saqib, N., Sharif, A., Razzaq, A., and Usman, M. (2022). Integration of renewable energy and technological innovation in realizing environmental sustainability: The role of human capital in EKC framework. Environ. Sci. Pollut. Res. Int., 1–14. doi:10.1007/S11356-022-23345-6
Sarkodie, S. A., Adams, S., Owusu, P. A., Leirvik, T., and Ozturk, I. (2020). Mitigating degradation and emissions in China: The role of environmental sustainability, human capital and renewable energy. Sci. Total Environ. 719, 137530. doi:10.1016/j.scitotenv.2020.137530
Schmalensee, R. (2012). From “Green Growth” to sound policies: An overview. Energy Econ. 34 (1), S2–S6. doi:10.1016/J.ENECO.2012.08.041
Shah, S. (2016). Determinants of human development index: A cross-country empirical analysis. Int. J. Econ. Manag. 3 doi:10.14445/23939125/IJEMS-V3I5P106
Shahbaz, M., Kumar Tiwari, A., and Nasir, M. (2013). The effects of financial development, economic growth, coal consumption and trade openness on CO2 emissions in South Africa. Energy Policy 61, 1452–1459. doi:10.1016/J.ENPOL.2013.07.006
Sharif, A., Saqib, N., Dong, K., and Khan, S. A. R. (2022). Nexus between green technology innovation, green financing, and CO 2 emissions in the G7 countries: The moderating role of social globalisation. Sustain. Dev., 1–13. doi:10.1002/sd.2360
Solow, R. M. (1957). Technical change and the aggregate production function. Rev. Econ. Statistics 39 (3), 312. doi:10.2307/1926047
Suri, T., Boozer, M. A., Ranis, G., and Stewart, F. (2011). Paths to success: The relationship between human development and economic growth. World Dev. 39 (4), 506–522. doi:10.1016/J.WORLDDEV.2010.08.020
Tran, N. V., Tran, Q. V., Lin, T. T., Dinh, L. H., and Do, H. T. T. (2019). Trade off between environment, energy consumption and human development: Do levels of economic development matter? Energy 173, 483–493. doi:10.1016/J.ENERGY.2019.02.042
Umar, M., Ji, X., Kirikkaleli, D., and Xu, Q. (2020). COP21 Roadmap: Do innovation, financial development, and transportation infrastructure matter for environmental sustainability in China? J. Environ. Manag. 271, 111026. doi:10.1016/J.JENVMAN.2020.111026
United Nation Development Program (UNDP) (1990). Human development report, concept and measurement of human development. New York, NY, USA: UNDP.
United Nation Development Program (UNDP) (2020). Human development report, the next frontier human development and the anthropocene. New York, NY, USA: UNDP.
Usman, M., and Radulescu, M. (2022). Examining the role of nuclear and renewable energy in reducing carbon footprint: Does the role of technological innovation really create some difference? Sci. Total Environ. 841, 156662. doi:10.1016/j.scitotenv.2022.156662
Wang, C., Raza, S. A., Adebayo, T. S., Yi, S., and Shah, M. I. (2023). The roles of hydro, nuclear and biomass energy towards carbon neutrality target in China: A policy-based analysis. Energy 262, 125303. doi:10.1016/j.energy.2022.125303
Westerlund, J. (2007). Testing for error correction in panel data. Oxf. Bull. Econ. Stat. 69 (6), 709–748. doi:10.1111/j.1468-0084.2007.00477.x
World Development Indictors (2022). World Bank open data. https://data.worldbank.org/.
Wu, L., Adebayo, T. S., Yue, X. G., and Umut, A. (2022). The role of renewable energy consumption and financial development in environmental sustainability: Implications for the Nordic Countries. Int. J. Sustain. Dev. World Ecol., 1–16. doi:10.1080/13504509.2022.2115577
Wurlod, J. D., and Noailly, J. (2018). The impact of green innovation on energy intensity: An empirical analysis for 14 industrial sectors in OECD countries. Energy Econ. 71, 47–61. doi:10.1016/J.ENECO.2017.12.012
Yang, B., Ali, M., Hashmi, S. H., and Jahanger, A. (2022). Do income inequality and institutional quality affect CO2 emissions in developing economies? Environ. Sci. Pollut. Res. 29 (28), 42720–42741. doi:10.1007/s11356-021-18278-5
Yang, Q., Huo, J., Saqib, N., and Mahmood, H. (2022). Modelling the effect of renewable energy and public-private partnership in testing EKC hypothesis: Evidence from methods moment of quantile regression. Renew. Energy 192, 485–494. doi:10.1016/J.RENENE.2022.03.123
Zhang, Q., Adebayo, T. S., Ibrahim, R. L., and Al-Faryan, M. A. S. (2022). Do the asymmetric effects of technological innovation amidst renewable and nonrenewable energy make or mar carbon neutrality targets? Int. J. Sustain. Dev. World Ecol., 1–13. doi:10.1080/13504509.2022.2120559
Keywords: environmental kuznets curve, human development, renewable energy, economic growth, E-7 economies
Citation: Saqib N, Usman M, Radulescu M, Sinisi CI, Secara CG and Tolea C (2022) Revisiting EKC hypothesis in context of renewable energy, human development and moderating role of technological innovations in E-7 countries?. Front. Environ. Sci. 10:1077658. doi: 10.3389/fenvs.2022.1077658
Received: 23 October 2022; Accepted: 28 November 2022;
Published: 16 December 2022.
Edited by:
Farrukh Shahzad, Guangdong University of Petrochemical Technology, ChinaReviewed by:
Ugur Korkut Pata, Osmaniye Korkut Ata University, TurkeyShujahat Haider Hashmi, Bahria University, Pakistan
Tomiwa Sunday Adebayo, Cyprus International University, Turkey
Copyright © 2022 Saqib, Usman, Radulescu, Sinisi, Secara and Tolea. This is an open-access article distributed under the terms of the Creative Commons Attribution License (CC BY). The use, distribution or reproduction in other forums is permitted, provided the original author(s) and the copyright owner(s) are credited and that the original publication in this journal is cited, in accordance with accepted academic practice. No use, distribution or reproduction is permitted which does not comply with these terms.
*Correspondence: Muhammad Usman, usman399jb@gmail.com