Determining High Conservation Values in Production Landscapes: Biodiversity and Assessment Approaches
 Alison R. Styring1*
  Joanes Unggang2 Roslina Ragai3
  Kayleigh Kueffner1 Daniel Froehlich4 Nyegang Megom2 Li Joseph2 Alex Jukie2 Moses Tarang2 Mohamad Nazrin2 Kiding Sulok2 Kinsy Sekina2 Luisia Duya Setia2 Laura Giannone1 Boniface Nilly Aron2 Nicholas Swartz1 Philip Hyde1 Bow Tyler1 Diana James2
- 1The Evergreen State College, Department of Environmental Studies, Olympia, WA, United States
- 2Grand Perfect Sdn Bhd., Bintulu, Malaysia
- 3Sarawak Forestry Corporation, Kuching, Malaysia
- 4Ornitho-logistics, Poulsbo, WA, Unied States
Conversion of natural, heterogenous tropical forests to intensively managed, monoculture-production landscapes is a major threat to biodiversity. This phenomenon is driven by global demand for commodities such as wood, palm oil, sugar, and soybean. The economies of many countries in tropical areas depend on these commodities, and there is a need to ensure economic welfare while protecting biodiversity. Certification schemes such as those developed by the Forest Stewardship Council and Roundtable for Sustainable Palm Oil are intended to provide incentive to companies to employ environmentally and socially sustainable production practices. One element of these certification schemes is the concept of High Conservation Values (HCVs) which fall into six categories that encompass ecological indicators and human dimensions. The HCV process has expanded beyond production landscapes to include long-term conservation planning. Despite expansion, implementation of the HCV process as it pertains to biodiversity is challenged, in part, by a lack of specificity regarding target metrics. Another challenge is that, in practice, there is a short time period for assessment, resulting in limited collection of primary data and a reliance on secondary data sources for interpolation. HCV guidance advances a precautionary approach to assessment, but in some regions, there is not enough known about the biology, behavior, or interspecific associations of species to effectively assess what is not observed. In this paper, we assess environmental HCVs in a well-studied timber production system in Sarawak, East Malaysia. Using an original long-term multi-method dataset of avifaunal surveys as well as published datasets of other taxa, we 1) assess biodiversity metrics at the site including presence of Rare, Threatened, and Endemic species, 2) assess change over time at assessment locations, and 3) evaluate costs and benefits of the various methods and provide best practice recommendations for HCV assessment and long-term monitoring. Finally, we recommend transparent data-archiving and sharing for improved accuracy and efficiency in the HCV process. Managed landscapes are important areas for ecological research that are beneficial not only to the restoration and conservation of species and ecosystems but also to well-informed certification and long-term sustainability.
1 Introduction
Tropical forest ecosystems represent less than 10% of the earth’s land area but harbor over 60% of documented biodiversity (Bradshaw et al., 2009). Conversion of natural, heterogenous forests to intensively managed, monoculture-production landscapes is a major cause of forest loss in tropical regions and a primary threat to biodiversity (Giam 2017). Monoculture production systems have lower levels of biodiversity, fewer rare and threatened species, and are more difficult to restore than natural forests managed for timber (Edwards et al., 2010). However, there is increasing pressure to convert both logged and old growth forests to plantation landscapes for commodities such as wood, palm oil, sugar, and soybean (Wilcove and Koh 2010; Carrasco et al., 2014; Griscom and Goodman 2015). The extent of forested land that is in some form of production far exceeds protected forests both in tropical regions and globally (Meijaard and Sheil 2012). These commodities account for a substantial proportion of GDP (Purnomo et al., 2020) and are essential to the economic growth of countries. While halting this process is not possible, there are approaches to land-use planning and change that can reduce the amount of native forest loss and sustain viable populations of many species within production landscapes.
One strategy to address this issue is certification and green labeling. This is a consumer-focused approach in which the buyer may select products that have been accredited to meet certain environmental and social standards. Certification schemes such as those developed by the Forest Stewardship Council (FSC) are intended to provide incentive to companies to use environmentally and socially sustainable production practices (Kollert and Lagan 2007, but see; Chen et al., 2010). To become FSC-certified, companies must demonstrate a commitment to ten criteria associated with legal compliance, worker, community, and indigenous rights, environmental impact reduction, and ongoing monitoring and planning. There is debate over the long-term benefits of certification to biodiversity protection (e.g., Edwards et al., 2010; Carlson et al., 2017; Trolliet and Vogt, 2019), but the demand for certified products has increased in recent years, suggesting that social pressure will continue to influence commodity and natural resource markets (Dinerstein et al., 2019; The Economist Intelligence Unit 2021).
One element of certification (FSC Criterion 9) is the concept of High Conservation Values (HCVs), which falls into six broad categories that encompass ecological indicators and human dimensions associated with ecosystem health (Brown et al., 2013; Forest Stewardship Council 2015). The HCV process is increasingly used as a tool for land use planning at large spatial scales (Senior et al., 2015; Areendan et al., 2020).
Despite increasing use of the HCV process in conservation, challenges to effective implementation as it pertains to biodiversity and ecosystem values remain, due, in part, to a lack of specificity regarding target metrics (Senior et al., 2015; Tayleur et al., 2016). Also, in practice, there is a short time period for environmental assessment, resulting in limited collection of primary data (rapid field surveys at a small number of sites) and a reliance on secondary data sources for interpolation (Sollmann et al., 2017). HCV guidance recommends a precautionary approach to assessment, but in some regions (e.g., certain tropical regions with high levels of biodiversity), not enough is known about the biology, behavior, or interspecific associations of species to assess what is not observed.
In this paper, we present an assessment of biodiversity HCVs from a well-studied timber production system in Sarawak, East Malaysia: Sarawak Planted Forests (SPF). Using an original long-term multi-method dataset of avifaunal surveys as well as published datasets of other taxa, we 1) evaluate the presence of Rare, Threatened, and Endemic (RTE) species at the site as well as changes over time in species presence, 2) compare detection rates of different field methods, taking into account differences in spatiotemporal coverage, and 3) compare costs and benefits of the various methods. We place the work within the broader context of the HCV process by comparing biodiversity information from SPF to that presented in summary statements of successful HCV applications on the island of Borneo.
2 Materials and Methods
2.1 Study Site
Field research was conducted within Sarawak Planted Forests (SPF; Figure 1), located within Bintulu Division (2.83°, 113.22°). Established in 1997, SPF was the first large-scale exotic timber plantation in Sarawak (Ellis 2007; Hall et al., 2007; Stuebing 2007). It was established near Bintulu, in part, because much of the landscape was already disturbed (logged native forest) or altered (primarily shifting cultivation). It encompasses an area of approximately 500,000 ha and includes ca 200,000 ha of exotic fast-growing softwoods: primarily Acacia mangium. The remaining area consists of designated Native Customary Rights land, and several large tracts of native forest intended to serve as both primary habitat and protective corridor for sensitive species (Stuebing 2007). Within the native forest area there is one Totally Protected Area known as Binyo-Penyilam National Park (BPNP, on paper called Danau Mujan), one protected area called Bukit Sarang (BS), a large area of previously logged (ca. 30 years ago) forest called Bukit Mina Wildlife Corridor (BMWC), and an adjacent area of native kerangas forest known as Bukit Nyegoh (BN). These areas include high priority ecosystems for protection, including peat swamp forest (BPNP), freshwater swamp (BS), and kerangas (BN) (WWF, 2009). Several national parks are adjacent to or near SPF including Bukit Mersing NP (adjacent), Bukit Kana NP (adjacent), Sungai Meluang NP (16 km from SPF), Bukit Tiban NP (18 km), Similajau NP (20 km), Hose Laga NP (28 km), and Bakun Islands NP (38 km). There is also considerable native forest within the SPF and to the South and East (Figure 1).
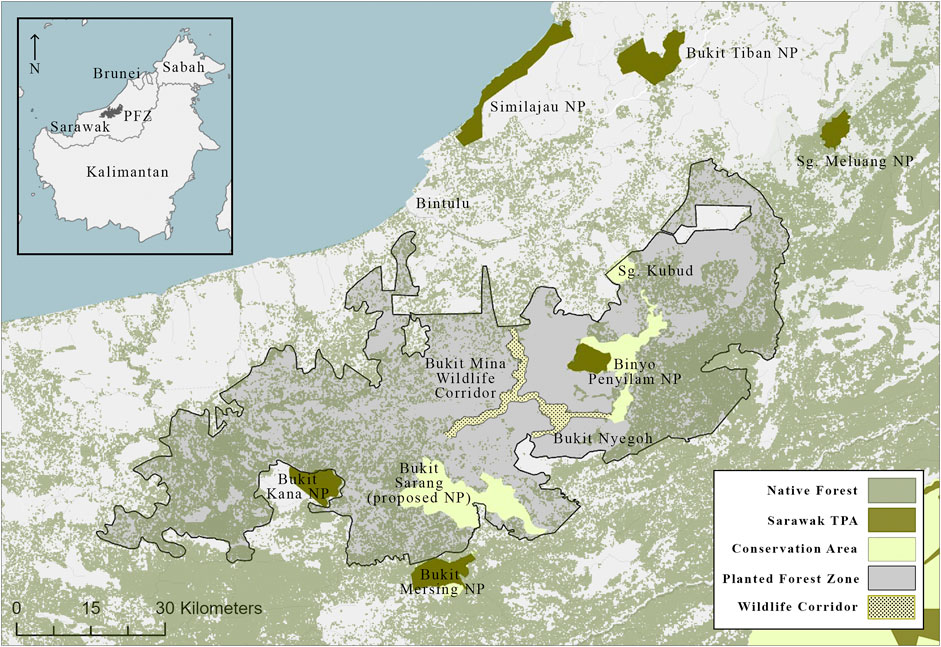
FIGURE 1. Map of Sarawak Planted Forests and surrounding landscape. The area indicated as native forest is forest that was previously logged (30 + years ago). TPA, Totally Protected Area; SPF, Sarawak Planted Forests. Areas labelled as Conservation Area are areas within SPF that are designated for conservation but have no formal protection otherwise.
2.2 Field Methods
2.2.1 Point Count (PC) Surveys
Point count surveys were conducted in July–August 2006 (BMWC, n = 216BPNP, n = 80) and September 2019 (BPNP, n = 80). Trained observers conducted timed point counts every 50 m along transects that were 1,000 m in length from 0600–0930 (Styring et al., 2011). For a duration of 3 min, observers documented every bird detected (visually or aurally) and estimated the distance of the bird from the observer using laser rangefinders (Buckland et al., 2015). In 2019, each point count was also recorded with a digital recorder. Habitat data were also collected at each point including variables associated with forest type, habitat complexity, and stand structure (Supplementary Table S1).
2.2.2 Bird Banding (BB)
Bird banding was conducted using a standardized capture array at BMWC and BPNP in 2018 and 2019. We established a minimum of three ∼1 ha net plots at each site with 36 net-meters distributed on each side and on a transect through the midpoint (see Figure 1 for an example). Nets were deployed over three to 4 days between dawn and an hour before dusk to accumulate a minimum of 15 h of net operations including at least two dawn and one evening capture period. Once net arrays had accumulated the minimum passive-capture target hours as well as the requisite dawn and dusk sessions, we deployed a select or full array on a final morning to target under-sampled species using sound-baiting with song playback or alarm calls. Netting was conducted under safety standards of the North American Banding Council (NABC, 2001). All birds captured were processed by marking individuals with a numbered aluminum band to keep track of recaptures. Beyond the circumstances of capture, the data collected from each individual included species, physiological evidence relating to age (skull ossification and plumage characteristics), sex (plumage, measurements and breeding condition, including cloacal protuberance, brood patch and eggs in the oviduct), condition (fat score and mass as well as plumage characteristics such as feather wear and plumage aspect), and molt status (active molt of flight feather and body tracts). Data categorizations largely followed the Institute for Bird Populations’ Monitoring Avian Productivity and Survivorship Protocol (DeSante et al., 2021). When possible, we took an in-hand series of photographs showing head, back, underparts, a spread-wing and tail, as well as a series of photographs of remiges and wing coverts using a Dino-Lite Digital USB microscope at ∼×25 magnification. Image data were cross-linked with field data and organized and accessioned into Adobe Bridge.
2.2.3 Dawn Chorus Surveys (DC)
Observers conducted dawn chorus surveys starting 15 min before dawn and lasting approximately one hour after dawn at BPNP (14–18, 27 September; 3 October 2019), BMWC (9–10, 12–20, 22–25. 27–28 March; 4–6. 8–12 April 2018), and BSCA (13–16 June 2017) (Parker, 1991). Observers slowly walked established survey routes while recording sounds with a field recorder and directional microphone. The recordist slowly moved the microphone in a circle and at angles from directly overhead to downslope. An additional field observer accompanied the recordist and quietly pointed out new calls and songs.
2.2.4 Autonomous Recorders (ARs)
Weatherproof, programmable recording units were deployed at BSCA (13 June–12 July 2017; n = 1), Bukit Nyegoh (9 March to 4 April 2018; n = 1) and BPNP (14 September–4 October 2019, n = 8). The recorders were programmed to record at two, 2-h intervals at dawn and dusk (starting from 15 min pre-dawn and again from 105 min pre-dusk). Recordings were saved to SD card and downloaded to Arbimon https://arbimon.rfcx.org/) for pattern matching analysis.
2.3 Analysis
2.3.1 Biodiversity Inventories
2.3.1.1 Avifauna
A master checklist of birds observed in SPF was compiled from surveys from 2005 to 2019. Most of the survey work was conducted by the current authors and researchers from Louisiana State University Museum of Natural Science (2006, 2007, 2008, 2010, 2011, 2017, 2018, and 2019). Other surveys included: a 2005 rapid assessment by a research team from the Academy of Sciences of Philadelphia, a 2009 rapid assessment of the Bukit Sarang area by field guide author Quentin Phillips, and a 2018 survey by a research team from the Smithsonian Institution. The species list generated from these surveys represents both systematic surveys (described in field methods) as well as incidental observations.
2.3.1.2 Other Taxa
We conducted a systematic literature review using the following search terms in google scholar: “Sarawak Planted Forests”, Sarawak + “Planted Forests Zone”, Sarawak + “PFZ”, “SPFZ”, “SPF”, “Bukit Sarang”, “Bukit Mina”, “Bukit Nyegoh”, “Binyo-Penyilam”, “Binyo”, and “Penyilam”. Results were then filtered to include studies with titles that covered the topics of ecology, biodiversity, taxonomy, conservation, forestry, or the name of a specific plant or animal. The remaining articles where then read to determine if presence information for one or more animal species was included in the study. Information from articles that included species information was then compiled into tables by taxonomic class. Details on the methods used and duration of study were also compiled.
2.3.1.3 Determination of Rare, Threatened, and Endemic Species (RTEs)
For all documented species, we searched the IUCN, (2021) for assessment information and noted species considered Vulnerable or more threatened (Vu+). We also searched CITES, (2021) Appdendix I, II, and III as well as species lists of the Wildlife Protection Ordinance of Sarawak (Forestry Department Sarawak, 1998). Whether or not a species was endemic was determined by: 1) research papers, 2) bird and mammal field guides (Phillipps and Phillipps, 2014; Myers, 2016; Phillips and Phillipps, 2016), 4) and descriptions in the IUCN, (2021).
2.3.2 Species Richness, Detection Rates, and Change Over Time
For point count and bird banding datasets, we compared daily species detection rates among the four sites using a Kruskall-Wallis Chi-squared test in R Core Team, (2021). We used Dufrene and Legendre, 1997) Indicator Species approach in PC-Ord 7.0 (McCune and Mefford, 2018) to determine if certain species indicated three different habitat types: peat swamp forest (BPBNP), kerangas forest (BN) and lowland dipterocarp forest (BMWC). To assess change over time at BPNP, we conducted Non-Metric Multidimension Scaling analysis (NMS) with year of survey (2006, 2019) as the grouping variable. A Multi-response Permutation Procedure (MRPP) was used to test the H0 = no difference in community structure between survey years. We also compared daily species richness detection rates by method (point counts or bird banding) with Kruskall-Wallis Chi-squared test and Indicator Species Analysis.
2.3.3 Detection of Rare, Threatened, and Endemic Species
The term “rare” can refer to species with restricted ranges, low population density, patchy occupancy, or skittish and elusive behavior (Gaston, 1994; Cerqueira et al., 2013). For those reasons, we did not consider degree of rarity as a criterion for assigning a species as an RTE. However, we did look at relative abundance of species determined to be Vulnerable or above by the IUCN in the point count dataset. We generated rank-abundance charts in excel to look at patterns of relative abundance and detection per km of survey transect. This allowed us to see patterns of abundance in species with significant threats to their persistence.
We established a list of RTE’s that met the following criteria: a species 1) was listed as Near-threatened, Vulnerable, or Endangered by the IUCN, (2021), 2) was likely to be detected using the surveys methods (e.g., most nocturnal birds were unlikely to be detected by our methods), and 3) provided high-quality sound files that could be used for pattern-matching analysis (see below). We ended up with a list of 26 species, of which six were Bornean Endemics and 24 were considered Vulnerable or Endangered by the IUCN (Table 1).

TABLE 1. Species analyzed for presence in dawn chorus and autonomous recordings using pattern matching analysis.
Using templates of bird vocalization recordings, we used a pattern-matching analysis in Arbimon RFCx (2021) (https://arbimon.rfcx.org/) to search for RTE’s in the recordings from dawn chorus surveys and the autonomous recorders for each study site. Matches were validated by ARS, and the date of first detection for each sample unit was determined in matches validated as “present”. Date of first detection was also documented for all RTE’s detected in point count and bird banding surveys.
We compared daily detection rates of RTEs using Kruskall-Wallis Chi-squared analysis in R Core Team, (2021). We analyzed the relationships between spatial coverage and survey duration for the methods on daily RTE detections using ordinary least squares regression with per-sample survey area and duration as variables and interaction terms. We used a model selection approach with backward and forward stepwise selection and Akaike Information Criterion (AIC) to determine the model of best fit.
A table summarizing method type, data produced by each method, gear costs, people needed (and skills), and post-survey processing time was compiled to compare costs and benefits of each method. Gear costs were determined from gear lists that the survey team used each field season (and cost of new equivalent equipment in 2021, in USD). People required for each method was determined from field survey data and was determined to be the optimal number to complete the survey during the intended timeframe. Post-processing time was determined from timesheet accounting of each survey method. We then ranked each method as it compared to the others in terms of costs (equipment, person time, relative training time) and ‘benefits’ in the form of data resolution, spatial coverage, and long-term research potential of the datasets (with datasets that produce a large amount of acoustic or image data having higher potential compared to datasets with a smaller amount of digital image or sound data).
2.3.4 Comparison to successful HCV applications.
To compare the results from SPF to successful HCV applications, we searched for summary reports of successful HCV applications on the island of Borneo using the HCV Network’s Report search function (https://hcvnetwork.org/find-a-report/?acs-action=advanced-search) and searching for summary reports from Malaysia, Indonesia, and Brunei. Reports were then filtered to include only those from Sabah and Sarawak (Malaysia) and Kalimantan (Indonesia). Each report was read and we compiled information on; 1) the duration of field work focused on HCV-1 Biodiversity, 2) the type and number of species documented as well as the IUCN threat status of documented species.
3 Results
3.1 Biodiversity Inventories
Combined survey efforts resulted in the detection of 216 bird species across the four sites (Supplementary Table S2). Fifteen species were listed as Vulnerable, three as Endangered and one (Rhinoplax vigil) as Critically Endangered. This represents 66% of all IUCN-listed bird species (Vulnerable+) occurring in lowland forests in Borneo. Twenty-one species were CITES-listed. Forty-five species were listed as Protected in Sarawak and 15 as Totally Protected. New species were added to the area list in six of the eight field seasons of this research, with the most recent addition being Bonaparte’s Nightjar, considered Vulnerable by the IUCN in September 2019. Point counts, dawn chorus recordings, bird banding, and autonomous recorders detected 13 of the 19 IUCN-listed (Vu +) species in the study, with the remaining six species either observed incidentally by the survey team (Rhinoplax vigil, Lophura ignita, and Alophoixus tephrogenys) or detected by the other survey teams (Nisaetus nanus, Pitta nympha, and Ptilocichla leucogrammica).
For non-avian taxa, a literature review using the described search terms resulted in a list of 83 publications that included ecological or biodiversity research focused on the study sites described in this paper. Of those publications 60 included species-level information with 18 publications documenting flora and 42 documenting fauna. When two or more publications provided the same species information, the earliest published paper was selected as the reference. Ultimately, we referenced 25 publications presenting specific data documenting presence of non-bird animal taxa at the sites of interest. The animal classes with presence information were: Actinopterigii, Amphibia, Reptilia, Mammalia, Insecta (Odonata), Malacostraca, and Gastropoda (Supplementary Tables S3–S8).
The resulting species lists documented 205 non-bird species, 36 of which were listed as Vu+. A number of new species were described in these papers including: one new species of fish (Hui and Lim, 2007), one new species of frog (Inger et al., 2006), eight new species of Odonate including one new Genus (Dow and Orr, 2012; Dow, 2013; Dow, 2020), and two new species of crab (Grinang and Ng, 2021; Ng, 2021). A new distributional record was also documented for a rare bat species (Rahman et al., 2010). Effort across these studies ranged from relatively constant and continuous for mammals (camera trapping, constant effort over a period of 2 years, and continuing currently) to shorter in duration (gastropods, fishes; see Supplementary Table S3). Mammals and Odonates were sampled most intensively out of these groups, and the numbers of IUCN Vu + species detected represented 66% (mammals) and 27% of the possible species.
3.2 Species Richness, Detection Rates, and Change Over Time
Survey efforts that focused on total bird species richness and abundance comprised 32, 1-km point count transects, totaling 156 survey hours, and 1724 individual detections of 139 species and 10, 1-ha mist net plots over 30 survey days, 295 survey hours, and 409 captures of 67 species. Among-site variation in daily species richness did not differ significantly, but indicator species analysis identified 17 species that were significant indicators of lowland dipterocarp forest (found in BMWC), two indicators of kerangas forest (BN), and three indicator species of peat swamp forest (BPNP; Table 2). Community analysis (NMS) and comparison (MRPP) of BPNP a from 2006 to 2019 revealed a significant difference in community structure between the two time periods and species accumulation curves show higher species accumulation in 2019 (Figures 2, 3).
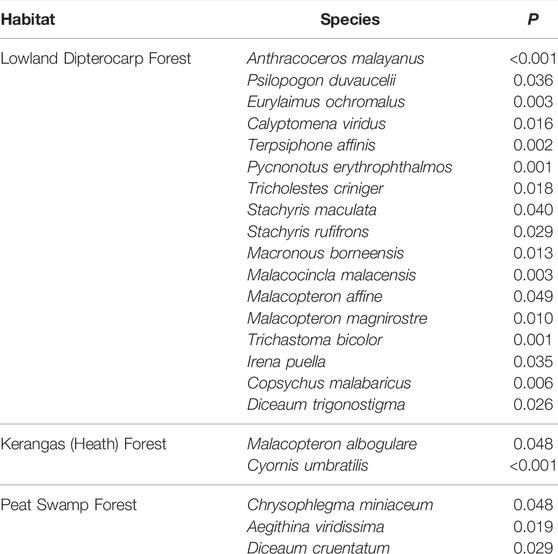
TABLE 2. Indicator species for forest type.
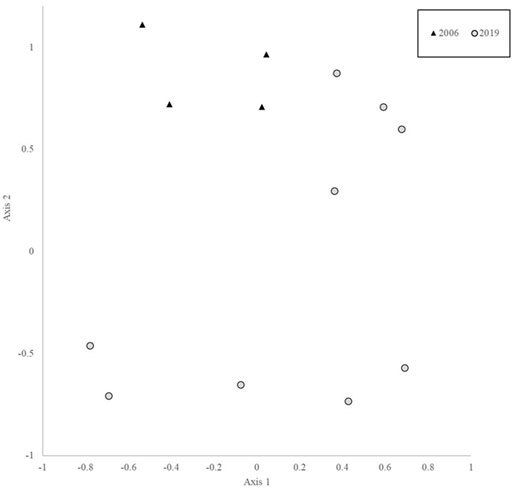
FIGURE 2. NMS ordination of point count transect data at Binyo (2006 and 2019). MRPP value T = 2.9, A = 0.5, and p = 0.01.
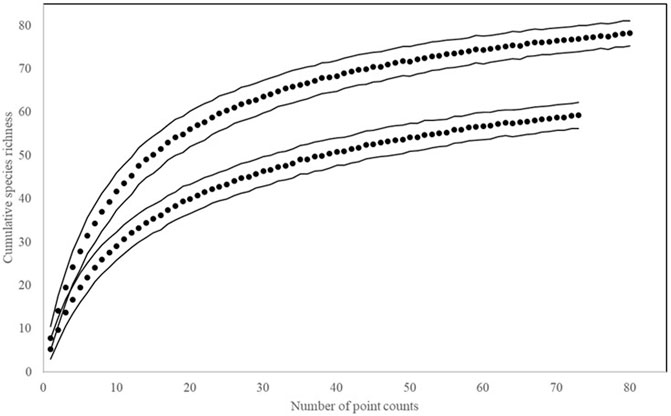
FIGURE 3. Species accumulation plots for point count surveys at Binyo-Penyilam (2006 and 2019). Lines represent standard deviation. Per point richness (S) and diversity (H′) ± (s) 2006: S = 5.6 ± 2.6, H’ = 1.5 ± 0.5; 2019: S = 7.7 ± 2.7, H’ = 1.9 ± 0.4.
Analysis of detection rates of all species from point counts and bird banding resulted in a significant difference in daily detection rate between the two methods with point counts having significantly higher daily species detections than banding (Kruskal–Wallis chi-squared = 47.676, df = 1, p-value < 0.00001; Figure 4), with 82 indicators of point counts and three indicators of bird banding (Table 3).
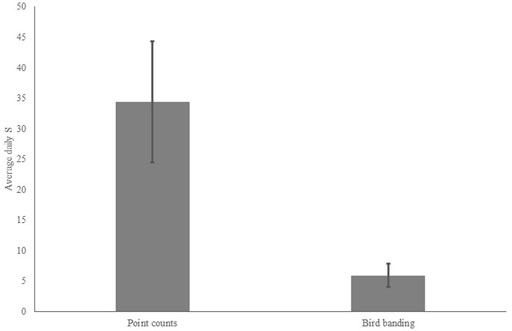
FIGURE 4. Average daily species richness of point counts versus bird banding (Kruskal–Wallis chi-squared = 47.676, df = 1, p-value < 0.00001).
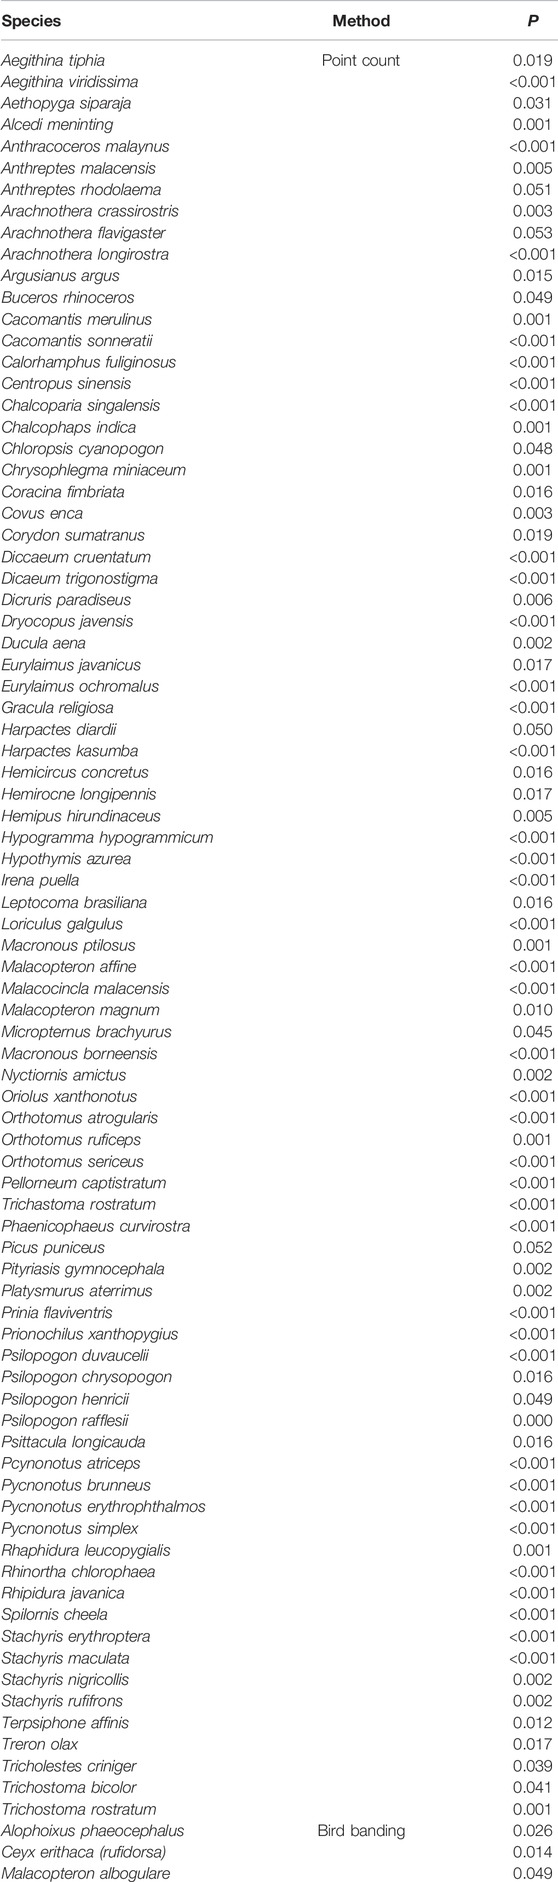
TABLE 3. Indicator species for field method.
3.2.1 Detection of Rare, Threatened, and Endemic Species
Survey efforts focused on detection of RTEs included 40 days and 42 h of dawn chorus surveys and 10 independent autonomous recorder deployments accumulating 600 h of sampling time. We conducted 448 pattern matching analyses, resulting in 108,212 matches of templates and 46 analyses (with a total of 2,855 matches) resulting in at least one confirmed detection among the matches. We confirmed 431 matches as actual detections of 11 of the 26 focal species.
Daily RTE detection varied significantly among methods with point counts having higher daily detections of RTEs compared to bird banding (Kruskal Wallis chi-squared = 16.9, DF = 3, p = 0.0007), and both point counts and ARU’s having higher daily accumulation of RTEs (Kruskal Wallis chi-squared = 17.9, DF = 3, p = 0.0005; Figures 5A,B).
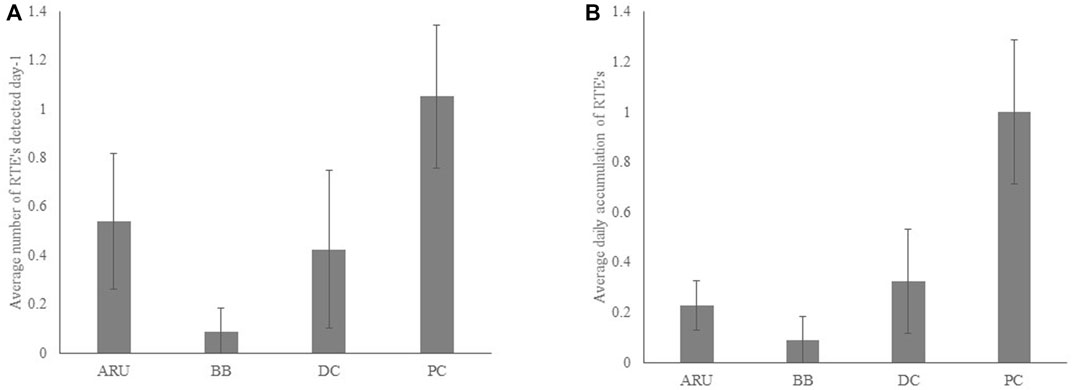
FIGURE 5. Average (per day) detection of (A). RTE’s (Kruskal Wallis chi-squared = 16.9, DF = 3, p = 0.0007); and (B) number of total RTE’s by method (Kruskal Wallis chi-squared = 17.9, DF = 3, p = 0.0005). Error bars represent 95% confidence intervals. Pairwise comparisons of methods indicated significant differences between bird banding and point counts (A and B) and between bird banding and autonomous recording units (B).
Regression models of the response of RTE detection to sampling duration, sampling area, and interaction term resulted in a significant model (F = 3.81, DF = 3, 38, p = 0.02, r2 adj = 0.2138; Table 4). Backward and forward stepwise model selection resulted in congruous results and two nearly equivocal models with the best explanatory power: 1) the full model that accounted for sampling area and sampling duration plus interaction between the two parameters, and 2) a model including just sample duration (Table 4). Daily RTE detection rates increased with sample area significantly (F = 54.75, DF = 1, 30, p < 0.0001, adj r2 = 0.6342; Figure 6). Rank abundance plots from point count data plotted eight of the 13 RTE species detected at the study sites. The RTE species with the highest abundance was Black Hornbill (Anthracoceros malayanus; 1.4% of total abundance) and that with the least was Wrinkled Hornbill (Rhabdotorrhinus corrugatus; 0.03% total abundance; Figures 7A,B).
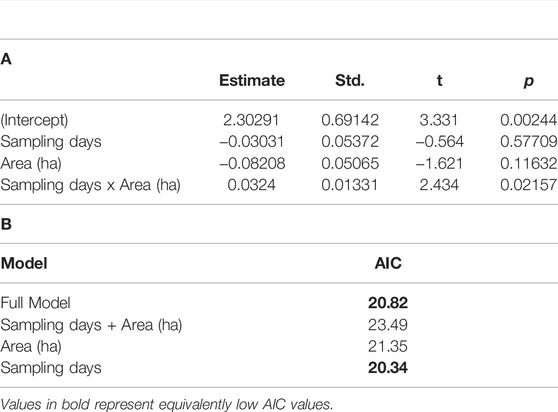
TABLE 4. Regression table a. and model selection and b. for RTE ∼ Sampling days + Area (ha) + Sampling days x Area (ha). F = 3.81, DF = 3, 38, p = 0.02, r2 adj = 0.2138.
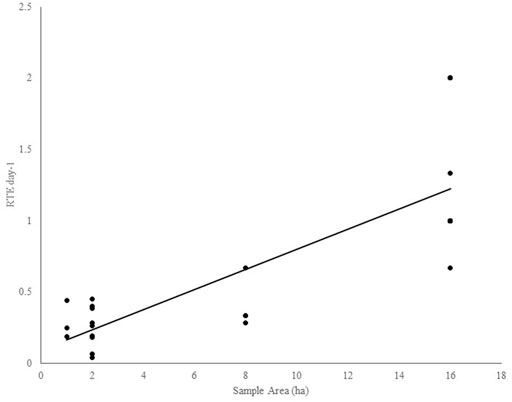
FIGURE 6. RTE’s per day across sample area.
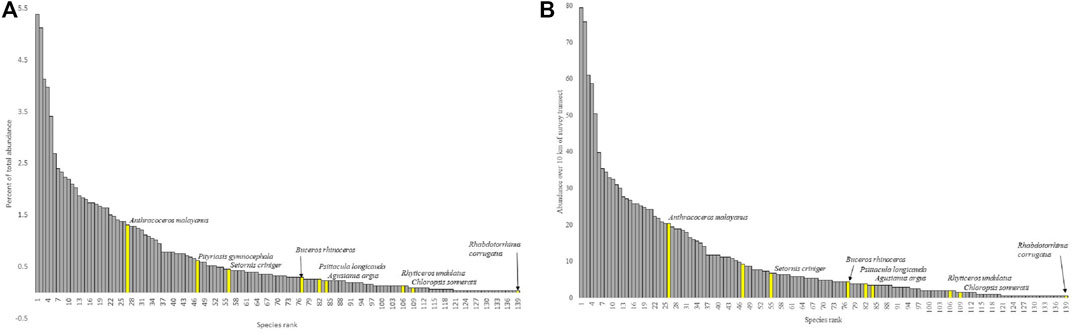
FIGURE 7. Rank abundance (A) percentage of total abundance by species rank (from most abundant to least) and (B) as average number of individuals per 1 km of survey transect. Yellow highlighted bars represent the eight species listed as Vulnerable or more threatened by the IUCN that were detected on during point counts.
3.2.2 Costs and Benefits of Methods
Dawn chorus surveys were the least costly method in terms of equipment, and equipment-life is 5–10 years if protected from moisture and shock (Table 5). The method requires two observers, at least one highly-skilled in bird vocalization. Preparation time is about 15 min per survey, and processing time after survey completion is about 3 hours. Point count surveys require similar gear as dawn chorus surveys, but the addition of a laser rangefinder is needed to make accurate distance estimates (they can also help with some habitat data collection). Point counts also require time investment from preparation to post-survey processing. Field time for point counts is longer due to collection of habitat data. Over a 10-days survey, 7–10 days of data can be collected for both point counts and dawn chorus surveys. Autonomous recording units are more expensive to deploy, and they tend to have a shorter lifespan due to their exposure to the elements. Person and time investment in the field is lower compared to other methods, and the skills required for field deployment are more technical than skill in sound identification. Sample time can be maximized by long deployments and continuous or nearly continuous recording. Post-survey processing time for ARUs is substantial, with an average of 4 days for every 10 days of deployment (recording 4 hours per day). Bird banding is the most expensive of the four methods in terms of initial gear costs, but much of the gear can have a long lifespan with proper care. The method also requires substantial time investment in preparation and more people are needed for field work over a longer (10-h) field day. Post-survey processing time is relatively low for bird banding, and the amount of data gathered per individual is higher than other methods.
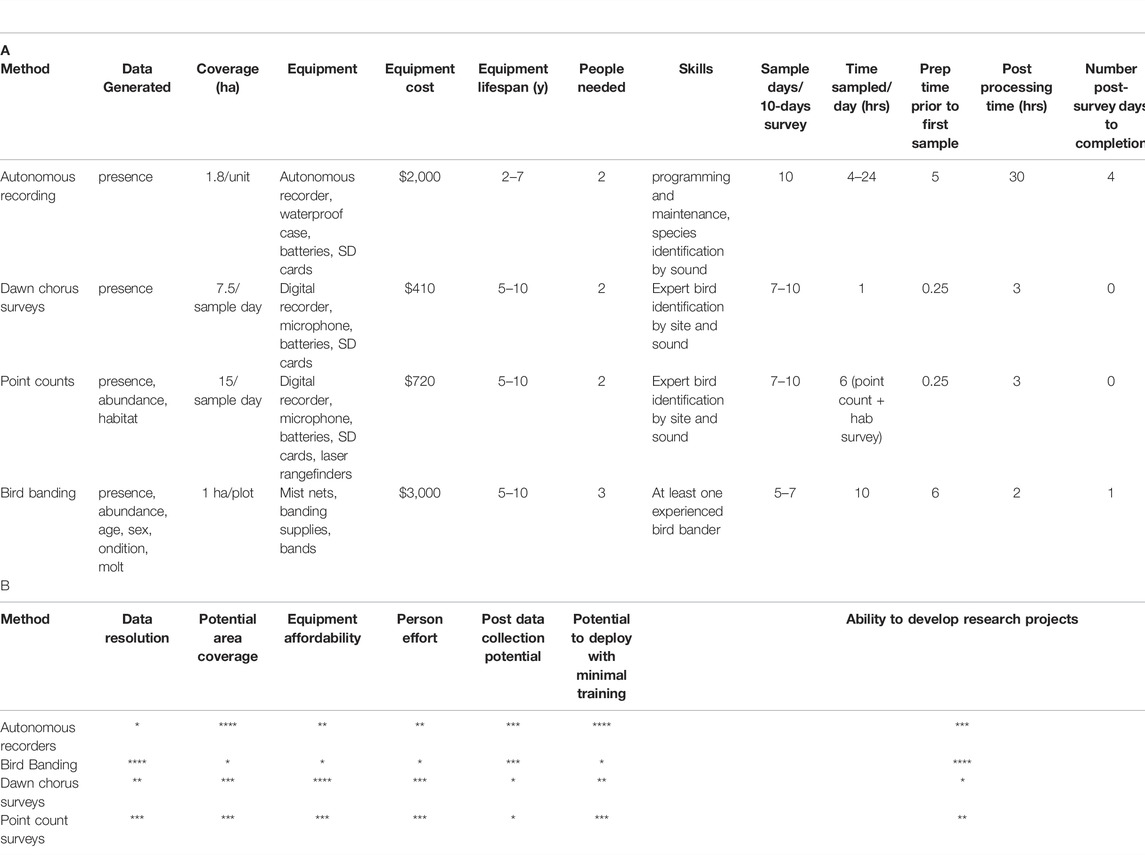
TABLE 5. Methods details. A. Equipment lists and costs do not include basic field supplies needed for ornithological work such as binoculars and field notebooks/datasheets, etc. Equipment lifespan is an estimate based on the lifespan of gear used in the surveys described in this study. Gear was subjected to hot and humid conditions during field deployment, then cleaned and stored in secure, dry storage. Post processing estimates are based on a hypothetical 10-days survey trip (not including travel time to/from survey location). This processing time would increase for autonomous recorders if more than 10 recorders are deployed. All prices are in USD. B. Rank of methods. Rankings are from * to **** with * representing low and **** representing high for the variables listed.
3.3 Comparison to Successful HCV Applications
We reviewed the summary statements from 33 approved HCV applications from Sabah, Sarawak, and Kalimantan. All of these statements provided information regarding the timeline of the process including the number of field days focused on assessment presence of RTE species in the proposed area. Twenty-six of the statements also included information on species that were documented to be presented including species listed as Vulnerable or more threatened by the IUCN. Among those applications, the average number of days of field work was 8.9 (sd ± 5.7). The species documented averaged 10 (sd ± 6.2; Supplementary Table S9). In many cases, the focus was on highly endangered mammal species such as Bornean Orangutan or Sunda Pangolin (Supplementary Table S9). By comparison, the avian survey work (not including rapid assessments by other teams) totaled 71 calendar days by teams in the field and an additional 30 days of autonomous recording. Average field visit length at the sites was 14.2 (sd ± 10.4). On most research trips, teams also conducted surveys in Acacia mangium plantation which, if included, averaged 24 (sd ± 9.4).
4 Discussion
4.1 Biodiversity Metrics for HCV
The Sarawak Planted Forest (SPF) sites surveyed in this study were embedded within a landscape that, although heavily disturbed and largely covered by plantation, contained substantial areas of native forest, represented high-priority ecosystems, and were in close proximity to other protected areas (Figure 1). Original bird data from this study combined with research focused on other taxa resulted in a compiled list of 420 animal species, of which 55 are listed as Vulnerable or more threatened by the IUCN. Additionally, 12 species new to science have been discovered within the area, with some possibly endemic to sites within SPF. This assessment did not evaluate information from floristic studies, which also have described new species (e.g., Kiew and Sang, 2009; Kiew and Sang, 2013; Lin C.-W. et al., 2014; Lin W. et al., 2014; Lin et al., 2017).
The purpose of biodiversity criteria in the HCV process is to document evidence of RTEs rather than generate a comprehensive biodiversity inventories. The field work element of HCV applications from other locations in Borneo was relatively brief and combined field survey methods with interviews of locals. In most cases the focus of these efforts was on conspicuous and charismatic species, such as orangutans and hornbills, although some applications provided more comprehensive datasets. Although there is no specific guidance about whether some RTEs are more indicative of HCV compared to others, the most frequently mentioned species in the assessments included: Pongo pygmaeus, Helarctos malayanus, Sus barbatus, and Manis javanica. Hornbills (Rhinoplax vigil, Buceros rhinoceros, and Anthracaceros malayanus) were also mentioned in a number of applications. Data from SPF documents presence of the most frequently-mentioned species with the exception of Bornean Orangutan as the area is outside of the species’ range.
4.2 Best Practices for Field Assessment and Monitoring
We evaluated the efficacy and costs of four different survey methods commonly used for biodiversity inventory of birds. Our findings largely agree with other comparative research. Each method requires different skill sets and has different biases in detection. Studies that compare methods usually recommended that multiple methods be used when the goal is comprehensive biodiversity inventories (Martin et al., 2010; Cellis-Murello et al., 2012; Leach et al., 2016; Wheeldon et al., 2019; Darras et al., 2019). Many HCV applications document a pre-assessment phase in addition a full assessment, and there are long-term monitoring requirements (Furumo et al., 2019). We recommend specific types of survey methods for assessment and monitoring.
4.2.1 Autonomous Recording Units–An Effective Tool for Assessment and Monitoring
Programmable autonomous recorders are becoming increasingly affordable, durable, and lightweight, making the deployment of numerous ARUs across a large landscape feasible. Additionally, the archive of raw sound data produced by ARU’s can serve as an important resource for subsequent research projects (Digby et al., 2013; Krause and Farina, 2016). Some drawbacks of this method are: 1) non-vocal species are not detected, 2) large amounts of data to search for focal species, 3) demands of large datasets in terms of computing power and media storage, 3) maintenance, repair, and replacement costs. However, many of these drawbacks will become less problematic as technology advances (Digby et al., 2013; Darras et al., 2018; Metcalf et al., 2021).
In our study, autonomous recording units had comparable detection rates of RTE’s compared to dawn chorus surveys, but they surpassed DC surveys when geographic coverage was larger, and deployment time was longer (weeks/month). This finding is consistent with other studies that recommend ARUs be deployed across a large geographic area and sample strategically to increase probability of detection (Digby et al., 2013; Metcalf et al., 2021). ARUs are becoming more affordable with higher recording capacity and longer battery life (Table 5) but will likely require long-term costs for maintenance, data processing, and replacement. They lower in-person field-time requirements and the datasets generated by ARUs are large. The amount of post-sampling processing time can be substantial (Table 5) but the field of pattern matching analysis and song recognition is rapidly evolving, making speed of identification most likely quicker in the future. Ultimately, ARU’s are likely to be the most useful method for detecting and documenting rare, nomadic, and elusive species, which constitute a substantial proportion of RTEs. We recommend that ARUs be deployed for full assessments and for long-term monitoring efforts. Ideally, sampling strategies would include high probability detection times (such as the dawn chorus) as well as strategic sampling during other time periods across a large area (Metcalf et al., 2021).
4.2.2 Point Count Surveys for Assessment and Periodic Monitoring
Point count surveys had the highest rates of overall species detection as well as the highest rates of detection for RTE’s compared to the other survey methods examined in this study (Figures 4; Figures 5A,B). This is likely due in part to the relatively large area covered (Figure 6; Table 5). This finding is consistent with research comparing point counts and ARUs when the geographic scale covered by each method is similar (Klingbeil and Willig 2015; Leach et al., 2016). Point counts also produce data on the entire community of birds (species and abundances) and can be readily analyzed with habitat data collected at each survey point to determine key habitat features important in predicting community composition (Styring et al., 2011). They also have the advantage of being relatively low-cost in terms of equipment, and they are quick to process once the field survey is complete (Klingbeil and Willig, 2015). However, they require a relatively intensive survey effort and skilled observers with the ability to detect most of the bird species by sight and sound. If less-skilled observers conduct the surveys, they may make recordings of their point counts including verbal notes about the appearance or sound of unidentified birds. The notes and recorded surveys can be shared with a more experienced collaborator who can likely make determinations from many of the unidentified observations using the verbal notes and cues in the recordings.
We recommend that point counts and associated habitat surveys be part of both full assessments and long-term monitoring efforts (with point count resurveys occurring every 5–10 years). A robustly-sampled dataset can serve as a baseline of community-level information. Distance sampling is a particularly useful approach because circumstances that may influence detection (observer differences, habitat change, etc.) can be identified and accounted for among survey years, habitats, and observers (Buckland et al., 2015).
Although point counts had the highest detection rates for overall species and RTEs, they did not detect all of the RTEs present at the study sites. RTEs are generally uncommon to rare (Figures 7A,B) and tend to require larger survey areas over longer time periods. Nine of the 13 RTE species detected by the survey methods used in this study, were detected during point count surveys. The remaining four species were detected by other methods: Berenicornis comatus (ARU, DC), Caprimulgus concretus (ARU), Centropus rectunguis (ARU), and Mulleripicus pulverulentus (ARU, DC). Three other species were detected by point counts at some locations, but with other methods at other locations: Buceros rhinoceros (BS, ARU; BN, DC), Psittacula longicauda (BN, DC), and Setornis criniger (BN, BB). Assessment approaches using more than one survey method have better chances of detecting more RTEs. These findings are consistent with other research suggesting that acoustic methods and point counts be used together (Digby et al., 2013; Darras et al., 2017; Wheeldon et al., 2019).
4.2.3 Bird Banding as the Cornerstone of Long-Term Monitoring
Mist-netting and bird banding provides the most detailed information on the population structure, demography, and seasonal patterns of avian cycles for understory forest birds (DeSante et al., 2001; Dunn and Ralph, 2004). However, it is not the ideal method for conducting comprehensive biodiversity inventories due to the limited spatial scale of capture compared to detections from other survey methods (Remsen and Good, 1996).
Bird banding provided the lowest daily richness rates in this study and required high sampling and pre-sampling effort. It is the most expensive of the four methods at the outset, but long-term equipment costs are relatively low with proper equipment care. Though banding has low detection rates for richness, it is the best way to document secretive and inconspicuous understory species that do not vocalize frequently including migratory species (Martin et al., 2010). During the study period, we banded migratory species not detected by other methods such as Larvivora cyane, a Least Concern species (IUCN Redlist) that is thought to be declining range wide. We also banded resident species that were rare, patchy, not-well known, and not detected with other methods including: Harpactes orrophaeus, an uncommon trogon with unknown breeding season and behavior, and Malacopteron albogulare–a rare species restricted to nutrient-poor forests such as kerangas and peatswamp. M. albogulare is a Near-threatened species with an unknown breeding biology. We netted, numerous individuals in breeding condition at BN over a 3-week period in March-April 2018.
Even among species that are readily detected during point counts, many are still relatively unknown in terms of breeding biology and population demography including species that are likely to be captured in nets such as Setornis criniger, and Copsychus pyrropygus. Because of the wealth of critical data that can be collected on birds in the hand, we recommend that bird banding an essential element of long-term monitoring efforts. Banding efforts could occur during wetter and drier months each year and would provide vital information on the seasonal cycles and population dynamics of many understudied species. Long-term monitoring efforts that included bird banding could result in valuable information on the vital rates such as productivity, survivorship, sex ratio, and dispersal. Such information could be used to more effectively predict population change and manage sensitive populations (Francis and Wells, 2003; Dunn and Ralph, 2004).
4.2.4 Dawn Chorus Recordings–When the Opportunity Arises
The use of recordings of the dawn chorus to rapidly inventory avifaunal diversity was an early and effective use of acoustic tools in the study of biodiversity (Parker, 1991). These surveys need to be conducted by people who are highly skilled at bird vocalization identification (Parker was reported to know the vocalizations of over 4,000 species). In this study, dawn chorus recordings had lower daily detection rates compared to point counts. This result contrasts with the findings of Parker, (1991). One likely cause for the difference is the amount of transect length covered each day which averaged 2 km for Parker and <1 km for our survey teams. To cover more transect during a 1-h dawn chorus survey, observers must be moving along trails or roads that are relatively clear and easy to navigate quickly. Observers must also be selective in recording species with the goals of documenting new species. The quality and power of the direction microphone used could also have an impact, but is likely not large in the case of this study. Dawn chorus recordings likely have the potential to detect as many or more species per day as point counts given those considerations.
There are challenges with the data from dawn chorus surveys in terms of comparability across sites and between time periods (Herzog et al., 2002). This is because the goal of the recordist is to document as many species as possible a dawn, which may result in changing effort across a survey on any given day. Additionally, advancement of passive methods has begun to replace this type of survey method due, in part, to the difficulty in finding the expertise needed (Krause and Farina, 2016). However, dawn chorus surveys could be undertaken opportunistically. They are useful in siting locations for future point count transects and bird banding plots. The recordings serve as a reference archive of the environment including presence of other vocal species (such as vocal mammals and frogs). They are also low cost in terms of equipment and post-survey processing time is relatively short. Although dawn chorus surveys conducted by less skilled observers do not document as many species (due to the less targeted nature of the recording), they are a very useful learning tool for observers and technicians who wish to improve their bird identification skills.
4.3 Implementation
Because organizations are often limited in time and resources available for assessment and monitoring, methods that are low cost, low effort, and that rapidly result in the needed data will be implemented more readily than methods that require higher investment in resources (Greenwood, 2007; Danielsen et al., 2008; Neate-Clegg et al., 2020). In practice, the issues of time, effort, expertise, and data quality are often at tension with one another with relatively low-cost approaches requiring more intensive quality control efforts (Wiggins et al., 2013).
4.3.1 Assembling Survey and Monitoring Teams: Partnerships and Knowledge Building
A challenging element of conducting assessments or implementing long-term monitoring is finding and assembling teams of people with the applicable knowledge and skills in the required timeframe. In much of North America and Europe, this challenge is met by hiring skilled applicants for short time periods, relying on volunteer participation, or hiring environmental consultants. There are strengths and weaknesses associated with each option in terms of cost, data integrity, and transparency. In countries that may not have a large volunteer base or many individuals with the relevant knowledge base, partnerships with NGOs or research institutions from other countries may be an effective approach (Danielsen et al., 2008). The expense of these collaborations varies in terms of cost-sharing and time, with collaborations that commit to local knowledge building having the greatest long-term success (Greenwood 2007; Danielsen et al., 2008).
For some methods, such as deployment of ARUs, collaborations could be relatively low cost with experienced partners providing training and troubleshooting to local researcher via remote workshops and tutorials. Data analysis could be collaborative with pattern-matching analysis and species determinations occurring via a shared analysis and data management platform. Other methods, such as point counts, may require in-person survey work and training. This could occur through a combination of workshops focused on species identification and survey methodology. More intensive knowledge-development, like that involved with bird banding, may take the form of intensive training workshops and development of skilled in-country banders who can then train others (Greenwood, 2007).
A large amount of what we know about bird populations in North America and parts of Europe comes from large community-science programs such as MAPS (Monitoring Avian Productivity and Survivorship, DeSante, 2001), Breeding Bird Survey (Ralph et al., 1995) and eBird (Aceves-Bueno et al., 2017). These efforts work when there are large numbers of people who watch birds recreationally. The popularity of birdwatching is growing around the world (e.g. Walther and White, 2018). Cultivating the advancement of a community-science culture among birdwatching communities will help broaden the knowledge base among local conservation-interested communities that can be used for long-term monitoring. Ensuring High Conservation Values over the long-term relies heavily on knowing the population patterns and processes of sensitive species in an area, which, in turn, relies on having a knowledgeable workforce and community base. Developing this knowledge base is a high priority to the long-term viability of the HCV process.
4.3.2 Collection, Sharing, and Archiving of Sound, Image, and Observational Data and Metadata
Each method described in this study can generate diagnostic evidence of species presence such as a sound recording or photograph, though not every species can be effectively documented in a given survey or with a given method. For example, birds not readily captured in mist nets are difficult to photograph in a way that is diagnostic, not all species vocalize regularly, and some rarely vocalize at all making recording difficult. But positive evidence in the form of image or sound is a useful resource in documenting species presence as well as variation over space and time. We recommend that, whenever possible, assessment and monitoring methods have accompanying sound or image data and that all data and metadata be shared broadly (Wiggins et al., 2013). Point count surveys can be recorded with either a good quality digital recorder and directional microphone, or a smart device set for high-resolution recording. Dawn chorus surveys and autonomous recorders generate large amounts of acoustic evidence, and birds captured and processed during banding activities can be photographed at high resolution and with macro- and microscope lenses to evaluate plumage and molt. Making these media available to the broader scientific and conservation communities improves overall understanding of species distributions, variations, and seasonal patterns (Michener 2015). Many databases are available to professional and community scientists such as iNaturalist (https://www.inaturalist.org/home), xeno-canto (https://www.xeno-canto.org/), eBird (https://ebird.org/home), and gbif (https://www.gbif.org/). Crowdsourced analytical tools such as R and Arbimon (https://arbimon.rfcx.org/) have made it increasingly possible for researchers and interested community members to undertake collaborative research by sharing templates and analysis results (Lahoz-Monfort and MacGrath, 2021). These tools provide a venue for more people to participate in documenting diversity, and we are learning more about species distributions and uses of disturbed habitats as a result. Although there are risks of sharing data, especially for species that are threatened by the illegal wildlife trade, protections are in place in many cases that help prevent this problem (Tullock et al., 2018).
4.4 The Value of Disturbed Landscapes
Five timber plantations and other production landscapes often have limited access, and we therefore, know much less about these areas compared to densely populated areas or public-access protected areas. Research from SPF area provides insight into an industrial production landscape. Over a 15-year period, research teams, produced a relatively comprehensive species list for birds and other taxa. Despite a large amount of effort, new species are being added to the list regularly. This is likely due, in part, to patterns of commonness and rarity in high-diversity ecosystems, and, in part, to transients passing through an area, and in part due to changes in habitat and vegetation relating to larger scale patterns of land use and changes in climate. One likely, but understudied cause is the nomadic nature of many Bornean species and how patterns of large-scale movement and population change are influenced by weather and climate cycles that are longer than 1 year in duration. Species such as Sus barbatus and Helarctos malayanus undergo long-term patterns of population growth and decline associated with El Nino events (Curran and Leighton, 2000; Wong et al., 2005). Other species such as Carpococcyx radiceus are known to follow Sus barbatus movements, and others such as Pityriasis gymnocephala, Corydon sumatranus, are nomadic, but the root causes are still unknown. As these species face multiple population threats, understanding their basic biology is increasingly important to their long-term survival. Sensitive species use disturbed and degraded natural forests (Edwards et al., 2011) as well as novel ecosystems such as exotic timber plantation if the conditions in the environment are suitable (Sheldon et al., 2010; Styring et al., 2011; Stying et al., 2018). It is important that we understand the role of disturbed landscapes including production landscapes to these animals.
Data Availability Statement
The original contributions presented in the study are included in the article/Supplementary Materials, further inquiries can be directed to the corresponding author.
Ethics Statement
The animal study was reviewed and approved by The Evergreen State College Animal Care Committee.
Author Contributions
AS was involved in fundraising, research design, field work, data analysis, and manuscript preparation. JU and RR were involved in fundraising, research implementation and priority-setting, and field work for all field seasons. KK was responsible for a large portion of data analysis and paper writing. DF was responsible for field implementation of avian banding and oversaw logistics of many field operations from 2017–19. NM, AJ, and LJ undertook extensive field work and logistics from 2006 to 2019. MT, KDS, KNS, and LD undertook extensive field work from 2017–19 as did MN who also organized datasets and generated much needed maps. LG undertook field work in 2019 and was responsible for all technical aspects of autonomous design and implementation. BN NS, PH, and BT, did extensive field work in 2017, 2018, and 2019 respectively and DJ helped bird logistical efforts in 2006–2007.
Funding
Research was funded by The Evergreen State College Foundation Grant for Faculty, The Evergreen State College Sponsored Research Award for Faculty, and Sarawak Forestry Corporation.
Conflict of Interest
JU, NM, LJ, AJ, MT, MN, KDS, KNS, LS, BA, and DJ were employed by the company Grand Perfect Sdn Bhd., DF of Ornitholo-logistics was employed by The Evergreen State College.
The remaining authors declare that the research was conducted in the absence of any commercial or financial relationships that could be construed as a potential conflict of interest.
Publisher’s Note
All claims expressed in this article are solely those of the authors and do not necessarily represent those of their affiliated organizations, or those of the publisher, the editors and the reviewers. Any product that may be evaluated in this article, or claim that may be made by its manufacturer, is not guaranteed or endorsed by the publisher.
Acknowledgments
We thank The Evergreen State College Foundation and Sarawak Forestry Corporation for financial support. Dave P. Edwards provided original recordings of several species for pattern-matching analysis. Frederick H. Sheldon provided support in the field and over time with field help and advice.
Supplementary Material
The Supplementary Material for this article can be found online at: https://www.frontiersin.org/articles/10.3389/fenvs.2022.783794/full#supplementary-material
References
Aceves-Bueno, E., Adeleye, A. S., Feraud, M., Huang, Y., Tao, M., Yang, Y., et al. (2017). The Accuracy of Citizen Science Data: a Quantitative Review. Bull. Ecol. Soc. Am. 98, 278–290. doi:10.1002/bes2.1336
Arbimon RFCx (2021). Rainforest Connection® Arbimon. Available at: https://arbimon.rfcx.org/(Accessed September 21, 2021).
Areendran, G., Sahana, M., Raj, K., Kumar, R., Sivadas, A., Kumar, A., et al. (2020). A Systematic Review on High Conservation Value Assessment (HCVs): Challenges and Framework for Future Research on Conservation Strategy. Sci. Total Environ. 709, 135425. doi:10.1016/j_scitotenv.2019.135425
Bradshaw, C. J., Sodhi, N. S., and Brook, B. W. (2009). Tropical Turmoil: a Biodiversity Tragedy in Progress. Front. Ecol. Environ. 7, 79–87. doi:10.1890/070193
Brown, E., Dudley, N., Lindhe, A., Muhtaman, D. R., Stewart, C., and Synnott, T. (2013). Common Guidance for the Identification of High Conservation Values. HCV Resource Network. Available at: https://hcvnetwork.org/wp-content/uploads/2018/03/HCVCommonGuide_English.pdf (Accessed September 21, 2021).
Buckland, S. T., Rexstad, E. A., Marques, T. A., and Oedekoven, C. S. (2015). Distance Sampling: Methods and Applications. Switzerland: Springer.
Carlson, K. M., Heilmayr, R., Gibbs, H. K., Noojipady, P., Burns, D. N., Morton, D. C., et al. (2017). Effect of Oil Palm Sustainability Certification on Deforestation and Fire in Indonesia. Proc. Natl. Acad. Sci. U.S.A. 115, 121–126. doi:10.1073/pnas.1704728114
Carrasco, L. R., Larrosa, C., Milner-Gulland, E. J., and Edwards, D. P. (2014). A Double-Edged Sword for Tropical Forests. Science 346, 38–40. doi:10.1126/science.1256685
Cellis-Murello, A., Deppe, J. L., and Ward, M. P. (2012). Effectiveness and Utility of Acoustic Recordings for Surveying Tropical Birds. J. Field Ornithol. 83, 166–179. doi:10.1111/j.1557-9263.2012.00366.x
Cerqueira, M. C., Cohn-Haft, M., Vargas, C. F., Nader, C. E., Andretti, C. B., Costa, T. V. V., et al. (2013). Rare or Elusive? A Test of Expert Knowledge about Rarity of Amazon Forest Birds. Divers. Distrib. 19, 710–721. doi:10.1111/ddi.12033
Chen, J., Innes, J. L., and Tikina, A. (2010). Private Cost-Benefits of Voluntary Forest Product Certification. Int. For. Rev. 12, 1–12. doi:10.1505/ifor.12.1.1
CITES (2021). Appendices I, II, & III. Available at: https://cites.org/eng/app/appendices.php (Accessed September 21, 2021).
Curran, L. M., and Leighton, M. (2000). Vertebrate Responses to Spatiotemporal Variation in Seed Production of Mast-Fruiting Dipterocarpaceae. Ecol. Monogr. 70, 101–128. doi:10.1890/0012-9615(2000)070[0101:vrtsvi]2.0.co;2
Danielsen, F., Burgess, N. D., Balmford, A., Donald, P. F., Funder, M., Jones, J. P., et al. (2008). Local Participation in Natural Resource Monitoring: a Characterization of Approaches. Conserv. Biol. 23, 31–42. doi:10.1111/j.1523-1739.2008.01063.x
Darras, K., Batáry, P., Furnas, B. J., Grass, I., Mulyani, Y. A., and Tscharntke, T. (2019). Autonomous Sound Recording Outperforms Human Observation for Sampling Birds: a Systematic Map and User Guide. Ecol. Appl. 29, e01954–1265. doi:10.1002/eap.1954
Darras, K., Batáry, P., Furnas, B. J., Celis-Murillo, A., Van Wilgenburg, S. L., Mulyani, Y. A., et al. (2017). Comparing the Sampling Performance of Sound Recorders versus Point Count Bird Surveys: a Meta Analysis. J. Appl. Ecol. 55, 2575–2586. doi:10.1111/1365-2664.13229
Darras, K., Furnas, B., Fitriawan, I., Mulyani, Y., and Tscharntke, T. (2018). Estimating Bird Detection Distances in Sound Recordings for Standardizing Detection Ranges and Distance Sampling. Methods Ecol. Evol. 9, 1928–1938. doi:10.1111/2041-210x.13031
DeSante, D. F., Burton, K. M., Kaschube, D. R., Velez, P., Froehlich, D., and Albert, S. (2021). MAPS Manual: 2021 Protocol. Point Reyes Station, CA: The Institute for Bird Populations.
DeSante, D. F. (2001). Monitoring Avian Productivity and Survivorship (MAPS): a Sharp rather Than Blunt Tool for Monitoring and Assessing Landbird Populations. Widllife, 511–521. doi:10.1007/978-94-011-2868-1_39
DeSante, D. F., Nott, M. P., and O’Grady, D. R. (2001). Identifying the Proximate Demographic Cause(s) of Population Change by Modelling Spatial Variation in Productivity, Survivorship, and Population Trends. Ardea 89, 185–207.
Digby, A., Towsey, M., Bell, B. D., and Teal, P. D. (2013). A Practical Comparison of Manual and Autonomous Methods for Acoustic Monitoring. Methods Ecol. Evol. 4, 675–683. doi:10.1111/2041-210x.12060
Dinerstein, E., Vynne, C., Sala, E., Joshi, A. R., Fernando, S., Lovejoy, T. E., et al. (2019). A Global Deal for Nature: Guiding Principles, Milestones, and Targets. Sci. Adv. 5 (4), eaaw2869. doi:10.1126/sciadv.aaw2869
Dow, R. A. (2013). Drepanosticta burbachi spec. nov, from Sarawak, Borneo, a new species allied to D. dulitensis kimmins, with notes on related species (Zygoptera: Platystictidae). Odonatologica 42, 203–210.
Dow, R. A., and Orr, A. G. (2012). Telosticta, a new damselfly genus from Borneo and Palawan (Odonata: Zygoptera: Platystictidae). Raffles Bull. Zoology 60, 361–397.
Dow, R. A. (2020). Revision of the genus Coeliccia Kirby in Borneo part III: two new species from C. membranipes-group from Sarawak and Brunei (Odonata: Zygoptera: Platycnemididae). Zootaxa, 4890. doi:10.11646/zootaxa.4890.4.2
Dufrene, M., and Legendre, P. (1997). Species Assemblages and Indicator Species: The Need for a Flexible Asymmetrical Approach. Ecological 67, 345–366.
Dunn, E., and Ralph, C. J. (2004). Use of mist nets as a tool for bird population monitoring. Stud. Avian Biol. 29, 1–6.
Edwards, D. P., Hodgson, J. A., Hamer, K. C., Mitchell, S. L., Ahmad, A. H., Cornell, S. J., et al. (2010). Wildlife-friendly oil palm plantations fail to protect biodiversity effectively. Conserv. Lett. 3, 236–242. doi:10.1111/j.1755-263x.2010.00107.x
Edwards, D. P., Larsen, T. H., Docherty, T. D. S., Ansell, F. A., Hsu, W. W., Derhé, M. A., et al. (2011). Degraded Lands Worth Protecting: The Biological Importance of Southeast Asia's Repeatedly Logged Forests. Proc. R. Soc. B 278, 82–90. doi:10.1098/rspb.2010.1062
Ellis, W. J. (2007). “The Planted Forests Project” in Proceedings of the Regional Conference of Biodiversity Conservation in Tropical Planted Forests in Southeast Asia,”. Editors R. Stuebing, J. Unggang, J. Ferner, and B. Giman (Kuching: Forest Department, Sarawak Forestry Corporation, Grand Perfect Sdn Bhd), 13–15.
Forest Stewardship Council (2015). FSC International Standard: FSC principles and criteria for forest stewardship. FSC-STD-01-001 V 5-2 EN. 2015. Available at: https://fsc.org/en/document-centre/documents/resource/392 (Accessed September 21, 2021).
Forestry Department of Sarawak (1998). Wildlife Protection Ordinance: Schedule I Parts 1. Available at: https://forestry.sarawak.gov.my/page-0-205-790-Totally-Protected-Animals-of-Sarawak.html and 2 https://forestry.sarawak.gov.my/page-0-206-791-Protected-Animals-of-Sarawak.html (Accessed September 21, 2021).
Francis, C. M., and Wells, D. R. (2003). “The bird community at Pasoh: composition and population dynamics,” in Pasoh: Ecology of a Lowland Rain Forest in Southeast Asia. Editors T. Okuda, N. Manokaran, Y. Matsumoto, S. C. Thomas, and P. S. Ashton (Tokyo, Japan: Springer-Verlag), 375–393. doi:10.1007/978-4-431-67008-7_27
Furumo, P. R., Barrera-Gonzalez, E. I., Espinosa, J. C., Gomez-Zuluaga, G. A., and Aide, T. M. (2019). Improving long-term biodiversity monitoring on certified oil palm plantations in Columbia by centralizing efforts at the sector level. Front. For. Glob. Change 2, 1–7. doi:10.3389/ffgc.2019.00046
Gaston, K. J. (1994). “What is rarity?,” in Rarity. Editor K. J. Gaston (Dordrecht: Springer), 1–21. doi:10.1007/978-94-011-0701-3_1
Giam, X. (2017). Global Biodiversity Loss from Tropical Deforestation. Proc. Natl. Acad. Sci. U.S.A. 114, 5775–5777. doi:10.1073/pnas1706264114
Greenwood, J. D. (2007). Citizens, science, and bird conservation. J. Ornithol. 148, S77–S124. doi:10.1007/s10336-007-0239-9
Grinang, J., and Ng, P. K. L. (2021). A new species of the genus Arachnothelphusa Ng, 1991 (Crustacea: Decapoda: Gecarcinucidae) from a limestone cave in Sarawak (Malaysian Borneo). Raffles Bull. Zoology 69, 1–7. doi:10.26107/RBZ-2021-0001
Griscom, E. W., and Goodman, R. C. (2015). Reframing the sharing vs sparing debate for tropical forestry landscapes. J. Trop. For. Sci. 27, 145–147.
Hall, G., Webb, G., and Manolis, C. (2007). “Conservation management plan for the Planted Forest Zone (PFZ), Bintulu, Sarawak” in,” in Proceedings of the Regional Conference of Biodiversity Conservation in Tropical Planted Forests in Southeast Asia. Editors R. Stuebing, J. Unggang, J. Ferner, and B. Giman (Kuching: Forest Department, Sarawak Forestry Corporation, Grand Perfect Sdn Bhd), 31–35.
Hui, T. H., and Lim, K. K. P. (2007). “The Freshwater Fishes of the Binyo-Penyilam and Bukit Sarang Conservation Areas, Bintulu Division, Sarawak,” in Proceedings of the Regional Conference of Biodiversity Conservation in Tropical Planted Forests in Southeast Asia. Editors R. Stuebing, J. Unggang, J. Ferner, B. Giman, and K. K. Ping (Kuching: Forest Department, Sarawak Forestry Corporation, Grand Perfect Sdn Bhd), 79–82.
Inger, R. F., Stuebing, R. B., and Stuart, B. L. (2006). The Tadpole of Rana Glandulosa Boulenger (Anura: Randiae). Raffles Bull. Zoology 54, 465–467.
IUCN (2021). The IUCN Red List of Threatened Species. Version 2021-2. Available at: https://www.iucnredlist.org (Accessed September 20, 2021).
Kiew, R., and Julia, S. (2013). Two new Monophyllaea (Gesneriaceae) Species from Sarawak, Borneo. Phytotaxa 129, 59–64. doi:10.11646/phytotaxa.129.1.6
Kiew, R., and Sang, J. (2009). Seven new Species of Begonia (Begoniaceae) From the Ulu Merirai and Bukit Sarang Limestone Areas in Sarawak, Borneo. Gard. Bull. Singap. 60, 351–372.
Klingbeil, B. T., and Willig, M. R. (2015). Bird Biodiversity Assessments in Temperate Forest: the Value of Point Count Versus Acoustic Monitoring Protocols. PeerJ 3, e973. doi:10.7717/peerj.973
Kollert, W., and Lagan, P. (2007). Do Certified Tropical Logs Fetch a Market Premium? For. Policy Econ. 9, 862–868. doi:10.1016/j.forpol.2006.03.005
Krause, B., and Farina, A. (2016). Using Ecoacoustic Methods to Survey the Impactsof Climate Change on Biodiversity. Biol. Conserv. 195, 245–254. doi:10.1016/j.biocon.2016.01.013
Lahoz-Monfort, J. J., and MaGrath, M. J. L. (2021). A Comprehensive Overview of Technologies for Species and Habitat Monitoring and Conservation. Bioscience 71, 1038–1062. doi:10.1093/biosci/biab073
Leach, E. C., Burwell, C. J., Ashton, L. A., Jones, D. N., and Kitching, R. L. (2016). Comparison of Point Counts and Automated Acoustic Monitoring: Detecting Birds in a Rainforest Biodiversity Survey. Emu - Austral Ornithol. 116, 305–309. doi:10.1071/mu15097
Lin, C.-W., Chung, S.-W., and Peng, C.-I. (2014). Three new species of Begonia (sect. Petermannia, Begoniaceae ) from Sarawak, Borneo. Phytotaxa 191, 129–140. doi:10.11646/phytotaxa.191.1.8
Lin, W., Chung, S-W., and Peng, C-I. (2014). Begonia Hosensis (sect. Reichenheimia, begoniaceae), a new Species from Sarawak, Malaysia. Taiwania 59, 326–330. doi:10.6165/tai.2014.59.4.326
Lin, W., Chung, S-W., and Peng, C-I. (2017). Eleven new Species of Begonia (Begoniaceae) from Sarawak, Borneo. Taiwania 62, 219–251. doi:10.6165/tai.2017.62.219
Martin, T. E., Blackburn, G. A., and Simcox, W. (2010). An Assessment of the Effectiveness of Two Methods in Describing A Neotropical Cloud Forest Bird Community. Ornitol. Neotropical 21, 131–147.
McCune, B., and Mefford, M. J. (2018). PC-Ord for Windows. Multivariate Analysis of Ecological Data. Version 7.08. Glenedon Beach: MjM Software.
Meijaard, E., and Sheil, D. (2012). The Dilemma of Green Business in Tropical Forests: How To Protect What It Cannot Identify. Conserv. Lett. 5, 342–348. doi:10.1111/j.1755-263x.2012.00252.x
Metcalf, O. C., Barlow, J., Marsden, S., Gomes de Moura, N., Berenguer, E., Ferreira, J., et al. (2021). Optimizing Tropical Forest Bird Surveys Using Passive Acoustic Monitoring and High Temporal Resolution Sampling. Remote Sens. Ecol. Conserv. 8, 45–56. doi:10.1002/rse2.227
Michener, W. K. (2015). Ecological Data Sharing. Ecol. Inf. 29, 33–44. doi:10.1016/j.ecoinf.2015.06.010
Neate-Clegg, M. H. C., Horns, J. J., Adler, F. R., Kemahlı Aytekin, M. Ç., and Şekercioğlu, Ç. H. (2020). Monitoring The World's Bird Populations With Community Science Data. Biol. Conserv. 248, 108653. doi:10.1016/j.biocon.2020.108653
Ng, P. K. L. (2021). Geosarma sodalis, a new Species of Vampire Crab (Crustacea, Brachyura, Sesarmidae) from a Limestone Cave in Central Sarawak, Malaysia. Zookeys 1031, 133–141.
North American Banding Council (2001). The North American Banders’ Study Guide. NABC Publications Committee. Available at: http://www.nabanding.net/wp-content/uploads/2012/04/STUDYGUIDE1.pdf.
Phillipps, Q., and Phillipps, K. (2014). Phillips’ Guide to the Birds of Borneo: Sabah, Sarawak, Brunei and Kalimantan. 3rd ed. Princeton, New Jersey: PrincetonJohn Beaufoy.
Phillipps, Q., and Phillipps, K. (2016). Phillips’ Guide to the Mammals of Borneo and Their Ecology: Sabah, Sarawak, Brunei, and Kalimantan. 3rd ed. Princeton, New Jersey: PrincetonJohn Beaufoy.
Purnomo, H., Okarda, B., Dermawan, A., Ilham, Q. P., Pacheco, P., Nurfatriani, F., et al. (2020). Reconciling oil Palm Economic Development and Environmental Conservation in Indonesia: A Value Chain Dynamic Approach. For. Policy Econ. 111, 102089. doi:10.1016/j.forpol.2020.102089
R Core Team. (2021). R4.1.0: A Language and Environment for Statistical Computing. Vienna, Austria: R Foundation for Statistical Computing. https://www.R-project.org/. (Accessed May 18, 2021).
Rahman, M. R. A., Achmadi, A. S., Tingga, R. C. T., and Hasan, N. H. (2010). A New Distributional Record of The Rare Bat Coelops Robinsoni from Sarawak, Malaysian Borneo. J. Trop. Biol. Conservation 7, 87–92.
Ralph, C. J., Droege, S., and Sauer, J. R. (1995). Managing and Monitoring Birds Using Point Counts: Standards And Applications. USDA For. Serv. Gen. Tech. Rep. 149, 161–168.
Remsen, J. V., and Good, D. A. (1996). Misuse Of Data From Mist-Net Captures To Assess Relative Abundance In Bird Populations. Auk 113, 381–398. doi:10.2307/4088905
Senior, M. J. M., Brown, E., Villalpando, P., and Hill, J. K. (2015). Increasing the Scientific Evidence Base in the “High Conservation Value” (HCV) Approach for Biodiversity Conservation in Managed Tropical Landscapes. Conserv. Lett. 8, 361–367. doi:10.1111/conl.12148
Sheldon, F. H., Styring, A., and Hosner, P. A. (2010). Bird Species Richness in a Bornean Exotic Tree Plantation: A Long-Term Perspective. Biol. Conserv. 143, 399–407. doi:10.1016/j.biocon.2009.11.004
Sollmann, R., Mohamed, A., Niedballa, J., Bender, J., Ambu, L., Lagan, P., et al. (2017). Quantifying Mammal Biodiversity Co-Benefits in Certified Tropical Forests. Divers. Distrib. 23, 317–328. doi:10.1111/ddi.12530
Stuebing, R. B. (2007). “Biodiversity Conservation in Theory And Practice: Lessons From The Planted Forest Zone, Sarawak,” in Proceedings of the Regional Conference of Biodiversity Conservation in Tropical Planted Forests in Southeast Asia. Editors R. Stuebing, J. Unggang, J. Ferner, and B. Giman (Kuching: Forest Department, Sarawak Forestry Corporation, Grand Perfect Sdn Bhd), 16–30.
Styring, A. R., Ragai, R., Unggang, J., Stuebing, R., Hosner, P. A., and Sheldon, F. H. (2011). Bird Community Assembly in Bornean Industrial Tree Plantations: Effects of Forest Age And Structure. For. Ecol. Manag. 261, 531–544. doi:10.1016/j.foreco.2010.11.003
Styring, A. R., Unggang, J., Jukie, A., Tateh, O., Megom, N., and Sheldon, F. H. (2018). Bird Community Structure in Native Forest Fragments And Acacia Mangium Plantations In Borneo. Wilson J. Ornithol. 130, 112–130. doi:10.1676/16-125.1
Tayleur, C., Balmford, A., Buchanan, G. M., Butchart, S. H. M., Ducharme, H., Green, R. E., et al. (2016). Global Coverage of Agricultural Sustainability Standards, And Their Role In Conserving Biodiversity. Conserv. Lett. 10, 610–618. doi:10.1111/conl.12314
The Economist Intelligence Unit (2021). An Eco-Awakening: Measuring Global Awareness, Engagement, And Action For Nature. Available at: https://files.worldwildlife.org/wwfcmsprod/files/Publication/file/93ts5bhvyq_An_EcoWakening_Measuring_awareness__engagement_and_action_for_nature_ FINAL_MAY_2021.pdf?_ga2.162883323.630328229.1631817695- 1444868052.1631817695 (Accessed September 21, 2021).
Trolliet, F., Vogt, M., and Trolliet, F. (2019). “How Does Fsc Certification Oof Forest Management Benefit Conservation Of Biodiversity?” in Sustainability and Certification Schemes in the Agricultural and Natural Resource Sectors. Editor M. Vogt (London: Routledge), 93–110. doi:10.4324/9780203701737-4
Tulloch, A. I. T., Auerbach, N., Avery-Gomm, S., Bayraktarov, E., Butt, N., Dickman, C. R., et al. (2018). A Decision Tree for Assessing the Risks and Benefits of Publishing Biodiversity Data. Nat. Ecol. Evol. 2, 1209–1217. doi:10.1038/s41559-018-0608-1
Wong, S., Servheen, C., Ambu, L., and Norhayati, A. (2005). Impacts of Fruit Production Cycles on Malayan sun Bears and Bearded Pigs in Lowland Tropical Forest of Sabah, Malaysian Borneo. J. Trop. Ecol. 21, 627–639. doi:10.1017/s0266467405002622
Walther, B. A., and White, A. (2018). The Emergence of Birdwatching in China: History, Demographics, Activities, Motivations, and Environmental Concerns of Chinese Birdwatchers. Bird. Conserv. Int. 28, 337–349. doi:10.1017/s0959270917000557
Wheeldon, A., Mossman, H. L., Sullivan, M. J. P., Mathenge, J., and de Kort, S. R. (2019). Comparison of Acoustic and Traditional Point Count Methods to Assess Bird Diversity and Composition In the Aberdare National Park, Kenya. Afr. J. Ecol. 57, 168–176. doi:10.1111/aje.12596
Wiggins, A., Bonney, R., Graham, E., Henderson, S., Kelling, S., Littauer, R., et al. (2013). Data Management Guide for Public Participation in Scientific Research. Albuquerque, NM: DataONE.
Wilcove, D. S., and Koh, L. P. (2010). Addressing the Threats to Biodiversity from Oil-Palm Agriculture. Biodivers. Conserv. 19, 999–1007. doi:10.1007/s10531-009-9760-x
WWF (2009). High Conservation Value Forest (Hcvf) Toolkit for Malaysia: A National Guide fFor Identifying, Managing and Monitoring High Conservation Value Forests. Available at: https://hcvnetwork.org/wp-content/uploads/2018/05/2009HCVF-Toolkit-Malaysia_english.pdf (Accessed September 21, 2021).
Keywords: high conservation value, rare threatened and endemic species, biodiversity, avifauna, production landscape, native forest, timber plantation
Citation: Styring AR, Unggang J, Ragai R, Kueffner K, Froehlich D, Megom N, Joseph L, Jukie A, Tarang M, Nazrin M, Sulok K, Sekina K, Setia LD, Giannone L, Aron BN, Swartz N, Hyde P, Tyler B and James D (2022) Determining High Conservation Values in Production Landscapes: Biodiversity and Assessment Approaches. Front. Environ. Sci. 10:783794. doi: 10.3389/fenvs.2022.783794
Received: 27 September 2021; Accepted: 13 June 2022;
Published: 06 July 2022.
Edited by:
Yudi Setiawan, IPB University, IndonesiaReviewed by:
Mohammad Imam Hasan Reza, Centre for Environment and Sustainability, BangladeshSaiful Mansor, National University of Malaysia, Malaysia
Copyright © 2022 Styring, Unggang, Ragai, Kueffner, Froehlich, Megom, Joseph, Jukie, Tarang, Nazrin, Sulok, Sekina, Setia, Giannone, Aron, Swartz, Hyde, Tyler and James. This is an open-access article distributed under the terms of the Creative Commons Attribution License (CC BY). The use, distribution or reproduction in other forums is permitted, provided the original author(s) and the copyright owner(s) are credited and that the original publication in this journal is cited, in accordance with accepted academic practice. No use, distribution or reproduction is permitted which does not comply with these terms.
*Correspondence: Alison R. Styring, styringa@evergreen.edu