SmartAirQ: A Big Data Governance Framework for Urban Air Quality Management in Smart Cities
 Akshara Kaginalkar
 Shamita Kumar2
  Neelesh Kharkar
- 1Centre for Development of Advanced Computing, Pune, India
- 2Institute of Environment Education and Research, Bharati Vidyapeeth Deemed University, Pune, India
- 3Central Pollution Control Board, New Delhi, India
- 4Center for Excellence in Disaster Mitigation and Management, Indian Institute of Technology Roorkee, Roorkee, India
- 5Department of Geological Sciences, Jackson School of Geosciences, The University of Texas at Austin, Austin, TX, United States
- 6Department of Civil, Architectural, and Environmental Engineering, Cockrell School of Engineering, The University of Texas at Austin, Austin, TX, United States
Rapid urbanization across the world has put an enormous burden on our environment. Cities from developing countries, in particular, are experiencing high air pollution levels. To address this challenge, the new WHO global air quality guidelines and various nations are mandating cities to implement clean air measures. However, these implementations are largely hindered by limited observations, siloed city operations, absence of standard processes, inadequate outreach, and absence of collaborative urban air quality management (UAQM) governance. The world is experiencing transformative changes in the way we live. The 4th industrial revolution technologies of artificial intelligence, Internet of Things, big data, and cloud computing bridge gaps between physical, natural, and personal entities. Globally, smart cities are being promulgated on the premise that technologies and data aid in improving urban services. However, in many instances, the smart city programs and UAQM services may not be aligned, thereby constraining the cumulative advantage in building urban resilience. Considering the potential of these technologies as enablers of environmental sustainability, a conceptual urban computing framework “SmartAirQ” for UAQM is designed. This interdisciplinary study outlines the SmartAirQ components: 1) data acquisition, 2) communication and aggregation, 3) data processing and management, 4) intelligence, 5) application service, 6) high-performance computing- (HPC-) cloud, and 7) security. The framework has integrated science cloud and urban services aiding in translating scientific data into operations. It is a step toward collaborative, data-driven, and sustainable smart cities.
1 Introduction
Globally, growing economic opportunities fuel rapid urbanization (United Nations, 2019). While aiding the economy, this growth is affecting the environment and living. For instance, air pollution is among the top five global causes of mortality (WHO, 2018; Lelieveld et al., 2020). At the same time, short- and long-term pollution exposure have severe health impacts, such as chronic respiratory diseases, asthma, cancer, and dementia (Balakrishnan et al., 2019). For emerging economies, this burden is unproportionate (Landrigan et al., 2018; Anenberg et al., 2019). For example, air pollution is a major health emergency in India, with 1.67 million deaths, accounting for 17.8% of total deaths (Pandey, 2021). Over 100 Indian cities exceed the National Air Quality and WHO standards (CPCB, 2019). This air pollution burden has translated into incremental health expenses, causing a loss of about $95 billion, amounting to a 3% of Indian GDP in 2019 (CII, Dalberg, 2021). Recently, the COVID-19 pandemic has exacerbated it (Achakulwisut et al., 2019; Khan et al., 2021).
Governmental programs, such as the national clean air program and smart city initiatives, are steps toward addressing these challenges (India Smart City, 2015; CPCB, 2019). However, these programs often run in parallel, thereby diminishing the opportunity to synchronize the activities toward the common goal of improving quality of life. Though pollution mitigation policies are defined, a significant gap remains when implementing them (UNEP, 2021). Consequently, smart cities struggle to show sustainability benefits (Komninos et al., 2015; Parisar, 2020). With less than a decade remaining for Sustainable Development Goals 2030, there is an urgent need for overarching solutions for cities.
Data-driven solutions are important for monitoring the progress toward sustainability goals. Its criticality is reflected in the statement of the United Nations Secretary-General in 2018, “The availability of quality, accessible, open, timely and disaggregated data is vital for evidence based decision-making and the full implementation of the 2030 Agenda and realization of its ambitions of leaving no one behind.” Accordingly, integrated impact and data-based environmental services are increasingly promoted (Baklanov et al., 2018; González et al., 2021). These services entail seamless access to interdisciplinary data and processing resources for different stakeholders (Bibri and Krogstie, 2020).
Such a service, urban air quality management (UAQM), encompasses multi-sectorial functions, data and information exchanges on pollution sources, mitigation, health burden, socioeconomic impacts, and policy formulation. For its effectiveness, real-time and near-real-time data communication is required. However, these data are often created in silos or not available in cross-sectorial usable form, necessitating integrated data governance translating data into knowledgeable information. Despite the number of smart city concepts, research on urban data governance for sustainable development is underestimated (Paskaleva et al., 2017).
Smart city technologies, such as the 4th industrial revolution (4IR) technologies of Internet of Things (IoT), artificial intelligence (AI), and cloud computing, are providing solutions to these problems by ubiquitous data creation, efficient predictive and prescriptive analysis, and effective information dissemination (ITU, 2015; Mabkhot, 2021). In this context, urban computing (UC) is an emerging theme connecting urban sensing, data, and city services such as environment, transport, energy, and economy, bringing insights into sustainable operations (Kindberg et al., 2007; ITU 2020; Lytras et al., 2020).
Given the significant role of UC in urban sustainability, this study provides a conceptual framework for next-generation UAQM as part of ongoing interdisciplinary research on developing environmental cyberinfrastructure such as the system of systems (Kaginalkar et al., 2022). The ultimate objective is to provide a cross-sector data governance ecosystem for smart cities built from the UC framework derived from our understanding of empirical evidence of 4IR technology applications (Kaginalkar et al., 2021) and participative research (Kaginalkar et al., in preparation).
The study presents the design of SmartAirQ—an UC framework with multi-sector real-time and strategic data governance and technology integration. SmartAirQ is a hybrid cross-sector data framework with varied stakeholders/users, such as researchers (atmosphere, air quality, health, economics, machine learning (ML), and information technology), governance (policymaker, municipality environment department, and regulatory boards), citizens, and non-governmental organizations as end users. The system has a high-end distributed backend data and computing ecosystem and user-specific decision support system (DSS), disseminating easily understandable information. Although the framework is described with Indian smart cities, the FAIR (Findable, Accessible, Interoperable, Reusable) data-based architecture is scalable across world cities (Wilkinson et al., 2016). With worldwide air pollution concerns, SmartAirQ has broad relevance and is likely to be suitable for emerging cities (Pinder et al., 2019).
Due to the space limitation, this study focuses on the data governance and framework features. This study is organized as follows: Section 2 discusses the air quality and smart city context, Section 3 describes the methodology, Section 4 discusses the SmartAirQ building blocks considered for the design, Section 5presents the derived conceptual SmartAirQ architecture, and Section 6 has representative use cases, highlighting the data flow and stakeholder actions. This study is summarized in Section 7.
2 The Context
Urban air pollution is influenced by geography, meteorology, morphology, natural events, and anthropogenic activities (Oke et al., 2017). Apart from local impact, long-range transport contributes to pollution and climate change (Baklanov et al., 2016). The UAQM is determined by the information on hyper-local pollutant source-concentration, its residency period, transport from other regions, and pollution impacts on socioeconomic conditions.
Managing the urban air quality is a cross-functional process, from identifying emission sources to actual removal from the atmosphere for protecting human beings (Gulia et al., 2015). UAQM is often supported by scientific research, policies, continuous assessment of mitigation measures, and awareness programs (Baklanov et al., 2020). It has close linkages with other city functions, such as solid waste management, traffic, infrastructure, health, industry, urban planning, and social welfare, requiring timely access to multivariate data. Improvement in its effectiveness necessitates city governments for capacity building of data governance and intelligent decision-making (UNEP, 2021).
In this context of urban governance, globally, smart cities are promulgated as engines of urban resiliency, attracting the attention of researchers, practitioners, and governments (Albino et al., 2015). Often, in these smart cities, information and communication technology is considered an enabler for social, economic, and environmental transitions and collaborative governance (Nam and Pardo, 2011). A number of studies have attributed technology key characteristics to these transitions to smart cities, such as big data (Hashem et al., 2016; Paskaleva et al., 2017; Bibri and Krogstie, 2020), IoT (Zanella et al., 2014; Ahlgren et al., 2016), AI (Azevedo Guedes et al., 2018; Allam and Dhunny, 2019), cloud computing (Khan et al., 2015), crowdsourcing (Stojanovic et al., 2016; Alvear et al., 2018), software architecture (Viqueira et al., 2020; Majumdar et al., 2021), and city services (Lv et al., 2018; Badii et al., 2019). Despite these studies, standardization of UAQM data acquisition, advanced data processing, and stakeholder participation methods are limited (Creutzig et al., 2019).
In this context, India’s smart city mission provides an opportune platform for environmental data governance (India Smart City, 2015). Even though the mission is expected to address environmental sustainability, there is a disconnect between the smart city services and plans mandated by the national clean air program (CPCB, 2019). Moreover, current smart cities are driven by technology vendors or built infrastructure and have a limited focus on environmental services (Randhawa and Kumar, 2017; Smith et al., 2019). Even through some air quality information portals with in situ1 data, low-cost sensors (LCS),2 and model data for a few Indian cities (Beig et al., 2015; Jena et al., 2021) are available, a multi-functional participative DSS across the value chain of UAQM is not yet evident (Parisar, 2020; Verma, 2021). Consequently, cities face implementation ambiguity, siloed operations of stakeholders, and limited progress toward pollution reduction. These gaps necessitate a data and technology ecosystem enabling seamless cross-sector functions.
UC plays a multi-faceted role in UAQM with operation digitalization, real-time data acquisition, data processing, and dissemination. For instance, IoT helps cities access granular city data by connecting physical systems and humans seamlessly (Toma et al., 2019). Fast data processing with AI and HPC-cloud services enables real-time data analytics and metadata sharing (Bibri, 2019). Above all, the open data priorities of smart cities are bringing values to cyber-physical-governance-human systems by accessing and hyper-looping back the data for further intelligence building (Wilkinson et al., 2016; Allam and Dhunny, 2019). Considering this potential, this study discusses design aspects of an institutionalized framework as a smart city service tool for data governance and individual decisions.
3 Methodology
The methodology is built to help answer the following research questions:
(1) What are the different data elements of UAQM in the context of emerging smart cities and the value they bring in as an interoperable system?
(2) How can technologies be optimally connected for cross-sector data acquisition, aggregation, processing, modeling, stakeholder participation, and dissemination?
(3) What can be the overarching design of UC-enabled UAQM as a standard platform, scalable across smart cities?
To address these questions, we adopted the triangulation method (Figure 1) of qualitative analysis by developing convergence evidence of causal relationships (Yin, 2016; Sekayi and Kennedy, 2017). It includes systematic framework analysis of UC evidence through literature review (Given, 2008), smart city case studies (Baškarada, 2014), and empirical insights through stakeholder analysis (Reed et al., 2009). Involving stakeholders in designing the environmental solutions is increasingly adopted as an effective way of co-production of climate services bringing the synergetic research-practice-research perspective (Lim et al., 2018; Vincent et al., 2018; Fragomeni et al., 2020). In accordance, we followed an idealized design approach, wherein “information on the futuristic system” is sought from the users, leading to product realization (Ballejos and Montagna, 2011).
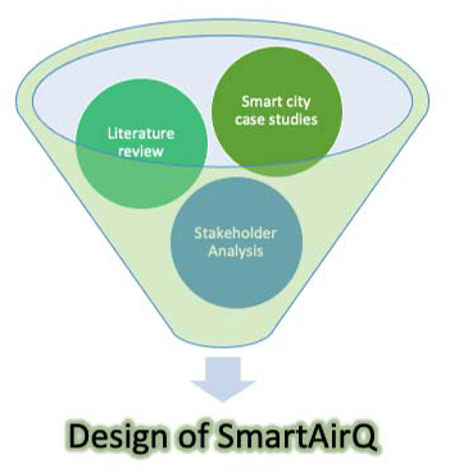
FIGURE 1. Triangulation qualitative research methodology with empirical evidence through literature review, case study analysis, and participative stakeholder interviews.
UAQM involves national, regional, and local cross-sector stakeholders. These can be classified as follows: 1) those that have a role in environmental governance and policies; 2) those who are enablers and solution providers broadly referred to as researchers and practitioners; and 3) those impacted by the decisions and solutions (e.g., industry and citizens). Eliciting stakeholder requirements and perception on data and technologies, we conducted focus interviews with ten participants, including members from national and state regulatory agencies, doctors, air quality modelers, policymakers, non-governmental organizations, National Green Tribunal members, and city environment managers. The participants were selected using purposive sampling by identifying the experts through their current role and prior project experience of authors with the experts. The interviews had the following broad questions:
(1) What are the functional inter-linkages between the stakeholders and how and which data are typically used or shared?
(2) What are the technical requirements and challenges faced while performing the air quality functions?
(3) How do stakeholders view the integration of smart city and UAQM services?
The interview responses were transcribed and coded with MAXQDA software by applying thematic typology (Kaginalkar et al., in preparation). It was found that UAQM in Indian cities has a strong dependence on interagency coordination, requiring knowledge and a decision-sharing ecosystem. The interview synthesis highlighted cross-sector gaps and data challenges and generated insights on the next generation UAQM with 4IR technologies. For example, an urgent need for intelligent cross-sectorial data access, such as real-time vehicular distribution on the road, was felt by the modelers. On one side, there is plethora of data being generated, on the other side, there is general sentiment that due to the limited access of the meta data, stakeholders can not perform air quality data analysis effectively. For instance, one non-governmental organization member shared that though 15-minute monitoring data is available from the pollution control board site, extracting the quality controlled data for specific locality or duration is time-consuming. The discussions also drew attention to the fact that though technology companies deploy sensors and servers in smart cities, the data and facilities are not available in real time as integrated application platforms to all the stakeholders.
The city environment manager response showed that current technology usage in UAQM is generally limited to administration, rather than its active use as an enabling tool for planning, controlling pollution, and communicating decisions among stakeholders. The participative research also highlighted the need for sub-scale monitoring and exposure data, computational resources, interoperability issues due to data heterogeneity and difficulty in translating complex scientific data into user understandable information. Though all the stakeholders found potential in IoT and big data analytics for data-driven UAQM, the non-alignment of smart city plans and clean air program was a major gap. A manuscript detailing the stakeholder analysis method and its outcome will be available by Kaginalkar et al. (in preparation). The research synthesis led to strength, weakness, opportunities, and challenges (SWOC) analysis of UC offerings (Figure 2). The summary is presented in this section.
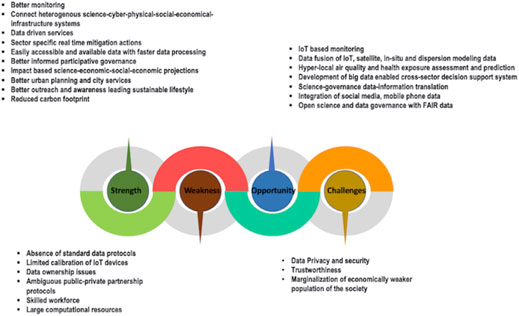
FIGURE 2. Urban computing SWOC analysis for UAQM.
3.1 Strengths
Augmenting the traditional monitoring methods, data fusion of in situ, IoT, model, and satellite data typically yields better spatiotemporal mapping (Lau et al., 2019). Hyper-local emission source estimation and concentration prediction using multiscale models aid in neighborhood-scale pollution mitigation and outreach (Jena et al., 2021). LCS, wearable devices, social media, and smartphones enable citizen participation (Skjetne and Liu, 2017; Nyhan et al., 2019; Yarza et al., 2020). AI methods improve LCS calibration and model prediction performance and facilitate the integration of newer data sources and faster processing (Bellinger et al., 2017; McGovern et al., 2017; Zimmerman et al., 2018; Ameer et al., 2019). The high-granularity data from the LCS typically has uncertainty and may have limited utility for daily real-time pollutant level predictions. However, they can be advantageous in “fit-for-the-purpose” approaches, for example, building awareness, education, exposure reduction, air quality model validation, source apportionment, epidemiological studies, and hot spot identification (WHO, 2021).
The inherent uncertainty in high-resolution numerical model data is augmented by coupling with ML for bias correction and pattern analysis (Cho et al., 2020; Ma et al., 2020). For this, HPC-cloud services provide cost-effective urban informatics solutions (Molthan et al., 2014).
3.2 Weakness
IoT-based monitoring is yet to mature due to calibration and maintenance issues. Standardizing sensor measurements and communication protocols with data privacy needs more effort (Syed et al., 2021). At the same time, fully AI-based methods still face trustworthiness and ethical issues. Complex higher granularity models and huge databases demand large HPC resources to predict sub-local air quality (Michalakes, 2020). IoT and social media smart city data is affected by confidentiality, data leakage, and access control issues (Toma et al., 2019).
3.3 Opportunities
The ubiquitous and fast processing characteristics make UC a candidate for UAQM. Interoperable data options, improvements in air quality predictions and services, and the ability to connect cyber-physical systems with the city’s socioeconomic-infrastructure systems that include natural and anthropogenic feedbacks provide opportunities to develop better smart cities through governance actions (Mondschein et al., 2021). Examples include graded action plans for pollution reduction, prompting systems to pause production (e.g., open burning in the underprivileged neighborhood) or changes in traffic flow patterns. Such aspects can be integrated within the Smart City environmental service framework.
Shared computational and data platform through cloud services aids developers in designing participative governance. The large urban covariate data with deciphering capability of structured and unstructured data of AI are bringing insights by including newer observations. For example, sentiment analysis of social media aiding understanding of mental health impact of pollution (Zheng et al., 2019). The open data and ubiquitous technologies enable citizen participation in environmental governance (Constant, 2018; English et al., 2018).
3.4 Threats
Data-driven service has a major threat to data privacy and security in smart cities (Cui et al., 2018; Ismagilova et al., 2020). Misuse and biased data interpretation can lead to a skewed decision. Black box AI methods face trust issues. Better anonymization and cyber security procedures with improved authentication, encryption algorithm, and blockchain methods may serve the purpose (Gharaibeh et al., 2017).
Faster technological growth with newer solutions can sometimes hamper developmental completeness, for example, a newer processor in the market or enhance ML algorithms. This can be augmented with modular technical enhancements, wherein the architecture can have flexible component connections with the interface layers.
The study findings are characterized and organized into various components; cross-sector processes, data interoperability, and user attributes. We then applied the multi-case analysis method by mapping gaps, challenges’ actionable knowledge, and technology solutions to stakeholder attributes. This approach combined multiple monitoring methods, state-of-the-art multiscale and multi-sector data and models on HPC-cloud platforms, source apportionment methods, satellite data extraction, data processing, data management, and dissemination.
4 Building Blocks
This section seeks an answer to the first research question of “What are the different data elements of UAQM in the context of emerging smart cities and the value they bring in as an interoperable system?”
Increasingly, urban aspects are reflected in the form of digital information enabling city functions in a more coordinated way. This digital information creation has a life cycle with value creation at each stage (GPAI, 2020) and enhancing partnerships among stakeholders, supported by data and technologies deriving knowledge and executing meaningful decisions (Figure 3).
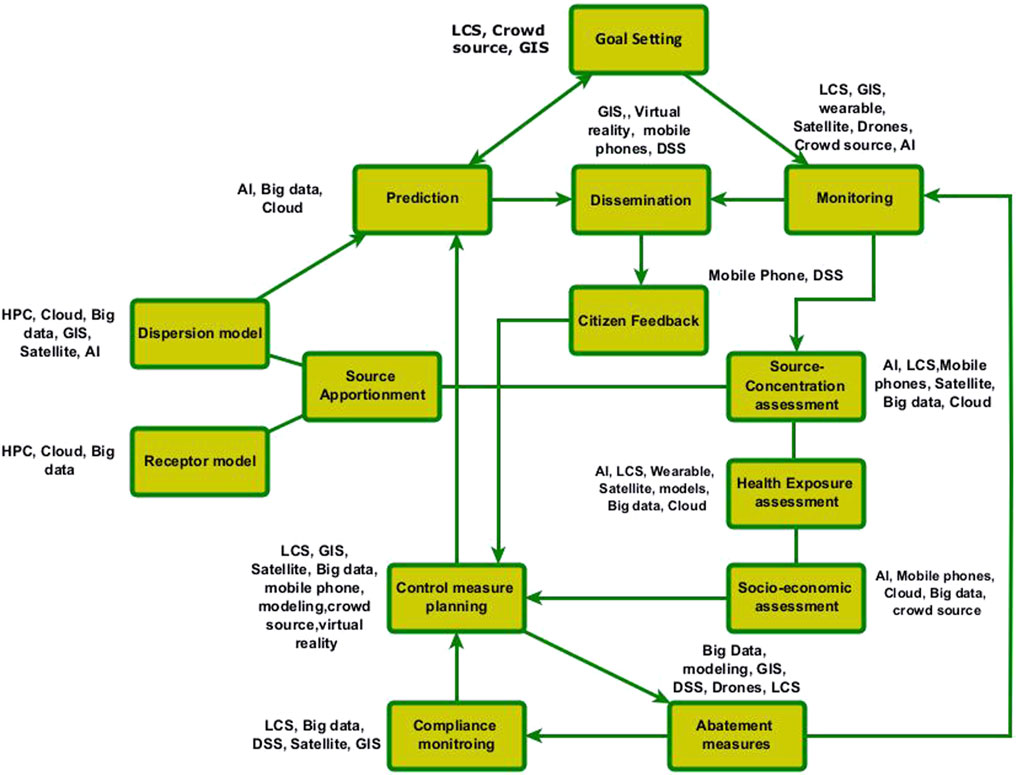
FIGURE 3. Integrated 4IR technology (text on the sides of the box) mapping with UAQM value-chain component (box).
UAQM stakeholders need cross-sector data access (Table 1). The stakeholders/users of SmartAirQ, including state and national regulatory agencies, multidisciplinary researchers, non-governmental organizations, city environment managers, local municipal departments, smart city IT centers, and industry, have varied data usage patterns (Tables 1–4). The UAQM users strongly rely on timely access to the information existing in the form of instrument data, written records, laboratory samples, complex model output, and governmental reports. This section gives a spectrum of scientific and administrative data and the associated technologies useful for accessing, processing, and disseminating it.
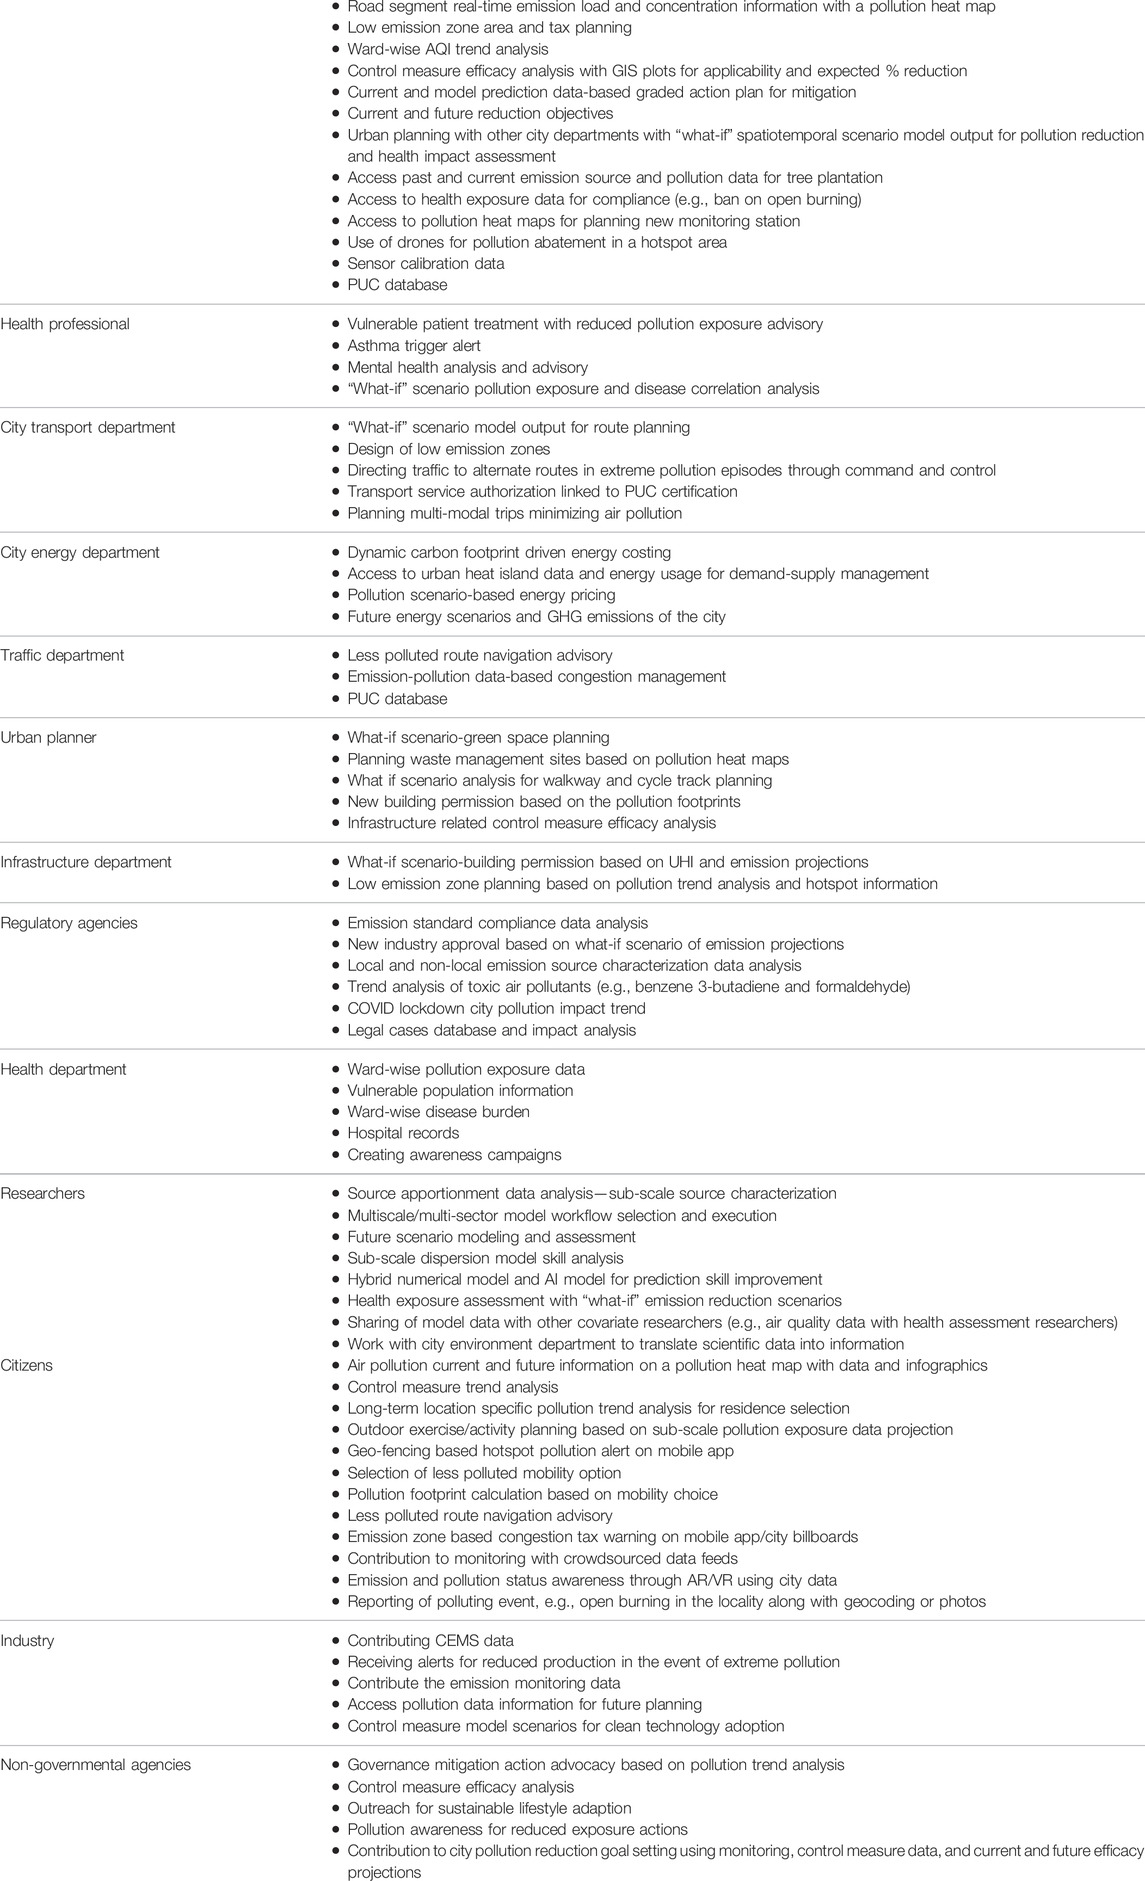
TABLE 1. User-specific decision support system functionalities.
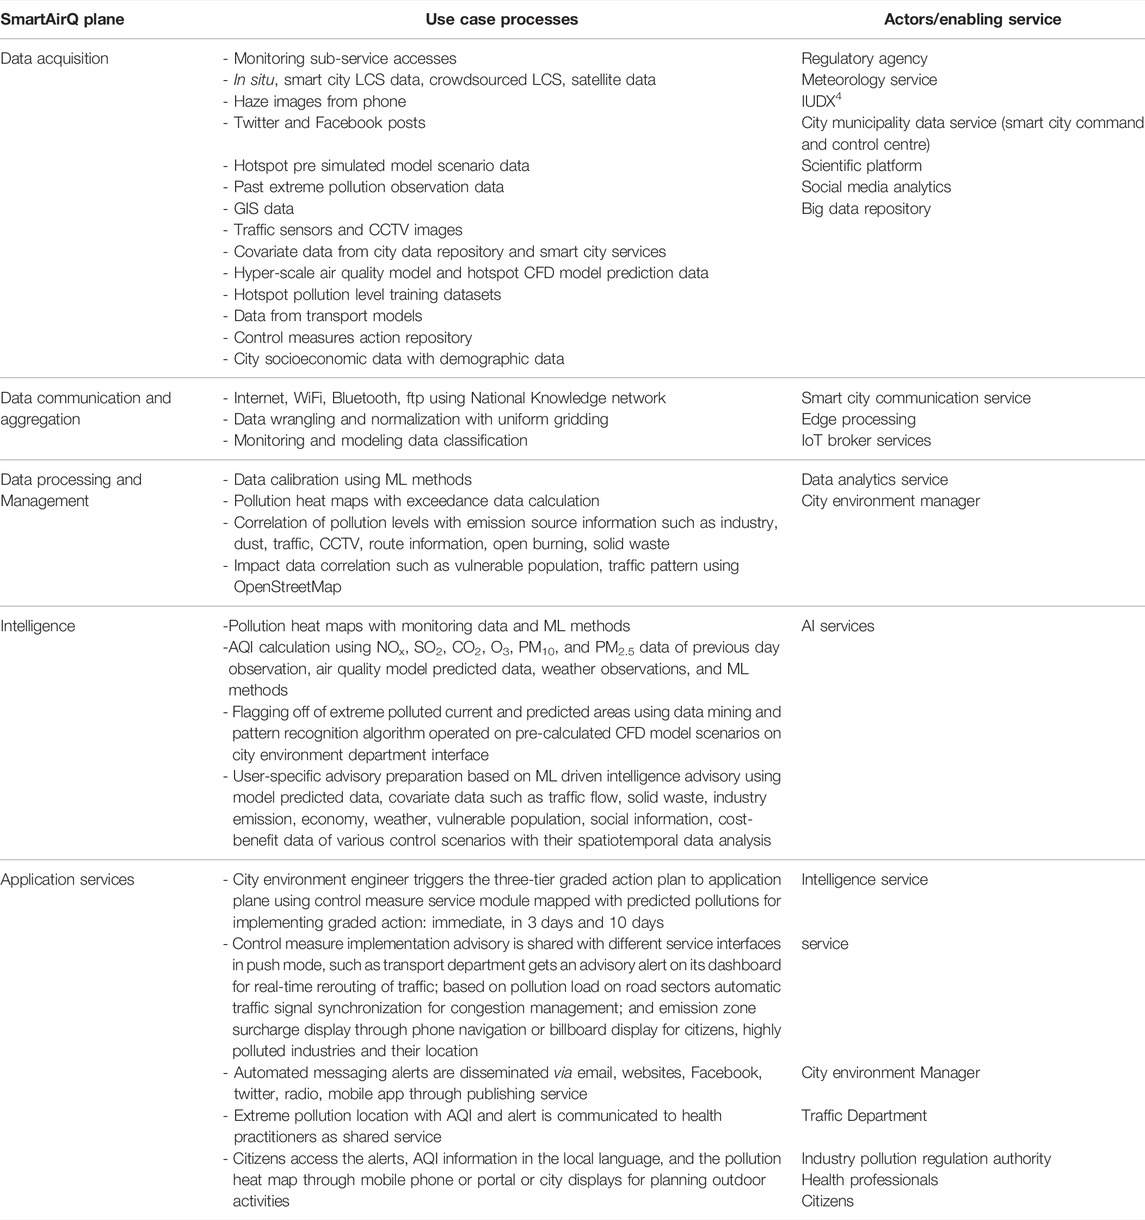
TABLE 2. Extreme pollution alert use case.
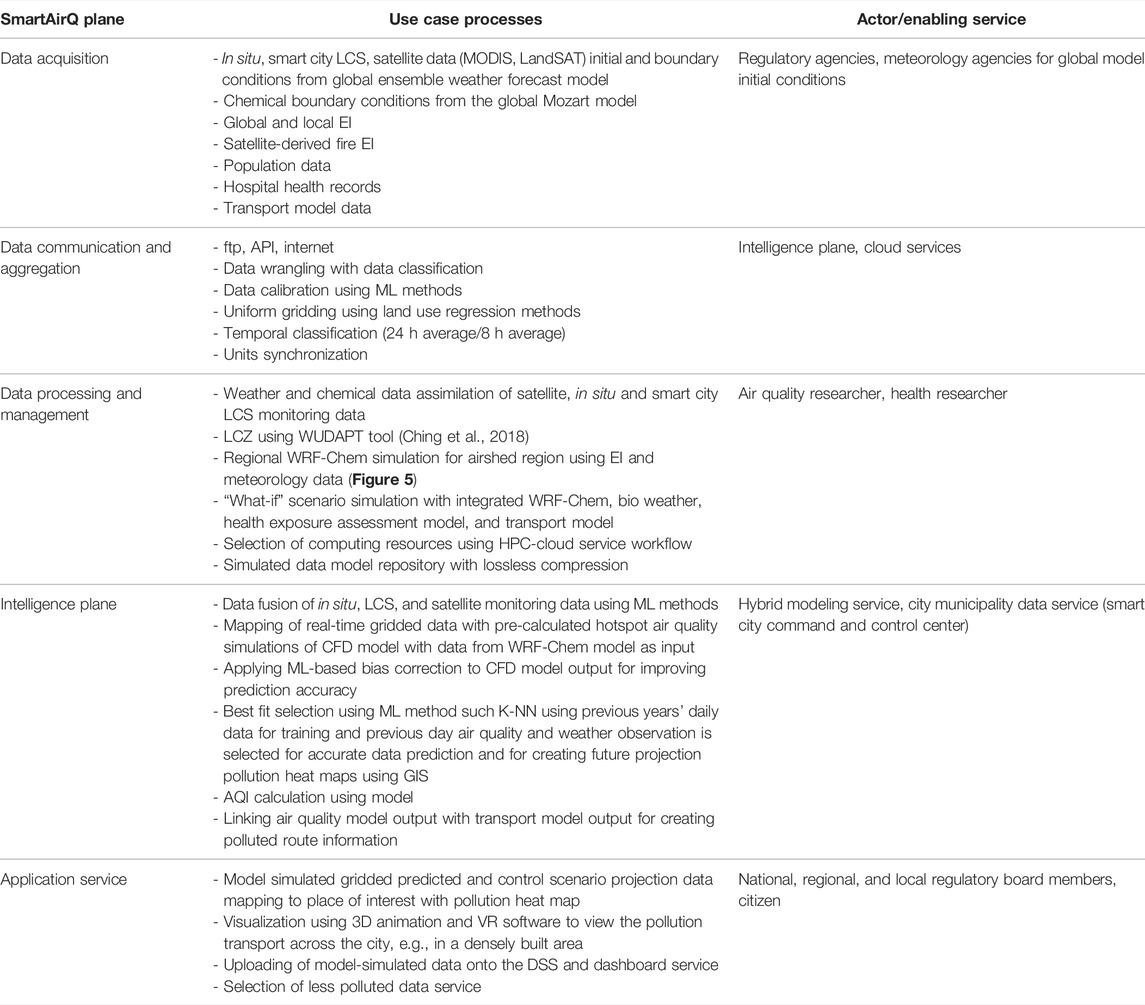
TABLE 3. Model as a Service HPC-cloud use case.
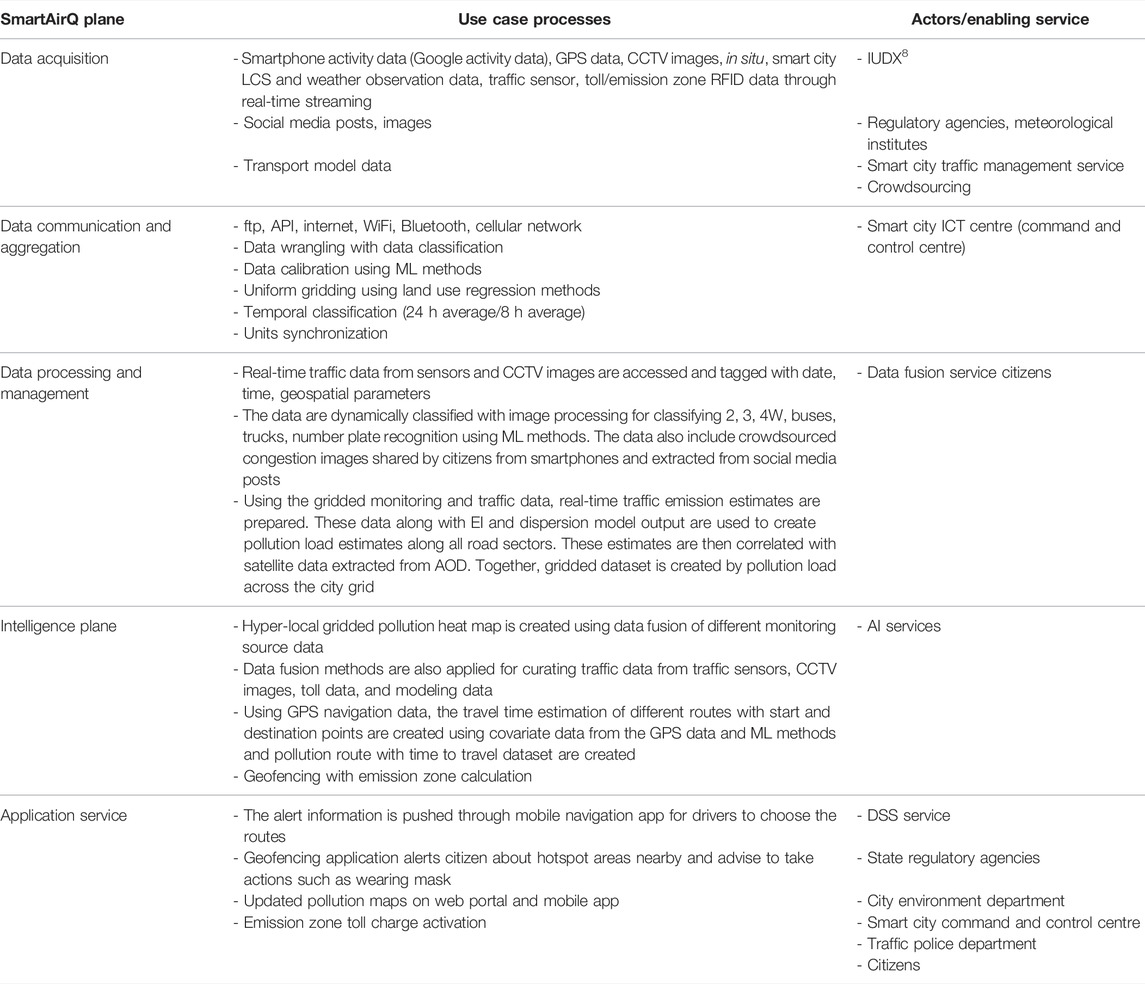
TABLE 4. Multi-variate data analysis use case.
4.1 Data
Many of the urban datasets are part of open data portals of national and local governments, global websites of scientific data, Internet, and smart city platforms. They have spatiotemporal heterogeneity with different spatial scales (sub-local, local, regional, national, and global), temporal scales (minutes, hourly, daily, weekly, monthly, and annual), types (structured and unstructured), and domains (scientific, social, economics, infrastructure, and governance) (Supplementary Material). The real-time, historical data and metadata are classified into four main types considering the static and dynamic nature of the data: 1) city characteristics, 2) monitoring and observations, 3) modeling, and 4) city services (Figure 4).
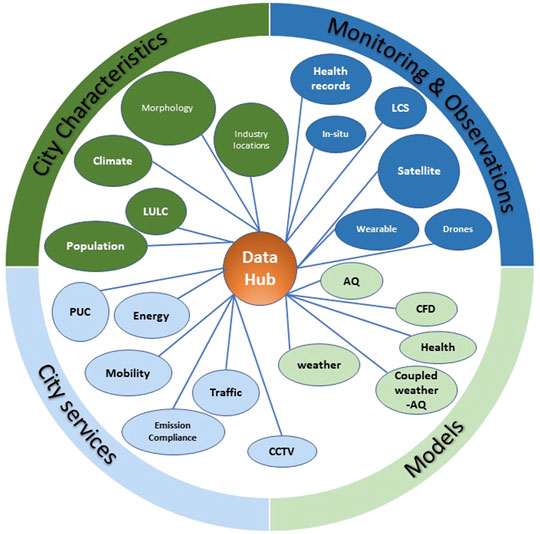
FIGURE 4. DataHub featuring representative cross-sector data.
4.1.1 City Characteristics
These define city static/semi-static data such as demography, morphology, Land Use Land Cover (LULC), urban planning, climatic conditions, industry, and socioeconomic characteristics (Supplementary Table S1). Geographical details of the city are required, as the location of the city determines air pollution dispersion patterns, for example, coastal city or city in a valley. For understanding and modeling the pollutant formation and its dispersion, morphological data such as road type and length, building type, height, and density and trees is required (Cárdenas Rodríguez et al., 2016). Realistic representation of urban LULC also aids in stimulating the planetary boundary layer structure, calculating the thermodynamic and air pollutant transport functions (Sun et al., 2020). Satellite-derived LULC classification, for example, from Landsat and Sentinel, is a viable source for capturing sub-scale granularity and temporal transitions (Saraswat et al., 2017).
A city’s socioeconomic information such as projected population growth, residential area, business hubs, recreation areas, and industry location contribute to the anthropogenic emission source identification (Guttikunda et al., 2013). Geo-referenced ward-wise shapefiles and point shapefiles are part of the city’s geospatial database. Geographical information system (GIS) data such as place of interest, roads, buildings, location layers, and hospital information are important components of the interactive DSS.
4.1.2 Monitoring and Observations
These are classified depending on the mode of observation (Supplementary Table S2).
4.1.2.1 In Situ
This includes real-time and historical daily manual and continuous monitoring stations from regulatory agencies3 and research programs (Beig et al., 2015). Recently, smart city LCS data are available in the public domain4. Monitoring datasets also include pollution data on specific events, such as music events, rallies, dust storms (Kedia et al., 2018), correlating human activities and observations from airshed regions.
Monitoring is augmented by periodic instrument maintenance information. The quality control data with calibration information such as sensor type, aggregated network information, gateway node, sensor ID, location, parameters to be tested, statistical analysis, missing values, error flags, and number of operational stations are classified in the calibration datasets of SmartAirQ (Chu et al., 2020; Sahu et al., 2021).
Ground and remote satellite data complement the sparse monitoring data (Martin, 2008). For instance, data from TROMPMI over Sentinel-5P gives daily high-resolution coverage for pollutant measurements (Sentinel-5P). Another example is that satellite data retrieved PM2.5 is used in operational UAQM (Geng et al., 2021; Jena et al., 2021). In addition to pollutants, satellite images of dust, wildfire data help understand the emission sources (Engel-Cox et al., 2004).
Continuous emission monitoring system (CEMS) data from industries is accessed by regulatory agencies for compliance and mitigation actions. Control measure reports include compliance data of periodic site visits (e.g., power plants). Non-numeric data, such as information on inspection of laboratory infrastructure, show cause or closure notice to polluters and environmental clearance records of industry, building, and commercial establishments such as malls, and public hearing records from critical governance database (Verma, 2021).
4.1.2.2 Field Campaign
This includes special study or campaign datasets such as emission inventory (EI), specific emission source impact (e.g., construction-based pollutant level), and health impact assessment data such as mortality, emergency visits, and affected population. Granular EI has activity data from emission sources multiplied by emission factor to give emission loads in each city grid for various pollutants (Supplementary Tables S5, S8). Periodic EI with activity data of anthropogenic sources: mobility, open burning, residential heating, diesel generators, traffic, vehicle type, restaurants, business activities, and natural sources such as wildfire and dust storm are required for source attribution, dispersion modeling, and mitigation assessment (Dalvi et al., 2006; Behera et al., 2011).
In addition, the UAQM data repository includes historical monitoring datasets and metadata such as short- and long-term control measure impact efficacy analysis. Source apportionment datasets with laboratory reports and receptor models characterizing the city emission sources with source profiles are needed for planning mitigation actions (Mircea et al., 2020). A health exposure assessment database is prepared with disease characterization attributed to particular air pollutants and hospital records (Braithwaite et al., 2019; Katoto et al., 2021). It also includes newer sources of personal physiological impact information from wearable devices (Ranscombe, 2019).
4.1.2.3 Crowdsourcing
This includes two types of observations: 1) pollution sensing using LCS and mobile phones and 2) health impact information through wearable devices, mobile phones, and social media. These are further classified as passive and active data (Ghermandi and Sinclair, 2019). Examples of passive data include social media streaming (sky images, emission source photos, Tweets, and sentiments), smartphone activity data, google activity data, and citizen feedback, for example, extreme pollution event, traffic congestion, and open burning from these datasets (Jiang et al., 2015; Charitidis et al., 2019). Examples of active data include specific purposes, for example, pollution impact on vulnerable population such as school or focused study of control measure efficacy (Wu Y. C. et al., 2015; Alexeeff et al., 2018; Castell et al., 2018; Dirks et al., 2018). It also includes data streaming from crowdsourced LCS websites.5
4.1.3 Modeling
Modeling data is used for three major purposes: understanding the pollution sources, assessing their impacts, and predicting future conditions. These datasets can be long (1–3 months), medium (3–10 days), short (1–3 days), and nowcasting (6–12 h). It includes multiscale (global, regional, and local) weather prediction, real-time and future projection air quality model data, multi-observation atmospheric and chemical data assimilation, health impact, emission factors, and chemical profiles (Baklanov and Zhang, 2020) (Supplementary Table S3). Meteorology data consist of wind speed, direction, turbulence, surface and boundary layer temperature, precipitation, humidity, cloud cover, reflectivity, boundary layer depth, and mixing height affecting pollutant concentration. Boundary layer and lower mixing heights influence the pollutant concentration, and wind speed and direction are responsible for its transport (Oke et al., 2017).
Source apportionment data generated in campaign mode with chemical mass balance models giving source characterization estimates of particulate matter with ions, metals, carbon-specific composition data, and chemical profiles of different emission sources (Pipalatkar et al., 2014; Gargava and Rajagopalan, 2016) form a critical database.
Health exposure assessment model data with mortality, morbidity, and disability-adjusted life years prediction information (Fotopoulou et al., 2016) are the most critical data required for policy decisions and mitigation efficacy analysis. In addition, information on bio air allergens transmissions combined with chemical pollution forms a health database for clinical advisory (Klein et al., 2012).
4.1.4 City services
These databases include static and dynamic data generated by city service departments or national ministries. It consists of fuel type information, vehicle emission standards, sector-wise emission standards, emission factors, daily road segment traffic count, CCTV images, energy demand-supply data, mobility data from smartcards, hospital records, congestion information, different LCS certification data, pollution under control data, smartphone activity data from vendors, Twitter feeds, multi-modal ridership system, route navigation, control measures implementation current and future plans, types of emissions sources to which they are applied and its socioeconomic impact, yearly urban environmental status report, industry regularization reports, air quality Right to Information responses from government departments, and hazardous waste management data (Verma, 2021) (Supplementary Table S4).
4.2 Technologies
Before answering the second research question of “How can technologies be optimally connected for cross-sector data acquisition, aggregation, processing, modeling, stakeholder participation, and dissemination?” we first discuss the technology potential in this section. The 4IR technologies, in addition to traditional technologies, enable seamless access of cross-sector data (Section 4.1) and faster processing of data.
4.2.1 IoT
IoT with ubiquitous measurements and faster communication enables more granular and better-informed decisions. We consider two types of IoT devices in SmartAirQ: LCS and wearable devices.
LCS provide cheaper and more flexible monitoring options complimenting the expensive reference-grade stations (Hagan et al., 2019). Its flexibility to mount on multiple platforms aids in capturing dynamic pollution characteristics for campaign studies (Apte et al., 2017). SmartAirQ considers LCS for non-regulatory monitoring, hotspots identification, pollution impact assessment on a vulnerable population, awareness, selection of location for regulatory stations, citizen sensing, health exposure assessment, and control measure efficacy analysis (Morawska et al., 2018).
IoT-based wearable devices enable cost-effective epidemiological and individual exposure assessment (Haghi et al., 2018). Wearable devices aid practitioners in the personalized treatment of pollution-related allergies and respiratory diseases (Piedrahita et al., 2014). SmartAirQ will enable the processing of health parameters data derived from crowdsourced data with data privacy and security protocols.
4.2.2 Smartphones
SmartAirQ processes smartphone mobility data to predict traffic-related pollution levels to quantify neighborhood-scale mitigation and geotagged photos for exposure guidance (Donaire-Gonzalez et al., 2016; Gately et al., 2017). They are also effective via media for crowdsourcing LCS data, photos, awareness, and real-time data dissemination through mobile App.
4.2.3 Social Media
Social media provides a new avenue to gather pollution information (Wang et al., 2017; Charitidis et al., 2019). The best practice example shared in the stakeholder interview, showed that the real time traffic information extracted from the Google mobility data can help city transport planners with better public bus fleet management. The semantic analysis of tweets can be used for mental health impact analysis (Du et al., 2016; Upadhyay and Upadhyay, 2017; Zheng et al., 2019). These datasets, in addition to other data in SmartAirQ DSS, enable city managers to plan, evaluate the mitigation, and build awareness.
4.2.4 Satellite
Satellite data give concentration information along the column of satellite sensors and on the ground. Geostationary satellite datasets from NASA AQUA/MERRA MODIS and Sentinel-5P, NOAA GOES-R, Hamamury, and CALLIPSO give continuous remote sensed observations of AOD, PM2.5, PM10, OC, BC, NO2, SO2, NH3, CO, VOC, and dust, aiding in emission trend analysis, filling the observation gaps, sub-scale health exposure, and identifying non-local sources (Wiedinmyer et al., 2011; Kulkarni et al., 2020). NASA Landsat datasets characterize LULC features, source apportionment, and extreme events (Gupta et al., 2006; Jena et al., 2021). SmartAirQ has satellite-based LULC data creation; data fusion of in situ, LCS, drones, ground sun photometer, and satellite data to create granular pollution maps; and data assimilation in models, industry compliance, and health impact assessment (Lau et al., 2019). Recently, 1 km PM2.5 MODIS retrieved datasets for two decades for India will be accessed through SmartAirQ (Dey et al., 2020).
4.2.5 Crowdsourcing
Citizen science brings an opportunity to conduct participative governance, including policy design, awareness, and impact assessment (Mahajan et al., 2020; Lepenies and Zakari, 2021). SmartAirQ enables crowdsourced emission-pollution monitoring through LCS, mobile phone photos, and health impact data acquisition.
4.2.6 Big Data and AI/ML
With the data mining of scientific and governance data, the urban big data has utility in context-aware data-driven services such as UAQM (Rathore et al., 2018). The UAQM data have big data characteristics of large volume, variety with heterogenous data, velocity with faster data processing, variability due to covariate data dependency, and veracity with data privacy and security (Fazziki et al., 2015; Octaviano et al., 2020). SmartAirQ data architecture builds on the big data principles and technologies such as Hadoop/MongoDB, SPARK, for real-time data processing using cloud computing (Asgari et al., 2017; Huang et al., 2018; Silva et al., 2018).
Hitherto, pollution studies and operational services were limited to in situ observations and coarser models. With the capability to interpret structured and unstructured data, ML methods are used for data mining of large data by training the data and pattern recognition. By building diagnostic, descriptive, prescriptive, and predictive models from it, they enable better actions (Sebestyén et al., 2021). For instance, Liu et al. (2021) developed a correlation analysis of PM10, SO2, NO2, and O3 and showed improvement in prediction data efficiency up to 86% by applying regression models with reference-grade data and other covariate data, such as meteorology using artificial neural network. SmartAirQ uses such ML methods across UAQM lifecycle, namely, random forest in improving LCS calibration (Zimmerman et al., 2018), data fusion (Johansson et al., 2015; Lau et al., 2019), parametrization (Wang et al., 2019), bias correction (Haupt et al., 2021; Xu et al., 2021), extracting information from unstructured data (Zheng et al., 2019), epidemiology (Bellinger et al., 2017), and data sharing within the IoT devices (Ravì et al., 2017).
4.2.7 Cloud Computing
The computing concept increasingly transitions to “moving analysis to the data” rather than “data to analysis.” SmartAirQ has cloud services with Data as a Service (DaaS), Model as a Service (MaaS), and Platform as a Service (PaaS) connecting to IoT devices, real-time and legacy data, models, and model output to provide last mile services (Liu et al., 2017). It supports data reusability through standardized data workflows, user-specific metadata creation, and sharing. SmartAirQ architecture has service orchestration tools linking with smart city services such as transport, health, economy, and energy. The technology stack has cloud services and processing tools (Supplementary Table S6).
4.2.8 Models
Modeling is an important tool for understanding environmental processes and predicting future conditions. SmartAirQ includes HPC-cloud service with cross-sector, multiscale statistical, and numerical models such as weather, global, regional, and local air quality models and health impact assessment models (Baklanov and Zhang, 2020). The top-down source apportionment method with receptor modeling compares chemical and physical sample properties with emission sources giving the type of the source and its contribution information used in campaign mode (Gargava and Rajagopalan, 2016).
The urban scale dispersion models use downscaled data of initial and boundary conditions, emissions, observational data assimilation, and chemical and physical equation calculations, such as 3D turbulence, convection, boundary layer calculations, transport, and urban heat island influences (Li H. et al., 2020; Ghude et al., 2020; Ramacher et al., 2021). Hyper-local computational fluid dynamics (CFD) models capture pollutant flow around buildings and ventilation coefficient (Santiago et al., 2017). SmartAirQ includes health exposure assessment methods to understand the cause-effect and the disease burden (Smith et al., 2017; Ramos et al., 2018).
4.2.9 Decision Support System
Worldwide, DSS with model-based prediction and information systems are gaining importance in air quality governance activities (AirNow; Baklanov et al., 2020; LondonAir; Molina et al., 2019). For example, Zheng et al. (2015) developed an air quality prediction system using machine learning algorithm application on current and past air quality and covariate data such as point of interest, meteorology, traffic flow, and roads. By integrating traditional data sources such as ground observation and chemistry models with satellite, social media, and LCS data, a prototype for hyper-local air pollution DSS (APDSS) for Hong Kong has advanced data analytics and mining methods (Leung et al., 2018). Through highlighting the importance of health risks, the SMURBS6 system has an urban atlas derived from the fusion of satellite data and sub-local exposure assessment data, real-time LCS calibration tool, and emergency action module for industrial accidents with data fusion of CAMS model, citizen observatory, Sentinel-5P and MODIS data, and real-time source apportionment. However, these modules appear as independent components, and an integrated DSS facility is not evident. Furthermore, very few of these go beyond the information portal and include interactive data communication leveraging the 4IR technology for sectorial decisions (Zheng et al., 2015; Leung et al., 2018; Che et al., 2020).
The proposed SmartAirQ framework has not only the best of the above features but also a multi-user secure and interactive science cloud and linked operational service facility harnessing cross-sector pollution mitigation and its integrated assessment, including socioeconomic impacts supported by multiscale modeling and data governance.
5 SmartAirQ ARCHITECTURE
The triangulation method synthesis addresses the third research question of What can be the overarching design of UC-enabled UAQM as a standard platform, scalable across smart cities?
The literature prompts increasing interest in smart city architecture (Santana et al., 2017; Habibzadeh et al., 2019). However, its application context is often generic in nature or addresses a single aspect of technology such as big data, IoT, or AI (Fazziki et al., 2015; Ang and Seng, 2016; Dwevedi et al., 2018). The SmartAirQ outlined in this study incorporates integrated multiple 4IR technology applications by considering two major aspects: scientific ecosystem and governance services executed through HPC-cloud resources.
The SmartAirQ has utilities for national, regional, and local users with bi-directional knowledge exchanges between governance-governance (among different functional agencies), citizens-governance (active participation and feedback), and governance-citizens (dissemination). It builds on the living lab concept, i.e., 1) creating value for stakeholders, 2) considering end users as active partners, and 3) creating open processes for interconnected socio-technological systems (Jensen and Campbell, 2019; Steuri et al., 2020).
SmartAirQ system has a cloud-based plug-play ecosystem for data analytics, modeling, aggregation, and user-specific information built on advanced HPC resources and 4IR technologies. It supports a data platform to create, simulate, contribute, integrate, and disseminate data and metadata, enabling cross-sector applications of pollution reduction actions and policies (Figure 5). The SmartAirQ is designed around modularity and flexibility as technology leapfrogs.
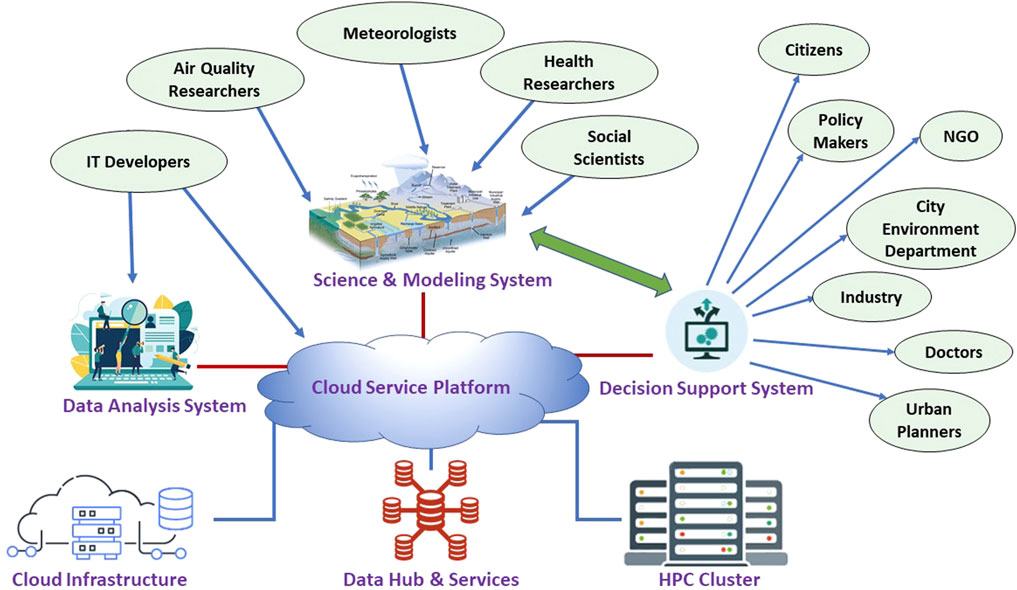
FIGURE 5. SmartAirQ overview with cloud services and stakeholder access.
SmartAirQ has adopted multiple data planes typology with service-oriented architecture (Habibzadeh et al., 2019). Some planes operate independently and some as cross-functional services (Figure 6). The data planes are characterized as (DI) data acquisition plane, (DII) communication and aggregation plane, (DIII) data processing and management plane, and (DIV) application service plane with visualization. These planes are supported by three cross-functional planes: (DA) intelligence plane, (DB) data security and privacy, and (DC) HPC-cloud service.
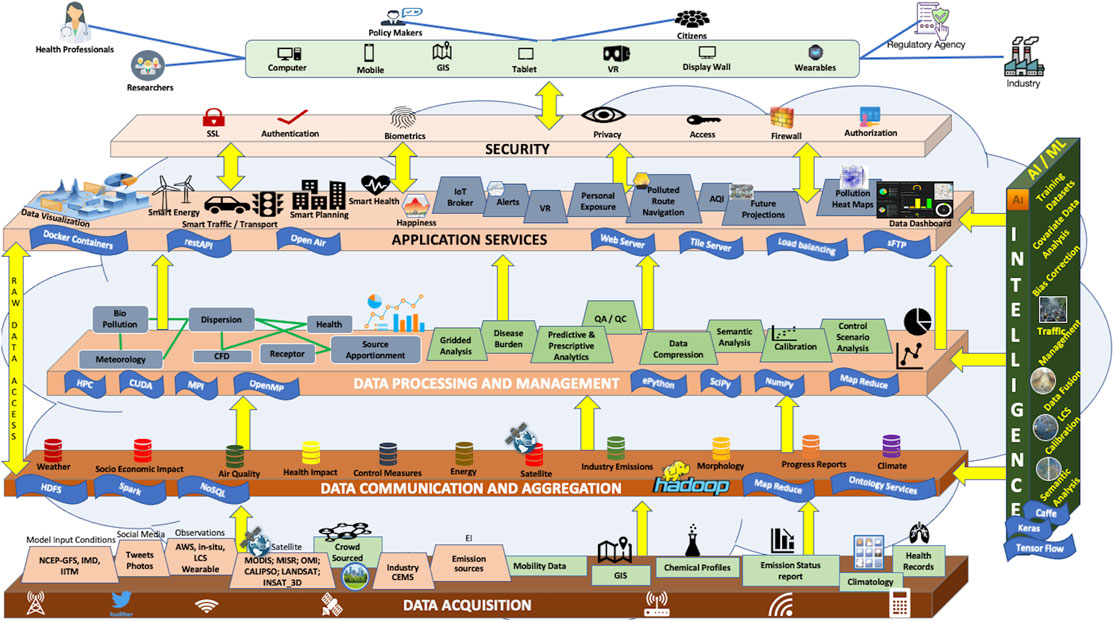
FIGURE 6. SmartAirQ architecture with service planes.
5.1 Data Acquisition Plane (DI)
Cross-sector data is collected from varied sources such as in situ stations, LCS, weather observations, wearable devices, smartphones, social media, different model outputs, government records, city infrastructures, people, radars, surveys, satellites, and GIS (Section 4.1). Each dataset has different formats, access types, measurement intervals, and time scales such as real-time, past, and future data (Supplementary Table S7). These datasets are accessed through open websites, ftp protocols, or service interfaces to IoT devices or other smart city databases through RestAPI and Spark streaming for social media or data portals. Acquired data are mapped to Open Geospatial Consortium (OGC) standards (van der Schaaf and Herzog, 2015) and IoT standards such as SensorThingsAPI (Kotsev et al., 2018).
The data undergoes quality checks by removing garbage data, range validation, missing values, and removing outliers. The basic statistical methods such as root mean square error, correlation coefficient, and mean bias are applied to check the data quality. The LCS data is correlated with co-located reference-grade stations for accuracy purpose. This plane has provision for citizens to submit crowdsourced monitoring and impact data. The data is anonymized with a coding key.
5.2 Communication and Aggregation Plane (DII)
This plane connects data from the acquisition plane to the cloud environment. For real-time processing, low latency and high throughput bandwidth is critical. The data from various sources are communicated to the cloud layer through WiFi, 4G/5G network, internet, Bluetooth, or FTP. The data transmission from the IoT network is facilitated by a gateway using a wireless sensor network and IoT service broker.
Then, the data are compressed or decompressed, stored, normalized, and classified. It is classified as raw data or metadata with data format information using data standards (WCCD, 2021). The data classification has multiple ontologies, such as parameter-wise, emission source types, ward-wise, geotagged photos and tweets, exposure types, same temporal interval, or same functionality datasets, for example, global, regional, and urban weather, air quality model output, and control measure scenarios. Data interoperability considers various levels such as physical parameter, syntax, semantic, pragmatic, dynamicity, spatial, temporal intervals, and data constraints (Laniak et al., 2013). The interoperability is achieved through the sensor web framework of Open Geospatial Consortium, Web coverage service standards, and API.
This layer has APIs for sharing the data with other smart city services to process and manage interoperability issues.
5.3 Data Processing and Management Plane (DIII)
This plane connects data from the communication plane and creates metadata in response to the query from the application service plane. It performs multi-functional processing using mash-up web services methods (described below) with service and user interface orchestration for integrating different city services using the Hadoop environment (Atrouche et al., 2015). The processing includes predictive, prescriptive, and inferential analysis. This plane also has database management and storage services using the HPC-cloud platform. The cloud services are supported by Kubernetes and Docker tools. This plane encompasses a variety of data processing methods presented below.
5.3.1 Calibration
The monitoring data quality is improved by calibration methods, such as range test, based on local climatic conditions by mining historical extremes; single sensor and sensor network spatial calibration using linear regression coefficients with reference-grade sensors and land use data (Masiol et al., 2018; Chu et al., 2020); and persistence testing applied by calculating standard deviation below the critical threshold, least square regression (Morawska et al., 2018; Hagan et al., 2019), and multiple regression trees (Simmhan et al., 2019). It also includes CEMS sensor location calibration against standards deployment protocols. This layer has statistical methods to fill gaps in real-time and monitoring data either using historical data mining or co-located station data.
5.3.2 Data analytics
The application query triggers different data processing methods, including pollutant trend analysis, correlation, regression, multivariate data analysis of weather, air quality, transport, health exposure, energy cause-effect analysis, and interpolation to create uniform gridded datasets. The statistical analysis is performed using openAir libraries (Carslaw and Ropkins, 2012). This layer includes control measure efficacy analysis in preventing and reducing polluting incidences, such as “what-if” analysis change in vehicle emission standards and the impact on air pollution levels in a region. Pollution heat maps of all the criteria pollutants are processed for uniform gridding across the city using the inverse-distance-weighing method and calculated from past, current, or future data created from pollution data fusion (Section 5.4).
This plane enables real-time micro-environment exposure calculation based on real-time pollution data (Section 5.4), mobility data, social media, wearable device data, and pushing alerts or advisories through the application service plane.
5.3.3 Crowdsourced Data Processing
This layer conducts quality for the LCS as per the crowdsourcing standards (EPA, 2015; Capineri et al., 2016). Social media posts are processed with natural language processing with taxonomy, language filters, and semantic connections using ML methods (Charitidis et al., 2019; Jiang et al., 2019). The classified data is then mapped to create pollution data and impact database. Local climatic zones (LCZ) with GIS are an important consideration due to their ability to detail the localized LULC (natural and anthropogenic) influences such as building height, building cluster, open spaces, vegetation on pollutant concentration, and dispersion (Wu J. et al., 2015; Shi et al., 2019). Standardized LCZ classification methods and tools, such as World Urban Database and Access Portal Tools (WUDAPT), aid in better representation of LULC using crowdsourced morphological data (Ching et al., 2018).
5.3.4 Air Quality Index Calculation
From the observation data, aggregated AQI is calculated for awareness purposes with six categories: good, satisfactory, moderately polluted, poor, very poor, and severe. AQ sub-index and health breakpoints are evolved for eight pollutants (PM10, PM2.5, NO2, SO2, CO, O3, NH3, and Pb). AQI are predicted using past and current AQI, past and current weather and model data, social media feeds, and ML (Kosmidis et al., 2018; Castelli et al., 2020). SmartAirQ system has query-based access to sub-local AQI values using GIS visualization and advisory in infographics form for easy understanding of impacted community and citizens, such as the decision regarding school closure during extreme pollution situation in Delhi.7
5.3.5 Workflow Orchestration
In response to the application service triggers, this layer transforms the query requirements, connects different data analytics components, allocates the cloud resources, and automates the input-processing-output tasks with service-oriented architecture services (Zanella et al., 2014). It involves multiple job management with scripting and streaming processing for real-time data access, batch processing, and process optimization for DaaS, PaaS, and MaaS. The MaaS connecting multi-sector model workflows with preprocessing, simulations, and post-processing with model data exchanges has OpenMI2.0 framework (Harpham et al., 2019). The workflows run through the public and private cloud (Figure 7).
(1) Public cloud: end users will directly interact with the hosted services that will expose various web applications developed with angular, Django/spring boot framework. It will facilitate users with data visualization using NCL graphics, Vapor, and data analytics using openAir R libraries. OpenStreetMap used in visualization will be exposed via GeoServer, and data can be downloaded via ftp servers.
(2) Private cloud: it will include middleware servers that host several python, java-based microservices deployed as Docker containers, which will be managed by Kubernetes.
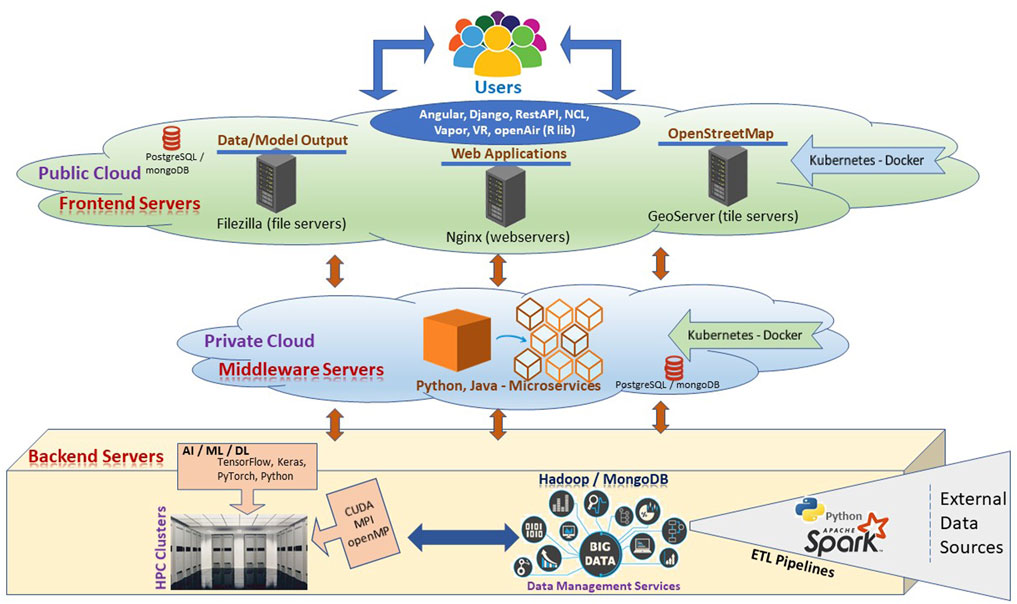
FIGURE 7. Data processing and technology pipelines with public-private cloud and HPC.
5.3.6 Modeling
Various modeling interfaces can be integrated within the UAQM (Kaginalkar et al., 2022). The modeling service layer has global weather forecast models and global, regional, and urban air quality models, such as source apportionment, statistical and simple box dispersion and complex chemical transport models, street-level CFD models, bioweather models, health exposure assessment and socioeconomics impact evaluation models (Baklanov and Zhang, 2020). The models are used for source-concentration estimates, future predictions, and what-if control scenario projections. The model workflow has data containers for data acquisition of 1) global data weather forecast and chemistry model datasets; 2) global, regional, and local EI datasets; 3) air quality observations from regulatory stations, LCS, and satellite 4) LULC data derived from LANDSAT datasets; and 5) weather and air quality observations.
SmartAirQ prototype module consists of regional and urban WRF, WRF-Chem model (Grell et al., 2005), and CFD model OPENFOAM9. CFD modeling workflows can be invoked in two streams: 1) running online CFD models for the entire city and 2) running CFD models for hotspots as precalculated scenarios and then pattern matching of real-time data using ML methods. It also includes executing the regional-urban-Gaussian dispersion model, such as AERMOD (Cimorelli et al., 2005) to identify multiple hot spots and create sector-specific graded action plans. Users can select further data prediction improvement methods such as hybrid modeling with lognormal/log-logistic statistical distribution model (Gulia et al., 2017) for episodic cases or by running AI models (Section 5.4).
Further, sub-local air quality models can be coupled with health exposure models such as AirQ (AirQ+.) and BENMAP (USEPA, 2014) for estimating exposure and “what-if” scenarios. The model simulated data can be invoked through the query system of the application service plane DSS (Section 5.5).
The model’s accuracy is improved by atmospheric and chemical data assimilation, data fusion methods, and bias correction using hybrid numeric and ML models. The air quality models are executed in ensembles with different initial conditions. The air quality models are supported by evaluation tools for validation with observation data, such as AMET (USEPA, 2016). The compute workloads needed for various simulations and AI/ML engines using several libraries, such as MPI, openMP, TensorFlow, Keras, CUDA, will be executed on HPC clusters (Figure 7).
5.3.7 Database Management
Efficient data storage is critical in urban environment data management as, every day, huge amounts of data are created and processed. For example, daily three-day forecast Pune city with 500 m WRF model generates ∼17 GB, whereas ten-day forecast for 400 m WRF-Chem model with a larger national capital region of Delhi using chemical data assimilation attributes to 210 GB. This layer is responsible for storing and arranging data with spatiotemporal, sector-specific, impact-specific labeling. It includes a raw data and metadata repository with a periodic storage policy (e.g., few datasets); weather and air quality observations are required as climatology information for past trend analysis or training ML models. For optimal storage, considering the end-user function of the data, lossy or lossless compression techniques are adopted depending on the data accuracy requirements. SmartAirQ leverages distributed data access, wherein data will not always be stored at a centralized location but organized on multiple physical or virtual infrastructures. The repository also includes information on apps, different model configurations, scripts, and data connection between different models as workflows. Data management services will have a big data framework using Hadoop/MongoDB, which will house the data needed for SmartAirQ. It will also have extraction transformation load (ETL) channels implemented in spark, python, to ingest data into the data store (Figure 7).
5.4 Intelligence Plane (DA)
This plane runs across all the above planes with AI methods, improving the UAQM functionality and providing value addition to the underlying technologies.
5.4.1 LCS and Model Data Calibration
ML-based calibration methods such as support vector machine, random forest, K-nearest neighbor, and geospatial kriging are applied to LCS data and covariate data to improve the accuracy (Maag et al., 2018; Zoest et al., 2020).
5.4.2 Data Fusion
Overcoming the limitations of various monitoring methods, data fusion processes monitoring data from in situ data, campaign study data, satellite data, chemical transport models, and smart city air quality LCS data using ML methods to create gridded datasets of PM2.5, PM10, NO2, CO2, SO2, and O3 (Li et al., 2017; Schneider et al., 2020; Viqueira et al., 2020).
Data fusion is executed in two ways: offline and real-time. Generally, in the offline mode, data used in specific campaigns are fused to create a newer dataset. For example, LCS, drones data, and mobile LCS data on vehicles are combined to create an emission source spatiotemporal map. These datasets are then used to train the dataset for real-time feature extraction in data fusion methods (Lau et al., 2019; Geng et al., 2021). Then, the data created by data fusion method is compared with the in-situ station data.
5.4.3 Cross-Sector Data Processing
Pollution reduction is dependent on emission source-concentration information. Building scale LULC data is prepared using satellite data and ML methods (Kerins et al., 2020). This layer performs spatial (roads, buildings, place of interest, and types of roads) and temporal classifiers based on artificial neural network and regression methods on cross-variate data training models to improve pollutant concentration predictability (Zheng et al., 2015). In this layer, ML methods K-nearest neighbor and long short-term memory are applied for traffic density assessment by vehicle count from traffic sensor data, trajectory analysis, and visual classification from CCTV images from smart city command and control data services for congestion prediction (Majumdar et al., 2021). These datasets are linked to pollutant level datasets and GIS data for less polluted route navigation and emission zone surcharge advisory on the mobile app.
LCS and social media data are used to identify emission sources and control measures. This layer includes content extraction and pattern recognition using natural language processing and semantic analysis using ML methods (Zheng et al., 2019). Data are then correlated to pollution concentration data to predict future AQI and health impact assessment data to be used by city managers and by health practitioners (Yan et al., 2019). Satellite-derived emission source data and pollutant and LULC data are correlated with CEMS data for compliance monitoring (Kurinji and Ganguly, 2020).
This plane has provision for health impact data processing using hospital records, traffic sensor data, mobile phone activity data, wearable device data, ridership data, real-time and historical meteorology data, social media, and gridded pollution data generated from the data fusion layer and using ML methods such as random forest, support vector machine, and multiple regression methods giving pollution exposure information at a location and time (Hu et al., 2014; Masiol et al., 2018).
5.4.4 Hybrid Models
ML methods are applied to air quality models, such as WRF-Chem, to improve predictability by bias correction and for faster processing (Ma et al., 2020). The processing is executed using Keras, TensorFlow, PyTorch, NumPy, python scripts, and CUDA environment.
The data processing pipelines involve various tools and libraries, as shown in Figure 7 (Supplementary Table S6).
5.5 Application Service Plane (DIV)
Data processed in previous planes is accessed through a service layer of the decision support system. This multi-user interactive layer is activated through a GUI with query system, scheduler, GIS, and data orchestration through the portal or mobile app service (Table 1). The application services include sector-specific raw data and metadata access and visualization. Public services include alerts, pollution monitoring data, pollutant comparison between different locations, exceptional events, future prediction, and control scenario projection in the form of pollution concentration maps, infographics, and virtual reality such as dispersion trend analysis in a hotspot area. The pollution maps created through data fusion of IoT data, model output, and satellite, mapped with interactive GIS, enable citizens to access localized pollution information through the query system, such as deciding to reduce exposure (e.g., avoiding outdoor exercise at selected location and time).
This smart city system has varied connotations for different stakeholders, for example, for air quality researchers, improving the accuracy of model prediction using high-resolution models executed on advanced HPC systems or using innovative methods using 4IR technology for reducing pollution impact. In contrast, for non-governmental agencies, it can be vulnerable location metadata derived from daily station data for advocacy purposes or sub-local AQI information to school authorities.
5.5.1 Visualization
Data visualization with GIS is an inherent component of the city’s digital platform and DSS. Its usage runs across all the components of SmartAirQ, from EI development to dissemination services (Dalvi et al., 2006; Badach et al., 2020). WebGIS allows full view of the city, standardized data access, interactive location-specific query, and navigation (Gkatzoflias et al., 2013). SmartAirQ architecture considers it a vertical plane running across all other service planes.
Visual representation of data is triggered by user query or sector-specific action in the form of infographics, plots, 3D animation, augmented reality and virtual reality (AR/VR), time-series graphs, trend analysis, correlation, exceedance, prediction information, industry compliance reports, and AQI display (Elbir et al., 2010; Li W. et al., 2020). The dynamic visualization includes interactive navigation displaying pollutant information along all the routes with an expected time of arrival information. The application service has a restful API for data exchanges. The scientific plots are viewed through Vapor/NCL.
5.6 Data Privacy and Security Plane (DB)
As soon as the data are accessed, they are anonymized with system-driven ID and personal or system-specific details, such as department name, and the authority name is coded into the independent key by applying cryptography algorithms (Toma et al., 2019). The data has multi-layer authorization. In an example of a collaborative research case, first, the researcher creates EI with activity data and emission factors in their own restricted space. Second, the researcher provides permission to access this derived EI data to the authorized member from the city environment department through a password protection mechanism. In the future, blockchain methods for secure data communications can be explored (Benedict et al., 2019).
6 Use Cases
Moving now from theory to practice, we present use-case scenarios that illustrate the applicability of the SmartAirQ framework in UAQM functions.
These use cases present the cross-sector functionality orchestration and decision services specific to the user category. The consolidated actions undergo step-wise data translation through different planes and technology applications. The examples of use cases are drawn from Table 1. These use cases have stakeholders, users, and smart city service components as actors. This section discusses the example of the use case of emission control measure mitigation. Additional use cases are presented in Tables 2–4.
6.1 Emission Control Measure Mitigation Process Flow
6.1.1 Description
For pollution mitigation and its efficacy assessment, large data must be brought together, linked, and inferred in the context in which it is applied, which requires an efficient database management system maneuvering cross-sector data and metadata.
In this use case, the control measures selection process is instrumented by a local environment manager, considering the business as usual scenario or future scenario projection data analytics. It accesses the pre-simulated future projections using dispersion models.
6.1.2 Data and Functionality Pathways
Emission factors and EI activity data generated from source apportionment studies are uploaded by researchers through the data acquisition plane (Figure 8). The system applies data wrangling and data classification methods by data mining of source categories and sub-categories. The city environment manager selects business as usual scenarios and control scenarios. The data are processed in the data processing plane with a calculation of emission load, reduction factor, and applicability ratio. Based on the query and user-selected pollutant type, source type from the area, point or line, scenario type, such as the closure of construction work in a fixed time or banning diesel vehicles, emission factor selection, and analytics mode, such as emission load in kg/year or ton/day, a cumulated scenario is generated (Figure 9). The backend calculations are executed using WRF-Chem and AERMOD models projected simulations using cloud resources, and analytics is conducted using R libraries.
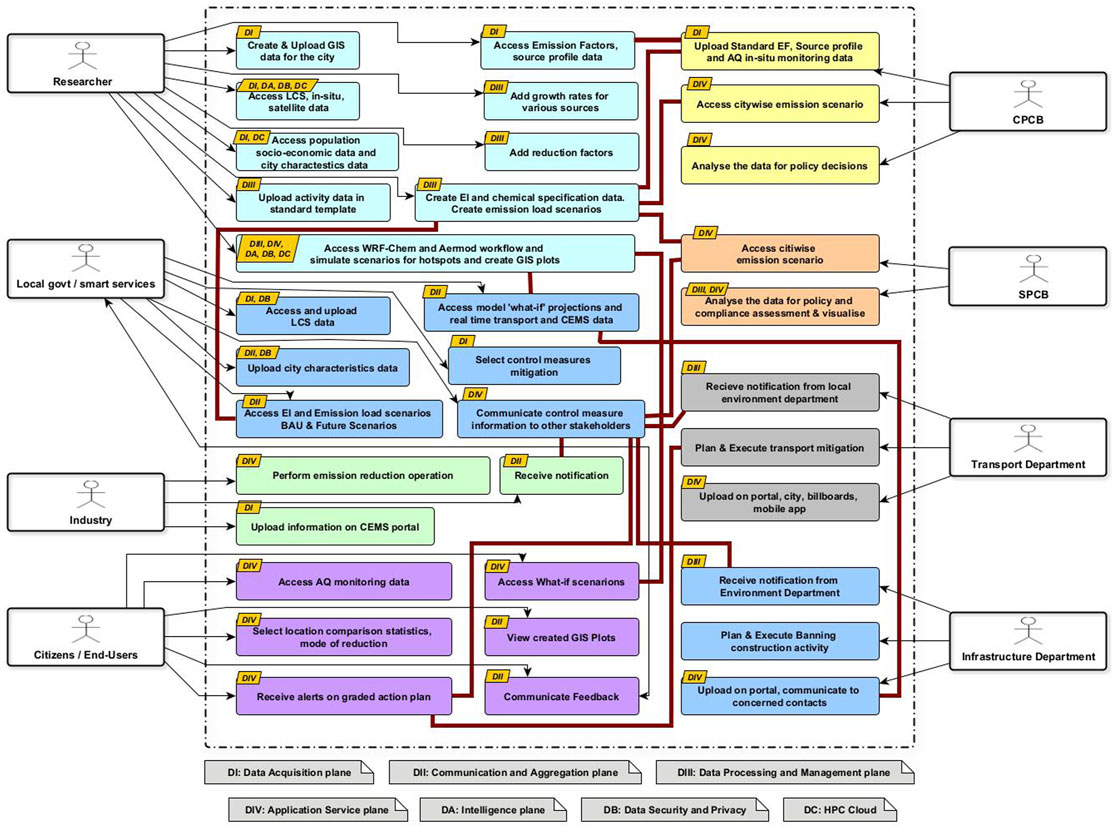
FIGURE 8. Cross-sector stakeholder functions for control scenarios orchestrated through the SmartAirQ planes.
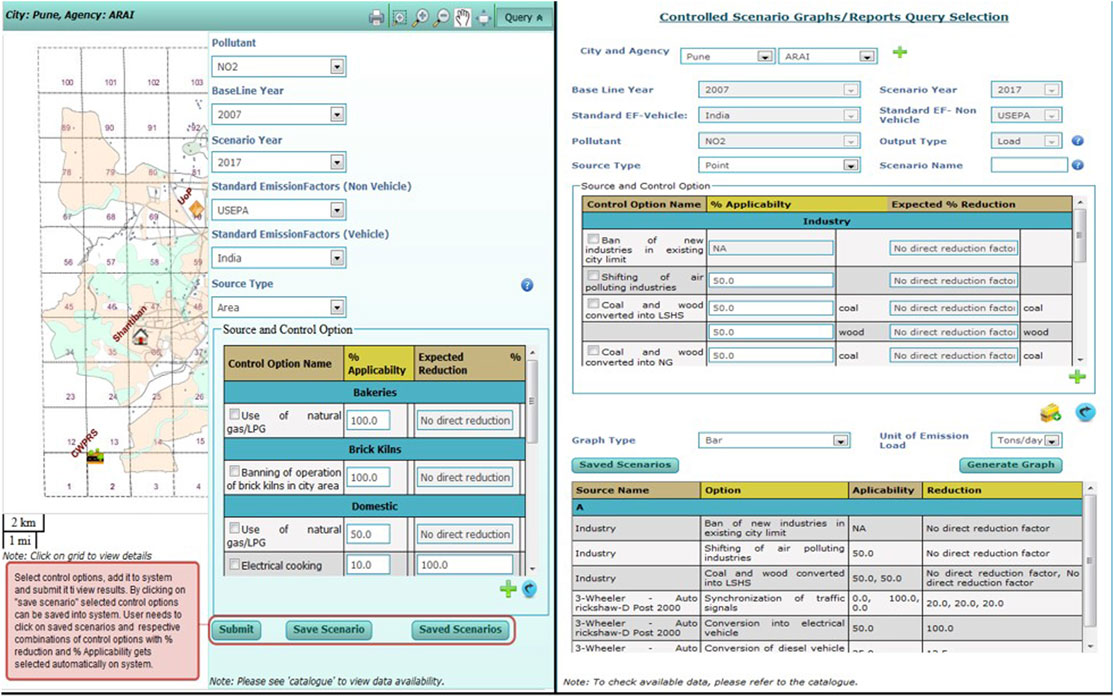
FIGURE 9. Interactive decision support system for future control scenario projection visualization (Kaginalkar et al., 2022) © Copyright [19 Jan 2022] American Meteorological Society (AMS). For permission to reuse any portion of this work, please contact permissions@ametsoc.org. Any use of material in this work that is determined to be “fair use” under Section 107 of the U.S. Copyright Act (17 U.S. Code § 107) or that satisfies the conditions specified in Section 108 of the U.S. Copyright Act (17 USC § 108) does not require the AMS’s permission. Republication, systematic reproduction, posting in electronic form, such as on a website or in a searchable database, or other uses of this material, except as exempted by the above statement, requires written permission or a license from the AMS. All AMS journals and monograph publications are registered with the Copyright Clearance Center (https://www.copyright.com). Additional details are provided in the AMS Copyright Policy statement, available on the AMS website (https://www.ametsoc.org/PUBSCopyrightPolicy).
6.1.3 Outcome
The total % reduction is displayed either as plots or GIS-based heat maps (Figure 9). In the decision chain, the manager links the data with energy, transport, traffic, infrastructure department, and state pollution control board members. The concerned stakeholders view the applicability and feasibility of control measures with interactive pollutant, source, control scenarios selection, comparison between two locations, and so forth. The selected control measures are then implemented by respective stakeholders.
6.2 Extreme Pollution
This use case involves an extreme pollution event in a city. In response, the orchestration of services from the city environment manager, traffic manager, scientists, citizens, and SmartAirQ middleware services are executed, as shown in Table 2.
6.3 Modeling
In real-time operations, there can be a trade-off between models due to computational complexity. This use case involves scientists running model workflows (Table 3) using standard operating procedures at different entry points on HPC-cloud (Figure 10).
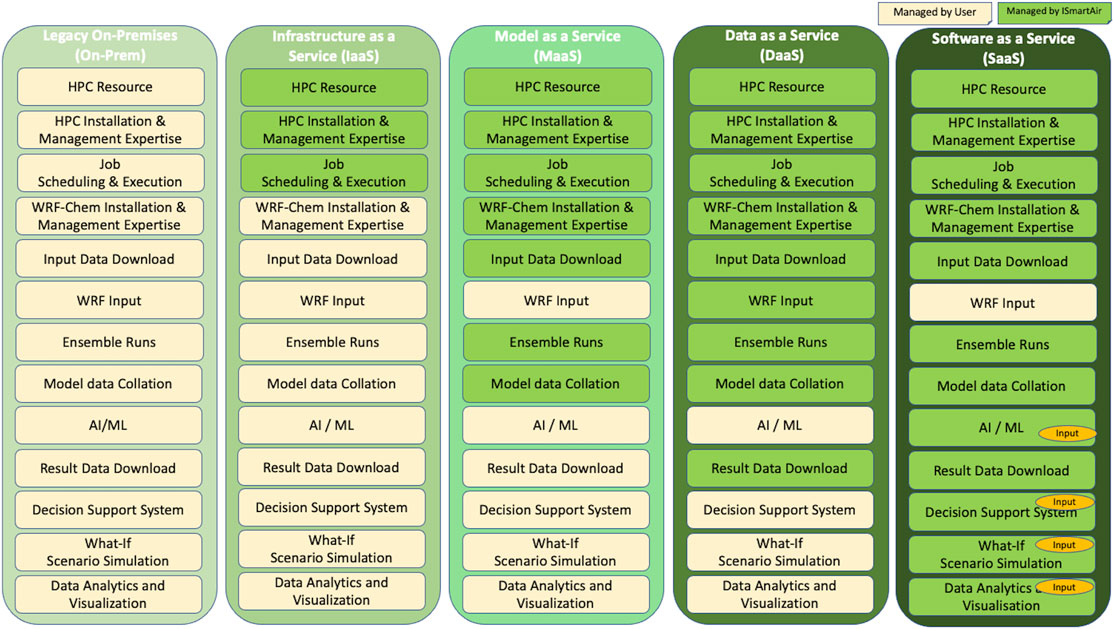
FIGURE 10. HPC-cloud services with PaaS, IaaS, MaaS, DaaS, and SaaS examples of WRF and WRF-Chem model workflows: services in green (managed by SmartAirQ), services in cream (managed by user).
6.4 Traffic Management
This involves data processing and management, intelligence plane, smart city service, and citizens as actors (Table 4).
7 Summary
For successful environmental services in smart cities, seamless data exchanges and their systematic interpretation for cross-sectorial decisions are essential. UAQM is a multidimensional service involving policy formulation, monitoring, prediction, awareness, enforcement, health impact assessment, and mitigation. In the backdrop of NCAP and India’s smart city mission, it is imperative to develop an integrated open data and smart city information ecosystem for UAQM.
This study presented SmartAirQ, a conceptual integrated data governance and 4IR technology framework for air quality smart city service. It is primarily for researchers, policymakers, and governance to enable actions for end-users such as non-governmental organizations, citizens, and health practitioners. The big data and cloud platform built within SmartAirQ provide scalable, interoperable, sustainable, and affordable solutions for scientific and last-mile services. The cloud services enable participative UAQM governance with data reuse and shared computing resources, reducing the carbon footprint.
The data governance architecture opens up avenues to formulate, implement, and evaluate control measures for future actions and in real time at various scales and sectors. SmartAirQ facilitates the inclusion of newer data and citizen science information into the governance realm with monitoring, exposure information, and perception. Its predictive hybrid numerical and AI modeling system enables cause (source apportionment) to effect (air quality prediction) to impact (health assessment models) value chain for hyper-local pollution risk reduction. It brings two critical components under UAQM data governance: cross-sector data with the computing ecosystem and stakeholders as co-producers/co-owners of data.
Well-defined data governance, harmonizing disparate data, is the first step toward sustainable smart cities. With ever-increasing urban data, a framework such as SmartAirQ is an exemplary co-created smart city service with context-dependent solutions for environmental issues that go beyond the monitoring and modeling data information portal. The SmartAirQ flexible architecture is scalable across world cities, aiding in efforts toward Sustainable development goals.
Although this conceptual framework is designed for ambient urban air pollution, our follow-up work will report on the interaction between the ambient and indoor air quality and system deployment experiences.
The recent WHO global air quality guidelines (WHO, 2021) call for technologically driven, science-society collaborative actions for pollution reduction. The SmartAirQ framework is apt to facilitate these translations for an effective UAQM.
Author Contributions
AK conceptualized and developed the manuscript with formal analysis. AK and NK contributed to the visualization. SK, PG, and DN contributed to the review and revision of the draft.
Conflict of Interest
The authors declare that the research was conducted in the absence of any commercial or financial relationships that could be construed as a potential conflict of interest.
Publisher’s Note
All claims expressed in this article are solely those of the authors and do not necessarily represent those of their affiliated organizations or those of the publisher, the editors, and the reviewers. Any product that may be evaluated in this article, or claim that may be made by its manufacturer, is not guaranteed or endorsed by the publisher.
Acknowledgments
AK acknowledges the support of colleagues from C-DAC, Pune, and faculty of Institute of Environment Education and Research, Bharati Vidyapeeth Deemed University, Pune, India. AK acknowledges the participation of the stakeholders in the research. AK and NK thank the National Supercomputing Mission program, India. DN acknowledges India DST National Network Program on Urban Climate, US NSF, and the NASA Interdisciplinary Sciences program. Authors appreciate the time and efforts of the editor and the reviewers for their valuable suggestion to improve the quality of the paper.
Supplementary Material
The Supplementary Material for this article can be found online at: https://www.frontiersin.org/articles/10.3389/fenvs.2022.785129/full#supplementary-material
Abbreviations
ANN, artificial neural network; AOD, aerosol optical depth; AQI, air quality index; AR, augmented reality; BC, black carbon; CCTV, close circuit tv; CFD, computational fluid dynamics; CO, carbon monoxide; CUDA, compute unified device architecture; DALY, disability-adjusted life years; GDP, gross development; GHG, greenhouse gas; GIS, geographical information system; GPS, global positioning system; HDFS, Hadoop Data File System; HPC, high-performance computing; OC, organic carbon; QA/QC, quality assurance and quality control; RF, random forest; RFID, radio frequency identification; RTI, right to information; SDG, sustainable development goals; SVM, support vector machine; VOC, volatile organic compound; VR, virtual reality; WRF, weather research and forecast.
Footnotes
1https://app.cpcbccr.com/ccr/#/caaqm-dashboard-all/caaqm-landing.
2(https://ncap.carboncopy.info/caaqms/).
3https://prana.cpcb.gov.in/#/home.
5openaq.org, https://ncap.carboncopy.info/caaqms/.
6https://smurbs.eu/solutions/.
7https://timesofindia.indiatimes.com/city/delhi/air-pollution-delhi-schools-to-remain-shut-for-physical-classes-till-further-orders/articleshow/87831917.cms.
8https://catalogue.iudx.org.in/.
References
Achakulwisut, P., Brauer, M., Hystad, P., and Anenberg, S. C. (2019). Global, National, and Urban Burdens of Paediatric Asthma Incidence Attributable to Ambient NO2 Pollution: Estimates from Global Datasets. Lancet Planet. Health. 3, e166–e178. doi:10.1016/s2542-5196(19)30046-4
Ahlgren, B., Hidell, M., and Ngai, E. C.-H. (2016). Internet of Things for Smart Cities: Interoperability and Open Data. IEEE Internet Comput. 20, 52–56. doi:10.1109/mic.2016.124
AirNow. Home Page | AirNow.Gov. [WWW Document]. URL Available at: https://www.airnow.gov/(accessed 9 10, 20)
AirQ+. AirQ+: Software Tool for Health Risk Assessment of Air Pollution. [WWW Document]. URL Available at: https://www.euro.who.int/en/health-topics/environment-and-health/air-quality/activities/airq-software-tool-for-health-risk-assessment-of-air-pollution (accessed 22 7, 21).
Albino, V., Berardi, U., and Dangelico, R. M. (2015). Smart Cities: Definitions, Dimensions, Performance, and Initiatives. J. Urban Technology. 22, 3–21. doi:10.1080/10630732.2014.942092
Alexeeff, S. E., Roy, A., Shan, J., Liu, X., Messier, K., Apte, J. S., et al. (2018). High-resolution Mapping of Traffic Related Air Pollution with Google Street View Cars and Incidence of Cardiovascular Events within Neighborhoods in Oakland, CA. Environ. Health. 17, 38. doi:10.1186/s12940-018-0382-1
Allam, Z., and Dhunny, Z. A. (2019). On Big Data, Artificial Intelligence and Smart Cities. Cities. 89, 80–91. doi:10.1016/j.cities.2019.01.032
Alvear, O., Calafate, C. T., Cano, J.-C., and Manzoni, P. (2018). Crowdsensing in Smart Cities: Overview, Platforms, and Environment Sensing Issues. Sensors 18 (2), 460. doi:10.3390/s18020460
Ameer, S., Shah, M. A., Khan, A., Song, H., Maple, C., Islam, S. U., et al. (2019). Comparative Analysis of Machine Learning Techniques for Predicting Air Quality in Smart Cities. IEEE Access 7, 128325–128338. doi:10.1109/access.2019.2925082
Anenberg, S. C., Achakulwisut, P., Brauer, M., Moran, D., Apte, J. S., and Henze, D. K. (2019). Particulate Matter-Attributable Mortality and Relationships with Carbon Dioxide in 250 Urban Areas Worldwide. Sci. Rep. 9, 11552–11556. doi:10.1038/s41598-019-48057-9
Ang, L.-M., and Seng, K. P. (2016). Big Sensor Data Applications in Urban Environments. Big Data Res. 4, 1–12. doi:10.1016/j.bdr.2015.12.003
Apte, J. S., Messier, K. P., Gani, S., Brauer, M., Kirchstetter, T. W., Lunden, M. M., et al. (2017). High-Resolution Air Pollution Mapping with Google Street View Cars: Exploiting Big Data. Environ. Sci. Technol. 51, 6999–7008. doi:10.1021/acs.est.7b00891
Asgari, M., Farnaghi, M., and Ghaemi, Z. (2017). “Predictive Mapping of Urban Air Pollution Using Apache Spark on a Hadoop Cluster,” in Proceedings of the 2017 International Conference on Cloud and Big Data Computing, ICCBDC 2017 (London, United Kingdom: Association for Computing Machinery), 89–93. doi:10.1145/3141128.3141131
Atrouche, A., Idoughi, D., and David, B. (2015). "A Mashup-Based Application for the the Smart City Problematic," in Human-Computer Interaction: Interaction Technologies. HCI 2015. Lecture Notes in Computer Science. Editor M. Kurosu. (Cham: Springer), 9170. doi:10.1007/978-3-319-20916-6_63
Azevedo Guedes, A., Carvalho Alvarenga, J., Dos Santos Sgarbi Goulart, M., Rodriguez y Rodriguez, M., and Pereira Soares, C. (2018). Smart Cities: The Main Drivers for Increasing the Intelligence of Cities. Sustainability. 10, 3121. doi:10.3390/su10093121
Badach, J., Voordeckers, D., Nyka, L., and Van Acker, M. (2020). A Framework for Air Quality Management Zones - Useful GIS-Based Tool for Urban Planning: Case Studies in Antwerp and Gdańsk. Building Environ. 174, 106743. doi:10.1016/j.buildenv.2020.106743
Badii, C., Bellini, P., Difino, A., Nesi, P., Pantaleo, G., and Paolucci, M. (2019). MicroServices Suite for Smart City Applications. Sensors. 19, 4798. doi:10.3390/s19214798
Baklanov, A., Cárdenas, B., Lee, T.-c., Leroyer, S., Masson, V., Molina, L. T., et al. (2020). Integrated Urban Services: Experience from Four Cities on Different Continents. Urban Clim. 32, 100610. doi:10.1016/j.uclim.2020.100610
Baklanov, A., Grimmond, C. S. B., Carlson, D., Terblanche, D., Tang, X., Bouchet, V., et al. (2018). From Urban Meteorology, Climate and Environment Research to Integrated City Services. Urban Clim. 23, 330–341. doi:10.1016/j.uclim.2017.05.004
Baklanov, A., Molina, L. T., and Gauss, M. (2016). Megacities, Air Quality and Climate. Atmos. Environ. 126, 235–249. doi:10.1016/j.atmosenv.2015.11.059
Baklanov, A., and Zhang, Y. (2020). Advances in Air Quality Modeling and Forecasting. Glob. Transitions. 2, 261–270. doi:10.1016/j.glt.2020.11.001
Balakrishnan, K., Dey, S., Gupta, T., Dhaliwal, R. S., Brauer, M., Cohen, A. J., et al. (2019). The Impact of Air Pollution on Deaths, Disease burden, and Life Expectancy across the States of India: The Global Burden of Disease Study 2017. Lancet Planet. Health. 3, e26–e39. doi:10.1016/S2542-5196(18)30261-4
Ballejos, L. C., and Montagna, J. M. (2011). Modeling Stakeholders for Information Systems Design Processes. Requirements Eng. 16, 281–296. doi:10.1007/s00766-011-0123-2
Baškarada, S. (2014). Qualitative Case Study Guidelines. The Qualitative Report. 19, 1–18. doi:10.46743/2160-3715/2014.1008
Behera, S. N., Sharma, M., Dikshit, O., and Shukla, S. P. (2011). GIS-Based Emission Inventory, Dispersion Modeling, and Assessment for Source Contributions of Particulate Matter in an Urban Environment. Water Air Soil Pollut. 218, 423–436. doi:10.1007/s11270-010-0656-x
Beig, G., Chate, D. M., Sahu, S. K., Parkhi, N. S., Srinivas, R., Kausar, S., et al. (2015). System of Air Quality Forecasting and Research (SAFAR – India). WMO GAW 217, 51. https://mce2.org/wmogurme/images/reports/GAW_217%20(SAFAR).pdf.
Bellinger, C., Mohomed Jabbar, M. S., Zaïane, O., and Osornio-Vargas, A. (2017). A Systematic Review of Data Mining and Machine Learning for Air Pollution Epidemiology. BMC Public Health 17, 907. doi:10.1186/s12889-017-4914-3
Benedict, S., Rumaise, P., and Kaur, J. (2019). “IoT Blockchain Solution for Air Quality Monitoring in SmartCities,” in 2019 IEEE International Conference on Advanced Networks and Telecommunications Systems (ANTS), 1–6. doi:10.1109/ANTS47819.2019.9118148
Bibri, S. E., and Krogstie, J. (2020). The Emerging Data-Driven Smart City and its Innovative Applied Solutions for Sustainability: the Cases of London and Barcelona. Energy Inform 3, 5. doi:10.1186/s42162-020-00108-6
Bibri, S. E. (2019). The Sciences Underlying Smart Sustainable Urbanism: Unprecedented Paradigmatic and Scholarly Shifts in Light of Big Data Science and Analytics. Smart Cities 2, 179–213. doi:10.3390/smartcities2020013
Braithwaite, I., Zhang, S., Kirkbride, J. B., Osborn, D. P. J., and Hayes, J. F. (2019). Air Pollution (Particulate Matter) Exposure and Associations with Depression, Anxiety, Bipolar, Psychosis and Suicide Risk: A Systematic Review and Meta-Analysis. Environ. Health Perspect. 127, 126002. doi:10.1289/EHP4595
Capineri, C., Haklay, M., Huang, H., Antoniou, V., Kettunen, J., Ostermann, F., et al. (2016). "Introduction," in European Handbook of Crowdsourced Geographic Information. Editors C. Capineri, M. Haklay, H. Huang, V. Antoniou, J. Kettunen, and F. Ostermann. (London: Ubiquity Press), 1–11. doi:10.5334/bax.a
Cárdenas Rodríguez, M., Dupont-Courtade, L., and Oueslati, W. (2016). Air Pollution and Urban Structure Linkages: Evidence from European Cities. Renew. Sustainable Energ. Rev. 53, 1–9. doi:10.1016/j.rser.2015.07.190
Carslaw, D. C., and Ropkins, K. (2012). Openair - An R Package for Air Quality Data Analysis. Environ. Model. Softw. 27-28, 52–61. doi:10.1016/j.envsoft.2011.09.008
Castell, N., Schneider, P., Grossberndt, S., Fredriksen, M. F., Sousa-Santos, G., Vogt, M., et al. (2018). Localized Real-Time Information on Outdoor Air Quality at Kindergartens in Oslo, Norway Using Low-Cost Sensor Nodes. Environ. Res. 165, 410–419. doi:10.1016/j.envres.2017.10.019
Castelli, M., Clemente, F. M., Popovič, A., Silva, S., and Vanneschi, L. (2020). A Machine Learning Approach to Predict Air Quality in California. Complexity 2020, 8049504. doi:10.1155/2020/8049504
Charitidis, P., Papadopoulos, S., Apostolidis, L., and Kompatsiaris, I. (2019). “Social media Monitoring Tools for Air Quality Accounts,” in IEEE/WIC/ACM International Conference on Web Intelligence - Companion Volume, WI ’19 Companion (Thessaloniki, Greece: Association for Computing Machinery), 215–222. doi:10.1145/3358695.3361106
Che, W., Frey, H. C., Fung, J. C. H., Ning, Z., Qu, H., Lo, H. K., et al. (2020). PRAISE-HK: A Personalized Real-Time Air Quality Informatics System for Citizen Participation in Exposure and Health Risk Management. Sustainable Cities Soc. 54, 101986. doi:10.1016/j.scs.2019.101986
Ching, J., Mills, G., Bechtel, B., See, L., Feddema, J., Wang, X., et al. (2018). WUDAPT: An Urban Weather, Climate, and Environmental Modeling Infrastructure for the Anthropocene. Bull. Amer. Meteorol. Soc. 99, 1907–1924. doi:10.1175/bams-d-16-0236.1
Cho, D., Yoo, C., Im, J., and Cha, D. H. (2020). Comparative Assessment of Various Machine Learning‐Based Bias Correction Methods for Numerical Weather Prediction Model Forecasts of Extreme Air Temperatures in Urban Areas. Earth Space Sci. 7, e2019EA000740. doi:10.1029/2019EA000740
Chu, H.-J., Ali, M. Z., and He, Y.-C. (2020). Spatial Calibration and PM2.5 Mapping of Low-Cost Air Quality Sensors. Sci. Rep. 10, 22079. doi:10.1038/s41598-020-79064-w
CII, Dalberg (2021). Air Pollution and its Impact on Business - The Silent Pandemic. Available at: https://www.cleanairfund.org/publication/economic-impacts-india/.
Cimorelli, A. J., Perry, S. G., Venkatram, A., Weil, J., Paine, R. J., Wilson, R. B., et al. (2005). AERMOD: A Dispersion Model for Industrial Source Applications. Part I: General Model Formulation and Boundary Layer Characterization. J. Appl. Meteorol. 44 (5), 682–693. doi:10.1175/JAM2227.1
Constant, N. (2018). “Role of Citizen Science in Air Quality Monitoring,” in Urban Pollution (John Wiley & Sons), 303–312. doi:10.1002/9781119260493.ch23
CPCB (2019). Report : National clear Air Programme. [WWW Document]. URL. Available at: http://moef.gov.in/wp-content/uploads/2019/05/NCAP_Report.pdf.
Creutzig, F., Lohrey, S., Bai, X., Baklanov, A., Dawson, R., Dhakal, S., et al. (2019). Upscaling Urban Data Science for Global Climate Solutions. Glob. Sustainability 2, e2. doi:10.1017/sus.2018.16
Cui, L., xie, G., Qu, Y., Gao, L., and yang, Y. (2018). Security and Privacy in Smart Cities: Challenges and Opportunities. IEEE Access 6, 46134–46145. doi:10.1109/ACCESS.2018.2853985
Dalvi, M., Beig, G., Patil, U., Kaginalkar, A., Sharma, C., and Mitra, A. P. (2006). A GIS Based Methodology for Gridding of Large-Scale Emission Inventories: Application to Carbon-Monoxide Emissions over Indian Region. Atmos. Environ. 40, 2995–3007. doi:10.1016/j.atmosenv.2006.01.013
Dey, S., Purohit, B., Balyan, P., Dixit, K., Bali, K., Kumar, A., et al. (2020). A Satellite-Based High-Resolution (1-km) Ambient PM2.5 Database for India over Two Decades (2000-2019): Applications for Air Quality Management. Remote Sensing 12, 3872. doi:10.3390/rs12233872
Dirks, K., Salmond, J., and Talbot, N. (2018). Air Pollution Exposure in Walking School Bus Routes: A New Zealand Case Study. Int. J. Environ. Res. Public Health 15, 2802. doi:10.3390/ijerph15122802
Donaire-Gonzalez, D., Valentín, A., de Nazelle, A., Ambros, A., Carrasco-Turigas, G., Seto, E., et al. (2016). Benefits of Mobile Phone Technology for Personal Environmental Monitoring. JMIR Mhealth Uhealth. 4, e126. doi:10.2196/mhealth.5771
Dwevedi, R., Krishna, V., and Kumar, A. (2018). Environment and Big Data: Role in Smart Cities of India. Resources 7, 64. doi:10.3390/resources7040064
Elbir, T., Mangir, N., Kara, M., Simsir, S., Eren, T., and Ozdemir, S. (2010). Development of a GIS-Based Decision Support System for Urban Air Quality Management in the City of Istanbul. Atmos. Environ. 44, 441–454. doi:10.1016/j.atmosenv.2009.11.008
Engel-Cox, J. A., Hoff, R. M., and Haymet, A. D. J. (2004). Recommendations on the Use of Satellite Remote-Sensing Data for Urban Air Quality. J. Air Waste Management Assoc. 54, 1360–1371. doi:10.1080/10473289.2004.10471005
English, P. B., Richardson, M. J., and Garzón-Galvis, C. (2018). From Crowdsourcing to Extreme Citizen Science: Participatory Research for Environmental Health. Annu. Rev. Public Health 39, 335–350. doi:10.1146/annurev-publhealth-040617-013702
EPA (2015). Citizen Science Opportunities for Monitoring Air Quality. Available at: https://www.epa.gov/sites/default/files/2015-06/documents/citizen_science_air_monitoring_factsheet_march_2015.pdf.
Fazziki, A. E., Sadiq, A., Ouarzazi, J., and Sadgal, M. (2015). “A Multi-Agent Framework for a Hadoop Based Air Quality Decision Support System,” in CAiSE Industry Track.
Fotopoulou, E., Zafeiropoulos, A., Papaspyros, D., Hasapis, P., Tsiolis, G., Bouras, T., et al. (2016). Linked Data Analytics in Interdisciplinary Studies: The Health Impact of Air Pollution in Urban Areas. IEEE Access 4, 149–164. doi:10.1109/access.2015.2513439
Fragomeni, M. B. A., Bernardes, S., Shepherd, J. M., and Rivero, R. (2020). A Collaborative Approach to Heat Response Planning: A Case Study to Understand the Integration of Urban Climatology and Land-Use Planning. Urban Clim. 33, 100653. doi:10.1016/j.uclim.2020.100653
Gargava, P., and Rajagopalan, V. (2016). Source Apportionment Studies in Six Indian Cities-Drawing Broad Inferences for Urban PM10 Reductions. Air Qual. Atmos. Health 9, 471–481. doi:10.1007/s11869-015-0353-4
Gately, C. K., Hutyra, L. R., Peterson, S., and Sue Wing, I. (2017). Urban Emissions Hotspots: Quantifying Vehicle Congestion and Air Pollution Using mobile Phone GPS Data. Environ. Pollut. 229, 496–504. doi:10.1016/j.envpol.2017.05.091
Geng, G., Xiao, Q., Liu, S., Liu, X., Cheng, J., Zheng, Y., et al. (2021). Tracking Air Pollution in China: Near Real-Time PM2.5 Retrievals from Multisource Data Fusion. Environ. Sci. Technol. 55, 12106–12115. doi:10.1021/acs.est.1c01863
Gharaibeh, A., Salahuddin, M., Hussini, S., Khreishah, A., Khalil, I., Guizani, M., et al. (2017). Smart Cities: A Survey on Data Management, Security and Enabling Technologies. IEEE Communications Surveys & Tutorials, 1. doi:10.1109/COMST.2017.2736886
Ghermandi, A., and Sinclair, M. (2019). Passive Crowdsourcing of Social media in Environmental Research: A Systematic Map. Glob. Environ. Change 55, 36–47. doi:10.1016/j.gloenvcha.2019.02.003
Ghude, S. D., Jena, C., Kumar, R., Debnath, S., Soni, V., Nanjundiah, R. S., et al. (2020). “Development of a High-Resolution (400 M) Operational Air Quality Early Warning System for Delhi, India through Integrated Chemical Data Assimilation,” in EGU General Assembly Conference Abstracts, EGU General Assembly Conference Abstracts, 12876.
Given, L. (2008). The SAGE Encylopedia of Qualitative Research Methods, Vols. 1–0. Thousand Oaks, CA: SAGE Publications, Inc. doi:10.4135/9781412963909
Gkatzoflias, D., Mellios, G., and Samaras, Z. (2013). Development of a Web GIS Application for Emissions Inventory Spatial Allocation Based on Open Source Software Tools. Comput. Geosciences 52, 21–33. doi:10.1016/j.cageo.2012.10.011
González, J. E., Ramamurthy, P., Bornstein, R. D., Chen, F., Bou-Zeid, E. R., Ghandehari, M., et al. (2021). Urban Climate and Resiliency: A Synthesis Report of State of the Art and Future Research Directions. Urban Clim. 38, 100858. doi:10.1016/j.uclim.2021.100858
GPAI (2020). Data Governance Working Group A Framework Paper for GPAI’s Work on Data Governance. Available at: https://gpai.ai/projects/data-governance/.
Grell, G. A., Peckham, S. E., Schmitz, R., McKeen, S. A., Frost, G., Skamarock, W. C., et al. (2005). Fully Coupled “Online” Chemistry within the WRF Model. Atmos. Environ. 39, 6957–6975. doi:10.1016/j.atmosenv.2005.04.027
Gulia, S., Nagendra, S. M. S., and Khare, M. (2017). A System Based Approach to Develop Hybrid Model Predicting Extreme Urban NO X and PM 2.5 Concentrations. Transportation Res. D: Transport Environ. 56, 141–154. doi:10.1016/j.trd.2017.08.005
Gulia, S., Shiva Nagendra, S. M., Khare, M., and Khanna, I. (2015). Urban Air Quality Management-A Review. Atmos. Pollut. Res. 6, 286–304. doi:10.5094/apr.2015.033
Gupta, P., Christopher, S. A., Wang, J., Gehrig, R., Lee, Y., and Kumar, N. (2006). Satellite Remote Sensing of Particulate Matter and Air Quality Assessment over Global Cities. Atmos. Environ. 40, 5880–5892. doi:10.1016/j.atmosenv.2006.03.016
Guttikunda, S. K., and Calori, G. (2013). A GIS Based Emissions Inventory at 1 Km × 1 Km Spatial Resolution for Air Pollution Analysis in Delhi, India. Atmos. Environ. 67, 101–111. doi:10.1016/j.atmosenv.2012.10.040
Habibzadeh, H., Kaptan, C., Soyata, T., Kantarci, B., and Boukerche, A. (2019). Smart City System Design: A Comprehensive Study of the Application and Data Planes. ACM Comput. Surv. 52, 41. doi:10.1145/3309545
Hagan, D. H., Gani, S., Bhandari, S., Patel, K., Habib, G., Apte, J. S., et al. (2019). Inferring Aerosol Sources from Low-Cost Air Quality Sensor Measurements: A Case Study in Delhi, India. Environ. Sci. Technol. Lett. 6, 467–472. doi:10.1021/acs.estlett.9b00393
Haghi, M., Stoll, R., and Thurow, K. (2018). A Low-Cost, Standalone, and Multi-Tasking Watch for Personalized Environmental Monitoring. IEEE Trans. Biomed. Circuits Syst. 12, 1144–1154. doi:10.1109/tbcas.2018.2840347
Harpham, Q. K., Hughes, A., and Moore, R. V. (2019). Introductory Overview: The OpenMI 2.0 Standard for Integrating Numerical Models. Environ. Model. Softw. 122, 104549. doi:10.1016/j.envsoft.2019.104549
Hashem, I. A. T., Chang, V., Anuar, N. B., Adewole, K., Yaqoob, I., Gani, A., et al. (2016). The Role of Big Data in Smart City. Int. J. Inf. Management 36, 748–758. doi:10.1016/j.ijinfomgt.2016.05.002
Haupt, S. E., Chapman, W., Adams, S. V., Kirkwood, C., Hosking, J. S., Robinson, N. H., et al. (2021). Towards Implementing Artificial Intelligence post-processing in Weather and Climate: Proposed Actions from the Oxford 2019 Workshop. Philos. Trans. A. Math. Phys. Eng. Sci. 379, 20200091. doi:10.1098/rsta.2020.0091
Hu, K., Davison, T., Rahman, A., and Sivaraman, V. (2014). “Air Pollution Exposure Estimation and Finding Association with Human Activity Using Wearable Sensor Network,” in Proceedings of the MLSDA 2014 2nd Workshop on Machine Learning for Sensory Data Analysis (Australia: MLSDA’14. Association for Computing Machinery, Gold Coast, Australia QLD), 48–55. doi:10.1145/2689746.2689749
Huang, Y., Zhao, Q., Zhou, Q., and Jiang, W. (2018). Air Quality Forecast Monitoring and its Impact on Brain Health Based on Big Data and the Internet of Things. IEEE Access 6, 78678–78688. doi:10.1109/access.2018.2885142
India Smart City (2015). Smart Cities Mission Statements and Guidelines. [WWW Document]. URL. Available at: http://smartcities.gov.in/upload/uploadfiles/files/SmartCityGuidelines(1).pdf.
Ismagilova, E., Hughes, L., Rana, N. P., and Dwivedi, Y. K. (2020). Security, Privacy and Risks within Smart Cities: Literature Review and Development of a Smart City Interaction Framework. Inf. Syst. Front. doi:10.1007/s10796-020-10044-1
ITU (2015). Report: ICT4SDG: Fast-Forward Progress, Leveraging Tech to Achieve Global Goals. [WWW Document]. URL. Available at: https://www.itu.int/en/sustainable-world/Documents/Fast-forward_progress_report_414709%20FINAL.pdf.
ITU (2020). Frontier Technologies to Protect the Environment and Tackle Climate Change. [WWW Document]. URL. Available at: http://staging.itu.int/en/publications/Documents/tsb/2020-Frontier-Technologies-to-Protect-the-Environment-and-Tackle-Climate-Change/files/basic-html/index.html (accessed 12 12, 20).
Jena, C., Ghude, S. D., Kumar, R., Debnath, S., Govardhan, G., Soni, V. K., et al. (2021). Performance of High Resolution (400 M) PM2.5 Forecast over Delhi. Sci. Rep. 11, 4104. doi:10.1038/s41598-021-83467-8
Jensen, D., and Campbell, J. (2019). The Case for a Digital Ecosystem for the Environment: Bringing Together Data, Algorithms and Insights for Sustainable Development. doi:10.13140/RG.2.2.10387.73764
Jiang, J.-Y., Sun, X., Wang, W., and Young, S. (2019). "Enhancing Air Quality Prediction with Social Media and Natural Language Processing," in Proceedings of the 57th Annual Meeting of the Association for Computational Linguistics. (Florence, Italy: Association for Computational Linguistics, 2627–2632. doi:10.18653/v1/p19-1251
Jiang, W., Wang, Y., Tsou, M.-H., and Fu, X. (2015). Using Social Media to Detect Outdoor Air Pollution and Monitor Air Quality Index (AQI): A Geo-Targeted Spatiotemporal Analysis Framework with Sina Weibo (Chinese Twitter). Plos One 10, e0141185. doi:10.1371/journal.pone.0141185
Johansson, L., Epitropou, V., Karatzas, K., Karppinen, A., Wanner, L., Vrochidis, S., et al. (2015). Fusion of Meteorological and Air Quality Data Extracted from the Web for Personalized Environmental Information Services. Environ. Model. Softw. 64, 143–155. doi:10.1016/j.envsoft.2014.11.021
Kaginalkar, A., Ghude, S. D., Mohanty, U. C., Mujumdar, P., Bhakare, S., Darbari, H., et al. (2022). Integrated Urban Environmental System of Systems for Weather Ready Cities in India. Bull. Am. Meteorol. Soc. 103, E54–E76. doi:10.1175/BAMS-D-20-0279.1
Kaginalkar, A., Kumar, S., Gargava, P., and Niyogi, D. (2021 Kaginalkar, A., Kumar, S., Gargava, P., Niyogi, D., 2021. Review of urban computing in air quality management as smart city service: An integrated IoT, AI, and cloud technology perspective. Urban Climate 39, 100972. https://doi.org/10.1016/j.uclim.2021.100972). Review of Urban Computing in Air Quality Management as Smart City Service: An Integrated IoT, AI, and Cloud Technology Perspective. Urban Clim. 39, 100972. doi:10.1016/j.uclim.2021.100972
Katoto, P. D. M. C., Brand, A. S., Bakan, B., Obadia, P. M., Kuhangana, C., Kayembe-Kitenge, T., et al. (2021). Acute and Chronic Exposure to Air Pollution in Relation with Incidence, Prevalence, Severity and Mortality of COVID-19: a Rapid Systematic Review. Environ. Health 20, 41. doi:10.1186/s12940-021-00714-1
Kerins, P., Nilson, E., Mackres, E., Rashid, T., Guzder-Williams, B., and Brumby, S. (2020). Spatial Characterization of Urban Land Use through Machine Learning. Technical Note. Washington, DC: World Resources Institute. Available online at: https://www.wri.org/publication/spatialcharacterization-urban-land-use.
Khan, A., Khorat, S., Khatun, R., Doan, Q.-V., Nair, U. S., and Niyogi, D. (2021). Variable Impact of COVID-19 Lockdown on Air Quality across 91 Indian Cities. Earth Interactions 25, 57–75. doi:10.1175/ei-d-20-0017.1
Khan, Z., Anjum, A., Soomro, K., and Tahir, M. A. (2015). Towards Cloud Based Big Data Analytics for Smart Future Cities. J. Cloud Comp. 4, 2. doi:10.1186/s13677-015-0026-8
Kindberg, T., Chalmers, M., and Paulos, E. (2007). Guest Editors' Introduction: Urban Computing. IEEE Pervasive Comput. 6, 18–20. doi:10.1109/mprv.2007.57
Klein, T., Kukkonen, J., Bossioli, E., Baklanov, A., Vik, A., Agnew, P., et al. (2012). Interactions of Physical, Chemical, and Biological Weather Calling for an Integrated Approach to Assessment, Forecasting, and Communication of Air Quality. Ambio 41 (8), 851–864. doi:10.1007/s13280-012-0288-z
Komninos, N., Bratsas, C., Komninos, N., Bratsas, C., Kakderi, C., and Tsarchopoulos, P. (2015). Smart City Ontologies: Improving the Effectiveness of Smart City Applications. J. Smart Cities 1, 1–16. doi:10.18063/jsc.2015.01.001
Kosmidis, E., Syropoulou, P., Tekes, S., Schneider, P., Spyromitros-Xioufis, E., Riga, M., et al. (2018). hackAIR: Towards Raising Awareness about Air Quality in Europe by Developing a Collective Online Platform. Ijgi 7, 187. doi:10.3390/ijgi7050187
Kotsev, A., Schleidt, K., Liang, S., Van der Schaaf, H., Khalafbeigi, T., Grellet, S., et al. (2018). Extending INSPIRE to the Internet of Things through SensorThings API. Geosciences 8, 221. doi:10.3390/geosciences8060221
Kulkarni, S. H., Ghude, S. D., Jena, C., Karumuri, R. K., Sinha, B., Sinha, V., et al. (2020). How Much Does Large-Scale Crop Residue Burning Affect the Air Quality in Delhi? Environ. Sci. Technol. 54, 4790–4799. doi:10.1021/acs.est.0c00329
Kurinji, S. L., and Ganguly., T. (2020). Managing India’s Air Quality Through an Eye in the Sky. New Delhi: Council on Energy, Environment and Water. https://www.ceew.in/publications/satellite-air-quality-monitoring-and-remote-pollution-sensing-india.
Landrigan, P. J., Fuller, R., Acosta, N. J. R., Adeyi, O., Arnold, R., Basu, N. N., et al. (2018). The Lancet Commission on Pollution and Health. The Lancet 391, 462–512. doi:10.1016/s0140-6736(17)32345-0
Laniak, G. F., Olchin, G., Goodall, J., Voinov, A., Hill, M., Glynn, P., et al. (2013). Integrated Environmental Modeling: A Vision and Roadmap for the Future. Environ. Model. Softw. 39, 3–23. doi:10.1016/j.envsoft.2012.09.006
Lau, P. L. B., Marakkalage, H., Zhou, Y., Ul Hassan, N., Yuen, C., Zhang, M., et al. (2019). A Survey of Data Fusion in Smart City Applications. Inf. Fusion 52, 357. doi:10.1016/j.inffus.2019.05.004
Lelieveld, J., Pozzer, A., Pöschl, U., Fnais, M., Haines, A., and Münzel, T. (2020). Loss of Life Expectancy from Air Pollution Compared to Other Risk Factors: a Worldwide Perspective. Cardiovasc. Res. 116, 1910–1917. doi:10.1093/cvr/cvaa025
Lepenies, R., and Zakari, I. S. (2021). Citizen Science for Transformative Air Quality Policy in Germany and Niger. Sustainability 13, 3973. doi:10.3390/su13073973
Leung, Y., Leung, K.-S., Wong, M.-H., Mak, T., Cheung, K.-Y., Lo, L.-Y., et al. (2018). An Integrated Web-Based Air Pollution Decision Support System - a Prototype. Int. J. Geographical Inf. Sci. 32, 1787–1814. doi:10.1080/13658816.2018.1460752
Li, H., Sodoudi, S., Liu, J., and Tao, W. (2020). Temporal Variation of Urban Aerosol Pollution Island and its Relationship with Urban Heat Island. Atmos. Res. 241, 104957. doi:10.1016/j.atmosres.2020.104957
Li, W., Batty, M., and Goodchild, M. F. (2020). Real-time GIS for Smart Cities. Int. J. Geographical Inf. Sci. 34, 311–324. doi:10.1080/13658816.2019.1673397
Li, T., Shen, H., Yuan, Q., Zhang, X., and Zhang, L. (2017). Estimating Ground-Level PM2.5 by Fusing Satellite and Station Observations: A Geo-Intelligent Deep Learning Approach. Geophys. Res. Lett. 44 (11), 985–1011. doi:10.1002/2017gl075710
Lim, C., Kim, K.-J., and Maglio, P. P. (2018). Smart Cities with Big Data: Reference Models, Challenges, and Considerations. Cities 82, 86–99. doi:10.1016/j.cities.2018.04.011
Liu, B., Zhao, Q., Jin, Y., Shen, J., and Li, C. (2021). Application of Combined Model of Stepwise Regression Analysis and Artificial Neural Network in Data Calibration of Miniature Air Quality Detector. Sci. Rep. 11, 3247. doi:10.1038/s41598-021-82871-4
Liu, X., Nielsen, P. S., Heller, A., and Gianniou, P. (2017). “SciCloud: A Scientific Cloud and Management Platform for Smart City Data,” in 2017 28th International Workshop on Database and Expert Systems Applications (DEXA), 27–31.
LondonAir (n.d). London Air Quality Network Air Quality Forecast for London. [WWW Document]. URL. Available at: https://www.londonair.org.uk/Londonair/Forecast/(accessed 9 10, 20).
Lv, Z., Li, X., Wang, W., Zhang, B., Hu, J., and Feng, S. (2018). Government Affairs Service Platform for Smart City. Future Generation Computer Syst. 81, 443–451. doi:10.1016/j.future.2017.08.047
Lytras, M. D., Visvizi, A., Torres-Ruiz, M., Damiani, E., and Jin, P. (2020). IEEE Access Special Section Editorial: Urban Computing and Well-Being in Smart Cities: Services, Applications, Policymaking Considerations. IEEE Access 8, 72340–72346. doi:10.1109/access.2020.2988125
Ma, J., Yu, Z., Qu, Y., Xu, J., and Cao, Y. (2020). Application of the XGBoost Machine Learning Method in PM2.5 Prediction: A Case Study of Shanghai. Aerosol Air Qual. Res. 20, 128–138. doi:10.4209/aaqr.2019.08.0408
Maag, B., Zhou, Z., and Thiele, L. (2018). A Survey on Sensor Calibration in Air Pollution Monitoring Deployments. IEEE Internet Things J. 5, 4857–4870. doi:10.1109/jiot.2018.2853660
Mabkhot, M., Ferreira, P., Maffei, M., Podrzaj, P., Madziel, M., Antonelli, D., et al. (2021). Mapping Industry 4.0 Enabling Technologies into United Nations Sustainability Development Goals. Sustainability 13, 2560. doi:10.3390/su13052560
Mahajan, S., Kumar, P., Pinto, J. A., Riccetti, A., Schaaf, K., Camprodon, G., et al. (2020). A Citizen Science Approach for Enhancing Public Understanding of Air Pollution. Sustainable Cities Soc. 52, 101800. doi:10.1016/j.scs.2019.101800
Majumdar, S., Subhani, M. M., Roullier, B., Anjum, A., and Zhu, R. (2021). Congestion Prediction for Smart Sustainable Cities Using IoT and Machine Learning Approaches. Sustainable Cities Soc. 64, 102500. doi:10.1016/j.scs.2020.102500
Martin, R. V. (2008). Satellite Remote Sensing of Surface Air Quality. Atmos. Environ. 42, 7823–7843. doi:10.1016/j.atmosenv.2008.07.018
Masiol, M., Zíková, N., Chalupa, D. C., Rich, D. Q., Ferro, A. R., and Hopke, P. K. (2018). Hourly Land-Use Regression Models Based on Low-Cost PM Monitor Data. Environ. Res. 167, 7–14. doi:10.1016/j.envres.2018.06.052
McGovern, A., Elmore, K. L., Gagne, D. J., Haupt, S. E., Karstens, C. D., Lagerquist, R., et al. (2017). Using Artificial Intelligence to Improve Real-Time Decision-Making for High-Impact Weather. Bull. Amer. Meteorol. Soc. 98, 2073–2090. doi:10.1175/bams-d-16-0123.1
Michalakes, J. (2020). “HPC for Weather Forecasting,” in Parallel Algorithms in Computational Science and Engineering. Editors A. Grama, and A. H. Sameh (Cham: Springer International Publishing), 297–323. doi:10.1007/978-3-030-43736-7_10
Mircea, M., Calori, G., Pirovano, G., and Belis, C. A. (2020). European Guide on Air Pollution Source Apportionment for Particulate Matter with Source Oriented Models and Their Combined Use with Receptor Models. EUR 30082 EN. Luxembourg: Publications Office of the European Union. 2020, ISBN 978-92-76-10698-2,.
Molina, L. T., Velasco, E., Retama, A., and Zavala, M. (2019). Experience from Integrated Air Quality Management in the Mexico City Metropolitan Area and Singapore. Atmosphere 10, 512. doi:10.3390/atmos10090512
Molthan, A. L., Case, J. L., Venner, J., Schroeder, R., Checchi, M. R., Zavodsky, B. T., et al. (2015). Clouds in the Cloud: Weather Forecasts and Applications within Cloud Computing Environments. Bull. Amer. Meteorol. Soc. 96, 1369–1379. doi:10.1175/BAMS-D-14-00013.1
Mondschein, J., Clark-Ginsberg, A., and Kuehn, A. (2021). Smart Cities as Large Technological Systems: Overcoming Organizational Challenges in Smart Cities through Collective Action. Sustainable Cities Soc. 67, 102730. doi:10.1016/j.scs.2021.102730
Morawska, L., Thai, P. K., Liu, X., Asumadu-Sakyi, A., Ayoko, G., Bartonova, A., et al. (2018). Applications of Low-Cost Sensing Technologies for Air Quality Monitoring and Exposure Assessment: How Far Have They Gone? Environ. Int. 116, 286–299. doi:10.1016/j.envint.2018.04.018
Nam, T., and Pardo, T. A. (2011). “Conceptualizing Smart City with Dimensions of Technology, People, and Institutions,” in Proceedings of the 12th Annual International Digital Government Research Conference: Digital Government Innovation in Challenging Times (College Park, Maryland, USA: Dg.o ’11. Association for Computing Machinery), 282–291. doi:10.1145/2037556.2037602
Nyhan, M. M., Kloog, I., Britter, R., Ratti, C., and Koutrakis, P. (2019). Quantifying Population Exposure to Air Pollution Using Individual Mobility Patterns Inferred from mobile Phone Data. J. Expo. Sci. Environ. Epidemiol. 29, 238–247. doi:10.1038/s41370-018-0038-9
Octaviano, C., Ramirez, F., Araiza, O., Nieto, I., Contearas, A., Ruiz, U., et al. (2020). Data for Climate Action Challenge : Electro-Mobility: Cleaning Mexico City’s Air with Transformational Climate Policies Through Big Data Pattern Analysis in Traffic & Social Mobility. [WWW Document]. URL. Available at: http://www.dataforclimateaction.org/meet-the-winners/.
Oke, T. R., Mills, G., Christen, A., and Voogt, J. A. (2017). Urban Climates. Cambridge: Cambridge University Press. doi:10.1017/9781139016476
Pandey, A., Brauer, M., Cropper, M. L., Balakrishnan, K., Mathur, P., Dey, S., et al. (2021). Health and Economic Impact of Air Pollution in the States of India: the Global Burden of Disease Study 2019. Lancet Planet. Health 5, e25–e38. doi:10.1016/S2542-5196(20)30298-9
Parisar (2020). Clearing the Haze. Available at: https://www.parisar.org/what-we-do/air-quality/advocacy/new-report-clearing-the-haze-an-analysis-of-air-quality-improvements-in-six-smart-cities-in-maharashtra.
Paskaleva, K., Evans, J., Martin, C., Linjordet, T., Yang, D., and Karvonen, A. (2017). Data Governance in the Sustainable Smart City. Informatics 4, 41. doi:10.3390/informatics4040041
Piedrahita, R., Xiang, Y., Masson, N., Ortega, J., Collier, A., Jiang, Y., et al. (2014). The Next Generation of Low-Cost Personal Air Quality Sensors for Quantitative Exposure Monitoring. Atmos. Meas. Tech. 7, 3325–3336. doi:10.5194/amt-7-3325-2014
Pinder, R. W., Klopp, J. M., Kleiman, G., Hagler, G. S. W., Awe, Y., and Terry, S. (2019). Opportunities and Challenges for Filling the Air Quality Data gap in Low- and Middle-Income Countries. Atmos. Environ. 215, 116794. doi:10.1016/j.atmosenv.2019.06.032
Pipalatkar, P., Khaparde, V. V., Gajghate, D. G., and Bawase, M. A. (2014). Source Apportionment of PM2.5 Using a CMB Model for a Centrally Located Indian City. Aerosol Air Qual. Res. 14, 1089–1099. doi:10.4209/aaqr.2013.04.0130
Ramacher, M. O. P., Kakouri, A., Speyer, O., Feldner, J., Karl, M., Timmermans, R., et al. (2021). The UrbEm Hybrid Method to Derive High-Resolution Emissions for City-Scale Air Quality Modeling. Atmosphere 12, 1404. doi:10.3390/atmos12111404
Ramos, F., Trilles, S., Muñoz, A., and Huerta, J. (2018). Promoting Pollution-free Routes in Smart Cities Using Air Quality Sensor Networks. Sensors 18, 2507. doi:10.3390/s18082507
Randhawa, A., and Kumar, A. (2017). Exploring Sustainability of Smart Development Initiatives in India. Int. J. Sustainable Built Environ. 6, 701–710. doi:10.1016/j.ijsbe.2017.08.002
Ranscombe, P. (2019). Wearable Technology for Air Pollution. Lancet Respir. Med. 7, 567–568. doi:10.1016/s2213-2600(19)30151-1
Rathore, M. M., Paul, A., Hong, W.-H., Seo, H., Awan, I., and Saeed, S. (2018). Exploiting IoT and Big Data Analytics: Defining Smart Digital City Using Real-Time Urban Data. Sustainable Cities Soc. 40, 600–610. doi:10.1016/j.scs.2017.12.022
Ravi, D., Wong, C., Lo, B., and Yang, G. Z. (2017). A Deep Learning Approach to On-Node Sensor Data Analytics for Mobile or Wearable Devices. IEEE J. Biomed. Health Inform. 21, 56–64. doi:10.1109/JBHI.2016.2633287
Reed, M. S., Graves, A., Dandy, N., Posthumus, H., Hubacek, K., Morris, J., et al. (2009). Who's in and Why? A Typology of Stakeholder Analysis Methods for Natural Resource Management. J. Environ. Manage. 90, 1933–1949. doi:10.1016/j.jenvman.2009.01.001
Rivas, I., Beddows, D. C. S., Amato, F., Green, D. C., Järvi, L., Hueglin, C., et al. (2020). Source Apportionment of Particle Number Size Distribution in Urban Background and Traffic Stations in Four European Cities. Environ. Int. 135, 105345. doi:10.1016/j.envint.2019.105345
Sahu, R., Nagal, A., Dixit, K. K., Unnibhavi, H., Mantravadi, S., Nair, S., et al. (2020). Robust Statistical Calibration and Characterization of Portable Low-Cost Air Quality Monitoring Sensors to Quantify Real-Time O3 and NO2 Concentrations in Diverse Environments. Atmos. Measur. Tech. 14, 37–52. doi:10.5194/amt-14-37-2021
Santana, E. F. Z., Chaves, A. P., Gerosa, M. A., Kon, F., and Milojicic, D. S. (2018). Software Platforms for Smart Cities. ACM Comput. Surv. 50, 1–37. doi:10.1145/3124391
Santiago, J. L., Borge, R., Martin, F., de la Paz, D., Martilli, A., Lumbreras, J., et al. (2017). Evaluation of a CFD-Based Approach to Estimate Pollutant Distribution within a Real Urban Canopy by Means of Passive Samplers. Sci. Total Environ. 576, 46–58. doi:10.1016/j.scitotenv.2016.09.234
Saraswat, I., Mishra, R. K., and Kumar, A. (2017). Estimation of PM10 Concentration from Landsat 8 OLI Satellite Imagery over Delhi, India. Remote Sensing Appl. Soc. Environ. 8, 251–257. doi:10.1016/j.rsase.2017.10.006
Schneider, R., Vicedo-Cabrera, A., Sera, F., Masselot, P., Stafoggia, M., de Hoogh, K., et al. (2020). A Satellite-Based Spatio-Temporal Machine Learning Model to Reconstruct Daily PM2.5 Concentrations across Great Britain. Remote Sensing 12, 3803. doi:10.3390/rs12223803
Sebestyén, V., Czvetkó, T., and Abonyi, J. (2021). The Applicability of Big Data in Climate Change Research: The Importance of System of Systems Thinking. Front. Environ. Sci. 9, 70. doi:10.3389/fenvs.2021.619092
Sekayi, D., and Kennedy, A. (2017). Qualitative Delphi Method: A Four Round Process with a Worked Example. Qual. Rep. 22, 2755–2763. doi:10.46743/2160-3715/2017.2974
Sentinel-5P. Sentinel-5P TROPOMI User Guide - Sentinel Online - Sentinel. [WWW Document]. URL. Available at: https://sentinel.esa.int/web/sentinel/user-guides/sentinel-5p-tropomi (accessed 11 5, 21).
Shi, Y., Ren, C., Lau, K. K.-L., and Ng, E. (2019). Investigating the Influence of Urban Land Use and Landscape Pattern on PM2.5 Spatial Variation Using mobile Monitoring and WUDAPT. Landscape Urban Plann. 189, 15–26. doi:10.1016/j.landurbplan.2019.04.004
Silva, B., Khan, M., Jung, C., Seo, J., Muhammad, D., Han, J., et al. (2018). Urban Planning and Smart City Decision Management Empowered by Real-Time Data Processing Using Big Data Analytics. Sensors 18, 2994. doi:10.3390/s18092994
Simmhan, Y., Nair, S., Monga, S., Sahu, R., Dixit, K., Sutaria, R., et al. (2019). “SATVAM: Toward an IoT Cyber-Infrastructure for Low-Cost Urban Air Quality Monitoring,” in 2019 15th International Conference on EScience (EScience). Presented at the 2019 15th International Conference on eScience (eScience), 57–66. doi:10.1109/escience.2019.00014
Skjetne, E., and Liu, H.-Y. (2017). Traffic Maps and Smartphone Trajectories to Model Air Pollution, Exposure and Health Impact. J. Environ. Prot. 08, 1372–1392. doi:10.4236/jep.2017.811084
Smith, R. B., Fecht, D., Gulliver, J., Beevers, S. D., Dajnak, D., Blangiardo, M., et al. (2017). Impact of London's Road Traffic Air and Noise Pollution on Birth Weight: Retrospective Population Based Cohort Study. BMJ 359, j5299. doi:10.1136/bmj.j5299
Smith, R. M., Pathak, P. A., and Agrawal, G. (2019). India's "smart" Cities mission: A Preliminary Examination into India's Newest Urban Development Policy. J. Urban Aff. 41, 518–534. doi:10.1080/07352166.2018.1468221
Steuri, B., Bender, S., and Cortekar, J. (2020). Successful User-Science Interaction to Co-develop the New Urban Climate Model PALM-4U. Urban Clim. 32, 100630. doi:10.1016/j.uclim.2020.100630
Stojanovic, D., Predic, B., Predic, B., and Stojanovic, N. (2016). “Mobile Crowd Sensing for Smart Urban Mobility,” in European Handbook of Crowdsourced Geographic Information (Ubiquity Press), 371–382. doi:10.5334/bax.aa
Sun, W., Liu, Z., Zhang, Y., Xu, W., Lv, X., Liu, Y., et al. (2020). Study on Land-Use Changes and Their Impacts on Air Pollution in Chengdu. Atmosphere 11, 42. doi:10.3390/atmos11010042
Syed, A. S., Sierra-Sosa, D., Kumar, A., and Elmaghraby, A. (2021). IoT in Smart Cities: A Survey of Technologies, Practices and Challenges. Smart Cities 4, 429–475. doi:10.3390/smartcities4020024
Toma, C., Alexandru, A., Popa, M., and Zamfiroiu, A. (2019). IoT Solution for Smart Cities' Pollution Monitoring and the Security Challenges. Sensors 19, 3401. doi:10.3390/s19153401
UNEP (2021). Measuring Progress: Environment and the SDGs. Nairobi: United Nations Environment Programme Nairobi. Available at: https://www.unep.org/resources/publication/measuring-progress-environment-and-sdgs.
United Nations (2019). "Department of Economics and Social Affairs, Population Division (2019), World Urbanization Prospects: The 2018 Revision," in World Urbanization Prospects: The 2018 Revision (ST/ESA/SER.A/420). New York, NY: United Nations.
Upadhyay, N., and Upadhyay, S. (2017). #RighttoBreathe Why Not? Social Media Analysis of the Local in the Capital City of India. Proced. Computer Sci. 108, 2542–2546. doi:10.1016/j.procs.2017.05.017
USEPA (2014). Environmental Benefits Mapping and Analysis Program - Community Edition. (BenMAP-CE) [WWW Document]. US EPA. URL. Available at: https://www.epa.gov/benmap (accessed 9 10, 20).
USEPA (2016). The Atmospheric Model Evaluation Tool. [WWW Document]. URL. Available at: https://www.epa.gov/cmaq/atmospheric-model-evaluation-tool (accessed 22 9, 21).
van der Schaaf, H., and Herzog, R. (2015). “Mapping the OGC SensorThings API onto the OpenIoT Middleware,” in Interoperability and Open-Source Solutions for the Internet of Things, Lecture Notes in Computer Science. Editors I. Podnar Žarko, K. Pripužić, and M. Serrano (Cham: Springer International Publishing), 62–70. doi:10.1007/978-3-319-16546-2_6
van Zoest, V., Osei, F. B., Hoek, G., and Stein, A. (2020). Spatio-temporal Regression Kriging for Modelling Urban NO2 Concentrations. Int. J. Geographical Inf. Sci. 34, 851–865. doi:10.1080/13658816.2019.1667501
Verma, S. (2021). Transparency Index: Rating of Pollution Control Boards on Public Disclosure. New Delhi: Centre for Science and Environment. Available at: https://www.cseindia.org/transparency-index-rating-of-pollution-control-boards-on-public-disclosure-10936.
Vincent, K., Daly, M., Scannell, C., and Leathes, B. (2018). What Can Climate Services Learn from Theory and Practice of Co-production? Clim. Serv. 12, 48–58. doi:10.1016/j.cliser.2018.11.001
Viqueira, J. R. R., Villarroya, S., Mera, D., and Taboada, J. A. (2020). Smart Environmental Data Infrastructures: Bridging the Gap between Earth Sciences and Citizens. Appl. Sci. 10, 856. doi:10.3390/app10030856
Wang, J., Balaprakash, P., and Kotamarthi, R. (2019). Fast Domain-Aware Neural Network Emulation of a Planetary Boundary Layer Parameterization in a Numerical Weather Forecast Model. Geosci. Model. Dev. 12, 4261–4274. doi:10.5194/gmd-12-4261-2019
Wang, Y.-d., Fu, X.-k., Jiang, W., Wang, T., Tsou, M.-H., and Ye, X.-y. (2017). Inferring Urban Air Quality Based on Social media. Comput. Environ. Urban Syst. 66, 110–116. doi:10.1016/j.compenvurbsys.2017.07.002
WCCD (2021). World Council on City Data [WWW Document]. World Council on City Data. URL Available at: https://www.dataforcities.org (accessed 21 9, 21).
WHO (2021). New WHO Global Air Quality Guidelines Aim to Save Millions of Lives from Air Pollution. [WWW Document]. URL Available at: https://www.who.int/news/item/22-09-2021-new-who-global-air-quality-guidelines-aim-to-save-millions-of-lives-from-air-pollution (accessed 923, 21).
WHO (2018). Burden of Disease from Ambient Air Pollution. [WWW Document]. Available at: https://www.who.int/airpollution/data/AAP_BoD_results_May2018_final.pdf.
Wiedinmyer, C., Akagi, S. K., Yokelson, R. J., Emmons, L. K., Al-Saadi, J. A., Orlando, J. J., et al. (2011). The Fire INventory from NCAR (FINN): a High Resolution Global Model to Estimate the Emissions from Open Burning. Geosci. Model. Dev. 4, 625–641. doi:10.5194/gmd-4-625-2011
Wilkinson, M. D., Dumontier, M., Aalbersberg, I. J., Appleton, G., Axton, M., Baak, A., et al. (2016). The FAIR Guiding Principles for Scientific Data Management and Stewardship. Sci. Data 3, 160018. doi:10.1038/sdata.2016.18
Wu, J., Xie, W., Li, W., and Li, J. (2015). Effects of Urban Landscape Pattern on PM2.5 Pollution-A Beijing Case Study. PloS one 10, e0142449. doi:10.1371/journal.pone.0142449
Wu, Y. C., Lin, Y. C., Yu, H. L., Chen, J. H., Chen, T. F., Sun, Y., et al. (2015). Association between Air Pollutants and Dementia Risk in the Elderly. Alzheimer's Demen. Diagn. Assess. Dis. Monit. 1, 220–228. doi:10.1016/j.dadm.2014.11.015
Xu, M., Jin, J., Wang, G., Segers, A., Deng, T., and Lin, H. X. (2021). Machine Learning Based Bias Correction for Numerical Chemical Transport Models. Atmos. Environ. 248, 118022. doi:10.1016/j.atmosenv.2020.118022
Yan, L., Duarte, F., Wang, D., Zheng, S., and Ratti, C. (2019). Exploring the Effect of Air Pollution on Social Activity in China Using Geotagged Social media Check-In Data. Cities 91, 116–125. doi:10.1016/j.cities.2018.11.011
Yarza, S., Hassan, L., Shtein, A., Lesser, D., Novack, L., Katra, I., et al. (2020). Novel Approaches to Air Pollution Exposure and Clinical Outcomes Assessment in Environmental Health Studies. Atmosphere 11, 122. doi:10.3390/atmos11020122
Zanella, A., Bui, N., Castellani, A., Vangelista, L., and Zorzi, M. (2014). Internet of Things for Smart Cities. IEEE Internet Things J. 1, 22–32. doi:10.1109/JIOT.2014.2306328
Zheng, S., Wang, J., Sun, C., Zhang, X., and Kahn, M. E. (2019). Air Pollution Lowers Chinese Urbanites' Expressed Happiness on Social media. Nat. Hum. Behav. 3, 237–243. doi:10.1038/s41562-018-0521-2
Zheng, Y., Yi, X., Li, M., Li, R., Shan, Z., Chang, E., et al. (2015). “Forecasting Fine-Grained Air Quality Based on Big Data,” in Proceedings of the 21th ACM SIGKDD International Conference on Knowledge Discovery and Data Mining, KDD ’15 (Sydney, NSW, Australia: Association for Computing Machinery), 2267–2276. doi:10.1145/2783258.2788573
Keywords: urban computing, frontier technologies, data governance, AI, cloud computing, machine learning, smart cities, air pollution
Citation: Kaginalkar A, Kumar S, Gargava P, Kharkar N and Niyogi D (2022) SmartAirQ: A Big Data Governance Framework for Urban Air Quality Management in Smart Cities. Front. Environ. Sci. 10:785129. doi: 10.3389/fenvs.2022.785129
Received: 28 September 2021; Accepted: 23 February 2022;
Published: 08 April 2022.
Edited by:
Negin Nazarian, University of New South Wales, AustraliaReviewed by:
Jovan Pantelic, KU Leuven, BelgiumArjan Marten Droste, Wageningen University and Research, Netherlands
Copyright © 2022 Kaginalkar, Kumar, Gargava, Kharkar and Niyogi. This is an open-access article distributed under the terms of the Creative Commons Attribution License (CC BY). The use, distribution or reproduction in other forums is permitted, provided the original author(s) and the copyright owner(s) are credited and that the original publication in this journal is cited, in accordance with accepted academic practice. No use, distribution or reproduction is permitted which does not comply with these terms.
*Correspondence: Akshara Kaginalkar, akshara@cdac.in