Predicting Sugar Balance as the Impact of Land-Use/Land-Cover Change Dynamics in a Sugarcane Producing Regency in East Java, Indonesia
 Salis Deris Artikanur
 Widiatmaka Widiatmaka2
  Yudi Setiawan
- 1Graduate School, IPB University, Bogor, Indonesia
- 2Department of Soil Science and Land Resources, IPB University, Bogor, Indonesia
- 3Department of Forest Resources Conservation and Ecotourism, IPB University, Bogor, Indonesia
- 4Department of Agroindustrial Technology, IPB University, Bogor, Indonesia
Lamongan Regency is one of Indonesia’s regencies in Indonesia that contribute to the country’s sugarcane and sugar production. Land-use/land-cover changes (LULC) have happened in various areas, including Lamongan Regency in East Java, Indonesia. This study aimed to analyze the impact of land-use/land-cover change (LULCC) in 2007–2031 on the sugar balance in the Lamongan Regency in 2031. The LULC forecast in 2031 was made using R studio using the CLUE-s function in the LULCC package. Following that, the sugar requirements and sugar balance in Lamongan Regency in 2031 were forecasts. The kappa accuracy of the LULC model tested in 2019 was 0.81 when using the CLUE-s model in R studio’s LULCC package. The findings of the LULC prediction in Lamongan Regency for 2031 indicated that there could be significant changes in LULC, resulting in an estimated reduction in 1,687.5 ha sugarcane, influenced by LULC competition for built-up areas. The Built-up areas in Lamongan Regency have exploded in size as a result of population. An increase in built-up areas and a reduction in sugarcane plantations as a result of LULCC are expected to diminish the sugar balance in Lamongan Regency by 10,470.76 tons in 2031 when compared to 2019. The results of this study can be utilized to prevent uncontrolled LULCC in the future to meet sugar needs in Lamongan Regency and at the national level.
1 Introduction
Indonesia’s current sugar production capacity is insufficient to meet the community’s high demand for sugar, which exceeds six million tons per year. National sugar production in 2019 was only 2.23 million tons. Meanwhile, in 2019 sugar imports in Indonesia imported 4.09 million tons, worth up to US $1.36 billion, or approximately Rp19.3 trillion. Sugar was imported from 20 countries, with Thailand importing the most (86.53%) and Australia importing the least (13.26%) (Indonesian Statistics, 2020). Sugar production is poor as a result of sugarcane production being low. Domestic sugar production peaked in the 1930s. At that time, 179 sugar factories were operational, but today, less than half of those remain operational, totaling 64 sugar factories (Marpaung et al., 2011). One of the causes of the fall in the number of sugar factories in Indonesia is a scarcity of raw materials sufficient to match the sugar factories’ production capacity.
East Java Province is Indonesia’s major producer of sugarcane and sugar. East Java Province itself accounted for 51.5% or 1.11 million tons, of the total national total sugar production in 2018. (Indonesian Statistics, 2019). East Java’s top three sugarcane/sugar producers are Kediri, Malang, and Lumajang Regencies. Lamongan Regency is one of the regencies that contributes as a producer of sugar cane as well as sugar in East Java. Sugar production in Lamongan Regency has been highly erratic over the last 10 years. In 2008, sugar production was 18,445 tons, and subsequently declined until 2010 when it was only 11,542 tons. After that, production improved until 2014, it reached 24,995 tons. However, it dropped again in the following year, to 23,832 tons. In 2016 production grew to 28,521 tons, then fell to 28,104 in 2017 and 24,497 tons in 2018.
The increase in population in Lamongan Regency from 2015 to 2019 increased by 31,124 people or 2.31%, from 1,342,266 to 1,373,390 people (Lamongan Statistics, 2020). This rising population has an impact on the increasing demand for sugar usage. Population growth is also pushing changes in agricultural land use, particularly the convention of the sugarcane plantation sub-sector to non-agricultural. LULCC can be driven by a variety of factors, including population growth (Mhawish and Saba, 2016), industrialization (Hatami and Shafieardekani, 2014), urbanization (Tali and Murthy, 2013), and the lower economic value of agricultural land relative to built-up areas (Rondhi et al., 2018; Peerzado et al., 2019). Changes in LULC influence a variety of areas, such as agriculture, the economy, society, and the environment.
Modeling of LULC has been widely used to forecast future trends in LULCC. Several approaches were employed to model the LULC, including CLUE (the Conversion of Land Use/Land Cover and Its Effect) (Veldkamp and Fresco, 1996), Cellular Automata (Clarke and Gaydos, 1998), Spatial Markov (Wood et al., 1997), and the Logit model (Wear and Flamm, 1993). CLUE-s (The Conversion of Land Use/Land Cover and Its Effect at Small Regional Scale) is a variant of CLUE that takes into account the interaction between current LULCs and their underlying variables as well as competition among LULCs for regional applications (Verburg et al., 2002). The CLUE-s model is commonly utilized in land-use planning research (Islam et al., 2021; Song et al., 2021; Xu et al., 2021).
Therefore, it is necessary to investigate changes in LULC that are both existent and predictable to ascertain the future pattern of LULC changes in the Lamongan Regency. This study aimed to analyze the impact of land-use/land-cover change (LULCC) in 2007–2031 on the sugar balance in the Lamongan Regency in 2031. This research used the CLUE-s model to examine the influence of LULCC from 2007 to 2031 on the sugar sufficiency balance in Lamongan Regency in 2031. The prediction year in this research is 2031, which corresponds to the end of the Lamongan Regency’s 2011–2031 Regional Spatial Plan (RTRW), and thus this research is expected to contribute to science related to land-use change and its impact on future food availability and can be used as input for formulating policy strategies related to sugarcane plantations and meeting the community’s sugar needs in the coming period.
2 Materials and Methods
2.1 Study Area
This study was conducted in the Lamongan Regency, Indonesia’s East Java Province (Figure 1) Lamongan Regency, located between 6o51′54″‒7o23′06″ south latitude and 112o33′45″‒112o34′45″ east longitude has a tropical climate. Lamongan Regency is divided into 27 sub-districts had a population of 2019 of 1,373,390 people. The Java Sea forms the northern boundary of Lamongan Regency; Gresik Regency forms the eastern border boundary; Mojokerto and Jombang Regencies from the southern boundary, and Bojonegoro and Tuban Regencies form the western boundary.
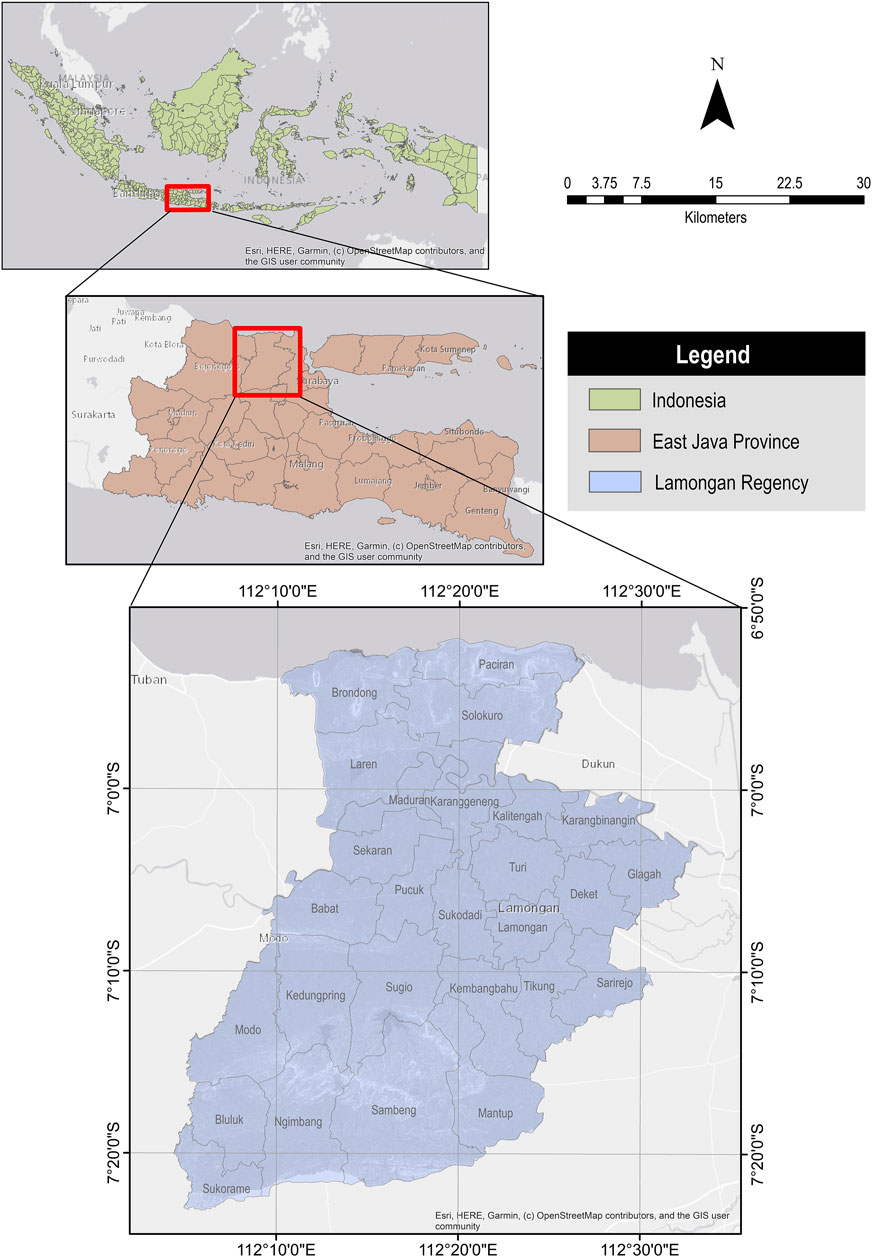
FIGURE 1. The study area map.
2.2 Data
The orthorectified SPOT satellite images from 2007 to 2013 and 2019 were collected by the National Institute of Aeronautics and Space. The 2007 image was taken by a SPOT 4 satellite on 22 June 2007. The 2013 image was obtained by a SPOT 5 satellite on 12 June 2013, and the 2019 image was taken by a SPOT 5 satellite on 10 June 2019. The slope data is coming from NASA’s Digital Elevation Model; the distance between the road and administration boundary comes from the Geospatial Information Agency; and the climate data from the Meteorology, Climatology, and Geophysics Council. The final resolution of all spatial data is processed is 30 × 30 m. Indonesia statistics provided statistical data on population and sugarcane productivity. GPS was used to conduct field checks, ArcGIS was utilized to rectify spatial data, R Studio was used for modeling, and Microsoft Office was used for other analyses.
2.3 Data Processing and Analysis
2.3.1 Analysis of Land-Use/Land-Cover Change in 2007, 2013, and 2019
The land use and cover of Lamongan Regency were investigated visually (Andries et al., 2021; Wei et al., 2021) using SPOT satellite images of 2007, 2013, and 2019. The analyzed LULC was classified using a one-level classification scheme into nine categories, including forest, field/moor, built-up area, open land, sugarcane plantation, rice field, shrubs, fishpond, and water body. The classification findings were validated in the field utilizing a purposive sample technique specific to the LULC type. The status of LULC in the past was determined through interviews with residents who knew the condition of the location in the past (Debeko et al., 2018) and also integrated with high-resolution time-series imagery on Google Earth (Getachew and Meten, 2021). Each type of LULC was assigned eight sample points, for a total of 72 points, taken under limited mobility during the COVID-19 pandemic. These sample points are then used as a reference for evaluating the classification accuracy of LULCs. The kappa accuracy test was used to obtain the accuracy. The greater the kappa accuracy score, the more precise the results of the LULC prediction. The kappa accuracy test has the following equation (Cohen, 1960; Foody, 2002; Adhiatma, 2020):
where Ki denotes the kappa accuracy index; xii: denotes the simulation result of the i LULC type which corresponds to the i LULC the observed; xi: the simulation result of the i LULC; x + i denotes the observed i LULC type; N denotes the total number of observation points, r denotes the total type of LULC.
2.3.2 Prediction Model of Land Use/Land Cover in Lamongan Regency in 2031
Model Description
The CLUE-s model was utilized in this research to simulate and predict changes in LULCs by considering the empirical conditions of a place, spatio-temporal dynamic interactions, and competition between LULCs at that location (Verburg, 2010). Elasticity is a measure of competition among LULCs; the greater the elasticity, the more competitive the LULC is in comparison to other LULCs (Liao et al., 2010). After determining the relationship between LULC and its driving factor through neighborhood analysis using binary logistic regression analysis the CLUE-s model can be employed to stimulate LULCC (Setiawan and Kunihiko, 2020). The binary logistic regression formula is:
where the dependent variable is the probability of occurrence of nonoccurrence; β0 is the intercept; and β1, β2, β3,.., βn: the coefficients of the driving factor as independent variables (x1, x2, x3,.., and xn) (Siagian et al., 2019). The slope, distance from the road, rainfall, and temperature are all considered driving considerations in this study (Supplementary Figure S1).
Following that, LULCC modeling can be carried out. The stages of LULCC modeling began with a simulation in 2007, and then the model was validated to predict LULC in 2013. The initial elasticity value for each LULC class was determined based on a previous study (Sinurat et al., 2015) then adjusted based on the model’s performance in 2013 so that better modeling results are obtained. After that, the simulation is continued by predicting and validating LULC in 2019. If the validation results indicate that the model is accurate, LULC predictions for 2031 can be produced. In this investigation, the procedure of modeling and predicting LULC using the CLUE-s model was performed using the LULC package in the R studio software (Moulds et al., 2015), because it lacks cell boundaries and thus enables high-resolution analysis.
Model Validation
Model is validated is by comparing the LULC in 2019 obtained the simulation and the LULC in 2019 resulting from the categorization (actual map) (Leta et al., 2021; Yu et al., 2021). The accuracy of the model validation results was illustrated by the kappa index value which ranges from 0 to 1. A kappa index worth one means that there is a perfect agreement or the model is doing better, while the kappa index closer to 0 means there is a bad agreement (poor agreement) or the resulting model is not good (Landis and Koch, 1977).
2.3.3 Calculation of Sugar Balance in 2031
Before establishing the sugar balance, the sugar requirements for Lamongan Regency in 2031 were calculated by population projections. The population in 2031 is forecast by first estimating the rate of population growth over the previous 5 years (2015–2020). The population growth rate and population predictions are measured as follows (Indonesian Statistics, 2010; Mekonnen, 2018; Al-Eideh and Al-Omar, 2019) is:
where r donates the population growth rate, Pt is the total population in year t (projected year); P0 denotes the population in year 0 (base year); t denotes the time between years 0 and year t. Sugar needs may be obtained after determining the population in 2031. Sugar needs in Lamongan Regency are calculated as follows:
where Sn denotes sugar needs (ton); Sc denotes sugar consumption per capita, which is 9.25 kg/capita/year (Food Security Agency, 2017); and Pt is the total population in year t (people) (Murdaningsih et al., 2017). following measuring of sugar requirements in 2031, the next step was to compute the sugar balance in 2031 using Rejekiningrum’s (2013) formula:
where S/D stands for surplus/deficit; SPt stands for sugar production at time t (tons), which is calculated by multiplying the area of sugarcane plantations (ha) resulting from the classification and projection of LULC by the average productivity value of sugarcane plantations in Lamongan Regency, which is 70.66 tons/ha (Lamongan Statistics, 2020); and SCt stands for sugar consumption at time t (tons).
3 Results
3.1 Land-Use/Land-Cover Classification of 2007, 2013, and 2019
The classification of LULC was carried out to ascertain the state of the current LULC in the Lamongan Regency. The classification of LULC in Lamongan Regency using SPOT images in 2007, 2013, and 2019 demonstrated that LULC has comprised of forest, fields/moors, built-up areas, open land, sugarcane plantations, rice fields, shrubs, fishponds, and water bodies. The accuracy procedure was conducted to test the accuracy of the findings of the LULC classification. The accuracy test was conducted using 72 points. Each LULC type had eight sample points. The kappa accuracy-test values were above 0.84 (2007), 0.82 (2013), and 0.86 (2019) (Supplementary Table S1), illustrating that the LULC classification was acceptable because the kappa accuracy-test values were above the minimum level of nearly perfect agreement (very high accuracy) of 0.81 (Rwanga and Ndambuki, 2017).
From 2007 to 2019, there was a change in the LULC classification, as demonstrated by the annual changes in the area of each every year (Figure 2). Land uses/land cover that has reduced in the area from 2007 to 2019 include forests, rice fields, shrubs, fishponds, and water bodies. The greatest reduction occurred in the forest area, which decreased by 9,080.4 ha (47.41%). Between 2007 and 2019, the forest turned into fields/moor at most, which was 9,429.8 ha, but there was also an increase in forest area from the previous fields/moor, which totaled 757.2 ha (Supplementary Table S2). In general, Indonesian forests are decreasing as agricultural land is converted (Austin et al., 2019). Meanwhile, the area built-up land increased the most, which totaled 10,780.2 ha. The increase in the built-up land was mostly due to the addition of 7,508.5 ha of rice fields. Rice fields were converted to built-up land as a result of the development of infrastructure, housing, and economic activity centers in numerous regions, all of which were a result of Lamongan Regency’s population growth. Sugarcane plantations increased by 2,298.9 ha because in 2015 there was a new sugar factory built in Lamongan Regency, but starting in 2020 the plantation area began to decline again (Lamongan Statistics, 2020).
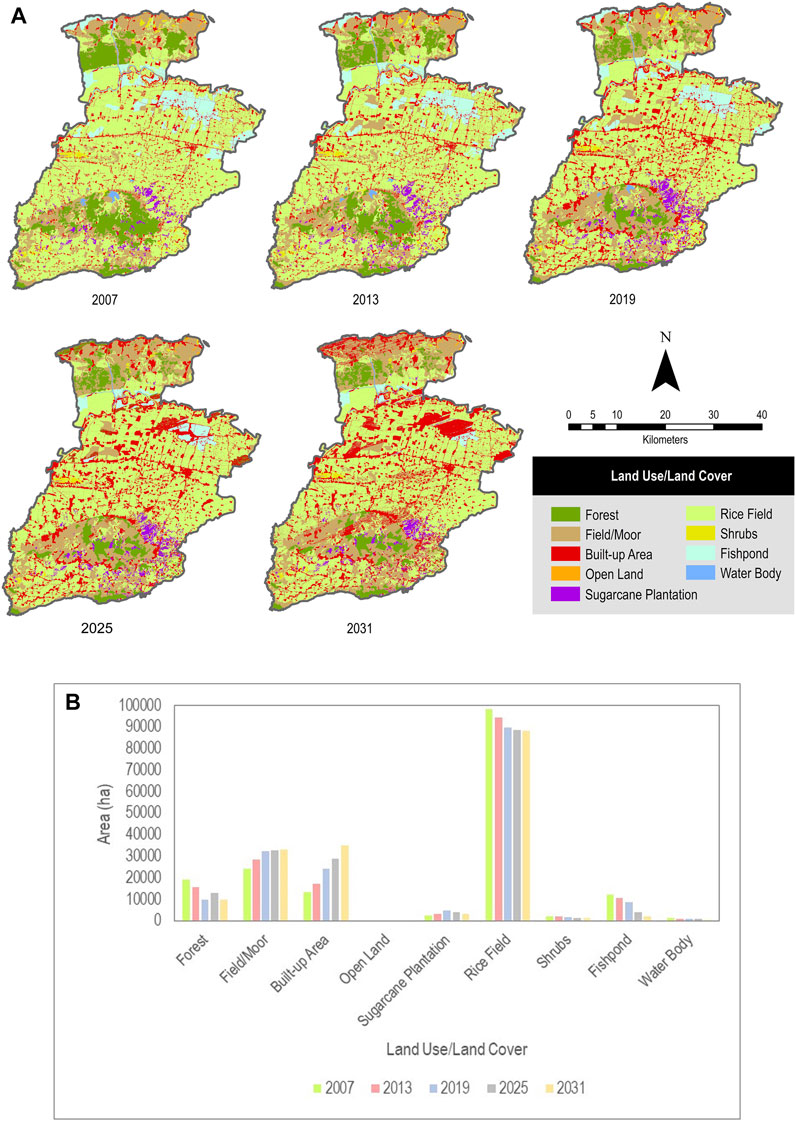
FIGURE 2. The distribution of LULC in Lamongan Regency in 2007, 2013, 2019, and the anticipated results for LULC in Lamongan Regency in 2025 and 2031 (A); graph of change of each LULC (B).
3.2 Prediction Model of Land Use/Land Cover in Lamongan Regency in 2031
Land-Use/Land-Cover Change Model
The LULCC model in this research incorporates input in the form of driving factors affecting land-use/land-cover changes in the modeling. Natural variables such as slope, climate, elevation, hydrological effects, construction costs, and forest distribution play a major role in LULCC (Bajocco et al., 2016; Zhao et al., 2018; Zhu et al., 2021). According to the analysis’s results, the driving factor, as expressed as slope, has a substantial impact on all types of LULC. The slope is positively associated with forest, filed/moor, open land, sugarcane plantation, and shrubs, but negatively associated with the built-up area, rice field, fishpond, and water body. Distance from the road has a considerable negative influence on the field/moor and rice fields and fishpond, but a large favorable effect on the fishpond. Rainfall has a large positive influence on the forest, sugarcane plantation, and water bodies but has a significant negative effect on field/moor, built-up area, and open land. The temperature has a significant positive impact on the forest, sugarcane plantation, rice fields, fishpond, and water body but has a significant negative effect on field/moor, open land, and shrubs (Supplementary Table S3).
Model Validation
The kappa value generated from this study’s validation of the LULC prediction model was 0.81 (Supplementary Table S4). As a result of the categorization and range of kappa value classes, the model generated in this study has a near-perfect level of similarity with the current LULC conditions in 2019 as a result of the classification (Alkaradaghi et al., 2018). Therefore, the finding model can be used to project LULC over the next years. In other words, this research is capable of predicting the distribution of LULC in 2031 in Lamongan Regency.
Land-Use/Land-Cover Prediction in 2031 in Lamongan Regency
The LULC prediction for 2031 is based on a “business as usual” scenario. Along with 2031, a projection for 2025 was created to obtain changes during a 6-year interval. LULC maps from 2007 to 2013, and 2019 were utilized as inputs. The LULC modeling of CLUE-s conversion demands that the elasticity of LULC conversion be specified. The elasticity value is a characteristic that indicates whether or not the land may be used for another LULC. The elasticity value of LULC conversion has a range of 0–1. The closer the value to zero, the easier it is to convert the land; on the other hand, the closer the value to one, the more difficult it is to convert the land (Luo et al., 2010). Each form of LULC has an elasticity value that is adjusted to the conditions of land-use/land-cover changes that occur in a given area (Murdaningsih et al., 2017). The elasticity of 0.7 for the forest, 0.5 for fields/moor, 1.0 for built-up areas, 0.3 for open land, 0.7 for sugarcane plantations, 0.6 for rice fields, 0.6 for shrubs, 0.5 for fishponds, and 0.9 for water bodies were utilized in this study. The distribution of LULC in Lamongan Regency in 2007, 2013, 2019, as well as prediction, projected findings for LULC in Lamongan Regency in 2025 and 2031 are depicted in Figure 2.
Based on the prediction results, between 2019 and 2031, Lamongan Regency is expected to experience an increase in the area of field/moor and built-up areas. The area covered by built-up areas increase the most by 10,881.6 ha. Meanwhile, it is anticipated that there is the extent of forest, open land, sugarcane plantations, rice fields, shrubs, ponds, and bodies of water. Rice fields will lose most of the area, totaling 1,687.5 ha. The reduced rice fields are predicted to be converted to built-up land covering an area of 2,632.7 ha. The area and percentage of each LULC in 2019–2031 and their changes are shown in Table 1.
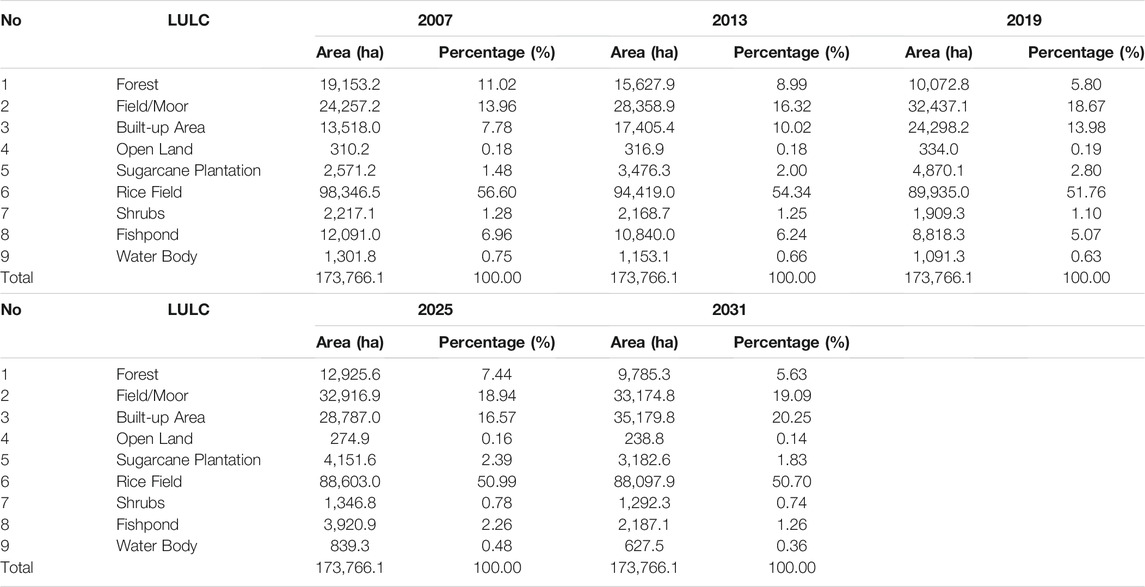
TABLE 1. Area and percentage of each land-use/land-cover in 2019–2031 and their changes.
3.3 Sugar Balance of Lamongan Regency in 2031
Based on the results of the LULC classification and predictions, the area of sugarcane plantations between 2019 and 2031 decreased by 1,687.5 ha which may have contributed to the loss in the sugar balance in Lamongan Regency, as the population was predicted to increase while the output of sugarcane decreased. The total population of Lamongan Regency total population in 2019 was 1,373,390 and is anticipated to reach 1,419,843 in 2031. Lamongan Regency’s sugar production in 2019 was 27,357.39 tons. According to the projections, the value of sugar production in the Lamongan Regency in 2031 will reach 17,316.32 tons (Figure 3). This means that sugar production in Lamongan Regency in 2031 compared to production in 2019 is expected to fall by 10,470.76 tons. Sugar balance projections for 2031 showed that Lamongan Regency will have a total sugarcane surplus of 4,182.77 tons. According to the analysis’s results, Lamongan Regency had a sugar surplus in 2007, 2013, 2019, 2025, and 2031 but the surplus are expected to decrease in 2025 and 2031 due to the decline in the area of sugarcane plantations, which is influenced by changes in land use from sugarcane plantations to other land-uses, particularly built-up areas. Sugarcane plantations, it is predicted, will eventually be unable to compete with built-up areas in the future. This is because the built-up area in Lamongan Regency has an elasticity value of one, making it more competitive than sugarcane plantations with an elasticity value of 0.7.
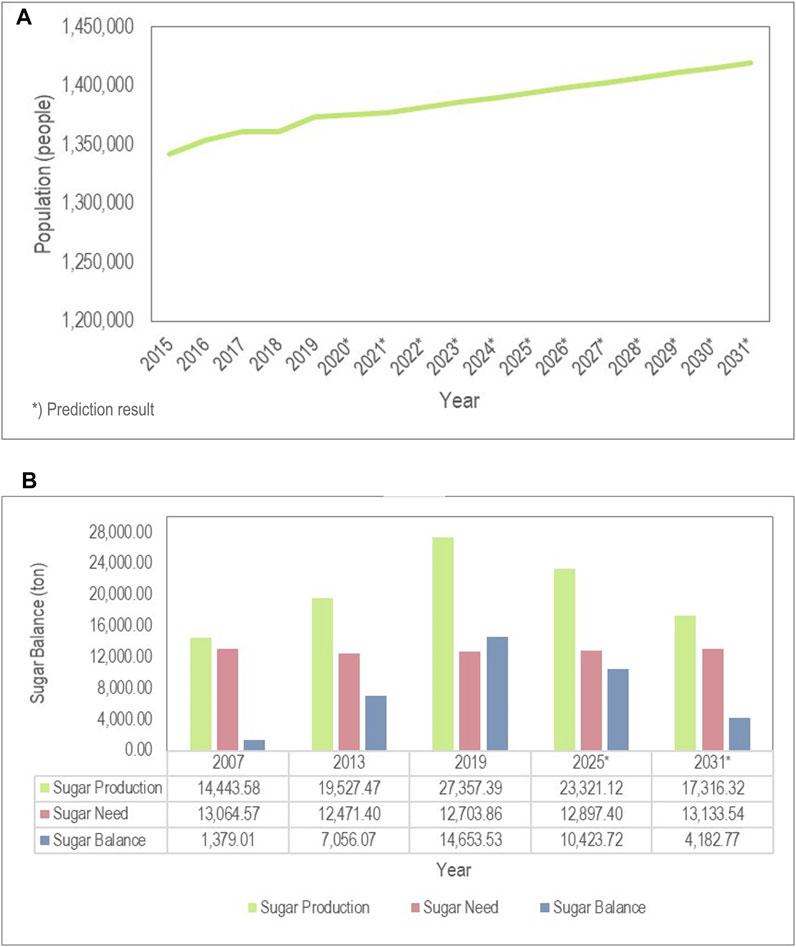
FIGURE 3. The population projection result in Lamongan Regency until 2031 (A); the sugar balance in 2007, 2013, 2019, 2025, and 2031 (B).
4 Discussions
4.1 Sugar Balance as the Impact of Land-Use/Land-Cover Change Dynamics
In this study, there was a land-use/land-cover change in Lamongan Regency in 2007–2019 which has caused the greatest loss in the forest. Human activities and population growth influence land-use/land-cover change (Awotwi et al., 2019; Hailu et al., 2020; Mengist et al., 2021). The population growth stimulates the conversion of LULC from forests to agricultural land as the population grows, so will the diverse needs. This encourages the community, especially farmers, to encroach on the forest and convert it into agricultural land to suit their needs. Meanwhile, the built-up area tends to continue to develop. The built-up area increase the most, from 10,780.2 ha in 2007–2019. The phenomenon of urbanization and population growth contributes to the expansion of built-up areas and changes in spatial structure in suburban areas (Surya et al., 2021).
Based on these conditions, we have modeled the LULCC, including driving factors and elasticity settings, to forecast LULC in 2031. Based on the results of the investigation, it is predicted that the built-up areas will see the most development, reducing the area of sugarcane plantations to 1,687.5 ha. Although sugarcane plantations increased from 2007 to 2019, the annual increase rate of sugarcane plantation areas is still substantially lower than the increase rate of built-up area. The built-up area increased by 898.4 ha on average in 2007–2019, whereas sugarcane plantations increased by only 191.6 ha on average. Due to the built-up area’s huge growth, areas that previously had the potential to see a rise in sugarcane plantations finally overlapped with built-up areas. The built-up areas have been expanded to sugarcane plantations because the area is close to the inter-district road so it is very massive to experience development. Furthermore, there has been competition among LULCs. The built-up area has an elasticity of one, makes it difficult to convert to other LULCs, whereas sugarcane plantations have an elasticity of 0.7, allowing sugarcane plantations to be converted to other LULCs, and allowing conversion from sugarcane plantations to built-up areas to be possible in 2031.
According to the predicted drop in sugarcane plantations in 2031 as a result of competition from built-up areas, sugar production in Lamongan Regency is still quite susceptible to falling in the future. Lamongan Regency had a sugar surplus in 2031 of 4,182.77 tons but the surplus is expected to decrease compared to previous years due to the decline in the area of sugarcane plantations which caused a reduction in sugar production. If the reduction is not countered by prevention initiatives, it is believed that sugar self-sufficiency in Lamongan Regency will be jeopardized in the future. As a result of this, the growth of sugarcane plantations is critical in Lamongan Regency. The development of sugarcane plantations in Lamongan Regency is expected to continue to support sugar self-sufficiency in Lamongan Regency and contribute to the fulfillment of sugar needs in East Java and throughout the country.
4.2 Managerial Implication
The regional spatial plan of Lamongan Regency makes sugarcane the main plantation commodity to be developed, but currently, there is no specific map for sugarcane, but only for plantations in general (Supplementary Figure S3). This study is expected to be an input for the government in formulating policies for developing sugarcane plantations and controlling LULCC in the future. Apart from promoting regional and national self-sufficiency in sugarcane and sugar, the development of sugarcane plantations has the potential to improve people’s welfare. According to Anam and Qibtiyah (2018), sugarcane plantations are possible to cultivate in Lamongan based on the R-C ratio analysis. The existence of sugarcane plantations in Lamongan Regency has also facilitated the establishment of the Sugarcane Farmer Cooperative (KPTR) which can support economic development (Perdana and Nasution, 2016). The establishment of sugarcane farmer cooperatives the acquisition of capital and production facilities, the conduct of savings and loans activities, and the improvement of coordination among sugarcane farmers.
5 Conclusions
The land-use/land-cover patterns in Lamongan Regency were highly diversified from 2007 to 2019. Changes in LULC are predicted to lead to a drop in sugarcane plantation areas in 2025 and 2031 as a result of competition between built-up areas and sugarcane plantation growth. The built-up area has grown rapidly in line with the population growth of Lamongan Regency in 2031, resulting in the built-up area being the most competitive when compared to other LULC, such as sugarcane plantations. The elasticity of LULC conversion demonstrates the conflict between built-up areas and sugarcane. The built-up area is elastic of one, while sugarcane plantations are elastic of 0.7.
The estimated area of sugarcane plantation in 2031 can be transformed into sugarcane production in 2031, allowing for the determination of the sugar balance in 2031. The dynamics of land-use/land-cover change in 2007–2031 and population growth are projected to have an impact on the sugar balance in Lamongan Regency in 2031. The population is expected to grow, but sugarcane production is expected to decline, leading to the sugar balance in 2031 being predicted to decrease by 10,470.76 tons compared to 2019. This may jeopardize regional and national sugar sufficiency, so a strategy is required to secure sugar sufficiency in the future, including the development of sugarcane plantations and control of the built-up area in the Lamongan Regency.
Data Availability Statement
The original contributions presented in the study are included in the article/Supplementary Material, further inquiries can be directed to the corresponding author.
Author Contributions
SDA collected the data and wrote the initial article. Widiatmaka is the project leader who provided funding for the research, as well as provided the methods used. YS provided land-use/land-cover modeling methods. Meanwhile, Marimin provided the discussion and revision.
Funding
This research was funded by PMDSU Scholarship, the Ministry of Education and Culture of the Republic of Indonesia (Grant Number. 2317/IT3.L1/PN/2021).
Conflict of Interest
The authors declare that the research was conducted in the absence of any commercial or financial relationships that could be construed as a potential conflict of interest.
Publisher’s Note
All claims expressed in this article are solely those of the authors and do not necessarily represent those of their affiliated organizations, or those of the publisher, the editors and the reviewers. Any product that may be evaluated in this article, orclaim that may be made by its manufacturer, is not guaranteed or endorsed by the publisher.
Acknowledgments
We would like to thank the Ministry of Education and Culture for the funding of the PMDSU research scheme. We would also like to thank IPB University; National Institute of Aeronautics and Space; Ministry of Environment and Forestry; Ministry of Agrarian and Spatial Planning/National Land Agency; Geospatial Information Agency; Indonesian Statistics; Development Planning Agency of Lamongan Regency; and Office of Food Crops, Horticulture, and Plantations of Lamongan Regency as data sources and research facilitators. We also gratefully acknowledge all parties who contributed to this research.
Supplementary Material
The Supplementary Material for this article can be found online at: https://www.frontiersin.org/articles/10.3389/fenvs.2022.787207/full#supplementary-material
References
Adhiatma, R., Widiatmaka, fnm., and Iskandar Lubis, fnm. (2020). Perubahan penggunaan/ tutupan lahan dan prediksi perubahan penggunaan/ tutupan lahan di Kabupaten Lampung Selatan. Jpsl 10 (2), 234–246. doi:10.29244/jpsl.10.2.234-246
Al-Eideh, B. M., and Al-Omar, H. O. (2019). Population Projection Model Using Exponential Growth Function with a Birth and Death Diffusion. Eur. J. Sci. Res. 151 (3), 271–276. Available at: : http://www.europeanjournalofscientificresearch.com.
Alkaradaghi, K., Ali, S. S., Al-Ansari, N., and Laue, J. (2018). Evaluation of Land Use & Land Cover Change Using Multi-Temporal Landsat Imagery: A Case Study Sulaimaniyah Governorate, Iraq. Jgis 10 (03), 247–260. doi:10.4236/jgis.2018.103013
Anam, C., and Qibtiyah, M. (2018). Research on the Potential of Sugarcane Plantations on Community Welfare in Lamongan Regency. Praja Lamongan 1 (1), 46–54.
Andries, A., Murphy, R. J., Morse, S., and Lynch, J. (2021). Earth Observation for Monitoring, Reporting, and Verification within Environmental Land Management Policy. Sustainability 13, 9105–9134. doi:10.3390/su13169105
Austin, K. G., Schwantes, A., Gu, Y., and Kasibhatla, P. S. (2019). What Causes Deforestation in Indonesia. Environ. Res. Lett. 14 (2), 1–9. doi:10.1088/1748-9326/aaf6db
Awotwi, A., Anornu, G. K., Quaye-Ballard, J. A., Annor, T., Forkuo, E. K., Harris, E., et al. (2019). Water Balance Responses to Land-Use/land-Cover Changes in the Pra River Basin of Ghana, 1986-2025. Catena 182, 104129. doi:10.1016/j.catena.2019.104129
Bajocco, S., Ceccarelli, T., Smiraglia, D., Salvati, L., and Ricotta, C. (2016). Modeling the Ecological Niche of Long-Term Land Use Changes: The Role of Biophysical Factors. Ecol. Indicators 60, 231–236. doi:10.1016/j.ecolind.2015.06.034
Clarke, K. C., and Gaydos, L. J. (1998). Loose-coupling a Cellular Automaton Model and GIS: Long-Term Urban Growth Prediction for San Francisco and Washington/Baltimore. Int. J. Geographical Inf. Sci. 12, 699–714. doi:10.1080/136588198241617
Cohen, J. (1960). A Coefficient of Agreement for Nominal Scales. Educ. Psychol. Meas. 20 (1), 37–46. doi:10.1177/001316446002000104
Debeko, D., Angassa, A., Abebe, A., Burka, A., and Tolera, A. (2018). Human-climate Induced Drivers of Mountain Grassland over the Last 40 Years in Sidama, Ethiopia: Perceptions versus Empirical Evidence. Ecol. Process. 7 (34), 2–16. doi:10.1186/s13717-018-0145-5
Foody, G. M. (2002). Status of Land Cover Classification Accuracy Assessment. Remote Sensing Environ. 80, 185–201. doi:10.1016/S0034-4257(01)00295-4
Getachew, N., and Meten, M. (2021). Weights of Evidence Modeling for Landslide Susceptibility Mapping of Kabi-Gebro Locality, Gundomeskel Area, Central Ethiopia. Geoenviron Disasters 8 (6), 2–22. doi:10.1186/s40677-021-00177-z
Hailu, A., Mammo, S., and Kidane, M. (2020). Dynamics of Land Use, Land Cover Change Trend and its Drivers in Jimma Geneti District, Western Ethiopia. Land use policy 99, 105011. doi:10.1016/j.landusepol.2020.105011
Hatami, M., and Shafieardekani, M. (2014). The Effect of Industrialization on Land-Use Changes; Evidence from Intermediate Cities of Iran. Int. J. Curr. LIFE Sci. ISSN 4 (12), 11899–11902.
Indonesian Statistics (2010). Guidelines for Calculating Population and Labor Force Projections. Jakarta: Indonesian Statistics.
Islam, S., Li, Y., Ma, M., Chen, A., and Ge, Z. (2021). Simulation and Prediction of the Spatial Dynamics of Land Use Changes Modelling through CLUE-S in the Southeastern Region of Bangladesh. J. Indian Soc. Remote Sens. 49, 2755–2777. doi:10.1007/s12524-021-01402-w
Landis, J. R., and Koch, G. G. (1977). The Measurement of Observer Agreement for Categorical Data. Biometrics 33 (1), 159–174. doi:10.2307/2529310
Leta, M. K., Demissie, T. A., and Tränckner, J. (2021). Modeling and Prediction of Land Use Land Cover Change Dynamics Based on Land Change Modeler (LCM) in Nashe Watershed, Upper Blue Nile Basin, Ethiopia. Sustainability 13, 3740. doi:10.3390/su13073740
Liao, Q., Li, M., Chen, Z., Shao, Y., and Yang, K. (2010). “Spatial Simulation of Regional Land Use Patterns Based on GWR and CLUE-S Model,” in 2010 18th International Conference on Geoinformatics, Beijing, China, 18-20 June 2010. doi:10.1109/geoinformatics.2010.5567963
Luo, G., Yin, C., Chen, X., Xu, W., and Lu, L. (2010). Combining System Dynamic Model and CLUE-S Model to Improve Land Use Scenario Analyses at Regional Scale: A Case Study of Sangong Watershed in Xinjiang, China. Ecol. Complexity 7 (2), 198–207. doi:10.1016/j.ecocom.2010.02.001
Marpaung, Y. T. F., Hutagaol, P., Limbong, W., and Kusnadi, N. (2011). The Development of the Indonesian Sugar Industry and the Urgence of National Self-Support. Indones J. Agric. Econ. 2 (1), 1–14.
Mekonnen, Y. A. (2018). Population Forecasting for Design of Water Supply System in Injibara Town, Amhara Region, Ethiopia. Civ Environ. Res. 10, 54–65. Available at: www.iiste.org.
Mengist, W., Soromessa, T., and Feyisa, G. L. (2021). Monitoring Afromontane forest Cover Loss and the Associated Socio-Ecological Drivers in Kaffa Biosphere reserve, Ethiopia. Trees, Forests and People 6, 100161. doi:10.1016/j.tfp.2021.100161
Mhawish, Y. M., and Saba, M. (2016). Impact of Population Growth on Land-Use Changes in Wadi Ziqlab of Jordan between 1952 and 2008. Int. J. Appl. Sociol. 6 (1), 7–14. doi:10.5923/j.ijas.20160601.02
Moulds, S., Buytaert, W., and Mijic, A. (2015). An Open and Extensible Framework for Spatially Explicit Land Use Change Modelling: the Lulcc R Package. Geosci. Model. Dev. 8 (10), 3215–3229. doi:10.5194/gmd-8-3215-2015
Murdaningsih, W., Munibah, K., and Ambarwulan, W. (2017). Spatial Analysis of Changes in Agricultural Land Use in Indramayu Regency. Maj Ilm Globë. 19 (2), 175–184. doi:10.24895/mig.2017.19-2.604
Peerzado, M. B., Magsi, H., and Sheikh, M. J. (2019). Land Use Conflicts and Urban Sprawl: Conversion of Agriculture Lands into Urbanization in Hyderabad, Pakistan. J. Saudi Soc. Agric. Sci. 18 (4), 423–428. doi:10.1016/j.jssas.2018.02.002
Perdana, Y., and Nasution, N. (2016). Lamong Jaya Sugarcane Farmer's Cooperative 1999 – 2004. Avatara 4 (1), 29–35.
Rejekiningrum, P. (2013). Rice Surplus Optimization Model to Determine the Level of National Food Security. Pros Semin. Nas Mat Sains, Dan Teknol. 4, 62–75.
Rondhi, M., Pratiwi, P., Handini, V., Sunartomo, A., and Budiman, S. (2018). Agricultural Land Conversion, Land Economic Value, and Sustainable Agriculture: A Case Study in East Java, Indonesia. Land 7, 148. doi:10.3390/land7040148
Rwanga, S. S., and Ndambuki, J. M. (2017). Accuracy Assessment of Land Use/land Cover Classification Using Remote Sensing and GIS. Ijg 08, 611–622. doi:10.4236/ijg.2017.84033
Setiawan, Y., and Yoshino, K. (2020). Spatial Modeling on Land Use Change in Regional Scale of Java Island Based-On Biophysical Characteristics. Jpsl 10 (3), 511–523. doi:10.29244/jpsl.10.3.511-523
Siagian, D. R., Shrestha, R. P., Shrestha, S., and Kuwornu, J. K. M. (2019). Factors Driving rice Land Change 1989 – 2018 in the Deli Serdang Regency. Indonesia: Agriculture 9, 186. doi:10.3390/agriculture9090186
Sinurat, T. P., Munibah, K., and Baskoro, D. P. T. (2015). Pemodelan Perubahan Penggunaan Lahan Kabupaten Humbang Hasundutan Menggunakan Clue-S. J. Tanah, Lingk, 17 (2), 75–82. doi:10.29244/jitl.17.2.75-82
Song, K., Choi, Y.-E., Han, H.-J., and Chon, J. (2021). Adaptation and Transformation Planning for Resilient Social-Ecological System in Coastal Wetland Using Spatial-Temporal Simulation. Sci. Total Environ. 789, 148007. doi:10.1016/j.scitotenv.2021.148007
Surya, B., Salim, A., Hernita, H., Suriani, S., Menne, F., and Rasyidi, E. S. (2021). Land-use Change, Urban Agglomeration, and Urban Sprawl: a Sustainable Development Perspective of Makassar City, Indonesia. Land 10, 1–31. doi:10.3390/land10060556
Tali, A. J., and Murthy, K. (2013). Influence of Urbanization on the Land-Use Change: A Case Study of Srinagar City. Am. J. Res. Commun. 1 (17), 271–283.
Veldkamp, A., and Fresco, L. O. (1996). CLUE: a Conceptual Model to Study the Conversion of Land Use and its Effects. Ecol. Model. 85, 253–270. doi:10.1016/0304-3800(94)00151-0
Verburg, P. H., Soepboer, W., Veldkamp, A., Limpiada, R., Espaldon, V., and Mastura, S. S. A. (2002). Modeling the Spatial Dynamics of Regional Land Use: The CLUE-S Model. Environ. Manage. 30 (3), 391–405. doi:10.1007/s00267-002-2630-x
Wear, D. N., and Flamm, R. (1993). Public and Private forest Disturbance Regimes in the Southern Appalachians. Nat. Resource Model. 7 (4), 379–397. doi:10.1111/j.1939-7445.1993.tb00159.x
Wei, H., Lu, C., and Liu, Y. (2021). Farmland Changes and Their Ecological Impact in the Huangshui River Basin. Land 10, 1082–1115. doi:10.3390/land10101082
Wood, E. C., Lewis, J. E., Tappan, G. G., and Lietzow, R. W. (1997). “The Development of a Land Cover Change Model for Southern Senegal,” in Land Use Modeling Workshop (Sioux Falls, SD. Santa Barbara, CA: National Center for Geographic Information and Analysis).
Xu, K., Chi, Y., Ge, R., Wang, X., and Liu, S. (2021). Land Use Changes in Zhangjiakou from 2005 to 2025 and the Importance of Ecosystem Services. PeerJ 9, e12122. doi:10.7717/peerj.12122
Yu, J., Hagen-zanker, A., Santitissadeekorn, N., and Hughes, S. (2021). Calibration of Cellular Automata Urban Growth Models from Urban Genesis Onwards - a Novel Application of Markov Chain Monte Carlo Approximate Bayesian Computation. Comput. Environ. Urban Syst. 90, 101689. doi:10.1016/j.compenvurbsys.2021.101689
Zhao, X., Pu, J., Wang, X., Chen, J., Yang, L., and Gu, Z. (2018). Land-use Spatio-Temporal Change and its Driving Factors in an Artificial forest Area in Southwest China. Sustainability 10, 4066. doi:10.3390/su10114066
Keywords: prediction, modeling, LULCC, driving factor, land competition
Citation: Artikanur SD, Widiatmaka W, Setiawan Y and Marimin M (2022) Predicting Sugar Balance as the Impact of Land-Use/Land-Cover Change Dynamics in a Sugarcane Producing Regency in East Java, Indonesia. Front. Environ. Sci. 10:787207. doi: 10.3389/fenvs.2022.787207
Received: 30 September 2021; Accepted: 24 January 2022;
Published: 16 February 2022.
Edited by:
Mohamed Kefi, Centre de Recherches et des Technologies des Eaux, TunisiaReviewed by:
Benewindé Jean-Bosco Zoungrana, Université Joseph K-ZERBO, Burkina FasoPulakesh Das, World Resources Institute, United States
Copyright © 2022 Artikanur, Widiatmaka, Setiawan and Marimin. This is an open-access article distributed under the terms of the Creative Commons Attribution License (CC BY). The use, distribution or reproduction in other forums is permitted, provided the original author(s) and the copyright owner(s) are credited and that the original publication in this journal is cited, in accordance with accepted academic practice. No use, distribution or reproduction is permitted which does not comply with these terms.
*Correspondence: Salis Deris Artikanur, sda_salis@apps.ipb.ac.id