Effects of Organic Agriculture in Structure and Organic Carbon Adsorption at Colloidal Scale in Marginal Olive Groves, Characterized by the Extended DLVO Model
 J. Calero
 I. Plaza
 A. Ontiveros
 V. Aranda1
 - 1Department of Geology, University of Jaén (Spain), Jaén, Spain
- 2Department of Physics, University of Jaén (Spain), Jaén, Spain
- 3Instituto Andaluz de Geofísica, University of Granada, Granada, Spain
- 4University Institute of Research in Olive Agriculture and Olive Oil, Campus Universitario de Las Lagunillas s/n, Jaén, Spain
Relationship between macroscopic and microscopic behavior of soils is a difficult issue, especially when dealing with complex properties such as structure or carbon sequestration, but it is necessary for a suitable understanding of the agricultural soil quality. In this work, we used the extended-DLVO theory to compute total energy of interaction between particles (kT), of three soils over granodiorites. This parameter allows predicting the tendency to aggregate formation at the colloidal scale, being the basis of soil structure. Furthermore, we characterized the mechanism and adsorption capacity of humic molecules on mineral surfaces, and its influence in the interaction energy, by means of the adsorption isotherms. The aim was to compare first the effects of organic farming on conventionally managed soils and, second, to compare these with a non-cultivated forest soil under Mediterranean climate. When total energies are negative (particle attraction), or positive (particle repulsion) but near 0 kT (<100 kT), then particle flocculation occurs and the structure at colloidal scale can be developed. Total energy was less in the forest sample and greater in the soil of conventional groves, with intermediate values in organic farming soil. This indicates a tendency toward particle flocculation and more stability of the structure at colloidal scale in less disturbed soils, agreeing with other soil physical properties such as the total porosity (50, 41 and 37% in forest, organic and conventional plots, respectively) or the aggregate stability index (0.94, 0.73 and 0.66, respectively), which followed the same trend. Of the three components of the total energy of interaction, the acid-base force was a key factor. This component, related with the electron-donor component of surface free energy, γ−, yielded a strong attractive force (−150 kT at 3 nm) when calcium solutions were analyzed for the forest soil. This indicates a clear hydrophobic character of this sample. Because the mineralogical composition of the samples is quite similar, hydrophobicity should be attributed to the organic carbon content of the forest soil, which is much higher than that of the cultivated ones (12.03 vs. 1.44% and 0.88% in organic and conventional farms, respectively), proving to be an essential element for the development of the structure at the colloidal level.
1 Introduction
Soil structure consists of the spatial arrangement of soil particles and aggregates through aggregation processes that operate at several scales, resulting in a complex network of pores of multiple sizes and shapes (Peng et al., 2015). Because it determines porosity, the structure is a fundamental property that largely determines all soil functions, such as CO2 sequestration or water quality. Thus, soil structure should be considered a main indicator of soil quality (Bunnemanm et al., 2018).
The structure deteriorates during conventional tillage, because of physical stress caused by the tillage itself and loss of organic matter from surface layers (Gomez et al., 2003, Gomez et al., 2009). Karlen et al. (1997) indicated a close relationship between the loss of soil organic matter (SOM) and deterioration of the structure. Given this, normative frameworks of the European Union (EC, 2005; EC, 2011) reflect a change of management recommendations from conventional agriculture to conservation and organic farming, based on the adoption of practices aimed at increasing soil organic matter, care of the structure, and erosion control.
The processes of aggregation of the primary soil particles result from both their spatial rearrangement caused by mechanical and biogenic stresses, and chemical and physical interactions between mineral surfaces (Bronick and Lal 2005). Among the latter are flocculation and cementation, whose two processes are mediated by chemical composition of the soil solution, which includes both pH and balance between dissolved ions (Ca, Na, Al, etc.) and the nature of mineral surfaces. The electric charge and electrostatic interactions of these soil particles play a key role in the formation of soil structure. These can be characterized by the zeta potential (ζ) and surface free energy SFE (Somasundaran and Krishnakumar 1997; Aranda et al., 2016; Calero et al., 2017). According to Aranda et al. (2011), the soil electrical charge depends on the soil parent material and geological material. These interactions can be modeled through the Derjaguin, Landau, Verwey and Overbeek (extended DLVO) theory (Van Oss, 1994). Also, soil organic carbon (SOC) has a fundamental role as modulator of the processes of flocculation between mineral particles, being itself a potential highly charged colloid and, therefore, involved in the flocculation/dispersion reactions. This function between the aggregation and SOC is reciprocal, because a sound structure is related to a greater capacity of carbon retention in the soil (Six et al., 2002). Furthermore, the surface physicochemical processes modeled by DLVO, such as flocculation/dispersion, have a direct pedological expression regarding soil structure, as a morphological and functional property. Thus, it has been studied by both morphological techniques of direct observation, among which the scanning electron microscope (SEM) stands out, and as a chemical and physical type, through the characterization of forces that join particles and aggregates to each other, as demonstrated in Moleon et al. (2015), Plaza et al. (2015); Aranda et al. (2015) and Calero et al. (2017).
The aim of the present work was to study the influence of organic agriculture on the soil structure at colloidal scale, characterized by the energy of interaction between particles and the SEM fabric of the soil.
2 Materials and Methods
2.1 Materials
Andalusia (southern Spain) has the greatest production of olive oil in the world. Olive groves occupy 15,000 km2, or 30% of the suitable agricultural area. It is also the region with the largest production quota in the world, surpassing 21% (CAP, 2015). The historical extension of cultivation to mountain areas, mainly from the first decades of the 20th century (Infante-Amate 2012), has meant in the current context of maximum competitiveness a substantial expansion of Andalusian olive groves into areas where topographic or soil conditions do not allow effective mechanization. This is especially relevant in Sierra Morena mountain range, whose olive groves are in gravelly soils with steep slopes and nutrient-poor acid soils (Alvarez et al., 2007).
Soil was sampled in the northeast of the province of Córdoba (Andalusia), in the municipality of Obejo, near road CP-165 that connects this town with Pozoblanco (38.37°–38.13°N, 4.88°–4.72°W). It is an area of moderate slopes (maximum 20%, average elevation 530 m above sea level). The area of the Sierra Morena mountain range is classified as “Pedroches Batolite” (granitoid complexes of post-kinematic origin) with granodiorite lithology. Regarding land use, the area has predominantly low-intensity conventional, rainfed olive groves, where soils are subjected to tillage and agrochemicals, and organic farms with no chemical fertilizer or pesticide addition and long-term (>10 years) use of plant cover.
Three plots were selected as representative of the two types of olive groves (conventional and organic), and one of natural soils in the area: 1) a conventional olive grove with no plant cover, which was under conventional tillage with frequent application of post-emergence herbicides (glyphosate); 2) an organic olive grove with a history of at least 10 years of spontaneous plant cover, which was controlled only by mowing to from early to late spring, with no chemical fertilizer or pesticide addition; 3) natural soil, under small forest patches of oak and tall scrub (Quercus coccifera, Myrtus communis, Rhamnus sp., Viburnun Tinus, Arbutus Unedo) present in the sampling area. Samples were taken in the inter-canopy area of groves; to ensure representativeness of the procedure, five subsamples of disturbed soil from 0–5 cm depths was randomly taken in each plot and mixed in a single composite sample, referred to as forest sample (FS), conventional agriculture sample (CAS) and organic agriculture sample (OAS), respectively. The composited samples were used for physical, chemical and mineralogical analyses, while one cylindrical core of 5 × 5 cm size and a known volume (98.17 cm3) were sampled at the soil surface of each plot to determine bulk density.
2.2 Methods
2.2.1 Soil Analysis and Mineralogy
Once in the laboratory, soil samples were spread and air-dried, then uniformly and carefully mixed to create a bulk sample per each plot. The bulk sample was sieved at 2 mm to obtain coarse fragments and the fine earth fraction (<2 mm), which was submitted to the following analyses (Soil Conservation Service, 1972): texture by sieving and sedimentation (Robinson pipette); particle density with a pycnometer; organic carbon by dichromate oxidation; total nitrogen by the Kjeldahl method; CaCO3 equivalent by Bernard calcimeter; cation exchange capacity (CEC) and exchangeable bases (Ca2+, Mg2+, K+ and Na+) by the ammonium acetate-sodium acetate method (pH 7) and measured by atomic absorption spectrometry; available phosphorus (P) extracted with sodium bicarbonate solution and determined by colorimetry (Olsen method), and pH by potentiometry in a 1:1 suspension of fine earth:water. Water retention at matric potentials of −33 kPa (field capacity) and −1,500 kPa (permanent wilting point) was calculated by the Richards membrane method, and plant available water (AWC) from the difference between field capacity and permanent wilting point, expressed in mm cm−1 (Lal and Shukla, 2004). Total porosity was estimated from the particle and bulk density, and macroporosity from total porosity less microporosity. Microporosity was measured as volumetric water content (cm3/cm3) at field capacity. Finally, the aggregate stability index ASI of Kemper and Rosenau (1986) was determined by means of a wet sieving apparatus (Eijkelkamp Agrisearch Equipment, Giesbeek, Netherlands); ASI <1 signifies fewer than 50% of 0.25-mm stable aggregates in the soil.
The clay fraction (<2 μm) was isolated by sedimentation, after removing organic matter with a 15% H2O2 solution and dispersing it with a 10% sodium polyphosphate solution, and its specific surface area (SSA) measured by the ethylene glycol monoethyl ether (EGME) method. CEC of the clay fraction was measured by the ammonium acetate-sodium acetate method (pH 7). Soil mineralogy of the fine earth and clay fractions was determined by X-ray diffraction using a Panalytical Empyrean diffractometer (Malvern Instruments, Worchestershire, United Kingdom) with Cu Kα radiation at 35 kV. Fine earth X-ray mineralogy in the 3–50°2θ range was determined by the disoriented powder method and percentages of phyllosilicates and other minerals estimated by calculating relative peak areas and applying the intensity factors of Calero et al. (2009). Clay fraction mineralogy was examined by the oriented aggregate method, following the procedure described by Plaza et al. (2015) and Calero et al. (2017): 1) the sample was dispersed in a 10% sodium polyphosphate solution and stirred overnight to extract the clay fraction (<2 μm) by sedimentation; 2) Fe was removed from clay via the Mehra-Jackson procedure (Klute 1986), and the resulting extract was measured by atomic absorption spectrometry; 3) two replicate samples of the clay were subjected to 1 N MgCl2 and 1 N KCl saturation for 48 h, respectively, and later air-dried over a glass plate; 4) the magnesium plate was solvated by ethylene-glycol (EG) vapor for 24 h; 5) the potassium plate was heated at 520°C. Minerals in the EG-oriented aggregates were identified with the aid of the HighScore software (Malvern Instruments, Worchestershire, United Kingdom), following the diagnostic criteria of Velde and Barré (2010), and giving a semi-quantitative estimate of their amounts by peak decomposition (relative peak area, rpa).
2.2.2 Soil Scanning Electron Microscope Fabric
Soil fabric was examined by an SEM with acceleration voltage 25 kV (S-510; Hitachi Ltd., Tokyo, Japan), equipped with an energy-dispersive X-ray detector (EDAX; Rontec GmbH, Berlin, Germany). Fine earth was mounted on the sample holder with colloidal silver and metallized with carbon deposited in two orientations (20°–30°).
2.2.3 Soil Humus Characterization
Fractionation of SOM was done following the IHSS procedure (Swift, 1996). Total extractable carbon for humic and non-humic substances was extracted from soil by mechanically shaking the samples in a 0.1 M NaOH and Na4P2O7 solution at pH 14 for 24 h at 60 C (1:10 w/v). The extracts were centrifuged and filtered (Millipore 0.45-μm). Separation of the total extractable carbon fraction into humic acids (HA) and fulvic acids (FA) was done by precipitation with H2SO4 and purification with polyvinylpolypyrrolidone to eliminate non-humic carbon, respectively. The FA fraction was considered the soluble carbon remaining from the humic extract, and the corresponding HA/FA ratio was found. Finally, any remaining carbon was considered the alkali-insoluble fraction of SOM (HUMIN). Amounts of carbon in the above fractions were quantified by wet combustion (Page et al., 1982). Visible spectra from 400 to 800 nm of 0.2 mg C mL−1 HA solutions (Kononova 1966) in 0.1 M NaHCO3 were recorded using a computer-controlled Varian Cary 50 spectrophotometer with Varian spectroscopy software WIN-UV. The samples were measured directly in a glass cuvette with 1-cm optical path. All spectra were smoothed using the Savitzky–Golay algorithm with order-2 polynomial. The ratio of absorbance at 465 and 665 nm (E4/E6 ratio) and the second derivative were calculated from the smoothed visible spectra.
2.2.4 Determination of Zeta-Potential (ζ)
The determination of ζ of the fine earth used was previously described in Plaza et al. (2015), taking into account the following parameters:
1) Type of cation used to prepare the solution. This was the first parameter considered, setting a standard concentration of 10–3 M for the sodium, calcium, iron and aluminum solutions (Wang and Revil, 2010).
2) Ionic strength of the solution. Subsequently, it was verified whether ζ underwent variations according to the ionic strength, with the aim of establishing the most suitable concentration for the adsorption experiments. More and less concentrated solutions than 10–3 M (10–2, 10–4 M) were used only for mono- and divalent ions (sodium and calcium, respectively).
3) The fine earth was exposed to a commercial HA of Sigma-Aldrich brand with 39% C. Solutions were prepared with such humic salt at concentrations of 1 mM of NaCl. For the determination of ζ, a Zetasizer 3000HS (Malvern Instruments, Worchestershire, United Kingdom) was used.
2.2.5 Determination of Surface Free Energy
Surface properties of the fine earth were determined using the method described by Plaza et al. (2015) and Moleon et al. (2015). In these works, the authors estimated the surface properties by contact angle measurement of three liquids (water, formamide and diodomethane) on the compressed soil. This was performed with the aid of a goniometer NRL C.A (Ramé-Hart Instrument Inc., New Jersey, United States). For this experiment, the soil samples were treated with solutions of sodium, calcium, iron and HA at 10–3 M. The samples were dried at 323 °K for 24 h and subsequently held in a hydraulic press at 1.5 × 10⁴ kg cm−2 for 10 min. According to Van Oss (1994) and Van Oss et al. (1988), we could obtain the dispersive components Lifshitz–van der Waals (γLW) and non-dispersive interaction of Lewis acid-base γAB through this technique, as described in Plaza et al. (2015).
2.2.6 Determination of Energy of Interaction Through DLVO-Extended Theory
The extended DLVO model considers three interactions, AB (acid-base), LW (Lifshitz–van der Waals) and EL (electrical). This model is mentioned in Moleon et al. (2015), where it is explained that in any system composed of equal particles within an aqueous suspension, the total interaction energy is:
where the electrical component is determined using the equation of Durán et al. (1988), and the components LW and AB using the model proposed by Van Oss (1994).
2.2.7 Batch Experiments
The fine earth of our soils was subjected to an HA solution following the method of Moleon et al. (2015) and Plaza et al. (2015). We used three cations, Na+, Ca2+ and Fe3+ to 10–3 M strength. The fine earth was subjected to various concentrations of HA (0.5 g/L) at three temperatures 283.15, 293.15 and 313.15 K. Adsorption of HA by the soils was performed by differences in the initial and final concentrations. For this purpose, a Hitachi spectrometer (M Hitachi U2000; Hitachi Scientific Instruments, Mountain View, California United States) was used at 554 nm, following the instructions of Ramos-Tejada et al. (2003).
3 Results and Discussion
3.1 Physical and Chemical Analysis of Soils
Physical and chemical properties of the studied soils are listed in Table 1. They showed very large amounts of coarse fragments (>50%), reaching almost 80% in the conventional sample, and medium-to-coarse textures (sandy loam). Bulk density in the cultivated samples (∼1.50 g/cm3) was in accord with these textures, but was remarkably low in the forest (1.27 g/cm3), which may be explained by the high organic carbon content (12.32%). Soil properties related with structure quality (porosities and structural stability) had an increasing trend from the conventional to forest sample. However, poor macroporosity of the two cultivated soils (10%) should be highlighted, which might reveal some compaction process, even though their bulk densities were not too high for a sandy loam texture. Moreover, the ASI reached in the conventional sample was 0.66, a value characteristic of very degraded soils (Klute, 1986).
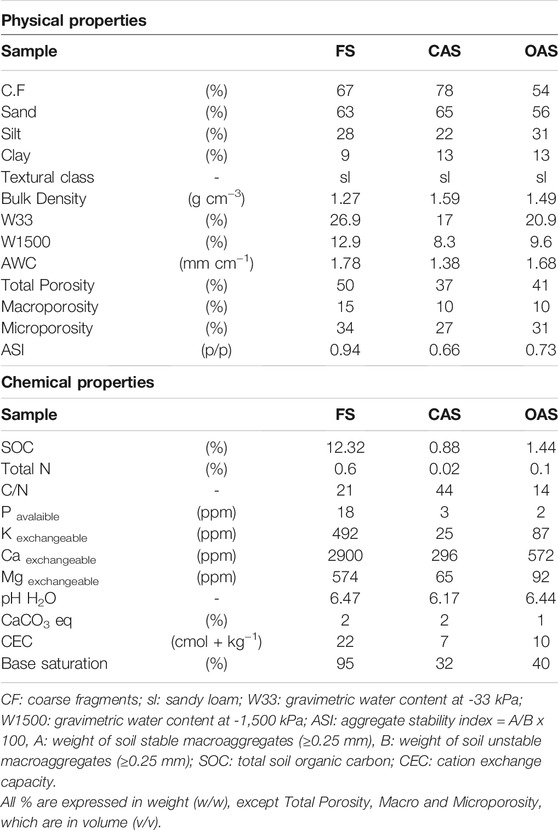
TABLE 1. Soil physical and chemical properties of soils.
The forest sample had a total carbon content much higher than those of cultivated ones (0.88 and 1.44% for the conventional and organic samples, respectively), which are small or moderate values for Mediterranean soils. Other indicators of chemical fertility (total nitrogen, exchangeable potassium, calcium and magnesium, and CEC), probably due to its close relationship with the SOC, followed the same gradient; highest contents were in forest soil and the lowest in conventional groves. Values of total nitrogen (≤1.0), phosphorus (<4 ppm), potassium (<90 ppm) and cation exchange capacity (≤10 cmol+ kg−1) for the cultivated soils were in accord with coarse textured samples, and were large for the forest plot. pH values were relatively suitable (slightly acidic), although olive trees have more affinity for pHs in the basic range (Sys et al., 1991).
In general, the studied physical and chemical properties indicate a low or very low agricultural potential (marginal), which together with the slope indicates theses soils would work better as pastures or forests.
3.2 Mineralogy of Soils
The disoriented powder mineralogy of the samples (Figure 1; Table 2) was similar and strongly influenced by the parent rock (granodiorite), with soils mainly formed by quartz (>50%) and phyllosilicates (10–40%). Percentages of chlorite, goethite, and potassium and calcium-sodium feldspar separately were <5% in all samples, and no carbonates were identified. In Figure 2 and Table 3 the mineralogical composition of the clay fraction in the 4–30 2θ° sector also was showed.
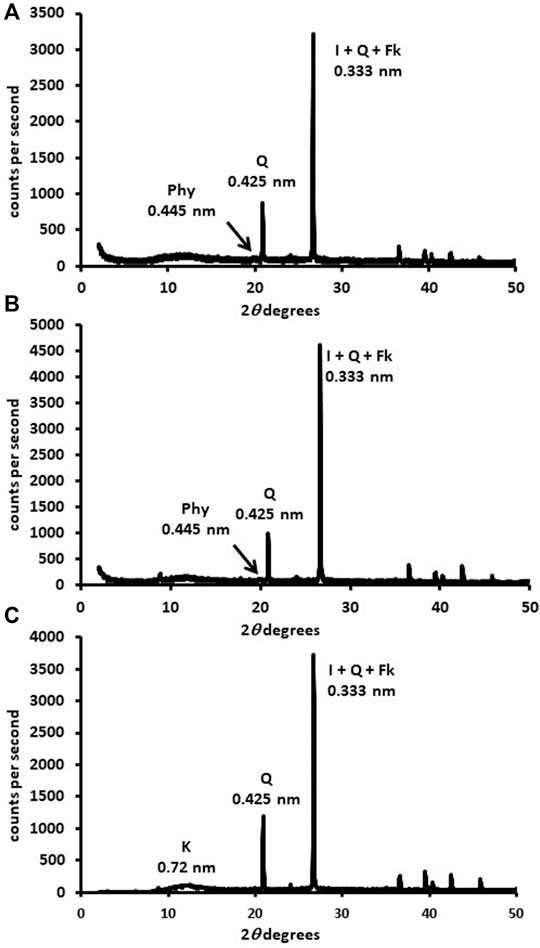
FIGURE 1. DRX mineralogical composition of the fine-earth fraction (<2 mm; DRX-disoriented powder) in the 0–50° 2θ. (A) forest sample, (B) organic sample, (C) conventional sample. Phy: phyllosilicates, I: illite, Q: quartz, Fk: potassium feldspar, K: kaolinite.
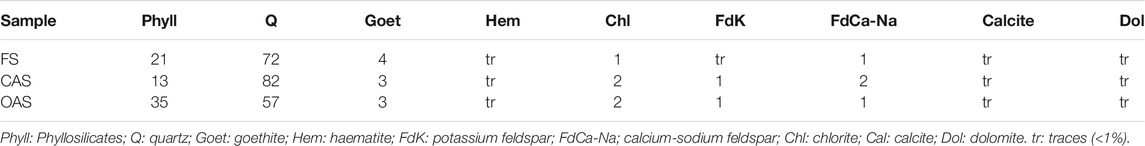
TABLE 2. Mineralogical composition of the fine-earth fraction (<2 mm; DRX-disoriented powder, %).
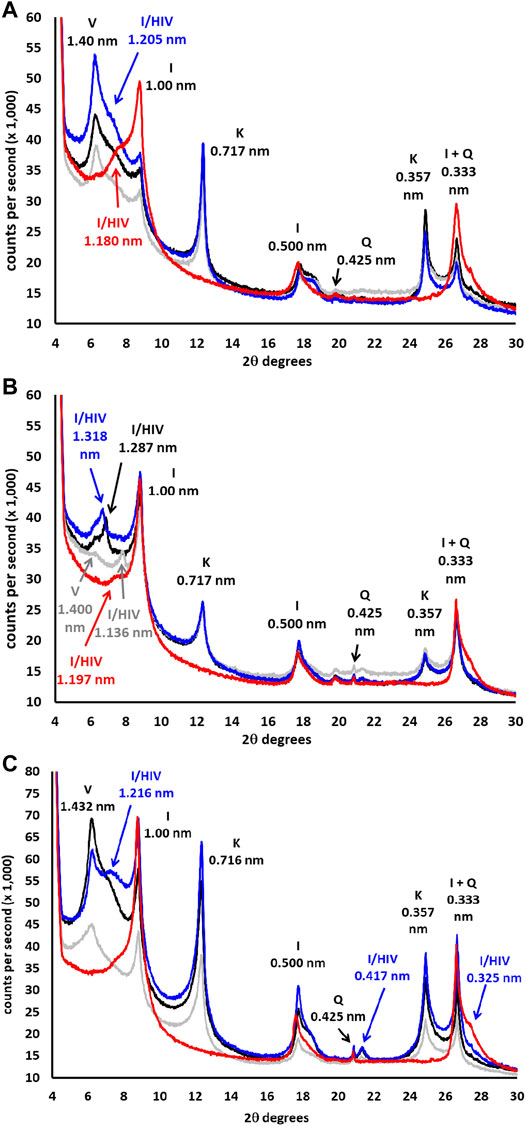
FIGURE 2. DRX mineralogical composition of the clay fraction (<2 μm; DRX- oriented aggregate) in the 4–30° 2θ. (A) forest sample, (B) organic sample, (C) conventional sample. Black line = Mg air-dried, gray line = Mg-EG, blue line = K air-dried, red line = K 520°C. V: vermiculite, HIV: hydroxyl-interlayered vermiculite, I: Illite, K: kaolinite, Q: quartz.
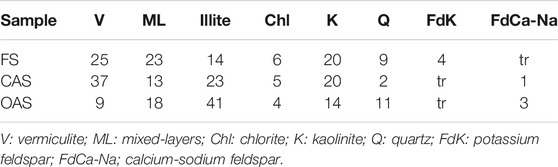
TABLE 3. Mineralogical composition of clay fraction (oriented aggregate. Mg-EG. % relative peak area).
The forest sample presented mainly quartz (0.425-nm peak) and phyllosilicates (0.445-nm peak) in the fine earth (Figure 1A). The most important phyllosilicates in the clay fraction (Figure 2A) was soil vermiculite (25% of rpa), a non-swelling 2:1 phase, so its diagnostic peak remained at 1.400 nm after glycol solvation. In addition to pure vermiculite, a mixed-layer phase at ≈ 1.2 nm may be defined (23% of rpa), which we attributed to a hydroxyl-interlayered vermiculite (HIV) with illite (Velde and Barré 2010). The presence of HIV has been assumed because to the partial collapse showed in the potassium samples. Other major phases in the clay fraction were illite (1.000 nm, 14% of rpa) and kaolinite (peak at 0.717 nm, 20% of rpa).
The fine earth of the organic sample (Figure 1B) was similar to that of the forest, formed principally by quartz (peak 0.425 nm) and phyllosilicates (peak 0.445 nm), although the main phases in the clay fraction (Figure 2B) were illite (1.00 nm, 41% of rpa) and the HIV-illite mixed layer (non-swelling peak at 1.13 nm in glycol, 18% of rpa). Unlike the forest, the 1.40 nm peak was not very important, with a % of vermiculite less than 10%. Finally, the sample of conventional olive grove CAS (Figure 1C) was also formed mainly by quartz (peak 0.425 nm), but with a smaller percentage of phyllosilicates (13%) than the two previous soils. This sample presents a composition of the clay fraction quite similar to the forest, although the amount of vermiculite (peak at 1.432 nm, 37% of rpa) was higher, and the content of the HIV-illite mixed-layer (peak at 1.216 nm, 13% of rpa) was the lowest of the three samples (Figure 2C). Important: the V/HI mineral in K-air dryed sample (blue line) has been corrected for I/HIV in the new Figure 2. The most important phyllosilicate after the vermiculite was illite (1.00 nm, 23% of rpa), followed by kaolinite (0.716 nm, 20% of rpa).
Regarding the surface properties of the clay (Table 4), only a relative tendency to decreasing the SSA-EGME in the OAS soil sample (148.73 m2 g−1) could be stated. This may agree with the fact that vermiculite and interlayers have a higher SSA than that of illite (Sawnhey, 1989). But in general, these soils were mineralogically very similar, both in the fine earth and in the clay fractions, and no clear trends as a function of soil management were observed. Thus, differences in the colloidal behavior of soils might attend more to the organic fraction than to the mineral one.
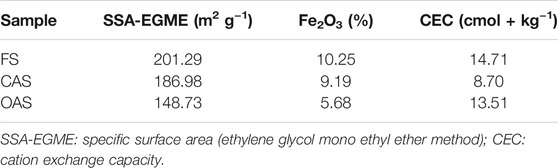
TABLE 4. Surface properties of the clay fraction (<2 μm).
Table 5 shows the results of the humus fractionation. The total humic fraction (THE) expressed a quantitative distribution similar to other Mediterranean soils (Aranda and Oyonarte, 2006), although with very high levels in the case of forest sample (total humic extract of 3.914 g C 100 g−1), especially regarding the HA fraction (3.459 g C 100 g−1). The high contents of the total humic fraction of the forest plot was foreseeable, given the remarkable amount of total soil organic carbon in this soil. In contrast to the HA fraction, extractable humin was low in all samples. (≤0.005 g C 100 g−1). The HA/FA ratios were equal to or greater than 2.0 in all soils, reaching 7.7 in the forest. These were relatively high values that suggest a tendency towards the solubilisation of low molecular weight humic precursors. This could interfere with the mechanisms of physical retention of the particulate fraction, decreasing the total carbon sequestration capacity of soils (Aranda et al., 2011).
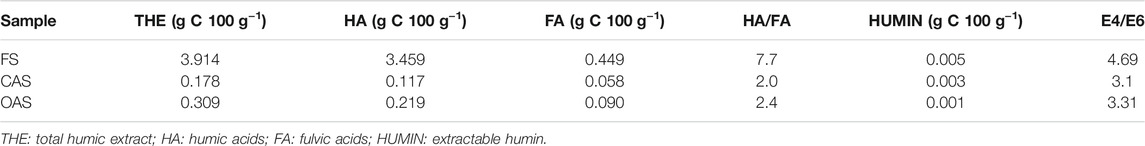
TABLE 5. Fractionation of the organic matter of samples.
The E4/E6 ratio (ratio of absorbances at 465 and 665 nm) can be considered inversely proportional to the degree of condensation and aromaticity of humic substances and with their degree of humification (Stevenson, 1994). Forest sample ratio was similar to other Mediterranean natural soils (≈4.50–5.00), while in the cultivated ones they showed slightly lower values (<4.00) (Aranda et al., 2011), but in general they were high and indicated less aromatic condensation, presence of smaller organic molecules and more aliphatic structures.
3.3 Zeta Potentials
The following figures show ζ obtained from the samples for the 10–3 M solutions of sodium (Figure 3A), calcium (Figure 3B) and iron (Figure 3C).
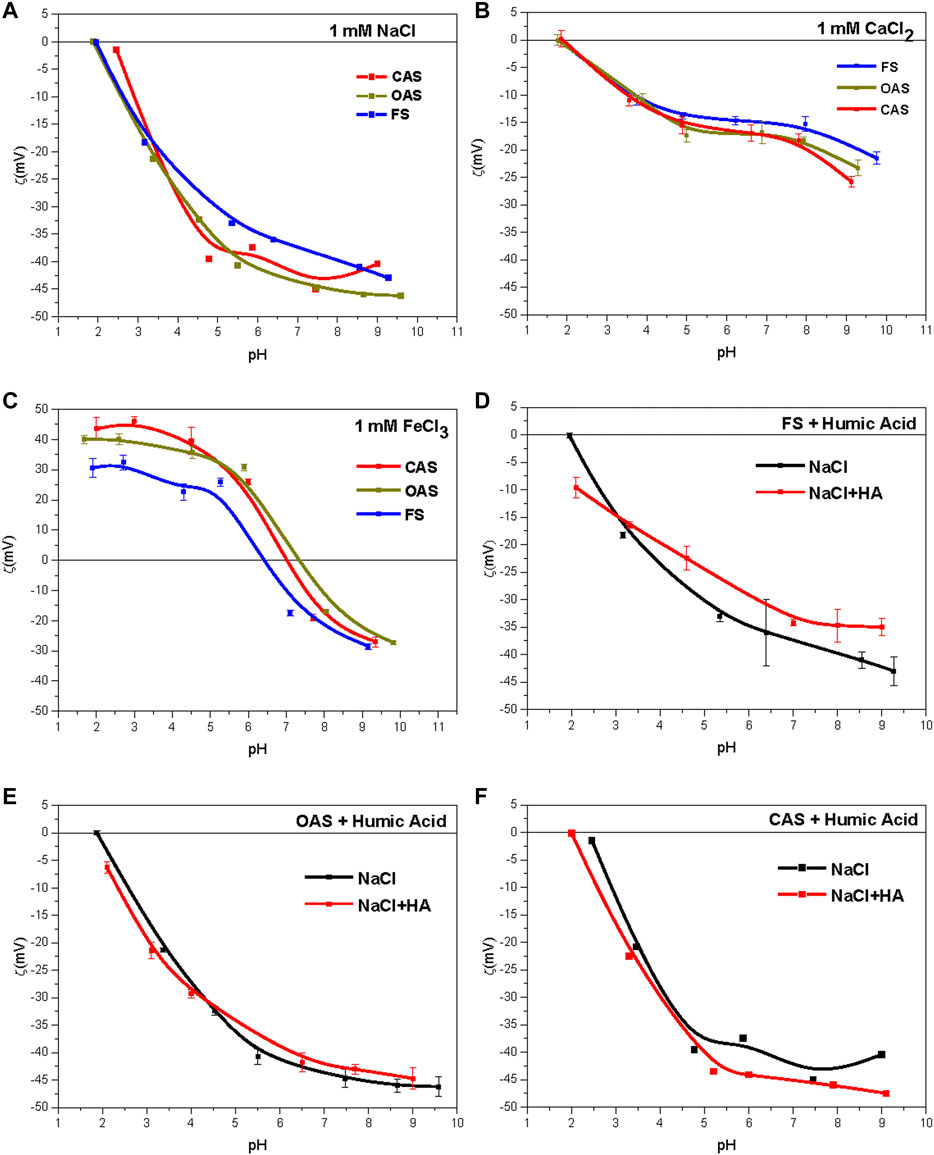
FIGURE 3. (A) Zeta-potentials for 10–3 M NaCl solution. (B) Zeta-potentials for 10–3 M CaCl2 solution. (C) Zeta-potentials for 10–3 M solution FeCl3. (D),(E) and (F) Effect of addition of 0.5 g/L of commercial humic acid (HA) on the zeta-potential of soils (10–3 M NaCl). FS = forest sample, OAS = organic agriculture sample, CAS = conventional agriculture sample.
In sodium solutions, we observed two groups according to their behavior, one from forest sample and the other from organic and conventional samples; The behavior of this second group was very similar in all treatments. ζ is always negative, which is explained by the predominance of 2:1 phyllosilicates in the soil colloidal fraction, whose main source of electric charge is pH-independent (isomorphic substitutions in the tetrahedral and octahedral layers of phyllosilicates) (Sondi et al., 1996). However, a decrease of soil ζ was observed with increasing pH, which can be attributed to both deprotonation of the pH-dependent charges of the clays (OH−) and the acidic functional groups of SOM (−COOH, −OH, and others).
Figure 3B shows the effect of divalent (CaCl2) ions produced in ζ of the sample, which was negative in all pH ranges tested. The results show that the calcium cation behaves like an indifferent ion. This effect in vermiculites has been described by Lagaly (2006), and Duman and Tunc (2008) in vermiculites, and by Martínez et al. (2010) in illites. This behavior was attributed by Lagaly (2006) to a small ratio of pH-dependent charges in 2:1 phyllosilicates (illite, smectite, and vermiculite) and to strong particle aggregation caused by calcium.
The treatment with iron (Figure 3C) contrasted with the samples treated with basic cations (calcium and sodium) so that ζ had positive values at acidic pH. This is because of the acidic nature of ferric salts, which is capable of protonating strongly at pH lower than its isoelectric or zero-charge point, indicating that these salts tend to be adsorbed onto particles, beyond its absorption in the diffuse double layer. The of ζ value of the system decreased from about +40 mV (+30 mV in FS, +45 mV in CAS) to about +15 mV (+25 mV in CAS and OAS, +5 mV in FS) for the natural soil pHs. This could be explained by progressive adsorption of hydroxyl groups and the formation of coordination compounds, which might mean the iron is adsorbed in the form of Fe(OH)2+ and Fe(OH)2+ by solid surfaces (Plaza et al., 2015).
3.4 Effects of Commercial HA Addition on Zeta Potential of Soils
The adsorption was carried out in solutions with ionic strength 10–3 M of NaCl (Figures 3D–F). The effects on ζ are shown when adding HA to soils of the Sierra Morena. The adsorption of humic acid can cause ζ variation of soil particles, owing to the action of ionizable groups of humic acid (−COO-, −NH3+, and others). The samples for which ζ curves varied strongly (±5 mV) showed a dependence on this behavior. The results show no effect of HA adsorption on the organic sample (Figure 3E), whereas there was an effect on the forest soil (Figure 3D), for which ζ increased and in the soil with conventional management (Figure 3F), for which ζ decreased. The increase of ζ (decrease in absolute value) in the forest sample indicates that its surface become less negative. This may have been caused by previous saturation of their mineral surfaces, which could promote an uptake of the added HA by organic molecules rather than bare mineral surfaces and a change in electrophoretic behavior of the same. Moreover, an excess of humic acids may cause in the system the formation of micelles and consequent decrease of negative charge (Ontiveros-Ortega et al., 1998). In another case, an increase of negative charge is expected from the addition of HA carboxyl groups to the system, as stated by Plaza et al. (2015).
3.5 Surface Free Energies
The components of SFE for different ions and treatments with humic acid are shown in Table 6. The soils had a monopolar character, with values of the basic component (electron donor) γ− much larger than those of the acid component (electron acceptor) γ+, which tended toward zero. In Table 6 are also shown the dispersive component of Lifshitz–van der Waals (γLW), whose values are common in inorganic soils and similar to those given by Hajnos et al. (2013). In addition, except for some values reached by the forest sample, these are hydrophilic soils, given that γ+ ≈ 0 and γ− > 28 mJ/m2, values typical of siliceous rock (Ontiveros-Ortega et al., 2014; Moleon et al., 2015) and established by van Oss and Giese (1995) as a hydrophobicity threshold for soils rich in phyllosilicates. The most variable component, considering the sample and the ionic treatment, was γ−, from 15 mJ m−2 (FS, CaCl2), a value substantially smaller than the hydrophobicity threshold, to 51 mJ m−2 (CAS, FeCl3). γLW remained more constant, in a range between 40 and 49 mJ m−2. About the electrolytes effect, we can state that CaCl2 tended to produce a decrease in γ−, while iron and sodium behaved in relatively similar ways. It is also interesting to check the effect of HA addition on SFE. γ− did not show great variation for HA-added soil (>5 mJ m−2), so the adsorption did not substantially alter it.
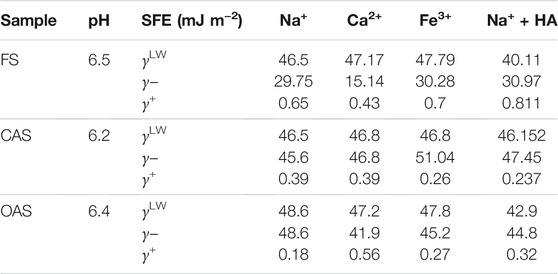
TABLE 6. Components of the surface free energy (SFE) of soils, for different treatments.
Regarding soil management, the forest soil had a more hydrophobic character than the cultivated ones, which showed a similar wettability behavior. The hydrophobic character was present in all ionic treatments (near the aforementioned hydrophobicity threshold of 28 mJ m−2), but was especially strong in calcium, reaching a value of highly water-repellent materials (15 mJ m−2) (Ontiveros-Ortega et al., 1998). On the contrary, cultivated soils showed clear hydrophilicity, 45.6 and 48.6 mJ m−2 for conventional and organic samples, respectively.
3.6 Total Surface Energies: Extended DLVO Model and Interaction Between Soil Particles as a Function of Ionic Solution
Figure 4 shows total interaction energies as a function of the various ions, at ionic strength 10–3 M, and Figure 5 depicts total energy components (EL, AB and LW) for the calcium- and iron-treated soils.
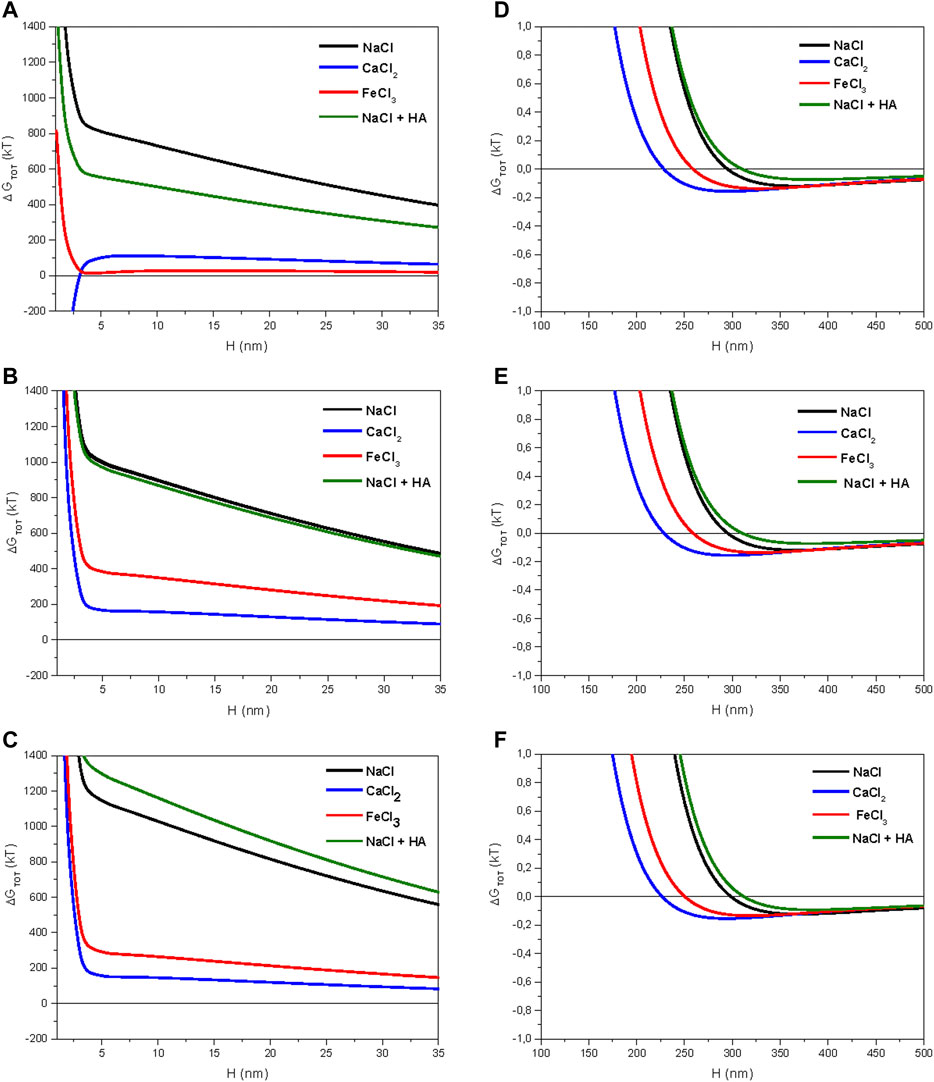
FIGURE 4. Total energies of interaction between particles according to different ionic solutions (10–3 M): (A) forest sample (pH 6.47); (B) organic sample (pH 6.44); (C) conventional sample (pH 6.17); (D) secondary energy minimum for forest sample; (E) secondary energy minimum for organic sample; (F) secondary energy minimum for conventional sample.
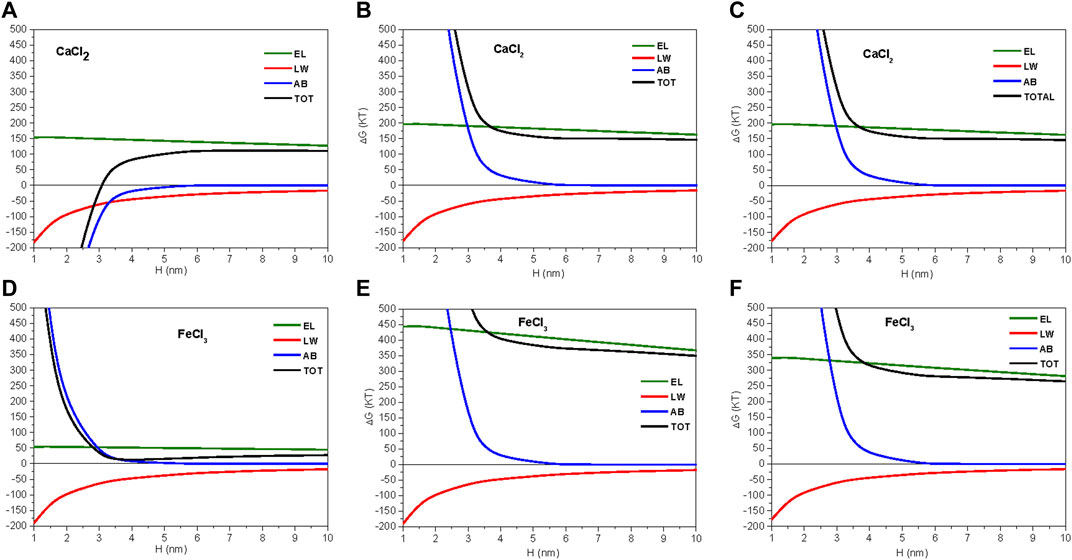
FIGURE 5. Components of total interaction energy at the soil pH: (A) forest sample, 10–3 M CaCl2 solution (pH 6.47); (B) organic sample, 10–3 M CaCl2 solution (pH 6.44); (C) conventional sample, 10–3 M CaCl2 (pH 6.17); (D) forest sample, 10–3 M FeCl3 solution (pH 6.47) (E) organic sample, 10–3 M FeCl3 solution (pH 6.44); (F) conventional sample, 10–3 M FeCl3 solution (pH 6.17). TOT, total energy; EL, electrostatic component; AB, acid–base component; LW, Lifshitz–van der Waals component.
Except for the forest sample in calcium solution (Figure 4A), no primary energy minima can be discerned. However, there were secondary energy minima with kT < 0 (attractive force) at H > 100 nm for all cations studied (Figure 4D–F). In spite of their small values (<1 kT), these secondary minima may justify colloidal aggregation in samples with moderate total interaction energies, even in the absence of primary minima when H approaches 0 nm (Calero et al., 2017).
Setting the interaction energy to 10 nm, which properly characterizes the tendency toward flocculation of particles in colloidal systems according to (Ontiveros-Ortega et al., 1998), the largest value in sodium solution was for the sample of conventional groves (1,050 kT; Figure 4C), and the smallest value was for sample of the forest (700 kT; Figure 4A). The organic sample gave an intermediate value (900 kT; Figure 4B). In the behavior with HA treatment in sodium solution for the three samples, we observed variation of interaction energies in accord with the ζ data shown in Figure 3, i.e., a decrease in forest sample from 700 to 540 kT (Figure 4A) and an increase in conventional sample from 1,050 to 1,175 kT (Figure 4C); the organic sample was unaffected by HA addition (Figure 4B). Because total energies were much greater than zero in all sodium samples, including the HA-added ones, a strongly repulsive force between particles can be presumed, so structural stability at colloidal scale should be weak in these systems. The negative effect of sodium on the structural stability of soils at colloidal scale is widely known (Baumgarten et al., 2012).
The behavior of samples in calcium and iron solution was noticeably different. They always produced a trend toward the precipitation of suspended colloids (<350 kT), especially in the forest plot, where the total energy at 10 nm was <100 kT. This latter value may be considered a threshold for energy barriers, where particles may have relatively high probabilities of flocculation (Ontiveros-Ortega et al., 1998). Furthermore, calcium should be considered the most relevant cation for explaining colloidal behavior in field conditions. This is because calcium was the dominant exchangeable base in the three samples, although complex ions of iron or aluminum, probably adsorbed onto particles, might be relatively important in the cultivated soils, where base saturation was <50% and pH ranged between 6.0 and 6.5 (Table 1).
Total energy in CaCl2 had the same value for the two cultivated soils (150 kT, Figures 5B,C); however, there was an outstanding difference for the forest sample because the total energy of interaction became negative at small distance (H < 3 nm). Here, this primary minimum of energy was determined not by the cancellation of EL, but by the behavior of the AB component, which gave negative values (−150 kT at 3 nm; Figure 5A). A negative value of the AB component may be interpreted as an attractive force caused by a reduction in hydration pressure of water-repellent surfaces (Grasso et al., 2002). For cultivated soils, the AB component remained positive (Figures 5B,C). Hence, the strong tendency of colloids to flocculate predicted by the extended DLVO model was mainly conditioned by the hydrophobicity of this soil.
In FeCl3, the forest sample also showed the smallest total energy values (∼0 kT; Figure 4A) of all soils. Because this was determined by the ζ of iron solution (Figure 3C) and the isoelectric point was reached in it at around soil pH (6.18), the electrostatic repulsive force (EL) was canceled there (Figure 5D). Then, the total energy remained as a balance between the dispersive (LW) and AB components, which cancelled each other at small distances. This explains the virtually null value of total energy at H > 3 nm in FeCl3 for the forest sample. The organic and conventional samples had relatively similar total energies of 350 and 250 kT in iron solution, respectively (Figures 5E,F).
Hydrophobicity of forest soil may be in agreement with results of the SEM study (Figure 6), in which some biogenic activity, likely fungus hyphae, was recognized (Figure 6A). The relationship between acid pH, fungal activity and hydrophobicity has been advance by our research group in Aranda et al. (2016) and others (Maqbela and Mnkeni, 2009; Fisher et al., 2010). Moreover, it is reasonable to establish a relationship between SOM quality and hydrophobicity in this sample. As indicated by the A4/A6 ratio in Table 5, humic molecules in forest sample were less humified (larger E4/E6) than in cultivated soils. Larger values of E4/E6 ratio have been associated with the presence of smaller size organic molecules or more aliphatic structures (Stevenson, 1994) which, in some cases, has been associated with a greater hydrophobicity of the sample (Di et al., 2016; Leone et al., 2017). This might also be related with the potential saturation of colloidal surfaces in the forest sample, explained above in view of the ζ behavior.
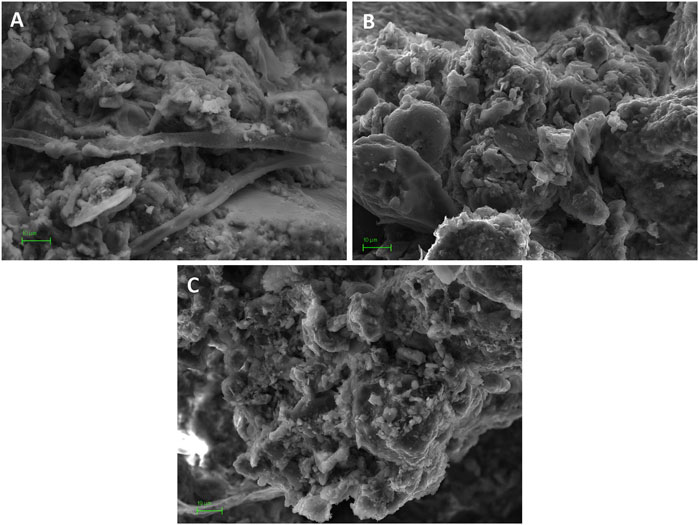
FIGURE 6. SEM images of soil structure at colloidal scale. (A) forest sample (6300x): clay domains and clusters supported by filamentous structures of fungus hypha; (B) organic sample (6300x); (C) conventional sample (5700x). Scale bar = 10 μm.
3.7 Adsorption Isotherms
Figure 7 shows adsorption isotherms 283.15, 293.15 and 313.15 K of the soils studied. In general, the isotherms conform to the Langmuir model, yielding saturation values greater than 0.30–0.35 g of carbon added, although at higher concentrations there was a tendency toward some desorption and the curve decreases slightly.
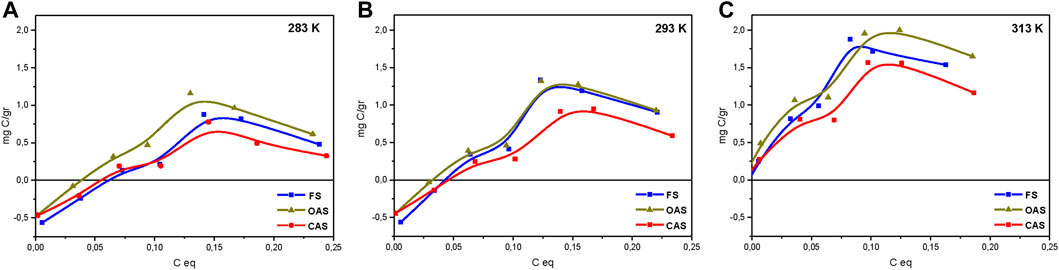
FIGURE 7. Absorption isotherms for studied soils: 283 K (A), 293 K (B) and 313 K (C). FS = forest sample, OAS = organic agriculture sample, CAS = conventional agriculture sample.
This desorption is attributed to the fact that after reaching the maximum value, it is caused by total coating of the surface by HA, which gives rise to reactions between the HA radicals (Ontiveros-Ortega et al., 1998). The obtained C adsorption for the three soils had the order of the very acid (pH 4.37) podzol studied by Vandenbruwane et al. (2007), and was much less than that established by Saidy et al. (2013) for pure illite and smectite.
In general, the conventional sample was the least adsorbent at any temperature. This may be explained by the lower contents of natural organic matter, which has been shown to be a contributing factor to adsorption (Plaza et al., 2015). The material with most adsorption at the three temperatures was the organic sample, although it was very close to that of forest sample. This confirms in part the finding above on the basis of ζ curves.
4 Conclusion
Soils of the Sierra Morena can be considered marginal for olive growth because of their slopes, thicknesses, stoniness and nutrient poverty. Here, we compared physical, chemical and colloidal properties of soil structure of a conventionally-managed olive grove with those of an organic olive farm, relating both to a natural soil under Mediterranean forest. The soil mineralogy matched the granodiorite parent rock, formed mainly by quartz (peak 0.425 nm) and phyllosilicates (peak 0.445 nm), showing a clay fraction dominated by 2:1 phyllosilicates as illite, vermiculite, HIV and their intergrades, with little differences between soils. ζ curves of the fine earth fraction (<2 mm) were negative (<0 mV) in solutions of mono- (potassium) and divalent- (calcium) cation, corresponding to permanent charges of 2:1 phyllosilicates. However, in solutions of trivalent cations (iron), ζ attained positive values (>0 mV) at acid pH.
Structure behavior of the soil samples at colloidal scale where characterized by total interaction energies, calculated according the extended DLVO model. Total energies where lower in the forest sample than in the cultivated soils, so the first showed a greater tendency toward particle flocculation. This would be related to the development of a more suitable pedological structure, being in accordance with those physical properties, such as the macroporosity of the soil or the structural stability index, which reached their maximum value in the forest soil. Specifically, in calcium solution, total energy of the forest sample was clearly attractive at close distance (<0 kT at 10 nm). More than by the electrostatic force, this was determined by the negative value of the AB component, which was related to a small value of the electron-donor component of surface free energy γ− (15 mJ m−2). The latter implies a clear hydrophobic character of the forest sample, which may have been caused by the high content of organic matter in this soil, as well as by biogenic activity shown by electron microscopy. In fact, SOC seems to be a key property to explain the structure development at colloidal scale.
Data Availability Statement
The original contributions presented in the study are included in the article, further inquiries can be directed to the corresponding authors.
Author Contributions
JC was in charge of sampling in the field, conducting analysis and mineralogy of soils and writing the manuscript. IP carried out the measurements of potential z and surface free energy in the laboratory. AO modeled the total energy of interaction according to the extended DLVO-model and collaborated in the writing of the work. VA was in charge of humus fractionation. RR was in the field sampling and helped in the writing of the work.
Funding
This research was funded by the PRIMA-H2020 project SUSTAINOLIVE (grant no 1811).
Conflict of Interest
The authors declare that the research was conducted in the absence of any commercial or financial relationships that could be construed as a potential conflict of interest.
Publisher’s Note
All claims expressed in this article are solely those of the authors and do not necessarily represent those of their affiliated organizations, or those of the publisher, the editors and the reviewers. Any product that may be evaluated in this article, or claim that may be made by its manufacturer, is not guaranteed or endorsed by the publisher.
References
Álvarez, S., Soriano, M. A., Landa, B. B., and Gómez, J. A. (2007). Soil Properties in Organic Olive groves Compared with that in Natural Areas in a Mountainous Landscape in Southern Spain. Soil Use Manage. 23, 404–416. doi:10.1111/j.1475-2743.2007.00104.x
Aranda, V., Ayora-Cañada, M. J., Domínguez-Vidal, A., Martín-García, J. M., Calero, J., Delgado, R., et al. (2011). Effect of Soil Type and Management (Organic vs. Conventional) on Soil Organic Matter Quality in Olive groves in a Semi-arid Environment in Sierra Mágina Natural Park (S Spain). Geoderma 164 (1), 54–63. doi:10.1016/j.geoderma.2011.05.010
Aranda, V., Calero, J., Plaza, I., and Ontiveros-Ortega, A. (2016). Long-term Effects of Olive Mill Pomace Co-compost on Wettability and Soil Quality in Olive groves. Geoderma 267, 185–195. doi:10.1016/j.geoderma.2015.12.027
Aranda, V., Macci, C., Peruzzi, E., and Masciandaro, G. (2015). Biochemical Activity and Chemical-Structural Properties of Soil Organic Matter after 17 Years of Amendments with Olive-Mill Pomace Co-compost. J. Environ. Manage. 147, 278–285. doi:10.1016/j.jenvman.2014.08.024
Aranda, V., and Oyonarte, C. (2006). Characteristics of Organic Matter in Soil Surface Horizons Derived from Calcareous and Metamorphic Rocks and Different Vegetation Types from the Mediterranean High-Mountains in SE Spain. Eur. J. Soil Biol. 42, 247–258. doi:10.1016/j.ejsobi.2006.03.001
Baumgarten, W., Neugebauer, T., Fuchs, E., and Horn, R. (2012). Structural Stability of Marshland Soils of the Riparian Zone of the Tidal Elbe River. Soil Tillage Res. 125, 80–88. doi:10.1016/j.still.2012.06.002
Bronick, C., and Lal, R. (2005). Manuring and Rotation Effects on Soil Organic Carbon Concentration for Different Aggregate Size Fractions on Two Soils in Northeastern Ohio, USA. Soil Tillage Res. 81 (2), 239–252. doi:10.1016/j.still.2004.09.011
Bunnemanm, E. K., Bongiorno, G., Bai, Z., Creamer, R., De Deyn, G., Goede, R., et al. (2018). Soil Quality: A Critical Review. Soil Biol. Biogeochemistry 120, 105–123.
Calero, J., Delgado, R., Delgado, G., and Martín-García, J. M. (2009). SEM Image Analysis in the Study of a Soil Chronosequence on Fluvial Terraces of the Middle Guadalquivir (Southern Spain). Eur. J. Soil Sci. 60 (3), 465–480. doi:10.1111/j.1365-2389.2009.01131.x
Calero, J., Ontiveros-Ortega, A., Aranda, V., and Plaza, I. (2017). Humic Acid Adsorption and its Role in Colloidal-Scale Aggregation Determined with the Zeta Potential, Surface Free Energy and the Extended-DLVO Theory. Eur. J. Soil Sci. 68, 491–503. doi:10.1111/ejss.12431
CAP, Consejería de Agricultura y Pesca (2015). El sector del aceite de oliva y la aceituna de mesa en Andalucía. Sevilla: Consejería de Agricultura y Pesca - Junta de Andalucía.
Di, X., Dong, H., An, X., Tang, H., and Xiao, B. (2016). The Effects of Soil Sand Contents on Characteristics of Humic Acids along Soil Profiles. Acta Geochim 35, 251–261. doi:10.1007/s11631-016-0114-6
Duman, O., and Tunç, S. (2008). Electrokinetic Properties of Vermiculite and Expanded Vermiculite: Effects of pH, Clay Concentration and Mono- and Multivalent Electrolytes. Separat. Sci. Technol. 43, 3755–3776. doi:10.1080/01496390802219109
Durán, J. D. G., Ontiveros, A., Delgado, A. V., and González-Caballero, F. (1998). Kinetics and Interfacial Interactions in the Adhesion of Colloidal Calcium Carbonate to Glass in a Packed-Bed. Appl. Surf. Sci. 134, 125–138.
EC, European Commission (2011). Commission document COM(2011) 625/2, corrigendum Annule et remplace le document COM(2011) 625, establishing rules for direct payments to farmers under support schemes within the framework of the common agricultural policy (CAP). Brussels: Official Journal of the European Union.
EC, European Commission (2005). Commission Regulation (EC) No. 2183/2005 of 22 December 2005 Amending Council Regulation (EC) No. 1782/2003 Establishing Common Rules for Direct Support Schemes under the Common Agricultural Policy and Establishing Certain Support Schemes for Farmers and Amending Regulation (EC) No. 795/2004 Laying Down Detailed Rules for the Implementation of the Single Payment Scheme provided for in Council Regulation (EC) No. 1782/2003. Brussels: Official Journal of the European Union.
Fisher, T., Veste, M., Wiehe, W., and Lange, P. (2010). Water Repellency and Pore Clogging at Early Successional Stages of Microbiotic Crust on Inland Dunes, Brandenburg, NE Germany. Catena 80, 47–52. doi:10.1016/j.catena.2009.08.009
Gómez, J. A., Battany, M., Renschler, C. S., and Fereres, E. (2003). Evaluating the Impact of Soil Management on Soil Loss in Olive Orchards. Soil Use Manage. 19, 127–134. doi:10.1079/sum2002179
Gómez, J. A., Guzmán, M. G., Giráldez, J. V., and Fereres, E. (2009). The Influence of Cover Crops and Tillage on Water and Sediment Yield, and on Nutrient, and Organic Matter Losses in an Olive Orchard on a sandy Loam Soil. Soil Tillage Res. 106, 137–144. doi:10.1016/j.still.2009.04.008
Grasso*, D., Subramaniam, K., Butkus, M., Strevett, K., and Bergendahl, J. (2002). A Review of Non-DLVO Interactions in Environmental Colloidal Systems. Rev. Environ. Sci. Biotechnol. 1 (1), 17–38. doi:10.1023/a:1015146710500
Hajnos, M., Calka, A., and Jozefaciuk, G. (2013). Wettability of mineral Soils. Geoderma 206, 63–69. doi:10.1016/j.geoderma.2013.04.019
Infante-Amate, J. (2012). The Ecology and History of the Mediterranean Olive grove: The Spanish Great Expansion, 1750 – 2000. Rural Hist. 23 (02), 161–184. doi:10.1017/s0956793312000052
Karlen, D. L., Mausbach, M. J., Doran, J. W., Cline, R. G., Harris, R. F., and Schuman, G. E. (1997). Soil Quality: A Concept, Definition, and Framework for Evaluation (A Guest Editorial). Soil Sci. Soc. America J. 61 (1), 4–10. doi:10.2136/sssaj1997.03615995006100010001x
Kemper, W. D., and Rosenau, R. C. (1986). “Aggregate Stability and Size Distribution,” in Methods of Soil Analysis, Agronomy No. 9. Editor A. Klute (Madison, WI: American Society of Agronomy and Soil Science Society of America), 425–442.
Lagaly, G. (2006). Chapter 5 Colloid Clay Science. Dev. clay Sci. 1, 141–245. doi:10.1016/s1572-4352(05)01005-6
Leone, V., Musmarra, D., Iovino, P., and Capasso, S. (2017). Sorption Equilibrium of Aromatic Pollutants onto Dissolved Humic Acids. Water Air Soil Pollut. 228, 136–142. doi:10.1007/s11270-017-3321-9
Maqbela, M. P., and Mnkeni, P. N. S. (2009). Nostoc Cyanobacterial Inoculation in South African Agricultural Soils Enhances Soil Structure, Fertility, and maize Growth. Plant Soil 315, 79–92.
Martínez, R. E., Sharma, P., and Kappler, A. (2010). Surface Binding Site Analysis of Ca2+-Homoionized clay-humic Acid Complexes. J. Colloid Interf. Sci. 352, 526–534. doi:10.1016/j.jcis.2010.08.082
Moleon, J. A., Ontiveros-Ortega, A., Gimenez-Martin, E., and Plaza, I. (2015). Effect of N-Cetylpyridinium Chloride in Adsorption of Graphene Oxide onto Polyester. Dyes Pigm. 122, 310–316. doi:10.1016/j.dyepig.2015.07.004
Ontiveros-Ortega, A., Espinosa-Jiménez, M., Chibowski, E., and González-Caballero, F. (1998). Effect of Tannic Acid on the Surface Free Energy of Polyester Dyed with a Cationic Dye. J. Colloid Interf. Sci. 199 (1), 99–104. doi:10.1006/jcis.1997.5302
Ontiveros-Ortega, A., Vidal, F., Giménez, E., and Ibáñez, J. M. (2014). Effect of Heavy Metals on the Surface Free Energy and Zeta Potential of Volcanic Glass: Implications on the Adhesion and Growth of Microorganisms. J. Mater. Sci. 49 (9), 3550–3559. doi:10.1007/s10853-014-8077-7
Page, A. L., Miller, R. H., and Keeney, D. R. (1982). Methods of Soil Analysis: Chemical and Microbial Properties. 2nd ed. Madison: Soil Science Society of America, 903–947.
Peng, X., Horn, R., and Hallett, P. (2015). Soil Structure and its Functions in Ecosystems: Phase Matter & Scale Matter. Soil Tillage Res. 146, 1–3. doi:10.1016/j.still.2014.10.017
Plaza, I., Ontiveros-Ortega, A., Calero, J., and Aranda, V. (2015). Implication of Zeta Potential and Surface Free Energy in the Description of Agricultural Soil Quality: Effect of Different Cations and Humic Acids on Degraded Soils. Soil Tillage Res. 146, 148–158. doi:10.1016/j.still.2014.10.013
Ramos-Tejada, M. M., Ontiveros, A., Viota, J. L., and Durán, J. D. G. (2003). Interfacial and Rheological Properties of Humic Acid/hematite Suspensions. J. Colloid Interf. Sci. 268 (1), 85–95. doi:10.1016/s0021-9797(03)00665-9
Saidy, A. R., Smernik, R. J., Baldock, J. A., Kaiser, K., and Sanderman, J. (2013). The Sorption of Organic Carbon onto Differing clay Minerals in the Presence and Absence of Hydrous Iron Oxide. Geoderma 209-210, 15–21. doi:10.1016/j.geoderma.2013.05.026
Sawnhey, B. L. (1989). “Interstratification in Layer Silicates,” in Minerals in Soils EnvironmentSoil Science Society America Book Series. Editors J. B. Dixon, and S. B. Weed (Madison, WI: Soil Science Society of America), Vol. 1, 789–828.
Six, J., Conant, R. T., Paul, E. A., and Paustian, K. (2002). Stabilization Mechanism of Soil Organic Matter: Implications for C-Saturation of Soils. Plant and Soil 241, 155–176. doi:10.1023/a:1016125726789
Soil Conservation Service (1972). Soil Survey Laboratory Methods and Procedures for Collecting Soil Samples. Washington: U.S. Department of Agriculture.
Somasundaran, P., and Krishnakumar, S. (1997). Adsorption of Surfactants and Polymers at the Solid-Liquid Interface. Colloids Surf. A: Physicochemical Eng. Aspects 123-124, 491–513. doi:10.1016/s0927-7757(96)03829-0
Sondi, I., Bišćan, J., and Pravdić, V. (1996). Electrokinetics of Pure clay Minerals Revisited. J. Colloid Interf. Sci. 178 (2), 514–522. doi:10.1006/jcis.1996.0146
Swift, R. S. (1996). “Organic Matter Characterization (Chap. 35),” in Methods of Soil Analysis, Part 3, Chemical Methods. Soil Sci. Soc. Am. Book Series N° 5. Editor D. L. Sparkset al. (Madison, WI, USA: ASA/SSSA, Inc.), 1018–1021.
Sys, I. C., van Ranst, E., and Debaeye, I. J. (1991). Land Evaluation. Belgium: Agricultural PublicationsUniversity of Ghent.
van Oss, C. J., Chaudhury, M. K., and Good, R. J. (1988). Interfacial Lifshitz-van der Waals and polar interactions in macroscopic systems. Chem. Rev. 88 (6), 927–941. doi:10.1021/cr00088a006
Van Oss, C. J., and Giese, R. F. (1995). Hydrophobicity of Biosurfaces – Origin, Quantitative Determination and Interaction Energies. Colloids Surf. B: Biointerfaces 5 (3-4), 91–110. doi:10.1016/0927-7765(95)01217-7
Vandenbruwane, J., Neve, S. D., Qualls, R. G., Salomez, J., and Hofman, G. (2007). Optimization of Dissolved Organic Nitrogen (DON) Measurements in Aqueous Samples with High Inorganic Nitrogen Concentrations. Sci. Total Environ. 386 (1), 103–113. doi:10.1016/j.scitotenv.2007.06.025
Keywords: zeta potential, particle energy of interaction, SEM-fabric, organic soils, olive groves, soil hydrophobicity
Citation: Calero J, Plaza I, Ontiveros A, Aranda V and García-Ruiz R (2022) Effects of Organic Agriculture in Structure and Organic Carbon Adsorption at Colloidal Scale in Marginal Olive Groves, Characterized by the Extended DLVO Model. Front. Environ. Sci. 10:805668. doi: 10.3389/fenvs.2022.805668
Received: 30 October 2021; Accepted: 08 February 2022;
Published: 15 March 2022.
Edited by:
Pascal Boivin, University of Applied Sciences Western Switzerland, SwitzerlandReviewed by:
Yves Lucas, Université de Toulon, FranceFranziska Bucka, Technical University of Munich, Germany
Copyright © 2022 Calero, Plaza, Ontiveros, Aranda and García-Ruiz. This is an open-access article distributed under the terms of the Creative Commons Attribution License (CC BY). The use, distribution or reproduction in other forums is permitted, provided the original author(s) and the copyright owner(s) are credited and that the original publication in this journal is cited, in accordance with accepted academic practice. No use, distribution or reproduction is permitted which does not comply with these terms.
*Correspondence: J. Calero, jcalero@ujaen.es; I. Plaza, geo.ivan.p.f@gmail.com