Optimized Variables for Environmental Dynamics: China’s Renewable Energy Policy
 Yujing Wang
 Yanqun You1*
  Yu Teng
- 1School of Economics, Tianjin University of Commerce, Tianjin, China
- 2Business School, University of Portsmouth, Portsmouth, United Kingdom
The purpose of this study is to determine the impacts of foreign direct investment (FDI), renewable energy (RE), energy consumption index (ECI), Globalization (GLO), and green technology innovation (GTI) on environmental pollution using a time series data from 1980 to 2019, using DARDL assessor to look at how markers with high levels of petroleum derivatives distorted the explanatory variable in China. The results showed that GTI contaminated environmental sustainability (ES). The polluted safe house notion claimed that FDI has a negative impact on the country’s inherent character. Finally, people are waking up to the importance of ES. Single-headed causalities from GTI to carbon emissions were detected in the middle of the other causes and fossil fuel byproducts need to change into green energy resources to reduce environmental pollution. Finally, the research proved that FDI is a major source of environmental pollution in China. According to the findings of the DARDL research, foreign direct investment and urbanization, green technological innovations, and China’s environmental pollution policy direction are all congruent with each other.
1 Introduction
Governments across the world are always concerned about environmental issues, which are related to financial activities and the increased usage of energy (Mardani et al., 2018; Sun et al., 2021). CO2 emissions and sulfur dioxide (SO2) are the greatest threat to human civilization and financial development, and increased energy consumption contributes to higher CO2 emissions over the long and short term (Mahmood et al., 2020). CO2 emissions, financial development, and energy consumption are the primary causes of climate change; studies on state-run administrations (Mardani et al., 2018; Elahi et al., 2021; Elahi et al., 2022a; Elahi et al., 2022b) that were adjusted for urbanization, FDI, and energy consumption strategies also have a significant impact on CO2 emissions, and the connection is positive to the use of energy. However, there may be a few levels of causation among the elements that have been connected for a long time (Li et al., 2020). Dumitrescu and Hurlin. (2012) board causality test is robust in the face of cross-sectional correlations and slant variability, and has argued that energy finance is the driving force of financial development. He et al. (2021) has confirmed that energy use and financial development may all predict the frequency of fossil fuel byproduct usage and CO2 emissions as an intermediate of environmental degradation. CO2 emissions are affected by the global storage network that contributes to the generation of emissions (Shahbaz et al., 2013). The investment policies of the government of the examined countries, especially those that are tailored toward renewable energy, should cover more sectors of the economy. Shahbaz et al. (2013) showed that energy utilization and financial development produce CO2 emissions in oil-rich economies. Xu et al. (2018) used ARDL model with a vector error correction model (VECM) and found a substantial positive association and bidirectional causation between Saudi Arabia’s currency turn of events and CO2 emissions. The purpose of this study is to determine the impacts of green technology innovation, globalization, foreign direct investment, and energy consumption on environmental sustainability in China, as these issues are major causes to increase or decrease environmental pollution. The research gives a road map to future researchers to collect more information about the problems of air, water, and soil pollution and climate change in China.
Including the presentation, this work is divided into five sections that are all connected in the following way. Section 2 provides a brief review of the literature review. Section 3 provides methods, data collection techniques, and econometrical equations. Section 4 explains the results and discusses the relationship between CO2 emissions, energy consumptions, and GDP, as well as the unit root and board cointegration tests. The conclusions and recommendations are described along with future research directions in Section 5.
2 Literature Review
According to Inglesi (2018), sustainable and non-sustainable power sources were evaluated in the analysis of fossil fuel waste in Sub-Saharan African states. Over the same period, global energy consumption is forecast to rise by 80%, while ozone-depleting chemical transmissions are expected to increase by 50%. According to Erdogan et al. (2020), a country’s financial development consumes a great deal of energy and leads to greater natural corruption. According to Mardani et al. (2018), countries’ use of energy and financial development foreshadowed their emissions of carbon dioxide into the atmosphere; the G20 countries’ share of global CO2 emissions in 2017 was 91%, which is consistent with previous estimates. Natural Kuznets bend (EKC) between financial development and CO2 emissions was permitted (Xu et al., 2020). The main policy implication is that energy conservation strategies will be detrimental to China’s economy both in the short run and long run and that energy consumption contributes significantly to environmental degradation through a negative impact on ecological footprint. According to Waheed et al. (2019), fossil fuel byproducts were not connected to financial development in developed nations. In developed countries, increased use of energy was seen as a major culprit in the production of large levels of fossil fuel waste. Awodumi and Adewuyi. (2020) found an unbalanced influence of non-sustainable power utilization on financial growth and fossil fuel byproduct per capita. The Chinese government should switch production activities and energy sources available for consumption from non-renewable production/consumption technologies to renewable and energy-saving technologies (Seyi et al., 2020). As predicted by O'Ryan et al. (2020), the transmission of emissions in Chile may differ if non-sustainable electricity is taken into account. Pata (2018) found that the use of sustainable electricity in the country had no impact on carbon emissions. Using biomass as a source of energy, Adewuyi and Awodumi. (2017a) examined the positive connections between financial developments and the use of fossil fuel wastes. Economic growth exerts a positive and statistically significant impact on the ecological footprint. The peaked pressure on the country’s ecological composite is largely attributed to economic expansion. According to Samour et al. (2019), improvements in the Turkish financial sector led to an increase in energy consumption, which in turn resulted in high CO2 emissions in the country. A new variable, financial development, was included in the model by Nkengfack and Kaffo, 2019 to account for its effect on CO2 emissions, and G20 economies together account for almost three-quarters of global oil consumption. Energy use was identified as a significant contributor to CO2 emissions. According to Cole and Neumayer, 2004 increased demand for private and non-private energy also increases pollution. Ahmed et al., 2019 discovered that the influence of urbanization on CO2 emissions was incorporated, and FDI inflows are connected to soiled technologies that increase the rate of CO2 emissions in developed countries. Dou and Han, 2019; Jun et al., 2018 discovered that the CO2 emissions are also reduced by FDI inflows, which are connected to energy-efficient developments. Mert et al. (2019) demonstrated that CO2 emissions were influenced by an unknown direct venture, and that economic growth in G20 countries was cited as a major driver of CO2 emissions. According to Karasoy, (2019), nations that are heavily reliant on the use of dirty energy have higher CO2 emissions and any effort to reduce CO2 emissions will slow down the countries’ economic growth. Similarly, a two-sided relationship between energy use and CO2 emissions was discovered (Chen et al., 2019). The fossil-fuel-based energy also contributes to harming the environment. Furthermore, the bloc shows that the institutional level is still not sufficient to spur the creation of a clean environment (Festus et al., 2021a). This demonstrates that the use of energy often increases the radiation of CO2 in the countries connected to environmentally hostile developments that flood the nations’ emission rates. Zhang (2011) described that earth-wide warming, the liquefying of Antarctica, and the increasing ocean levels decreased water accessibility. Strict environmental guidelines and regulations are necessary to control the unhealthy and undue economic activities that are suspected to impact negatively on the environment. Emission targets are worth implementing in industrial areas to reduce emissions from urban areas (Festus et al., 2021b). An increase in disease and the termination of wild and sea-going animals are some of the complicated challenges for China (Wang et al., 2021). Fossil fuel byproducts have been criticized due to the carbon leakage difficulties in exchange development (Su, 2014). According to Brizga, (2017) a general rise in salary is often assumed to lead to an increase in consumption, which is widely thought to be the primary driver of asset usage and environmental degradation. Various scholars have examined the possibility of mechanical development as a means of preventing emissions (Lee, 2015). Capacity innovation and carbon capture are elements of mechanical development, which can handle CO2 emissions (Huaman, 2014). When it comes to pollution management, one strategy that has gained widespread recognition is the use of limitless sources of energy (Chiu, 2009; Gessinger, 1997). Petroleum product energy has been shown and demonstrated to increase fossil fuel byproducts. Some researchers have focused on the task of extending utilizations of fossil fuel byproducts’ incitement (Adebayo and Kirikkaleli, 2021). An inverted U-shaped pattern between energy use and economic growth in the long run showed that at a higher level of economic development there is less intensification of energy consumption (Festus et al., 2019). In addition, the consumers of labor and products get emissions in the form of payments (Afionis et al., 2017). According to the findings of Hasanov et al. (2018), imports and commodities have both increased and decreased over time. According to Sheau, (2014), CO2 emissions were increased in six regions when imports and consumption, the study found that both energy and financial advancements reduce fossil fuel by products. Mensah et al. (2018) further demonstrated that mechanical advances and sustainable power regulate fossil fuel byproducts. The focus of Shahbaz et al. (2013) was on France’s financial and energy advancements. OECD countries were examined in terms of energy development by lvarez et al. (2017), who found that development in energy development regulates CO2 emissions. According to Bhattacharya et al. (2020), the likelihood of joining a low-fossil-fuel byproducts force club rises with increases in absolute component usefulness, environmentally green technology innovation, and urbanization. As Khan et al. (2020) reported, goods derived from fossil fuel byproducts have negative long- and short-term environmental impacts. Khan et al. (2020b) found that imports and payments improve utilization-based byproducts of fossil fuels over the long term, whereas trade, natural development, and environmentally beneficial power consumption reduce CO2 emissions of utilization. Knight and Schor (2014) found that financial development has a favorable influence on emissions based on use and an increase in sustainable electricity helps alleviate environmental degradation. Moghadam and Dehbashi. (2018) used the ARDL model to examine the issue, and the results demonstrate that increasing the value of the Iranian energy consumption increases the country’s CO2 emissions. Analysis of positive and negative shocks in financial development in China using the NARDL approach by Ahmad et al. (2018) found that positive shocks had a greater influence on CO2 emissions over the long term than negative shocks from financial events. NARDL results reveal that the short-term and long-term unequal effect of financial improvement on CO2 emissions is insignificant (Karasoy and Akc¸ay, 2019). The findings of Ibrahiem (2020) suggest that financial improvement boosts CO2 emissions in the economy, as a result of the increased demand for money. Ozturk et al. (2016) using the ARDL and NARDL models, showed that transport energy utilizations and CO2 emissions have a positive relationship. ARDL simulations are used by Sarkodie et al. (2020) to study the environmental impact of fossil fuel waste and EF in China, while the usage of petroleum derivatives are studied as a source of energy that affects both of these natural indicators. Nonlinear ARDL was used by Baz et al. (2020) to investigate the relationship between energy use, financial development, and climate change.
3 Research Methodology
3.1 Data Collection Procedure
Data on 525 firms’ measurable information connected with foreign direct investment (FDI), renewal energy (RE), energy consumption index (ECI), Globalization (GLO) Globalization, and green technology innovation (GTI) was gathered from Shanghai Stock exchange, China Factual Yearbook, China Securities exchange, and Bookkeeping Exploration (CSMAR) Data sets from 1980 to 2019. The data collected from these websites is time series data, which is more suitable for analysis. The information connected with natural supportable (NS), Fossil fuel byproducts (CO2), Green Technology innovation (GTI), and energy sources is gathered from China Measurable Yearbook on Climate, China Factual Yearbook on Science and Innovation, and China Energy Measurable Yearbook.
3.2 Econometric Descriptions
China’s carbon-serious exercises are a significant contributor to this scourge. As far as anyone is concerned, there has been no review that explicitly inspected the connection between financial development (FD) and ecological sustainability (ES) in China, despite the various investigations on ES in the country. Along these lines, an examination concerning the connection among FA and ES was considered significant to concoct proposals for working on natural quality in the country. Here is a capacity that was introduced to accomplish that objective:
The equation in a linear form is:
In Condition 2, β1, β2, β3, β4, and β5 are the boundaries of FDI, GLO, ECI, GTI, and ES individually, while t represents the concentration on the country. Additionally, a0 is the steady term, while μt addresses the stochastic blunder term; normal logarithm was taken on the two sides of Condition 2 bringing about the following particular:
where lnCO2, lnFDI, lnGLO, lnECI, lnGTI, and lnES are the log conversions of the output and the input variables correspondingly.
3.3 Econometric Metaphors
ARDL bound test followed by the Johansen test were directed to evaluate the co-joining credits of the series. The reconciliation request of the series was done by means of the DF-GLS, PP, ADF, and the KPSS unit root tests. Following the example of Pesaran. (2006), the model produced for the bound test was indicated as; Φ
where Φ0 is the catch and ∆ means the change administrator. Additionally, t−1 represents the slacks chose in light of the AIC, while the boundaries to be assessed are addressed by Φ and β. Under the bond test, the invalid and the elective speculation are communicated as:
If the processed F-test exists in the lower and the upper limits, the choice becomes uncertain. To survey the energy of the bound test, the Johansen co-incorporation test was likewise directed. This test is comprised of two tests: most extreme Eigenvalue test and follow test. The theory of the follow test is expressed as:
where K0 is set to zero to inspect on the off chance that the invalid speculation will not be approved, and in the event that it is not approved, at that point, Co-joining exists in the midst of the series. The most extreme Eigenvalue test speculation then again are expressed as:
In the above the opportunity for the series to be fixed is presetned if K = K0 and the invalid theory is not approved. Contrastingly, there are M plausible direct mixes, if K0 = m-1 and the invalid theory is dismissed. The ARDL model formed to investigate the long-term alliance in the midst of the series was communicated as:
where σ symbolizes the long-run variance and t−1 are the lags chosen via the AIC. For the short-run ARDL model, the ensuing specification was developed.
Where the short-run variance is denoted by σand IRSt−1 is the error correction term with Φ being its coefficient. The DARDL technique uses up to 5000 simulations (Amin and Dogan, 2021) as:
In Condition 13, Δ(y) signifies the adjustment of the result variable, 0 is the catch, t-1 addresses the slack, p and q represent the slacks of the primary distinction of the reaction variable and the regressors individually, Δ is the administrator of development, and μ is the stochastic blunder term. Regarding equation-13, the following DARDL mistake remedy detail was created to investigate the connation in the midst of the series:
where the distinction administrator is signified by Δ and α0 is the block. Additionally, θ′s and ′s are the long-run and the short-run coefficients to be assessed individually. μ is the lingering term at time t. The VECM of Granger (1987) creates dependable outcomes in time series examination, and was taken on to uncover the causations in the midst of the series. In investigating the causal associations in the midst of the series, the accompanying powerful blunder adjustment models were used:
As per Jordan and Philips (2018), the DARDL technique is relevant assuming the measurablevariable has an I (1) mix request. The indicators may have an I (1) or I (0) coordination request or both, however it should not surpass request I (1).
The boundary of the IRS estimates the change speed from the disequilibrium to the balance affiliation and generally falls inside the scope of—1 to 0. The instability is changed at the time the mistake amendment coefficient becomes negative and huge.
Additionally, sequential relationships in the blunder terms were surveyed through the Breusch-Godfrey LM test, while the Ramsey RESET test was performed to check for model precision. As indicated by Qin et al. (2021), relapse assessors do not remark on causal relationships in the midst of series.
In accordance with Khan et al. (2020), the Curve and the Breusch-Agnostic Godfrey tests were performed to evaluate heteroscedasticity in the remaining terms, while the Jarque-Bera test was used to check for lingering ordinariness.
The ARDL technique came out with the DARDL method to improve upon the situation, as well as to estimate the long and the short-run connections amidst series.
In the situations above λ is the steady term, while the assessed boundaries are typified by Φ. Additionally. IRSt−1 is the mistake amendment term, while Φ is the blunder rectification coefficient which estimates the speed of change towards the balance. Φ shows how irregularities from the drawn-out harmony are amended. Additionally, ∆ means the distinction administrator, while q is the ideal slacks chosen through the AIC. μ is the lingering term which is sequentially uncorrelated around a mean of nothing, while t is the review time frame.
4 Results and Discussions
Table 1 shows the distinct insights for the factors. EC had the best normal worth in the table, while CO2 emissions had the most reduced. Information estimations for CO2 emissions, FDI, ECI, and GTI were all near their mean qualities, while FDI and ES information estimations were far off from their mean qualities, because of significant standard deviations in these informational collections. LnCO2 fixations were additionally observed to be one-sided. This means that a major piece of the variable’s information was on the left, while the tails of its dispersion were longer on the right side.
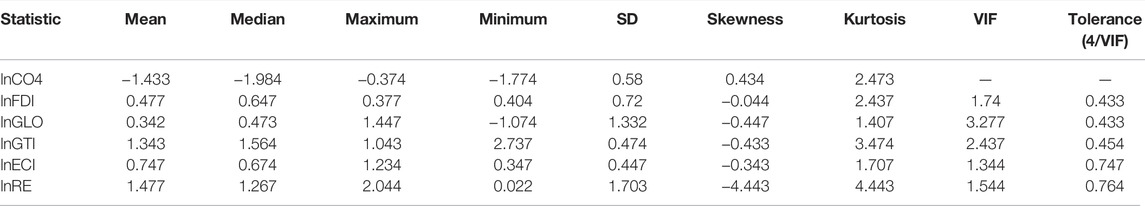
TABLE 1. Descriptive statistics.
This implies that their information was bound to be found on the right half of the dispersion and they had a more drawn-out left tail than different factors. Extra information showed that the dataset of ES had bigger tails than the ordinary conveyance, though the dataset of different factors had lighter tails than the typical dispersion, due to their kurtosis values being not exact; the connection examination is shown in Table 2 as follows.
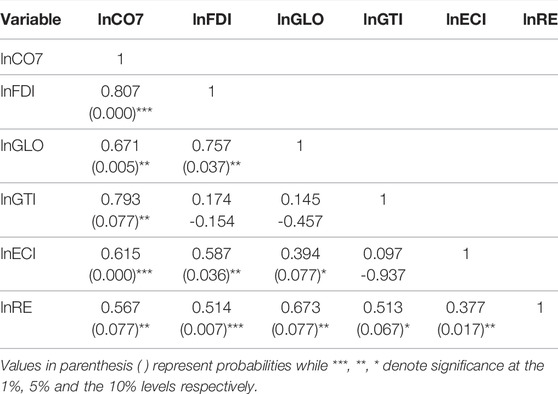
TABLE 2. Correlational analysis.
Government projects upheld by green cash are huge scope hypotheses with more dangers and more convoluted system collaboration, making it hard to achieve unprecedented profits from green innovation advancement. Positive outer conditions and low venture benefit increment speculation hazard in advancing green development of substance area. The public authority’s job should decrease the cost of consistency for organizations. The objective of regular methodology ought to be to stay aware of the activities of the collecting business by further making systems for biological information revelation and normal administration, as per one viewpoint. Table 3 shows the principal component’s analysis.
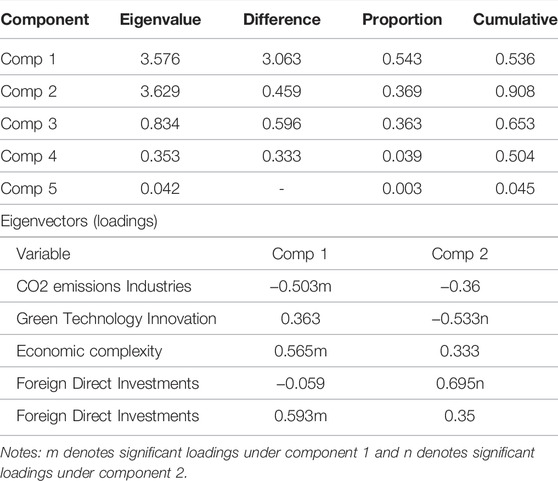
TABLE 3. Shows the results of principal component’s analysis on green technology innovation.
4.1 Unit Root and Cointegration Tests Results
Numerous measurable tests and models in time series investigation depend on fixed information. To find out about the series’ fixed characteristics, the DF-GLS, PP, KPSS, and ADF unit root tests were utilized. The DARDL assessor might be utilized on the grounds that, as displayed in Table 4, all series are fixed at request I (1). A change in time did not adjust the type of the disseminations of the factors after their first separation. This disclosure is in concurrence with the examinations of Sun et al. (2021), which showed that the series have a co-reconciliation relationship assuming they have a coordinated request of I (1), as shown in Table 4 the unit root tests results.
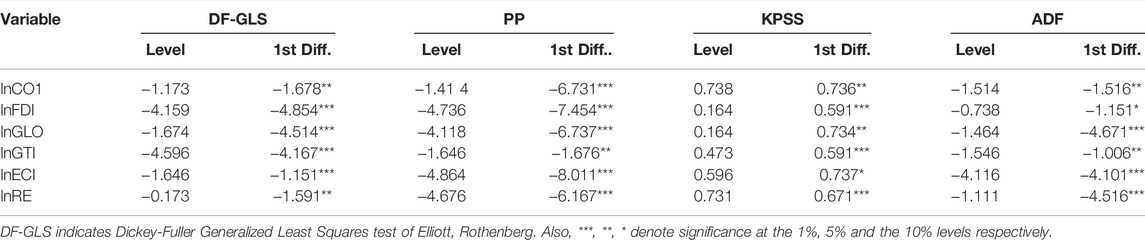
TABLE 4. Unit root tests results.
Subsequently, the tests in Table 5 were utilized to inspect the co-combination attributes of the series in the second phase of the investigation. It was found that the F-test and t-test estimations were fundamentally higher than the upper limits, affirmed by huge rough p-values. This shows that the series had a drawn-out co-incorporation relationship.
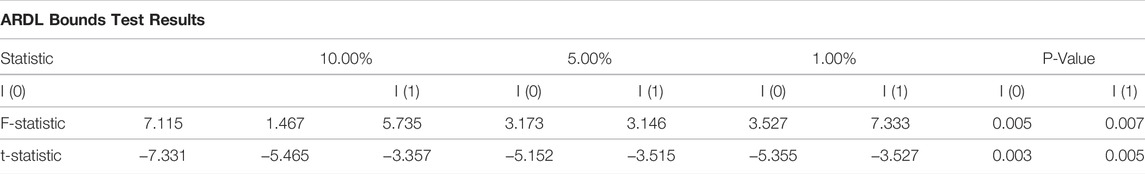
TABLE 5. Cointegration tests results.
Gauges from the Johansen test were additionally contrasted with the limits test to guarantee that the outcomes were precise. To build up this drawn-out connection between factors, all the co-joining conditions were demonstrated to be measurably huge. The subsequent stage was to examine the indicators’ boundaries are matched between the aftereffects of Musah et al. (2020a). Table 6 shows the Johansen co-integration test results.
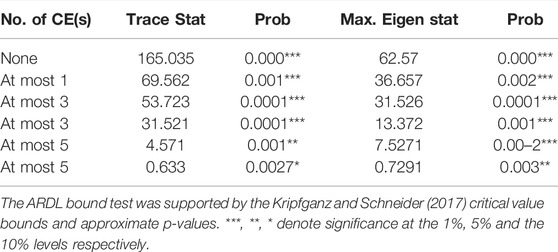
TABLE 6. Johansen co-integration test results.
4.2 Dynamic ARDL Recreations Results
To appraise the versatility of regressors, the co-incorporation of the series should be affirmed. As a third stage, the analysts utilized the DARDL assessor to inspect the minor impacts of the indicators on the rule variable. Table 7 shows that FDI developing fossil fuel byproducts in China impacted ES. To put it another way, a one percent increment in FDI affected the long haul and transient ES individually. It is conceivable that open financial administrations helped modernie and assemble movement, which thus prompted an expansion in emissions. Financial development might prompt an increment in emissions of carbon dioxide, as indicated by Zhao et al. (2021). Studies recommend that financial incorporation allowed individuals to acquire minimal expense financing for contaminating family hardware, which ultimately debased the country’s natural quality. Organizations had the option to get minimal expense offices to buy energy-concentrated hardware and apparatus, which brought about more emissions on account of financial comprehensiveness. Financial comprehensiveness might have prompted an ascent in the country’s gross fixed capital development, bringing about an expansion in energy utilization and an increase in the country’s emissions. These outcomes vary from past exploration which tracked down an altered U-formed connection among FA and carbon emissions in 103 nations. Contingent upon the phase of FA, its effect on the radiation of carbon differs (Renzhi, 2020). Moreover, FDI added to China’s natural harm for each 1% expansion in FDI; the country’s current circumstance was deteriorated by 1.167 and 0.937% in both the long-term and the present. To get away from the expenses of thorough ecological limitations, environmentally unfriendly organizations move their exercises towards low natural guidelines (Guoyan et al., 2021). Along these lines, China’s ecological guidelines were deficient, which tempted high-contaminating firms to settle in China. Apparently FDI inflows supported financial action in the country, which thus prompted an expansion in the utilization of contaminating energy sources and, subsequently, emissions. FDI is fundamental to China’s financial endurance, but more natural laws are expected to keep the import of harmful associations from different nations. Approaching unfamiliar direct speculation (FDI) into the country ought to be considered alongside new environmentally friendly innovation and assembling strategies. As described by Gyamfi et al. (2021), the corona hypothesis is upheld by the review’s discoveries that FDI inflows are connected to green innovation, administrative abilities, and high assembling norms that increment ES in the host countries. Accordingly, vacillations in FDI can prompt decreases in emissions in the nations that get it, which is eventually positive for the climate (Mert et al., 2020).
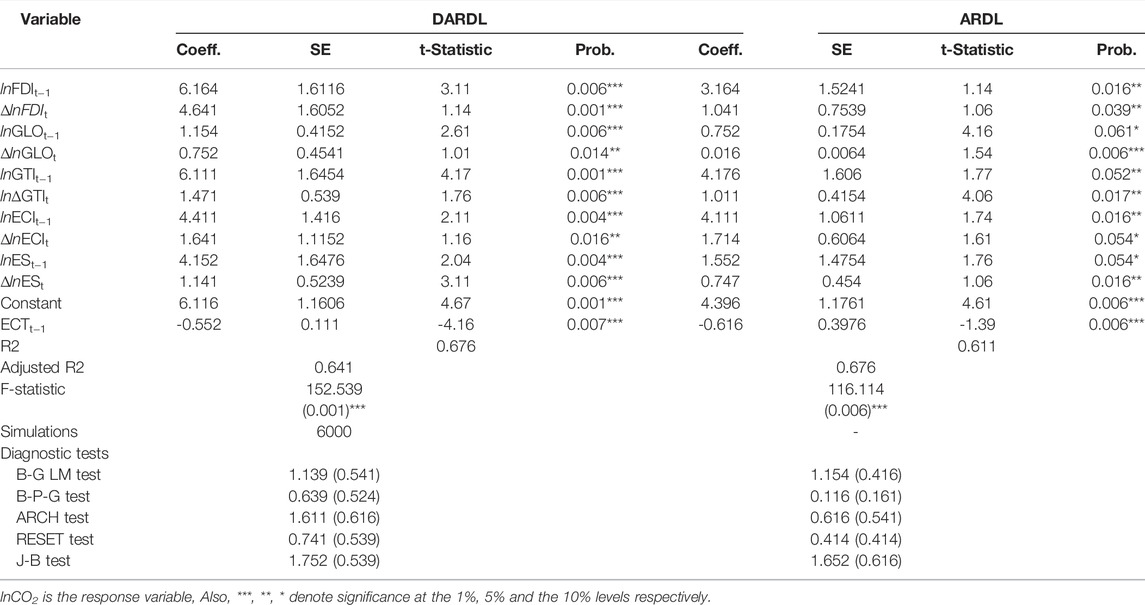
TABLE 7. DARDL and ARDL estimation results.
4.3 DARDL and ARDL Estimation Results
FD was antagonistic to China’s nature. A 5% increment in FDI affects the country’s current circumstance of 5.221% in the long haul and 1.491% in the short-term that shows that China’s receptiveness to exchange with its partners has brought about a debilitation of exchange-related natural guidelines. Accordingly, more carbon-serious products were imported, which prompted expanded emissions the nation over. China’s economy developed its expanded business with different nations, bringing about an increment in ozone harming substance emissions, because of the scale of impact exploratory investigations of the information. In China, GTI likewise affected ES. At the point when all else is equivalent, a 1% increment in GTI lessens the country’s current circumstance by 5.532% over the long haul and by 3.721% in the short-term. Human exercises are generally at fault for developing contamination levels across all economies, hence this disclosure does not shock anyone. China’s GTI rate was expected to climb, which would prompt an increase in contamination in the climate. Expanded interest for petroleum products has likewise added to natural tainting in the country because of the developing pace of hereditarily adjusted creatures. The long and short-term impacts of a 1% increment in ES were 4.257 and 2.252%, separately, when any remaining elements stayed consistent. As indicated by these discoveries, the country’s modern and business action was controlled via fossil fuel byproducts using unclean energy. China’s expanding natural worries require the utilization of environmentally friendly power sources that have been considered positive for human wellbeing and the climate. As well as supporting the country’s financial development, a shift to clean energy utilization may likewise help the nation’s change to a more reasonable economy (Danish et al., 2018). Subsequently, sustainable power will not just assist the country with handling environmental change, however it will likewise Slacked blunder revision (IRSt-1) was additionally negative and significant, as anticipated. The IRSt-1 score of - 0.886 demonstrates that any disparity was recuperated at a pace of 88.6%. In their exploration, Murshed et al. (2021) tracked down equal R discoveries; the Breusch Godfrey LM-test found no sequential connection in the model’s mistake terms considering the disclosures and Curve and Breusch-Agnostic Godfrey-tests observed that the residuals were homoscedastic. Moreover, the Ramsey RESET-test demonstrated that the model was all around indicated and changed R2 demonstrates that 84.1% of the variety in ES can be attributed to the indicators, while the critical F-estimation mirrors the model’s capacity to clarify the information precisely and productively. An upgraded form of the ARDL assessor, DARDL, has been created in Table 7.
Thus, assessments of the ARDL approach were additionally analyzed. In both the long and short-term, FDI contrarily affected ES. Likewise, GLO, ECI, GTI, and ES adversely affect the country’s ecological wellbeing. As seen by the R2 estimation, the IRSt-1 was genuinely irrelevant at the 1% level while the relapses represented a significant part of the change factor. Moreover, the F-measurement estimation utilizing this method demonstrated that the model had an exceptionally high prescient potential. To sum up, the versatility of the indicators under the two assessors fluctuated as far as weight and importance, however they were comparable as far as sign. Along these lines, the discoveries are solid and might be utilized to settle on approach decisions. Table 8 shows the analytic tests used to confirm the model’s legitimacy.
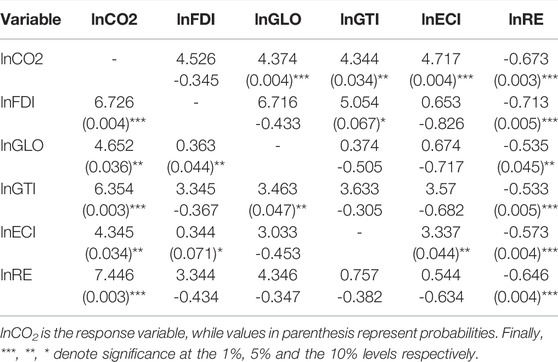
TABLE 8. Pairwise Granger causality tests results.
According to Qin et al. (2021), evaluation does not provide detailed information on the causal relationship in a series of events. For this reason, the VECM technique was used to investigate how the various sections are related to one another in light of Chontanawat (2020). Table 8’s negative and massive IRSs caused a lengthy causal chain in the middle of the series. One-way causality between the data and the results showed that FDI had a single direction link with routine pollution. Proponents of this theory argue that shopper premium was sustained by cash in the economy, leading to an increase in usage-based emissions.
4.4 Discussions
When businesses gained access to income, they used high-polluting energy that degraded the country’s natural quality, which was a direct result of financial fusing. It was shown that GLO and normal corruption had a two-way relation. Because of this link, which suggests that the series were brought together to such a degree that a flood in one variable kicked off an expansion in the other, FDI inflows in China did not move ES forward. As a result of this, scientists were not involved in drawing GLO pairings that were safe for the environment. Even more damaging was the fact that ECI contaminated our national resources. It appears that China and its trading partners sold carbon-concentrated items that harmed China’s ecological management, as this idea suggests (ES). The findings of Musah et al., 2020b are in conflict with the disclosure above. It was also affected GTI and fossil fuel byproducts. GTI-produced human activity is clearly connected to the poisoning of the environment. The link between EC and the byproducts of fossil fuels was finally discovered. This result is a direct result of the expansion of dirty energy sources in this country. As a result, it would be a wise decision for China to switch to environmentally friendly sources of power. Regression results can be represented visually in the DARDL assessor, which includes this feature. This suggests that if energy usage increases, the natural quality of the country will deteriorate; however, if energy use is directed, the biological quality of the country would improve.
5. Conclusion and Policy Recommendations
The study examined the role of globalization, energy consumption, foreign direct investment, and urbanization impacts on environmental sustainability using a multivariate approach for the case of China using time series data from 1980 to 2019 collected from different Chinese databases. The study applied the principal components analysis, unit root and co-integration tests, Johansen co-integration test, and Dynamic ARDL recreations of the analysis results. The DARDL model is very suitable for the analysis of time data used for the research. The results shows that FDI has a negative impact on the country’s inherent character. Fossil fuel byproducts and FDI, GI, and ES have a strong correlation with each other, and cause a major part of CO2 emissions in the environmental pollution of China. Green technology innovations have a positive contribution to decreasing CO2 emissions as well as other factors of environmental pollution in China. Foreign direct investment also has a positive significant impact on the CO2 emissions and the study results are supported by Renzhi and Baek (2020) who stated that a money-related business will eventually emerge when other money-related businesses are drawn to the growing need for financial organizations to help in reducing environmental pollutions. As described by Park and Hong. (2013), economic growth was shown to be connected to the consumption of non-renewable energy sources that emitted carbon dioxide. Urbanization is also a big factor causing environmental pollution, especially soil and water pollution in big cities, and also CO2 emissions increases due to increases in transportation facilities. In addition, green technology innovations and the growth of clean businesses in the country should be supported and encouraged to help to improve environmental sustainability. As a result, GTI to ES is acceptable to the country. It is also important to remember that China’s financial stability is heavily dependent on asset-based ventures and new plan upgrades should help to reduce the country’s energy use. Furthermore, implementing energy conservation measures to reduce the country’s rising emissions levels is a good idea. In addition, creative activity in the country should not be limited to financial gains alone, but should also take into account environmental quality. To counteract some of the benefits of increased financial development on CO2 emissions, it is possible that this connection may need to be supported in the future.
5.1 Limitations and Future Recommendations
This is a perfect time to adopt mechanical advancements that are connected to a reduction in environmental pollution. The lack of simple admission to information is a significant obstacle in this request and the data for some of the variables did not go back far enough. Finally, the dataset’s missing data may be filled up with the help of the data addition and extrapolation technique. As a result, further research into the validity of this inquiry may be undertaken in the future.
Data Availability Statement
The original contributions presented in the study are included in the article/Supplementary Material, further inquiries can be directed to the corresponding authors.
Ethics Statement
Ethical review and approval was not required for the study on human participants in accordance with the local legislation and institutional requirements. Written informed consent for participation was not required for this study in accordance with the national legislation and the institutional requirements.
Author Contributions
YW: conceptualizing, writing, drafting-Original draft. YY: data collection and empirical estimations. YT: conceptualizing, review and editing.
Conflict of Interest
The authors declare that the research was conducted in the absence of any commercial or financial relationships that could be construed as a potential conflict of interest.
Publisher’s Note
All claims expressed in this article are solely those of the authors and do not necessarily represent those of their affiliated organizations, or those of the publisher, the editors, and the reviewers. Any product that may be evaluated in this article, or claim that may be made by its manufacturer, is not guaranteed or endorsed by the publisher.
Acknowledgments
Philosophy and Social Science Fund of Tianjin City, Grant/Award Number: TJYJ21-003.
Abbreviations
AMG, augmented mean group; ARDL, autoregressive distributed lag; CO2, carbon emissions metric tons per capita; ECI, economic complexity index; GLO, globalization index based on economic, social, and political dimensions of a country; ES, environmental sustainability; GTI, green technology innovation; FDI, foreign direct investments; DARDL, dynamic autoregressive distributed lag; PHH, pollution haven hypothesis; RE, renewable energy per capita consumption; VECM, vector error correction model.
References
Adebayo, T. S., and Kirikkaleli, D. (2021). Impact of Renewable Energy Consumption, Globalization, and Technological Innovation on Environmental Degradation in Japan: Application of Wavelet Tools. Environ. Dev. Sustain. 4 (2), 1–26. doi:10.1007/s10668-021-01322-2
Adewuyi, A. O., and Awodumi, O. B. (2017). Renewable and Non-renewable Energy Growth Emissions Linkages: Review of Emerging Trends with Policy Implications. Renew. Sustain. Energ. Rev. 69, 275–291. doi:10.1016/j.rser.2016.11.178
Ahmad, M., Khan, Z., and Rahman, Z. (2018). Does Financial Development Asymmetrically Affect CO2 Emissions in China? an Application of the Nonlinear Autoregressive Distributed Lag (NARDL) Model. Carbon Manag. 9 (6), 631–644. doi:10.1080/17583004.2018.1529998
Ahmed, Z., Wang, Z., and Ali, S. (2019). Investigating the Non-linear Relationship between Urbanization and CO2 Emissions: an Empirical Analysis. Air Qual. Atmosphere Health 12 (8), 945–953. doi:10.1007/s11869-019-00711-x
Awodumi, O. B., and Adewuyi, A. O. (2020). The Role of Non-renewable Energy Consumption in Economic Growth and Carbon Emission: Evidence from Oil Producing Economies in Africa. Energ. Strategy Rev. 27, 100434. doi:10.1016/j.esr.2019.100434
Baz, K., Xu, D., Ali, H., Ali, I., Khan, I., Khan, M. M., et al. (2020). Asymmetric Impact of Energy Consumption and Economic Growth on Ecological Footprint: Using Asymmetric and Nonlinear Approach. Sci. Total Environ. 718, 137364. doi:10.1016/j.scitotenv.2020.137364
Chen, Y., Wang, Z., and Zhong, Z. (2019). CO2 Emissions, Economic Growth, Renewable and Non-renewable Energy Production and Foreign Trade in China. Renew. Energ. 131, 208–216. doi:10.1016/j.renene.2018.07.047
Cole, M. A., and Neumayer, E. (2004). Examining the Impact of Demographic Factors on Air Pollution. Popul. Environ. 26 (1), 5–21. doi:10.1023/b:poen.0000039950.85422.eb
Danish, S., Shah, B., and Muhammad Awais, L. (2018). The Nexus between Energy Consumption and Financial Development: Estimating the Role of Globalization in Next-11 Countries. Environ. Sci. Pollut. Res. Int. 25 (19), 18651–18661. doi:10.1007/s11356-018-2069-0
Dou, J., and Han, X. (2019). How Does the Industry Mobility Affect Pollution Industry Transfer in China: Empirical Test on Pollution haven Hypothesis and porter Hypothesis. J. Clean. Prod. 217, 105–115. doi:10.1016/j.jclepro.2019.01.147
Dumitrescu, E. I., and Hurlin, C. (2012). Testing for granger Non-causality in Heterogeneous Panels. Econ. Model. 29 (4), 1450–1460. doi:10.1016/j.econmod.2012.02.014
Elahi, E., Khalid, Z., Tauni, M., Zhang, H., and Xing, L. (2021). Extreme Weather Events Risk to Crop-Production and the Adaptation of Innovative Management Strategies to Mitigate the Risk: A Retrospective Survey of Rural Punjab. Pakistan. Technovation. doi:10.1016/j.technovation.2021.102255
Elahi, E., Khalid, Z., and Zhang, X. (2022a). Understanding Farmers’ Intention and Willingness to Install Renewable Energy Technology: A Solution to Reduce the Environmental Emissions of Agriculture. Appl. Energ. 309, 1. March. doi:10.1016/j.apenergy.2021.118459
Elahi, E., Zhang, X., Khalid, Z., and Xu, H. (2022b). Application of an Artificial Neural Network to Optimise Energy Inputs: An Energy-And Cost-Saving Strategy for Commercial Poultry Farms. Energy 123169. doi:10.1016/j.energy.2022.123169
Erdogan, S., Yıldırım, S., and Yıldırımal, D. C¸et. (2020). The Effects of Innovation on Sectoral Carbon Emissions: Evidence from G20 Countries. J. Environ. Manage. 267, 110637.
Festus, V. B., Emir, F., and Samuel, A. (2019). Another Look at the Relationship between Energy Consumption, Carbon Dioxide Emissions, and Economic Growth in South Africa. Sci. Total Environ. 655, 759–765. doi:10.1016/j.scitotenv.2018.11.271
Festus, V. B., Gyamfi, B., and Agboola, M. (2021a). Beyond the Environmental Kuznets Curve in E7 Economies: Accounting for the Combined Impacts of Institutional Quality and Renewables. J. Clean. Prod. 314, 127924. doi:10.1016/j.jclepro.2021.127924
Festus, V. B., Gyamfi, B., Ruth, O., and Edmund, N. (2021b). Tourism-induced Emission in Sub-saharan Africa: A Panel Study for Oil-Producing and Non-oil-producing Countries. Environ. Sci. Pollut. Res. doi:10.1007/s11356-021-18262-z
Ibrahiem, D. M. (2020). Do technological Innovations and Financial Development Improve Environmental Quality in Egypt? Environ. Sci. Pollut. Res. 27, 10869–10881. doi:10.1007/s11356-019-07585-7
Jun, W., Zakaria, M., and Shahzad, S. J. H. (2018). Effect of FDI on Pollution in China: New Insights Based on Wavelet Approach. Sustainability 10 (11), 3859. doi:10.3390/su10113859
Karasoy, A., and Akc¸ay, S. (2019). Effects of Renewable Energy Consumption and Trade on Environmental Pollution: The Turkish Case. Manag. Environ. Qual. Int. J. 30 (2), 437–455. doi:10.1108/meq-04-2018-0081
Karasoy, A. (2019). Drivers of Carbon Emissions in Turkey: Considering Asymmetric Impacts. Environ. Sci. Pollut. Res. Int. 26 (9), 9219–9231. doi:10.1007/s11356-019-04354-4
Mahmood, H., Alkhateeb, T., Al-Qahtani, M., et al. (2020). Energy Consumption, Economic Growth and Pollution in Saudi Arabia. Manag. Sci. Lett. 10 (5), 979–984. doi:10.5267/j.msl.2019.11.013
Mardani, A., Streimikiene, D., and Nilashi, M. (2018). Energy Consumption, Economic Growth, and CO2 Emissions in G20 Countries: Application of Adaptive Neuro-Fuzzy Inference System. Energies 11 (10). doi:10.3390/en11102771
Mert, M., B€olu¨, k. G., and C¸ a_glar, A. E. (2019). Interrelationships Among Foreign Direct Investments, Renewable Energy, and CO2 Emissions for Different European Country Groups: A Panel ARDL Approach. Environ. Sci. Pollut. Res. Int. 26 (21), 21495–21510. doi:10.1007/s11356-019-05415-4
Moghadam, H., and Dehbashi, V. (2018). The impact of financial development and trade on environmental quality in IranEmpirical Economics. Springer 54 (4), 1777–1799. doi:10.1007/s00181-017-1266-x
Musah, M., Kong, Y., and Mensah, I. A. (2020a). The Link between Carbon Emissions, Renewable Energy Consumption, and Economic Growth: A Heterogeneous Panel Evidence from West Africa. Environ. Sci. Pollut. Res. Int. 27 (23), 28867–28889. doi:10.1007/s11356-020-08488-8
Musah, M., Kong, Y., and Xuan, V. V. (2020b). Predictors of Carbon Emissions: An Empirical Evidence from NAFTA Countries. Environ. Sci. Pollut. Res, 1 –19. doi:10.1007/s11356-020-11197-x
Nkengfack, H., and Kaffo, F. H. (2019). Energy Consumption, Economic Growth and Carbon Emissions: Evidence from the Top Three Emitters in Africa. Mod. Economy 10 (01), 52–71. doi:10.4236/me.2019.101004
O’Ryan, R., Nasirov, S., and Alvarez-Espinosa, A. (2020). Renewable Energy Expansion in the Chilean Power Market: A Dynamic General Equilibrium Modeling Approach to Determine CO2 Emission Baselines. J. Clean. Prod. 247, 119645. doi:10.1016/j.jclepro.2019.119645
Ozturk, I., Al-Mulali, U., and Saboori, B. (2016). Investigating the Environmental Kuznets Curve Hypothesis: the Role of Tourism and Ecological Footprint. Environ. Sci. Pollut. Res. 23 (2), 1916–1928. doi:10.1007/s11356-015-5447-x
Park, J., and Hong, T. (2013). Analysis of South Korea’s Economic Growth, Carbon Dioxide Emission, and Energy Consumption Using the Markov Switching Model. Renew. Sustain. Energ. Rev. 18, 543–551. doi:10.1016/j.rser.2012.11.003
Pata, U. K. (2018). Renewable Energy Consumption, Urbanization, Financial Development, Income and CO2 Emissions in Turkey: Testing EKC Hypothesis with Structural Breaks. J. Clean. Prod. 187, 770–779. doi:10.1016/j.jclepro.2018.03.236
Pesaran, M. H. (2006). Estimation and Inference in Large Heterogenous Panels with Multifactor Error Structure. Econometrica 74 (4), 967–1012. doi:10.1111/j.1468-0262.2006.00692.x
Samour, A., Isiksal, A. Z., and Resatoglu, N. G. (2019). Testing the Impact of Banking Sector Development on Turkey’s CO2 Emissions. Appl. Ecol. Environ. Res. 17 (3), 6497–6513. doi:10.15666/aeer/1703_64976513
Sarkodie, S. A., Adams, S., Owusu, P. A., Leirvik, T., and Ozturk, I. (2020). Mitigating Degradation and Emissions in China: the Role of Environmental Sustainability, Human Capital and Renewable Energy. Sci. Total Environ. 719 (137530), 2–14. doi:10.1016/j.scitotenv.2020.137530
Seyi, S. A., Alola, A. A., and Etokakpan, M. (2020). Does Electricity Consumption and Globalization Increase Pollutant Emissions? Implications for Environmental Sustainability Target for China. Environ. Sci. Pollut. Res. (27), 25450–25460. doi:10.1007/s11356-020-08784-3
Shahbaz, M., Hye, Q. M. A., Tiwari, A. K., et al. (2013). Economic Growth, Energy Consumption, Financial Development, International Trade and CO2 Emissions in Indonesia. Renew. Sustain. Energ. Rev. 25, 109–121. doi:10.1016/j.rser.2013.04.009
Sun, Y., Duru, O. A., Razzaq, A., and Dinca, M. S. (2021). The Asymmetric Effect Ecoinnovation and Tourism towards Carbon Neutrality Target in Turkey. J. Environ. Manag. 299, 113653. doi:10.1016/j.jenvman.2021.113653
Waheed, R., Sarwar, S., and Chen, W. (2019). The Survey of Economic Growth, Energy Consumption and Carbon Emission. Energy Rep. 5, 1103–1115. doi:10.1016/j.egyr.2019.07.006
Xu, B., Zhong, R., and Qiao, H. (2020). The Impact of Biofuel Consumption on CO2 Emissions: A Panel Data Analysis for Seven Selected G20 Countries. Energ. Environ. 31 (8), 15426. doi:10.1177/0958305X20915426
Keywords: CO2 emissions, renewable energy, international trade, dynamic model, longrun estimators
Citation: Wang Y, You Y and Teng Y (2022) Optimized Variables for Environmental Dynamics: China’s Renewable Energy Policy. Front. Environ. Sci. 10:862714. doi: 10.3389/fenvs.2022.862714
Received: 26 January 2022; Accepted: 08 March 2022;
Published: 14 April 2022.
Edited by:
Ehsan Elahi, Shandong University of Technology, ChinaReviewed by:
Festus Victor Bekun, Gelişim Üniversitesi, TurkeySalih Katircioglu, Eastern Mediterranean University, Turkey
Andrew Adewale Alola, Istanbul University, Turkey
Copyright © 2022 Wang, You and Teng. This is an open-access article distributed under the terms of the Creative Commons Attribution License (CC BY). The use, distribution or reproduction in other forums is permitted, provided the original author(s) and the copyright owner(s) are credited and that the original publication in this journal is cited, in accordance with accepted academic practice. No use, distribution or reproduction is permitted which does not comply with these terms.
*Correspondence: Yujing Wang, wyj714ivy@126.com; Yanqun You, youyanqun112233@163.com, Yu Teng, yu.teng@myport.ac.uk