Mechanisms Responsible for Sand Hazards Along Desert Highways and Their Control: A Case Study of the Wuhai–Maqin Highway in the Tengger Desert, Northwest China
 Zhishan An
 Kecun Zhang1,2*
 - 1Key Laboratory of Desert and Desertification, Chinese Academy of Sciences, Lanzhou, China
- 2Dunhuang Gobi and Desert Research Station, Northwest Institute of Eco-Environment and Resources, Chinese Academy of Sciences, Lanzhou, China
- 3University of Chinese Academy of Sciences, Beijing, China
Highways in deserts usually suffer from severe sand hazards under the effect of wind-blown sand. In this article, the author has revealed the disaster-causing mechanisms of the Wuhai–Maqin Highway in the Tengger Desert, Northwest China. A sand control system with six belts was proposed and established for the highway, and its sheltering effect was examined through on-site monitoring. The results showed that from 2018 to 2019, the sand drift potential was dominated by northwest, northeast, and south winds, which indicated a low-energy windy environment, with a resulting southeast direction of sand transport. The particle size of surface sediments was mainly distributed between 1.26Φ and 2.5Φ, indicating fine sand and medium sand. The sand flux was mainly concentrated below 30 cm, accounting for 89.46% of the total sand transport. Airflow around the control system was significantly attenuated, with a maximum wind speed decreasing rate of 95.88%. The windproof efficiency of the control system against the near-surface wind-blown sand was more than 90%. This study provides a significant reference for the control of highway sand hazards in other deserts.
1 Introduction
Highways in deserts suffer from severe sand hazards under mutual effects between wind-blown sand and the subgrade (Zhang et al., 2010a). In the 20th century, with the development of inland deserts, sand disaster control projects have emerged. However, during that time, the sand control methods were mainly single control measures, such as vegetation planting (Qu et al., 2007). After the 1950s, highway sand disaster prevention and control projects gradually changed from a single sand prevention measure to a comprehensive protection system composed of physical and biological measures (Zhang et al., 2019). However, limited by the construction technology, most constructions included mainly low-grade roads, and very few highways were involved (Zhang et al., 2010b; Dong et al., 2014). To date, great progress has been made in the construction of low-grade desert roads and the control of sand disasters, including understanding the formation mechanisms and dynamic processes of sand disasters (Qu et al., 2007; Wang et al., 2018). The formation of sand hazards on highways is mainly composed of two types. One is the deposition of wind-blown sand. The other is the dune forward movement. However, it should be noted that sand hazards on roads are the result of the interaction between regional wind and materials. Among them, the wind is the driving force, sand is the material basis, and the road is the disaster target. Therefore, the degree and distribution of sand disasters are different if the wind conditions, material compositions, and subgrades are different. At present, for the control of sand hazards in harsh environments, engineering sand control measures are widely used. Among them, the grass checkerboard can reduce wind speed and force wind-blown sand to deposit.
In China, the Wuhai–Maqin Highway passes through four provinces, namely, Inner Mongolia, Ningxia, Gansu, and Qinghai. The completion of the Wuhai–Maqin Highway is of great significance for alleviating transportation pressure in Ningxia. However, the highway passes through the Tengger Desert, where mobile sand dunes are widespread, which is a great challenge to construction, maintenance, and safe operation. The length of the Tengger Desert section of the Wuhai–Maqin Highway is approximately 21 km. It starts from the Yingshui Bridge in the north and connects with the Dingwu Highway (G2012) in Hongwei (Figure 1).
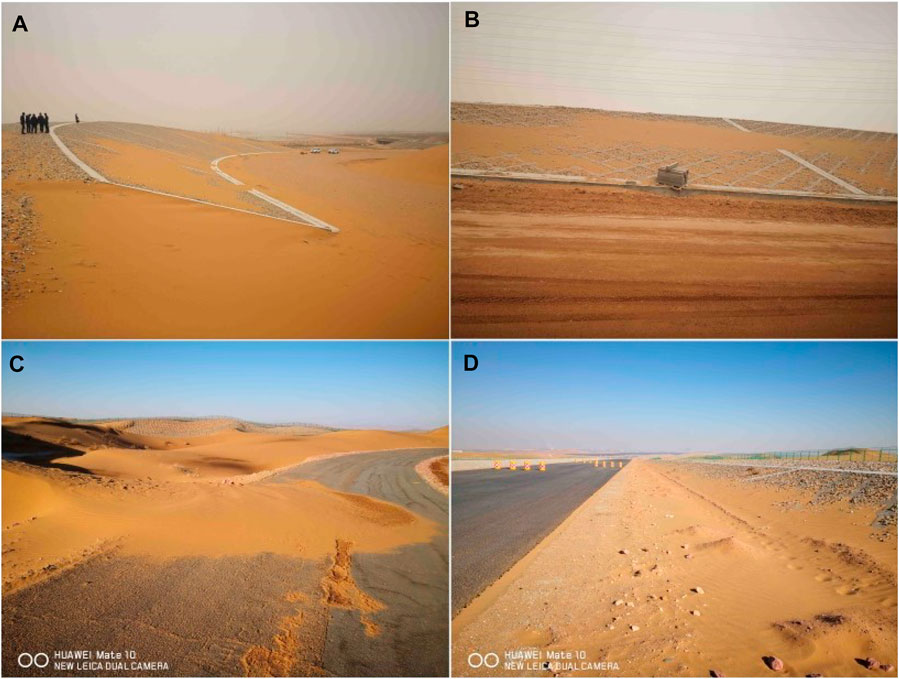
FIGURE 1. The sand hazards on the Tengger Desert section of the Wuhai‐Maqin Highway. (A) and (B) highway roadside; (C) and (D) highway subgrade.
The Tengger Desert has a total area of 3.67 × 10⁴ km2 and is the fourth largest desert in China (Dong et al., 2014). The types of sand dunes include reticulate dunes, crescent dunes, and crescent dune chains (Fryberger and Dean, 1979; Lancaster, 1985). The region is affected by the Mongolian high pressure all year, which creates drought, little rain, and strong wind-blown sand activity. The average annual rainfall is 176.5 mm, while the average annual evaporation is 1,500–2000 mm (Zhang et al., 2010b; Dong et al., 2014). The construction, maintenance, and upkeep of the Wuhai–Maqin Highway require high and strict standards because of the complex and changeable aeolian landforms.
Existing construction and maintenance experience include the Taklimakan Desert Highway, Jingxin Highway, and other roads (Shen et al., 2004; Liu et al., 2007; Ma et al., 2010; Liu et al., 2011). However, these roads have a low-grade road design or a slightly weak sand environment. Thus, the existing protective measures cannot be directly applied to the Wuhai–Maqin Highway. Since the construction of the Baolan Railway on the southeastern edge of the Tengger Desert, researchers have conducted detailed analyses of the aeolian environment and dune types and movement (Motoaki et al., 2005; Qu et al., 2007; Zhang et al., 2007; Zhang et al., 2010b; Huang, 2017), which have provided information and a theoretical basis for the construction and normal operation of the Shapotou section of the Baolan Railway (Qu et al., 2007; Ping et al., 2014; Neuman and Bédard, 2017). The protection benefits, mechanisms, and surrounding ecological environmental benefits of railway protection measures have gradually become clear with the construction and operation of the Baolan Railway control system, which has become a benchmark for desert control systems in the world (Qu et al., 2007; Wang et al., 2018). The effectiveness of the control system on the Shapotou section of the Baolan Railway provides a relevant reference that can be used in the construction and maintenance of the Wuhai–Maqin Highway. However, the wind energy environment, sediments, and depositional environment through which the Wuhai–Maqin Highway passes are different from those due to the regional wind environment, topography, and other factors. Therefore, the wind energy environment, sediment characteristics, and sand movement along the Wuhai–Maqin Highway should be studied. All these factors contribute to sand hazards. Therefore, the results can provide a reference and guidance for the construction of the Wuhai–Maqin Highway and the design of the sand control system.
2 Materials and Methods
Two automatic meteorological stations (HOBO U30) were used to measure the wind speed, direction, temperature, and air humidity. The installation position of the No. 1 automatic meteorological station was located at 104°56′49.74″°E, 37°32′50.37″°N, and the altitude was 1,370 m. The installation position of the No. 2 automatic meteorological station was located at 104°52′28.85″°E, 37°30′4.92″°N, and the altitude was 1,510 m. The distance between the two instruments was approximately 8 km (Figure 2). Both instruments were fixed on the top of mobile dunes, which were the highest points in the local area. The wind speed and direction sensors were installed at a height of 2.0 m above the ground surface. The logging time interval was 5 min.
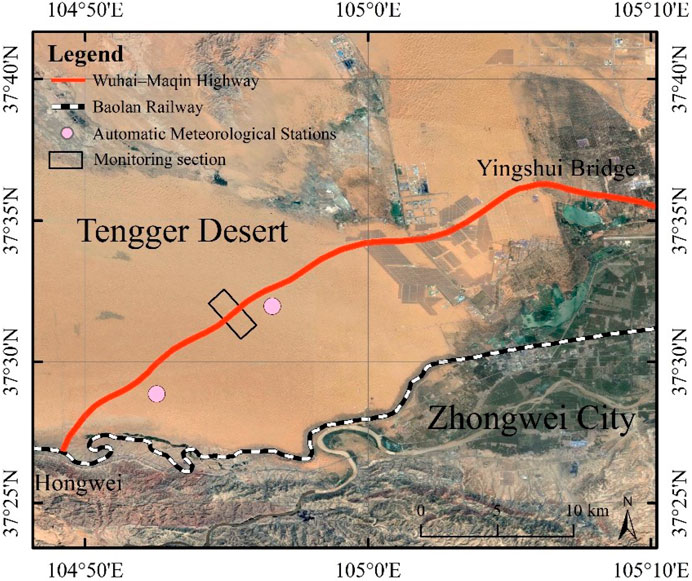
FIGURE 2. Location of observation instruments on the Tengger Desert section of the Wuhai–Maqin Highway.
The sand drift potential (DP) is an important parameter that reflects the potential sand transport capacity of a region (Xie et al., 2013; Xie et al., 2015; An et al., 2018), and it is in a vector unit (VU). According to the calculation of the DP equation proposed by Fryberger and Dean (1979), the DP in different periods can be obtained. The specific calculation formula is
where DP is the sand drift potential, and the unit is VU. V is the wind speed, and the unit is VU. Vt is the threshold of sand moving at 5 m s−1, t is the duration of the sand-driving wind, and the unit is min.
Sand flux observations used a sand trap developed by the Chinese Academy of Sciences Desert and Desertification, which had a height of 60 cm, a total of 30 layers, and a single injection diameter of 2 cm × 2 cm. The windproof efficiency of the sand control system was measured by using a mobile wind speed anemometer, whose instrument model was HOBO U21, and the data collection frequency was 5 min. The height was 1 m above the ground (Figure 3).
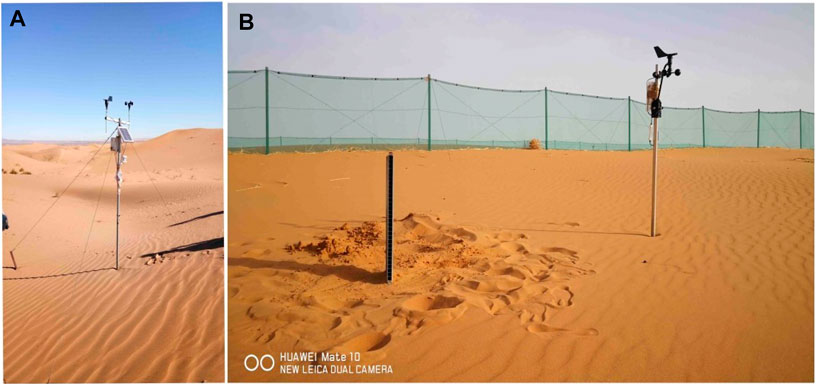
FIGURE 3. Observation instruments on the Tengger Desert section of the Wuhai–Maqin Highway: (A) HOBO-U30 automatic meteorological station, and (B) sand trap and HOBO-U21 automatic meteorological station.
The flow field of highway subgrade was carried out in the wind tunnel of the Key Laboratory of Desert and Desertification of the Chinese Academy of Sciences. The wind tunnel has a total length of 37.78 m, including the experimental section, which is 16.23 m long, and the cross-sectional area of the experimental section is 0.6 m × 1.0 m. The thickness of the boundary layer in the test section is more than 120 mm. The experimental wind speeds were 8, 10, 12, and 16 m s−1. The wind-speed profile was measured using pitot tubes. The measured heights were 0.3, 0.6, 1.2, 2.4, 4, 8, 12, 16, 20, and 25 cm (An et al., 2020).
3 Results
3.1 Formation Mechanisms of Sand Hazards
3.1.1 Aeolian Environment
3.1.1.1 Sand-Driving Wind
As shown in Figure 4, both the average wind speed (>0 m s−1) and sand-moving wind (>5 m s−1) at the No. 2 measurement site were greater than those at the No. 1 measurement site during 2018 and 2019. The average wind speed and sand-driving wind at No. 1 were 2.64 m s−1 and 5.92 m s−1, respectively, in 2018. They were 2.58 m s−1 and 6.11 m s−1 in 2019, respectively. The average wind speed and sand-driving wind at No. 2 in 2018 were 3.24 m s−1 and 6.56 m s−1 and 6.59 m s−1 and 3.31 m s−1 in 2019, respectively. The distribution of monthly average wind speed during the year showed that the lowest monthly average wind speed at No. 1 was in January 2019, which was only 1.74 m s−1. The monthly average wind speed in May 2018 was the highest, which was 3.61 m s−1. The lowest monthly average wind speed at No. 2 was 0.55 m s−1 in January 2018. The highest monthly average wind speed in May 2018 was 5.47 m s−1. The law of the monthly average wind speed during 2018–2019 showed that the monthly wind speed gradually increased from January to May and then gradually decreased. Sand-driving wind played a vital role in the movement of sand particles. Compared with the trend of the monthly average wind speed, the monthly sand-moving wind at No. 1 had limited change during the year. However, the wind speed and sand-moving wind speed at No. 2 were higher than those at No. 1, while the monthly average wind speed and monthly average sand-moving wind speed had similar laws during the year, with both increasing first and then decreasing.

FIGURE 4. Monthly wind speed and sand-moving wind at sites No. 1 and No. 2 in 2018 and 2019.
Table 1 shows that the frequency in a range of 0–5 m s−1 was 5.27×10⁵, which accounted for 89.73% of the annual wind speed, and only 10.27% was distributed in other winds, which was 0.6×10⁵. As the wind speed increased, the ratio of wind speeds decreased gradually. Further analysis showed that the wind speed of 0–5 m s−1 accounted for the highest proportion in June. A frequency of more than 12 m s−1 only appeared in April and August, with frequencies of 13 and 10, respectively.
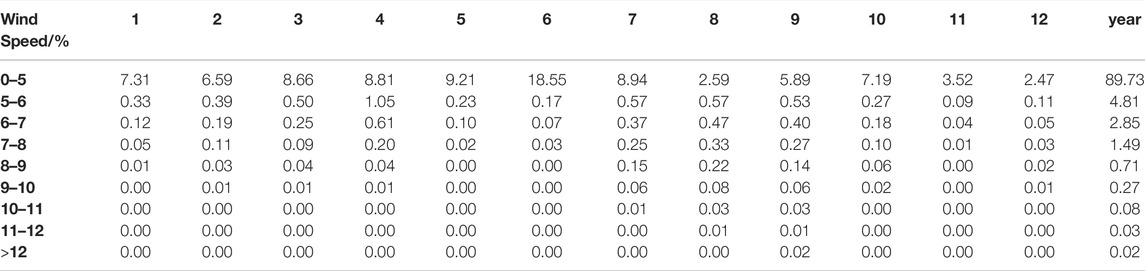
TABLE 1. Frequency of different wind speeds.
3.1.1.2 Sand Drift Potential
3.1.1.2.1 Seasonal Changes in Sand Drift Potential
The sand drift potential reflected the ability of sand transport by wind in a certain period. It is an important indicator for measuring the intensity of regional wind-blown activities (Fryberger and Dean, 1979; Xie et al., 2013; Xie et al., 2015). As shown in Figure 5, the DP in spring at No. 1 in 2018 was 34.71 VU. The resultant drift potential (RDP) was 6.81 VU. The index of the directional wind variability was 0.2. The resultant sand direction (RDD) was 118.48°. The largest DP was in the northwest, east, and south directions, which were 7.04, 5.47, and 3.81 VU, respectively. The DP in summer was 23.31 VU. The RDD was 274.27°. The index of the directional wind variability was 0.42. In autumn, the DP in the east and northwest directions was greater than that in the other directions. In winter, the DP in the northwest direction was dominant, which was 6.07 VU. The RDD was southeast. The index of the directional wind variability was 0.37. Compared with 2018, the rest of the other seasons increased, except for spring at No. 1 in 2019. The DP in spring 2019 was 20.29 VU, and the DP in the south direction was reduced. The DP in summer was 31.37 VU. The DP in autumn increased to 42.56 VU, and the direction was mainly northwest and south. The DP in winter was 7.45 VU, and the RDD was northwest.

FIGURE 5. Seasonal sand drift potential at No. 1 and No. 2 in 2018.
3.1.1.2.2 Annual Changes in Sand Drift Potential
As shown in Figure 6, the DP at No. 1 in 2018 was 72.66 VU. The RDP was 5.88 VU. The RDD was 171.47°. The index of the directional wind variability was 0.08. The DP at No. 2 in 2018 was 32.32 VU, which indicates that the regional wind-blown sand activity was weaker than that at No. 1. The RDP was 6.03 VU. The RDD was 102.43°. The index of the directional wind variability was 0.19. The DP at No. 1 in 2019 was 101.67 VU. The RDP was 36.95 VU. The RDD was 128.17°. The index of the directional wind variability was 0.36. The DP at No. 2 in 2019 was 135.03 VU. The DP was 82.21 VU, the RDD was 160.54°, and the index of the directional wind variability was 0.61. Further analysis showed that the DP at No. 1 in 2018 and 2019 was concentrated in the northwest, east, and south directions, which were 12.07, 18.02, and 5.12 VU, respectively, and the DPs in 2019 were 26.09, 8.52, and 7.45 VU, respectively. The DP at No. 2 in 2018 was concentrated in the northwest, east, and south directions, which were 14.17, 5.2, and 6.14 VU, respectively. The DP in 2019 was concentrated in the north, which was 65.85 VU.
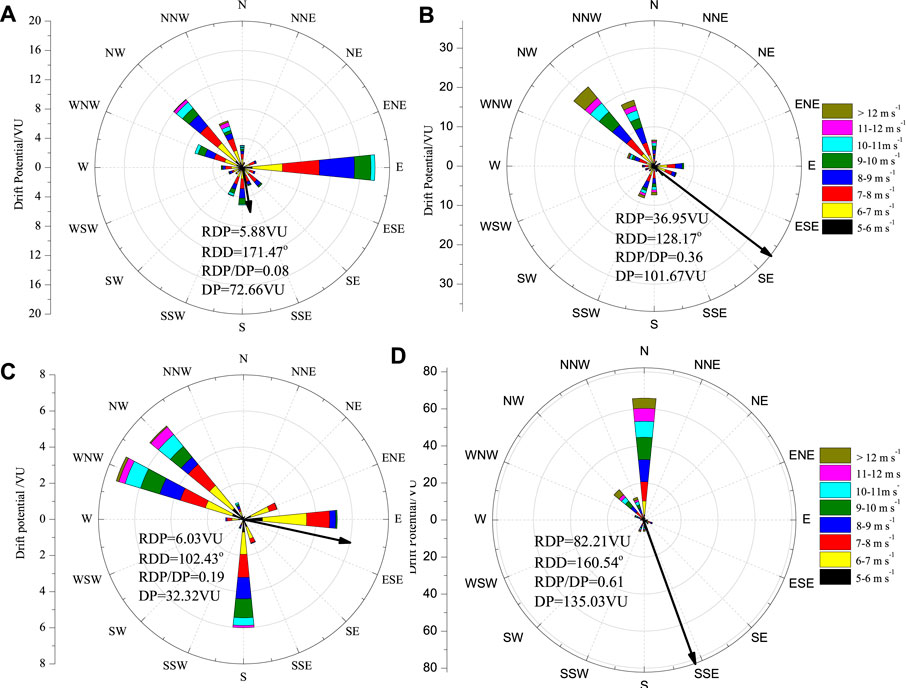
FIGURE 6. Sand drift potential at No. 1 and No. 2 in 2018 and 2019. (A) No. 1 in 2018; (B) No. 1 in 2019; (C) No. 2 in 2018; and (D) No. 2 in 2019.
3.1.2 Wind-Blown Sand Characteristics
3.1.2.1 Sediment Grain Size
Figure 7 shows that the particle size of sediment at a depth of 5 cm at No. 1 was mainly distributed between 1.26Φ and 1.76Φ, accounting for 65.03% of the total weight. The particle size of sediment at a depth of 10 cm was mainly distributed between 1.5Φ and 2.5Φ, accounting for 70.68% of the total weight. The sediment particle size at a depth of 20 cm was mainly distributed between 1.5Φ and 2.76Φ, accounting for 84.69% of the total weight. The sediment particle size at a depth of 50 cm was mainly distributed between 1.76Φ and 2.5Φ, accounting for 74.03% of the total weight. The particle size of the sediment at a depth of 100 cm was mainly distributed between 1.5Φ and 2.5Φ, accounting for 78.46% of the total weight. The distribution curves of sediment percentages at 5, 10, 20, 50, and 100 cm were all unimodal, but the peak shapes were different. The peak shape of the sediment percentage distribution curve at 5 and 50 cm was narrow, but the others were slightly wider. The cumulative percentage showed that the cumulative percentage of sediments at depths of 5 and 50 cm had the largest growth rate, indicating that the soil particle size distribution was the most concentrated. In summary, all sediments were mainly distributed between 1.26Φ and 2.5Φ, which included fine sand and medium sand (Bagnold, 1942; Blott and Pye, 2001).
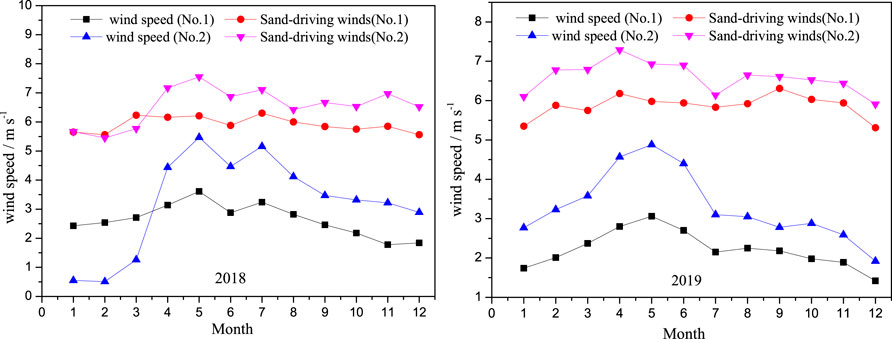
FIGURE 7. Particle size of sandy materials at different depths in the experimental observation fields.
3.1.2.2 Wind-Blown Sand Structure
The wind-blown sand structure is an important parameter for revealing regional sand activities and is also one of the important reference signs for setting sand control systems (Bagnold, 1942; Thomas, 1988; Tan et al., 2014). The wind-blown sand structure is closely related to topography, particle-size composition, humidity, and so on, but the fluctuation and speed of airflow have a greater impact on it. According to the field observations, the wind-blown sand structure indicated that the sand flux was concentrated below 30 cm, accounting for 89.46% of the total sand transport rate. The sediment transport within a height of 0–20 cm on the surface accounted for 63.81% of the total sediment transport rate. The vertical distribution of the sand flux with height followed an exponential function, as presented in Figure 8.
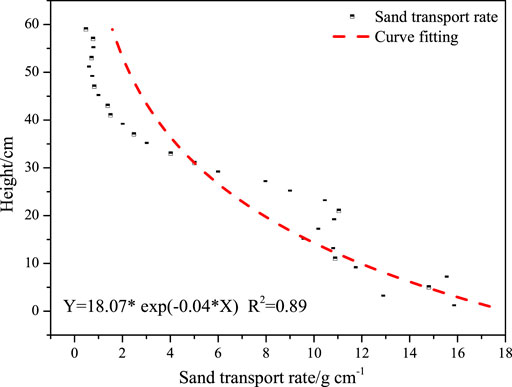
FIGURE 8. Relation between the sand transport rate and height at the observation site.
3.1.2.3 The Flow Field of Highway Subgrades
As shown in Figure 9, there were obvious differences in the near-surface flow field around the subgrade at wind speeds of 8, 10, 12, and 16 m s−1. The first difference was that the contours on the windward and leeward sides of the subgrade gradually became denser, indicating that the wind speed increased. The second difference was that the length of the same wind speed contour decreased with increasing wind speed. For example the length of the 5 m s−1 contour at 8 m s−1 wind speed was approximately 17.1 H (H represents the height of the subgrade). When the wind speed increased to 10 m s−1, the length of the 5 m s−1 contour was approximately 8.2 H. The lengths of the 5 m s−1 contour at 12 m s−1 and 16 m s−1 wind speeds were approximately 6.8 and 5.6 H, respectively.
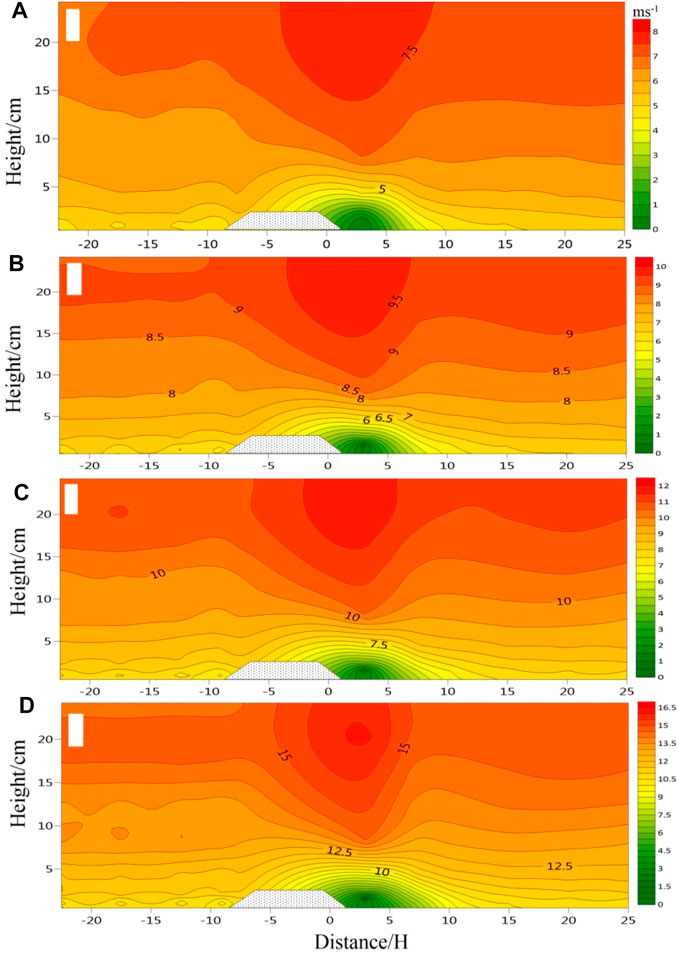
FIGURE 9. Flow field around the subgrade at 6, 8, 12, and 16 m s−1 wind speeds (A) 6 m s−1; (B) 8 m s−1; (C) 12 m s−1; and (D) 16 m s−1.
3.2 Suitable Controlling System Pattern and Sheltering Efficiency
3.2.1 Suitable Sand Control System
Based on the aforementioned research results, there were three reasons for the occurrence of sand hazards on the Wuhai–Maqin Highway. First, the regional sand environment was very poor. Windy weather was common, which provided dynamic conditions for sand hazards. Second, medium sand and fine sand accounted for the highest proportion of sand, which easily formed wind-sand flows under the action of wind. Third, the height of the subgrade was mostly higher than 30 cm, but the migration height of the wind-sand flow was mostly lower than 30 cm. Therefore, most of the sand could not pass the highway and resulted in deposition.
Due to the regional wind conditions and environment being similar to those of the Baolan Railway, the design of the control system referred to the control system of the Baolan Railway. However, the materials of the control system of the Baolan Railway included plants, such as grass. The anti-aging properties were weak, and the service life was relatively short; therefore, the control system of the Wuhai–Maqin Highway adopted nylon with good anti-aging properties (Qu et al., 2007; Zhang et al., 2007; Zhang et al., 2010b; Xie et al., 2013; Xie et al., 2015; An et al., 2018). The latest high checkerboard sand barriers with better protection benefits were introduced into the control system (Pang et al., 2014).
The windward side control system had a width of 220 m and included high vertical sand barriers, high checkerboard sand barriers, windbreaks and sand fixation belts, semi-buried checkerboard sand barriers, green shrub belts, and gravel fire belts. Their widths were 50, 25, 10, 100, 15, and 20 m in sequence. The width of the control system on the leeward side was 132 m, and the function of each belt was the same as that on the windward side, but considering that the southeast wind was less, the width was smaller than the former, which were 25, 12, 10, 50, 15, and 20 m, respectively, as shown in Figure 10. The high vertical sand barriers were 1.8 m high, with two groups on the windward side and one group on the leeward side. The high checkerboard sand barriers were 1.5 m high and 3 m × 3 m in size, with four rows on the windward side and two rows on the leeward side. The windbreak and sand fixation belt was composed of vegetation suitable for the area. The semi-buried checkerboard sand barrier had a size of 1 m × 1 m. The green shrub belt was composed of Hedysarum scoparium and Sabina vulgaris. The gravel fire belt was made of stone.
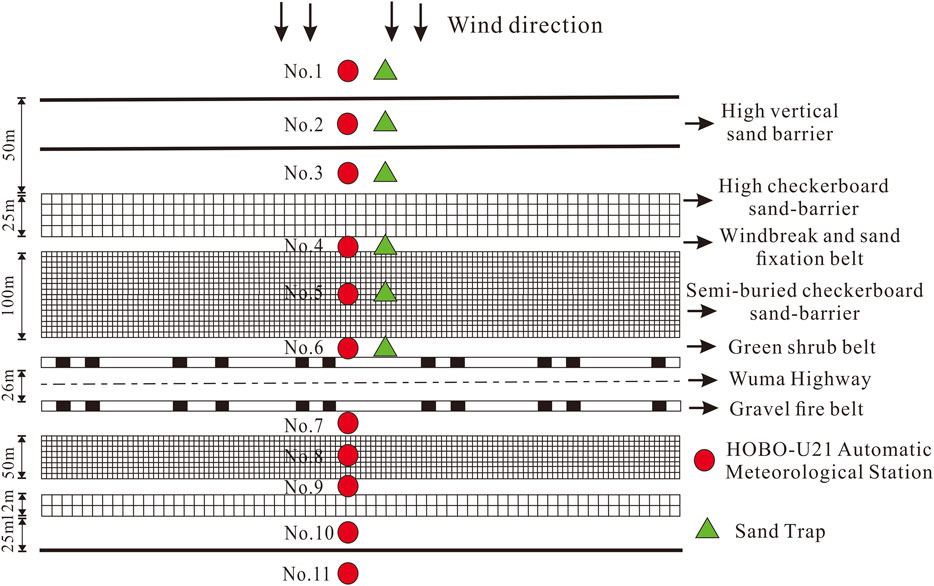
FIGURE 10. Sand control system on the Tengger Desert section of the Wuhai–Maqin Highway and the site of the sand trap and HOBO-U21 automatic meteorological station.
3.2.2 Sheltering Efficiency of the Sand Control System
3.2.2.1 Spatial Variation in Gradient Wind Speed
To verify the benefit of the protection system, we set up sand traps and automatic meteorological stations along the main sand-driving wind direction and monitored the near-surface flow field and sand transport over the cross-sectional sand control system. The in situ measurement layout of the instruments is shown in Figure 10. Station 1 was located outside the high vertical sand fence on the western side of the highway, and Stations 2 to 11 were located in the sand control system.
Table 2 shows that the wind speed from No. 1 to 11 under different wind speed levels generally had a decreasing trend. However, due to the influence of the surrounding terrain, the wind speed occasionally increased in some areas. For example, the wind speed at No. 5 had the largest attenuation of 72.17% at 6 m s−1, but the wind speed at No. 2 was 22%. When the wind speed was 7 m s−1, No. 9 had the largest reduction percentage, which was 80.86%, and No. 7 had the smallest, which was 14.14%. At 8 m s−1 wind speed, No. 6 had the largest reduction percentage, which was 95.88%, and No. 11 had the smallest, which was 16.5%. When the wind speed was 9 m s−1, the reduction percentage of wind speed was between 22.11 and 48%. At 10 m s−1, the reduction percentage of wind speed was between 16.5 and 39.9%. The reduction percentages of wind speed were 42.65, 37.96, 35.72, 32.82, and 28.85% when the wind speeds were 6, 7, 8, 9, and 10 m s−1, respectively. In other words, with the increase in wind speed, the attenuation of wind speed had a decreasing trend.
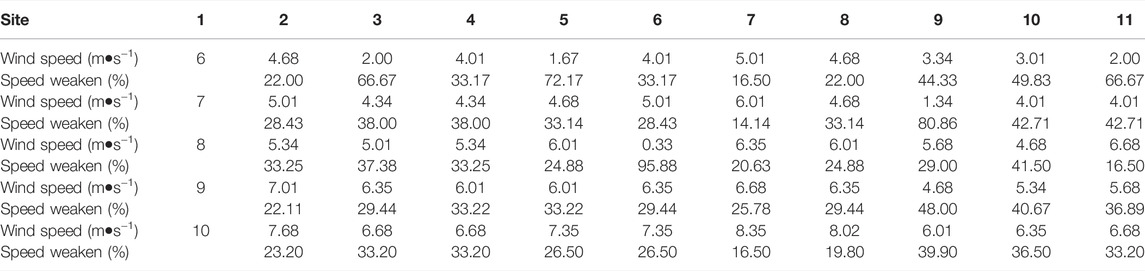
TABLE 2. Windproof effect of the sand control system.
3.2.2.2 Sand Inhibition Efficiency
Figure 11 shows the changes in the amount of sediment transported on both sides of the Wuhai–Maqin Highway. As a result of the protection measures, the amount of sand transported at No. 2–4 was significantly less than that at No. 1. No. 1 was located outside of the high vertical sand fence on the western side of the highway, with the largest amount of sand transport within a height range of 0–10 cm. However, the No. 2–4 traps were affected by fences, and the amount of transported sand was small.
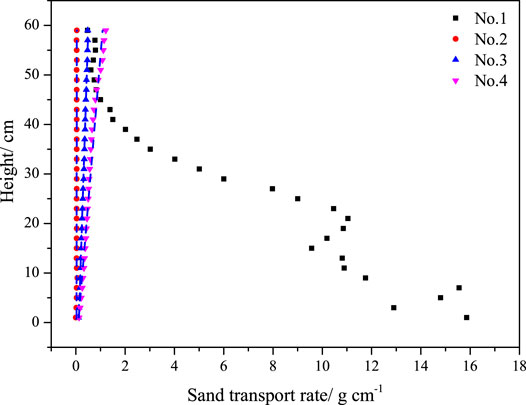
FIGURE 11. Sand-blocking efficiency of the sand control system.
Approximately 50% of the sand particles at No. 1 were transported in the near-surface layer of 0–15 cm, while at No. 2, they were in the layer of 0–31 cm. Sand particles at No. 3 were mainly transported in the layer of 0–37 cm, while at No. 4, they were 0–41 cm. The structure of wind-blown sand changed under the control system. As a result of the blocking effect of the high vertical sand fence, the amount of sand transported at the lower layer decreased, and the amount of sand transport increased slowly with height. After passing through the first high vertical sand barriers, the amount of sand transport at No. 2 was decreased by 99.5% compared with No. 1. After passing through the second sand barrier, the sand transport of the No. 3 sand collector decreased by 95.14%. After passing through the high checkerboard sand barrier at No. 4, the amount of sand transport was attenuated by 90.7%, indicating that the sand control system had an obvious sand-blocking effect.
4 Discussion
Sand hazards hinder the normal operation of highways due to wind erosion, transportation, and accumulation of sand under the action of wind. It is the product of the sand environment during the process of sand activities (Bagnold, 1942; Qu et al., 2007; Xie et al., 2013; Xie et al., 2015). According to previous research results (Bagnold, 1942; Qu et al., 2007), there are two main forms of wind-blown sand disasters. One is the wind-blown flow. When the wind speed reaches the sand-driving wind speed, the sand particles begin to move and form wind-blown sand. The other is dune movement under the action of wind. The hazards include erosion, sand accumulation, and sand burial (Qu et al., 2007; Dong et al., 2014). Combining our research results, it can be seen that there are three main reasons for the occurrence of sand disasters on the Wuhai–Maqin Highway. One is that the wind-blown sand environment is severe. Second, because the highway is located inside the Tengger Desert, there are abundant sand materials and dunes, which provide a sufficient material basis for the occurrence of sand hazards. Third, the original balance between sand dunes and the wind environment was destroyed during the construction of the highway. A low-wind speed area was formed near the subgrade, and sand piled up here. However, it should be noted that the degree and type of sand disasters are different due to landforms.
Another problem is that with the completion of the highway, fences will be installed on the subgrade, and the isolation belt will be set up in the middle of the highway. From previous research (Zhang et al., 2010a), the existence of fences would reduce the wind speed and lead to sand accumulation. Sedimentation would cause new sand hazards. In addition, the traffic on the highway would also affect the near-surface flow field and migration of sand. In view of this, the author would suggest to further strengthen related research in the later period.
The design basis of the protection system has always been a hotspot (Bagnold, 1942; Qu et al., 2007; Zhang et al., 2007; Xie et al., 2013; Xie et al., 2015; An et al., 2018). The design of the Baolan Railway control system was the earliest system in China. It was a comprehensive sand control system. It ensured the safety of the railway for more than 60 years (Zhang et al., 2007; Zhang et al., 2010b). The design of the control system in this article referred to the Baolan Railway system, and it was combined with the latest research results (Dong et al., 2001; Zhang et al., 2010b; Dong et al., 2014; Xie et al., 2015; An et al., 2018). Zhang et al. (2010a) used a three-dimensional laser scanner to observe the sand barrier on the Qinghai–Tibet Railway and found that the sand was mainly concentrated 3 H before the barrier and 9 H after the barrier. Based on this finding, the distance of the sand barrier on the Wuhai–Maqin Highway was 12 H. Many studies have been conducted to examine the mechanisms of semi-buried checkerboard sand barriers, which could form eddy currents in the interior and then form uneven surfaces, which could effectively prevent sand from approaching the surface (Fearnehough et al., 1998; Qu et al., 2007; Liu et al., 2011). At present, this sand fixation method is widely used (Zhang et al., 2010a; An et al., 2018). However, in areas where sand storms are serious, semi-buried checkerboard sand barriers are easily buried, having a short protection period. In view of this, high checkerboard sand barriers have emerged as a solution and have a significant weakening effect on the wind speed. The wind speed at 2 m was reduced by 33%, and the wind speed at 0.2 m was reduced by 81.5%. They could increase the surface roughness by 44 times (Pang et al., 2014). However, due to the large fluctuations of terrain in this area, microtopography had a very obvious impact on the effectiveness of the control system, and the protection effect of the control system could have certain differences.
5 Conclusion
The formation mechanisms of the sand hazards of the Wuhai–Maqin Highway in the Tengger Desert and the shelter efficiency of the control system were examined. The main conclusions were as follows.
(1) The main sand-driving wind directions were northwest, northeast, and south. This area has multiple wind directions; therefore, the control system should use multiple protective measures. During 2018 and 2019, the DP and resultant direction of the region did not change significantly, which indicated a low wind energy environment. The DPs at No. 1 and No. 2 in 2018 were 72.66 VU and 32.32 VU, and they were 101.67 VU and 135.03 VU in 2019, respectively. The particle size of the sediment in the area was distributed between 1.26Φ and 2.5Φ, which included fine sand and medium sand, which was more easily affected by wind and formed sand disasters. The aforementioned three points provided good natural conditions for the occurrence of highway sand disasters.
(2) The variation in the sand flux with height followed an exponential function. The sand particles were mainly concentrated below 30 cm, accounting for 89.46% of the total sediment transport. In view of this, the height of the protective measures should exceed 30 cm.
(3) Under the protection of the control system, the average attenuation of the near-surface wind speed reached 42.65%, and the interception rate against wind-blown sand was over 90%. Under the protection of the sand control system, the wind speed was significantly reduced, which would ensure the safe operation of the Wuhai–Maqin Highway in the Tengger Desert.
Data Availability Statement
The original contributions presented in the study are included in the article/Supplementary Material, further inquiries can be directed to the corresponding authors.
Author Contributions
All authors listed have made a substantial, direct, and intellectual contribution to the work and approved it for publication.
FUNDING
This research was supported by the National Natural Sciences Foundation of China (41871016), Highway Engineering Research Project of Ningxia Department of Communications (WMKY1), and the National Key Research and Development Program of China (2020YFA0608403-1).
Conflict of Interest
The authors declare that the research was conducted in the absence of any commercial or financial relationships that could be construed as a potential conflict of interest.
Publisher’s Note
All claims expressed in this article are solely those of the authors and do not necessarily represent those of their affiliated organizations, or those of the publisher, the editors, and the reviewers. Any product that may be evaluated in this article, or claim that may be made by its manufacturer, is not guaranteed or endorsed by the publisher.
Acknowledgments
The authors sincerely thank reviewers' constructive comments.
References
An, Z.-S., Zhang, K.-C., Tan, L.-H., Zhang, H., and Niu, B.-C. (2018). Dune Dynamics in the Southern Edge of Dunhuang Oasis and Implications for the Oasis protection. J. Mt. Sci. 15 (10), 2172–2181. doi:10.1007/s11629-017-4723-2
An, Z. S., Zhang, K. C., Tan, L. H., Niu, B. C., and Yu, Y. P. (2020). Aeolian Processes on Sandy Desertification of alpine Meadow: A Wind Tunnel Experiment. Ences Cold Arid Reg. 12 (1), 12–21. doi:10.3724/SP.J.1226.2020.00012
Blott, S. J., and Pye, K. (2001). GRADISTAT: A Grain Size Distribution and Statistics Package for the Analysis of Unconsolidated Sediments. Earth Surf. Process. Landforms 26 (11), 1237–1248. doi:10.1002/esp.261
Dong, Z., Gao, S., and Fryrear, D. W. (2001). Drag Coefficients, Roughness Length and Zero-Plane Displacement Height as Disturbed by Artificial Standing Vegetation. J. Arid Environments 49 (3), 485–505. doi:10.1006/jare.2001.0807
Dong, Z., Lv, P., Zhang, Z., and Lu, J. (2014). Aeolian Transport Over a Developing Transverse Dune. J. Arid Land 6, 243–254. doi:10.1007/s40333-013-0243-2
Fearnehough, W., Fullen, M. A., Mitchell, D. J., Trueman, I. C., and Zhang, J. (1998). Aeolian Deposition and its Effect on Soil and Vegetation Changes on Stabilised Desert Dunes in Northern China. Geomorphology 23 (2), 171–182. doi:10.1016/S0169-555X(97)00111-6
Fryberger, S. G., and Dean, G. (1979). “Dune Forms and Wind Regime,” in A Study of Global SandSeas. Editor E D. McKee (Washington D.C.: U.S. Government Printing Office), 137–169.
Huang, L. (2017). Spatial Distribution of Agriophyllum Squarrosum Moq. (Chenopodiaceae) in the Straw Checkerboards at a Revegetated Land of the Tengger Desert, Northern China. J. Arid Land 9 (2), 176–187. doi:10.1007/s40333-017-0010-x
Lancaster, N. (1985). Winds and Sand Movements in the Namib Sand Sea. Earth Surf. Process. Landforms 10, 607–619. doi:10.1002/esp.3290100608
Liu, B., Zhang, W., Qu, J., Zhang, K., and Han, Q. (2011). Controlling Windblown Sand Problems by an Artificial Gravel Surface: A Case Study over the Gobi Surface of the Mogao Grottoes. Geomorphology 134, 461–469. doi:10.1016/j.geomorph.2011.07.028
Liu, L., Liu, S. H., and Xu, Z. Y. (2007). Efficiency of Wind Erosion Control Measures at the Dk1562 Section of the Qinghai-Tibet Railway. Princ. Pract. Desertification Control 98, 223–229.
Ma, R., Wang, J., Qu, J., and Liu, H. (2010). Effectiveness of Shelterbelt with a Non-Uniform Density Distribution. J. Wind Eng. Ind. Aerodyn 98, 767–771. doi:10.1016/j.jweia.2010.07.001
Neuman, M. K., and Bédard, O. (2017). A Wind Tunnel Investigation of Particle Segregation, Ripple Formation and Armouring within Sand Beds of Systematically Varied Texture. Earth Surf. Process. Landforms 42, 749–762. doi:10.1002/esp.4019
Pang, Y. J., Qu, J. J., Xie, S. B., Xiao, J. H., and Han, Q. J. (2014). Windproof Efficiency of Upright Checkerboard Sand-Barriers. Bull. Soil Water Congserv 34 (5), 11–14. doi:10.13961/j.cnki.stbctb.2014.05.009
Ping, L., Narteau, C., Dong, Z., Zhang, Z., and Courrech du Pont, S. (2014). Emergence of Oblique Dunes in a Landscape-Scale Experiment. Nat. Geosci 7, 99–103. doi:10.1038/ngeo2047
Qu, J. J., Ling, Y. Q., Jing, Z. F., Zhang, K. C., and Zu, R. P. (2007). Interaction between Sand Blown Activity and Protection System in Shapotou Section of Baotou-Lanzhou Railway. J. Desert Res. 27 (4), 529–533. doi:10.3321/j.issn:1000-694X.2007.04.001
Shen, W., Zhang, H., Zou, C., Cao, X., and Tang, X. (2004). Approaches to Prediction of Impact of Qinghai-Tibet Railway Construction on alpine Ecosystems Alongside and its Recovery. Chin. Sci. Bull. 49 (8), 834–841. doi:10.1007/BF02889757
Tan, L., Zhang, W., Qu, J., Du, J., Yin, D., and An, Z. (2014). Variation with Height of Aeolian Mass Flux Density and Grain Size Distribution over Natural Surface Covered with Coarse Grains: A mobile Wind Tunnel Study. Aeolian Res. 15, 345–352. doi:10.1016/j.aeolia.2014.06.008
Thomas, D. S. G. (1988). The Nature and Depositional Setting of Arid and Semi-Arid Kalahari Sediments, Southern Africa. J. Arid Environments 14, 17–26. doi:10.1016/S0140-1963(18)31092-9
Wang, X., Zhang, C., Huang, X., Shen, Y., Zou, X., Li, J., et al. (2018). Wind Tunnel Tests of the Dynamic Processes that Control Wind Erosion of a Sand Bed. Earth Surf. Process. Landforms 44 (2), 614–623. doi:10.1002/esp.4534
Xie, S., Qu, J., Lai, Y., and Pang, Y. (2015). Formation Mechanism and Suitable Controlling Pattern of Sand Hazards at Honglianghe River Section of Qinghai-Tibet Railway. Nat. Hazards 76 (2), 855–871. doi:10.1007/s11069-014-1523-7
Xie, S., Qu, J., Zu, R., Zhang, K., Han, Q., and Niu, Q. (2013). Effect of Sandy Sediments Produced by the Mechanical Control of Sand Deposition on the Thermal Regime of Underlying Permafrost along the Qinghai-Tibet Railway. Land Degrad. Dev. 24 (5), 453–462. doi:10.1002/ldr.1141
Yasui, M., Zhou, J., Liu, L., Itabe, T., Mizutani, K., and Aoki, T. (2005). Vertical Profiles of Aeolian Dust in a Desert Atmosphere Observed Using Lidar in Shapotou, China. J. Meteorol. Soc. Jpn. 83A, 149–171. doi:10.2151/jmsj.83A.149
Zhang, C. L., Zou, X. Y., Yang, S., Pang, X. H., and Wang, H. (2007). Grain-Size Characteristics of Aeolian Deposits in the Shelterbelt of Railway at Shapotou. Geographical Res. 26 (1), 75–82. doi:10.3321/j.issn:1000-0585.2007.01.010
Zhang, K. C., Kai, K. J., Qu, J. J., Ling, Y. Q., and Niu, Q. H. (2010b). Dynamic Changes of a Typical Linear Dune in the Tengger Desert. J. Arid. Land 2 (4), 272–278. doi:10.3724/SP.J.1227.2010.00272
Zhang, K. C., Qu, J. J., Liao, K. T., Niu, Q. H., and Han, Q. J. (2010a). Damage by Wind-Blown Sand and its Control along Qinghai-Tibet Railway in China. Aeolian Res. 1, 143–146. doi:10.1016/j.aeolia.2009.10.001
Keywords: Wuhai–Maqin Highway, sand hazards, disaster-causing mechanism, drift potential, sand control system
Citation: An Z, Zhang K, Tan L, Niu Q and Wang T (2022) Mechanisms Responsible for Sand Hazards Along Desert Highways and Their Control: A Case Study of the Wuhai–Maqin Highway in the Tengger Desert, Northwest China. Front. Environ. Sci. 10:878778. doi: 10.3389/fenvs.2022.878778
Received: 18 February 2022; Accepted: 04 April 2022;
Published: 17 May 2022.
Edited by:
Z.Y. Yuan, Institute of Soil and Water Conservation (CAS), ChinaReviewed by:
Qingyu Guan, Lanzhou University, ChinaDang Xiaohong, Inner Mongolia Agricultural University, China
Guang-Lei Gao, Beijing Forestry University, China
Xing Xin, Lanzhou Jiaotong University, China
Copyright © 2022 An, Zhang, Tan, Niu and Wang. This is an open-access article distributed under the terms of the Creative Commons Attribution License (CC BY). The use, distribution or reproduction in other forums is permitted, provided the original author(s) and the copyright owner(s) are credited and that the original publication in this journal is cited, in accordance with accepted academic practice. No use, distribution or reproduction is permitted which does not comply with these terms.
*Correspondence: Kecun Zhang, kecunzh@lzb.ac.cn; Lihai Tan, tanlihai18@163.com