Reinvestigating the Spatiotemporal Differences and Driving Factors of Urban Carbon Emission in China
- 1School of Economics, Ocean University of China, Qingdao, China
- 2School of Economics and Management, Anhui University of Science and Technology, Huainan, China
This study analyzed the spatiotemporal differences and driving factors of carbon emission in China’s prefecture-level cities for the period 2003–2019. In doing so, we investigated the spatiotemporal differences of carbon emission using spatial correlation analysis, standard deviation ellipse, and Dagum Gini coefficient and identified the main drivers using the geographical detector model. The results demonstrated that 1) on the whole, carbon emission between 2003 and 2019 was still high, with an average of 100.97 Mt. Temporally, carbon emission in national China increased by 12% and the western region enjoyed the fastest growth rate (15.50%), followed by the central (14.20%) and eastern region (12.17%), while the northeastern region was the slowest (11.10%). Spatially, the carbon emission was characterized by a spatial distribution of “higher in the east and lower in the midwest,” spreading along the “northeast–southwest” direction. 2) The carbon emission portrayed a strong positive spatial correlation with an imbalance polarization trend of “east-hot and west-cold”. 3) The overall differences of carbon emission appeared in a slow downward trend during the study period, and the interregional difference was the largest contributor. 4) Transportation infrastructure, economic development level, informatization level, population density, and trade openness were the dominant determinants affecting carbon emission, while the impacts significantly varied by region. In addition, interactions between any two factors exerted greater influence on carbon emission than any one alone. The findings from this study provide novel insights into the spatiotemporal differences of carbon emission in urban China, revealing the potential driving factors, and thus differentiated and targeted policies should be formulated to curb climate change.
1 Introduction
Increased carbon emission is widely recognized as the primary cause responsible for global warming, greenhouse effects, and has led to extreme climate phenomena, such as glaciers melting, sea-level rising, storm surges, and floods, which represents a serious hazard to human health as well as economic development (Liu et al., 2019a; Wang and Jiang, 2019; Wei et al., 2019). Consequently, carbon emission reduction is not only of great necessity for human existence but also for the realization of green sustainable progress in an economic society. The Paris Climate Agreement in 2016 has announced the global mean temperature control goal of 1.5/2°C (Yang et al., 2022a). In light of that, more nations have pledged to curb carbon emission and established a raft of effective emission mitigation strategies to fulfill this challenging responsibility (Karmellos et al., 2021). As the world’s largest developing country and carbon emitter, China has also actively participated in global carbon governance and promised to peak the carbon emission by 2030 and then become carbon neutral by 2060 (hereinafter named as “30.60” targets) at the 75th session of the United Nations General Assembly in 2020 (Gao et al., 2021; Zhang et al., 2022). However, it should be noted that following the continuously growing economy, the carbon emission in China, as contrary to the “30.60” targets, has rather increased (Zhou et al., 2019b; Wang et al., 2021). In addition, carbon emission varies remarkably across regions in China due to the significant differences in resource endowments, levels of economic development, and scientific and technological innovation (Liu et al., 2019c; Shen et al., 2021). Hence, investigating the spatiotemporal differences regionally and identifying the potential driving factors of carbon emission systematically in China are the major concerns of policymakers.
In the literature, a considerable number of studies have been concentrated on the measuring methods, spatiotemporal evolution, influencing factors, and mitigation strategies of carbon emission in China. For the measurements, the structural decomposition approach (SDA) and logarithmic mean Divisia index (LMDI) decomposition methods were the most frequently used worldwide (Huang et al., 2022; Ma et al., 2019). Studies on spatiotemporal characteristics have found that the carbon emission in China would continue to grow for a long time (Wang et al., 2021) and showed significant spatial correlations (Du et al., 2022; Zhao et al., 2020). In addition, some models have been employed to explore the time- and space-changing features of carbon emission, such as spatial correlation analysis (Wang and Zheng, 2021), exploratory spatial data analysis (Han et al., 2021; Zhang et al., 2021), spatial econometric model (Li and Li, 2020), and geographically weighted regression model (Xu and Lin, 2021; Yang et al., 2021). Regarding the driving factors, various natural and human factors of carbon emission have been researched systematically in the literature. Among the natural factors, the climatic condition was universally recognized as one of the most decisive factors affecting carbon emission (Xu et al., 2021). In addition, human factors including the economic development level (Cai et al., 2021; Dong et al., 2020), energy consumption structure (Xu and Lin, 2019; Yang et al., 2022b), urbanization and industry structure (Ali et al., 2019; Dong et al., 2019b), technology (Chen et al., 2020; Sun et al., 2021), transportation (Song et al., 2019), and trade openness (Pu et al., 2020) have also been identified to influence carbon emission, but their influences differed in diverse regions (Liu et al., 2021). These aforementioned findings corroborated the views of Huang and Matsumoto (2021), in which the authors found that the impacts of urbanization on carbon emission were significantly different between regions. In terms of the emission mitigation strategies, existing studies have mainly reached agreements upon transforming the economic development mode, optimizing industrial and energy structure, improving technology innovation capacity, and so on (Chuai and Feng, 2019; Wang et al., 2019; Wu et al., 2021). In summary, the aforementioned studies on carbon emission have given us much enlightenment. However, the existing literature was mainly conducted from the perspectives of countries, provinces, and industries, but studies, further exploring urban carbon emission, were still scarce. It has been reported that the energy consumption of major cities around the world shared 75% of world’s total and more than 80% of global carbon emissions came from urban areas. In the case of China, people living in urban areas have reached over 902 million, comprising approximately 64% of the total population of China in 2020 (CSY, 2021). With cities as the biggest sources of carbon emission, urban carbon emission reduction should be set as the key issue for attaining China’s “30.60” targets of reaching its peak by 2030 and turning carbon-neutral by 2060 (Dong et al., 2019a).
Although there have been an increasing number of research studies centering on carbon emission over Chinese cities, most of them have been conducted at the single city level (Shen et al., 2018; Wei et al., 2020) or typical urban areas (Liu et al., 2019b; Salvia et al., 2021); the studies on the urban carbon emission with a national coverage still remain insufficient. In addition, prior studies have demonstrated that the distribution of carbon emission was uneven in different regions but failed to reveal the sources of regional differences. Fortunately, the Gini coefficient improved by Dagum is capable of distinguishing the key contributor of the total difference, thus targeted policies can be formulated to alleviate carbon emission. Moreover, to date, studies usually focused on the separate effect of driving factors of carbon emission, and the interactive influences between these drivers tend to be neglected. In fact, the causes of carbon emission are associated, and the interaction between factors can indirectly affect carbon emission (Xu et al., 2021). The geographical detector model proposed by Wang et al. (2010) sheds light on the spatial relationships and interactive effects of variables, which is conducive to investigating important factors more comprehensively. To summarize, it is of great necessity to make an in-depth analysis of carbon emission with the aspect of city.
Compared with the existing literature combed previously, this study contributes to several aspects. 1). This study took 284 Chinese prefecture-level cities as the research unit and then investigated the spatiotemporal differences and driving factors of urban carbon emissions in China based on a series of diversified empirical frameworks. 2) ArcGIS techniques of Moran’s I, cold and hot spots analysis, and standard deviation ellipse were adopted to intuitively portray the spatiotemporal evolution characteristics of urban carbon emission in China. 3) The Dagum Gini coefficient and its decomposition were further employed to reveal the leading sources of regional differences in carbon emission. 4) Using the geographical detector model to explore the main drivers of national and regional carbon emission, as well as their interactive effects, provided a basis for emission mitigation measures in cities with different regions.
The remainder of this article is organized as follows. Section 2 introduces the related methodologies and describes the data sources. Section 3 discusses the spatiotemporal differences and driving factors of carbon emission from national and regional perspectives. Section 4 summarizes this study and puts forward policy implementations.
2 Methodology and Data
2.1 Methodology
2.1.1 Global Spatial Correlation Analysis
Global Moran’s I is a commonly used statistics for testing spatial correlation (Moran, 1950). The formula can be set as follows:
where yi and yj are the carbon emission of city i and j, respectively, n is the number of cities (284 in this study), S2 refers to the variance,
The Z-value is used to evaluate the statistical significance of global Moran’s I, whose formula can be set as follows:
where E(I) and VAR (I) are the mathematical expectation and coefficient of variation of
Considering that the carbon emission may be affected by both geographical and economic factors. In this study, the nested weight matrix of spatial geography and economy is calculated by geographical distance and per capita GDP. The formula is shown as follows:
where W1,ij, W2,ij, and Wij are the geography, economy, and nested spatial weight matrix, respectively, dij is the distance between the centers of city i and j, PGDPi and PGDPj are the average values of per capita GDP of city i and j from 2003 to 2019.
2.1.2 Local Spatial Correlation Analysis
Compared with the global Moran’s I, it only evaluates the spatial correlation of carbon emission from a global perspective, while the cold and hot spots analyses (Ord and Getis, 1995) can reflect the spatial agglomeration degree of individual units. In this study, the cold and hot spots analysis is also applied to identify significant spatial clustering of high- and low-carbon emission calculated by Getis-Ord
The
Similar to Moran’s I, the
where Xi and Xj are the carbon emission of city i and city j, respectively; Wij is the spatial weight matrix;
2.1.3 Standard Deviation Ellipse
The standard deviation ellipse (SDE) proposed by Lefever (1926) quantitatively describes the spatial distribution characteristics of the research object through its center, long, and short axis, azimuth, and other basic parameters (Chen et al., 2021). The concrete calculating process can be reflected by the following equation:
where (SDEx, SDEy) is the centroid of the ellipse, (xi,yi) is the geographic coordinates of the city i,
2.1.4 Dagum Gini Coefficient and Its Decomposition
Dagum (1997) proposed a superior method for measuring inequity, which can describe the sources of overall regional difference and the distribution of subsamples remain unaffected by sample overlap (e.g., not all cities in the eastern region have a higher carbon emission than those in other regions; some cities in the center, western, and northeastern regions may also have higher carbon emission than individual cities in the eastern region, which calls as the sample overlap). This method has been widely employed in many fields, yet its applications in the environmental stewardship remain limited. Given this, we used Dagum’s decomposition and Gini coefficient to explore the regional difference of the carbon emission in urban China. The following Equation 16 can express it:
where yji (yhr) is the carbon emission of city i (j) in the region j (h),
Before conducting Dagum’s Gini coefficient decomposition, the regions under study must be classified by their average carbon emission using Eq. 17, as follows:
Following Dagum (1997), the Gini coefficient can be decomposed into three terms, namely, contribution of intra-regional differences Gw, contribution of interregional differences Gnb, and contribution of the intensity of transvariation Gt,, as illustrated in Eqs 18–20. Accordingly, the components meet G = Gw + Gnb + Gt. Equation 21 denotes the Gini coefficient Gjj within the jth region, Eq. 22 denotes the Gini coefficient
Eqs 24, 25 show the detailed calculation process of djh and pjh. Specifically, djh is the difference of the contribution rate of carbon emission between regions, which could be defined as aggregate expectation of all samples, satisfying
2.1.5 Geographical Detector Model
The geographical detector model proposed by Wang et al. (2016) is an advanced statistical method, which can be used to detect spatial heterogeneity and reveal the key drivers behind that heterogeneity. The model mainly consists of four parts including the factor detector, interaction detector, ecological detector, and risk detector (Wang et al., 2010). To be specific, the factor detector, denoted by PD statistic, investigates the explanatory power of factor X on Y spatial heterogeneity; the interaction detector distinguishes whether there exist interactions between X1 and X2; the ecological detector compares the impact difference of X1 and X2 on Y; and the risk detector reveals potential risk areas of Y. In this study, based on the previous researches (Zhang and Zhao, 2018), we adopted the factor detector, interaction detector, and ecological detector to identify and extract the key contributors affecting carbon emission. The formula is given as follows:
where PD is the power of determinant on the carbon emission.
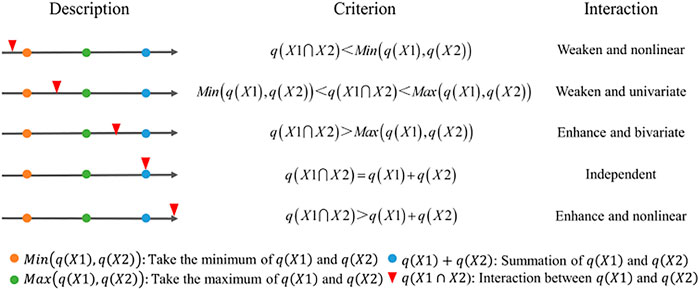
The fact is, however, that Y may be influenced by the interaction between two factors rather than a single one. With regard to this, the interaction detector can assist in significantly identifying the interaction between the two factors (Zhan et al., 2018). The interactive influence can be judged using Figure 1.
As shown in Figure 1, q (X1) and q (X2) refer to the separate impact of X1 and X2 on Y, and
2.2 Data and Source
2.2.1 Data for the Carbon Emissions
Given the scarcity of official source on carbon emission data in cities and in accordance with Han and Xie (2017) and Ren et al. (2020), this study calculated carbon emission based on the consumption of liquefied petroleum gas, natural gas, and annual electricity in a concerned city by using a unified standard and scientific method proposed by IPCC (Eggleston et al., 2006). The formula for calculation is as follows:
where
2.2.2 Data for the Driving Factors
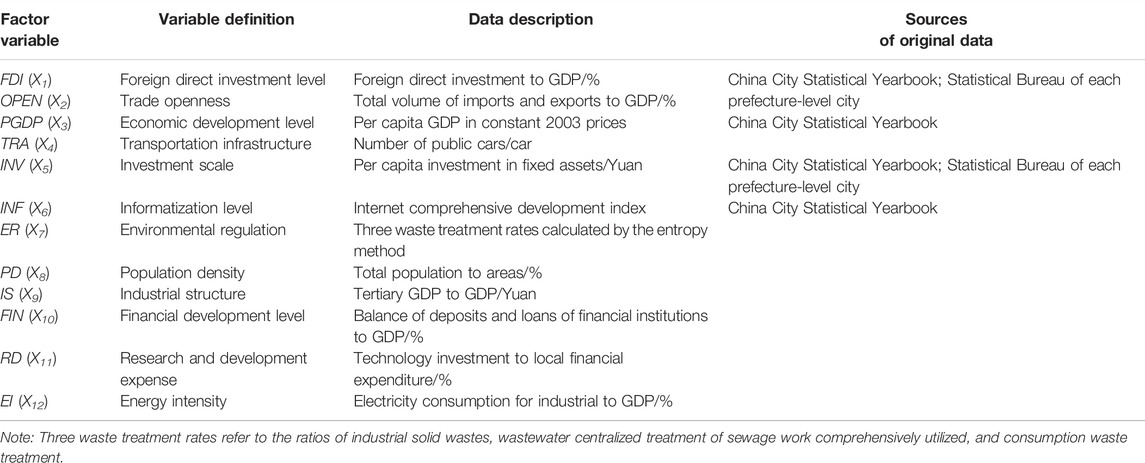
Based on a previous study (Huang et al., 2019b; Essandoh et al., 2020; Zhang et al., 2020), 12 proxy indicators were selected as the potential driving factors for carbon emission. To be more specific, the foreign direct investment (FDI) level, trade openness (OPEN), economic development level (PGDP), transportation infrastructure (TRA), investment scale (INV), information level (INF), environmental regulation (ER), population density (PD), industrial structure (IS), financial development level (FIN), research and development expense (RD), and energy intensity (EI) were chosen in this study. All of the abovementioned variables have been classified using the natural breaks classification method, and the detailed description of these driving factors is displayed in Table 1.
2.2.3 Data Description
In view of data accessibility and consistency, the scope of our research was limited in 284 Chinese prefecture-level cities from 2003 to 2019. Since 9 January 2019, Jinan and Laiwu have amalgamated into one. With regard to this, we aggregated the original data of these two cities from 2003 to 2018.
In addition, taking into account the economic and geographical conditions of different areas in China, the carbon emission should be studied regionally. This study divided the study area into four regions, namely, eastern, central, western, and northeastern, to investigate regional differences in carbon emission.
3 Results and Discussion
3.1 Temporal and Spatial Characteristics
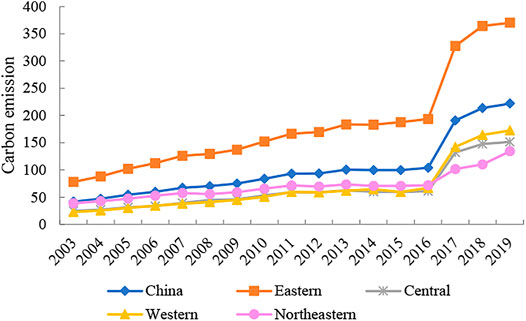
The temporal changes in carbon emission in China and four regions during the same period are exhibited in Figure 2. As seen in the figure, the national annual average carbon emission took on an increasing trend for the period 2003–2019 and increased by 12% annually. More specifically, the annual average carbon emission maintained relatively steady growth between 2003 and 2016 from the minimum, 42.02 Mt, to the maximum, 104.09 Mt, but had a sharp increase since 2017 and hit an all-time high of 221.92 Mt in 2019. With regard to four regions, the carbon emission showed predominant regional differences with the annual average value sorted by a decreasing order as eastern region (180.65 Mt)
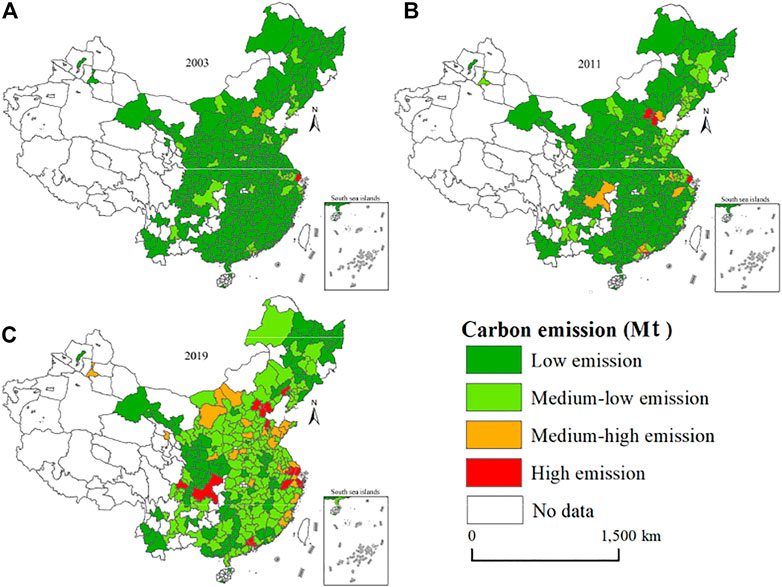
The spatial distribution of carbon emission in 2003, 2011, and 2019 is presented in Figure 3. As shown in Figure 3, the carbon emission is divided into four types: “low emission” (0–100 Mt), “medium–low emission” (100–400 Mt), “medium–high emission” (400–700 Mt), and” high emission” (>700 Mt). Overall, the carbon emission from the 284 Chinese cities experienced a growing trend from 2003 to 2019, and the spatial diffusion breadth and scale expanded. Carbon emission in the studied cities was characterized by a spatial distribution of “higher in the east and lower in the midwest”. Specifically, cities with higher emissions were distributed mainly over eastern China, such as Shanghai (1,647.16 Mt), Beijing (1,490.28 Mt), Binzhou (1,078.21 Mt), and Shenzhen (984.27 Mt), which ranked in the top five, while cities in other areas had relatively lower emissions (apart from Chongqing, 1,173.34 Mt, and Chengdu, 718.40 Mt). In addition, it is to be noted that all municipalities were located in high carbon emission levels being concentrated above 700 Mt. As a result of rapid industrialization and urbanization, these developed cities were suffering more severe environmental pressure.
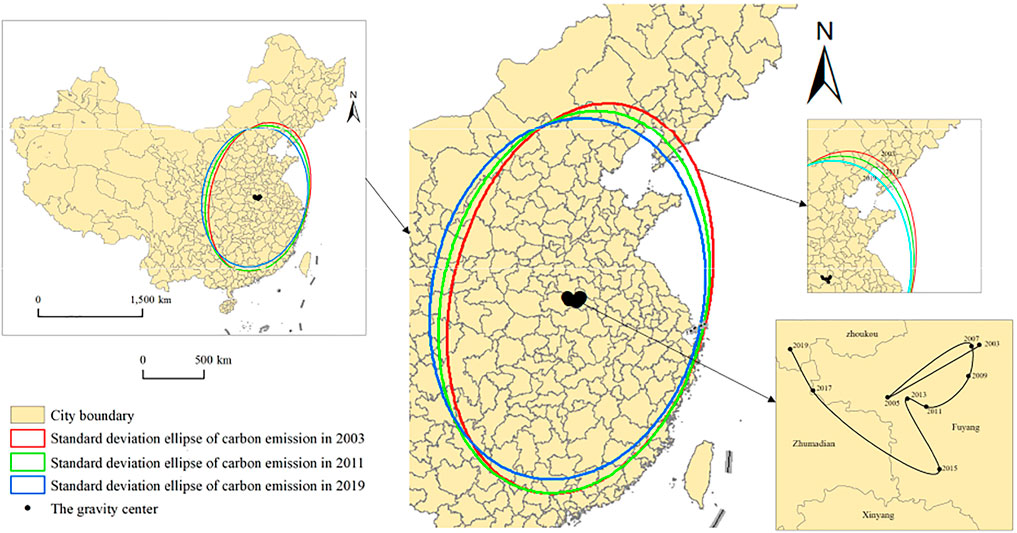
To further analyze the overall spatial pattern changes in carbon emission with time, in Figure 4 and Figure 5, a series of distribution charts of carbon emission in Chinese cities from 2003 to 2019 were illustrated by using the SDE method. During the study period, the spatial distribution of carbon emission showed the “northeast-southwest” direction, and the gravity center moved northwest, from Fuyang to Zhumadian then to Zhoukou. As described in Figure 5A, the shape index (the ratio of long axis to short axis) varied from at most 1.56 in 2003 to a lower value of 1.34 in 2019, indicating that heterogenous spatial changes in carbon emission were happening over time. The closer the ratio was to 1, the more the ellipse looked like a circle, thus the smaller the carbon emission differences between regions tended to be. In addition to that the azimuth of the long axis was rotated counterclockwise from 14.03° to 11.40°, which suggested that “northeast-southwest” direction was the basic distribution pattern of urban carbon emissions in China (see Figure 5B). It has to do with the rapid increase of carbon emission in the northeast and western regions over recent years.
Table 2 showed the global Moran’s I of carbon emission of 284 Chinese cities in 2003, 2011, and 2019. The results suggested that the Moran’s I of carbon emissions were positive, and the p-values for all passed the significance test at the level of 1%. We, therefore, concluded that a spatial positive correlation of carbon emission existed between regions.
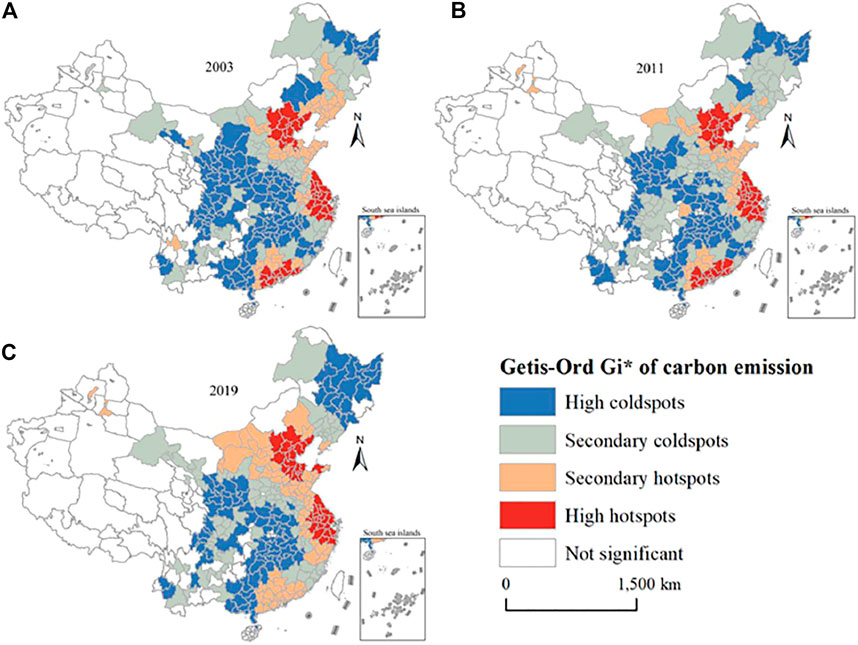
The cold and hot spots results of carbon emission in Chinese cities are illustrated in Figure 6. From the perspective of spatial distribution, the primary and secondary hot spots of carbon emission were located in eastern China, mainly in Beijing, Shanghai, Guangdong, and their surrounding cities, manifesting that the carbon emissions in these cities have not been effectively controlled. Most of the primary and secondary cold spots were mainly concentrated in central and western regions of China, which formed a contrast with the east. As for time trends, the hot spots of the Guangzhou-centered area have changed from primary to secondary, and the secondary hot spots have spread to most parts of central China. During the study period, new spatial and temporal changes did not appear significantly in primary and secondary cold spots (see Figure 6). In summary, the cold and hot spots of carbon emission showed obvious spatial clustering characteristics, featuring as a distribution pattern of “eastern hot spots gathering and western cold spots grouping”.
3.2 Regional Differences and Its Decomposition
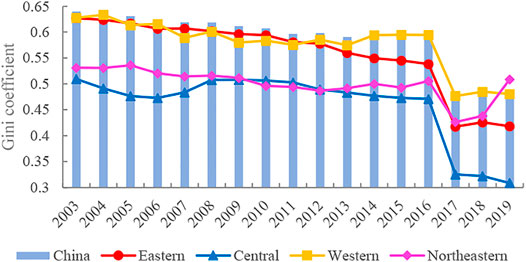
In this section, the Dagum Gini coefficient was used for the measurement and decomposition of regional differences in China’s carbon emissions. Figure 7 depicted the variation in overall and intra-regional Gini coefficient of carbon emission in China from 2003 to 2019, respectively. The overall Gini coefficient exhibited a downward and fluctuating trend, with the annual average decrease of 1.71%. The final Gini coefficient in 2019 (0.48) was lower than that in 2003 (0.64), indicating a narrowing regional difference in China’s carbon emission in the research period.
For each specific region, Figure 7 further showed that the average intra-regional Gini coefficients of the four regions, namely, eastern, central, western, and northeastern, were 0.59, 0.46, 0.58, and 0.50, respectively. The Gini coefficient of the northeastern region displayed a V-shaped trend of “decreased first and increased afterward”, with the annual decrease being 0.10%. To be more specific, the Gini coefficient first declined slightly from 2003’s 0.53 to 2017’s 0.43, which was an annual decrease of 1.46%, followed by a strong increase until 2019, reaching the value of 0.51, and then increased by 9.43% annually. Compared with the northeastern region, the differences in eastern, western, and central regions all showed slowly declined trends from 2003 to 2019, decreasing by 2.33, 2.72, and 1.50% at annual rates, respectively. As analyzed before, the differences in carbon emission within regions were progressively alleviated, which is conductive to help China to become carbon-neutral quickly in the future.
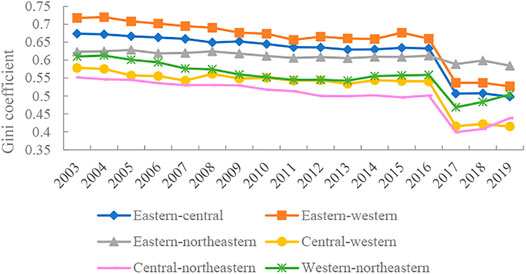
The changing trends of the interregional Gini coefficient are illustrated in Figure 8. As described in Figure 8, the differences between regions were fairly clear, with the largest gap being between eastern and western regions at an annual average of 0.66, followed by eastern-central (0.62), eastern-northeastern (0.61), central-western (0.56), and western-northeastern (0.53), while the differences between central and northeastern regions was the lowest (0.50). In addition, the interregional Gini coefficient changing trends for the four regions were generally consistent and steadily decreasing, with the annual decline rates of 1.86, 1.79, 1%, 1.79%, 1.74%, 1.26%, 1.08% and 0.39% in central-western, eastern-western, eastern-central, central-northeastern, western-northeastern, and eastern-northeastern, respectively. These trends might be the results of resource endowment, technological innovation, and economic development level, which caused the differences in carbon emission between regions.
For further analysis of the regional differences in carbon emission, Figure 9 presented the decomposition of the overall Gini coefficient of the carbon emission in China and the main sources for the differences. Figure 9 shows that the intra-regional differences (Gw) contributed 25.91% on the total differences on average, the intensity of transvariation (Gt) contributed 28.99% during 2003–2019, and the contribution of inter-regional differences (Gn) was 45.10%, which meant the difference between regions was the greatest source. Regarding the changing processes, it was fairly obvious that the contributions of Gw and Gt remained relatively stable, while the contribution of Gn was increasing, as it varied gently within 41.48%–49.34%, with the annual increase rate being 0.20%. Therefore, it was concluded that the deterioration trend of carbon emissions in China was largely attributable to the differences between regions; thus, shrinking the gap of regions should be the key contributor to facilitate China’s carbon-abatement agenda.
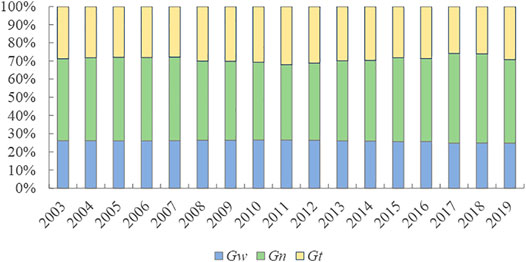
FIGURE 9. Sources of the overall differences in carbon emission and the trends of their distributions.
3.3 Driving Factors of Carbon Emission
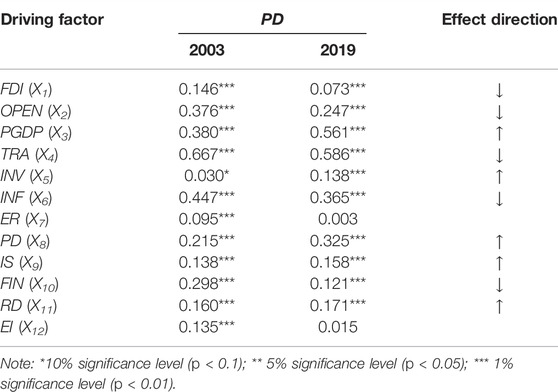
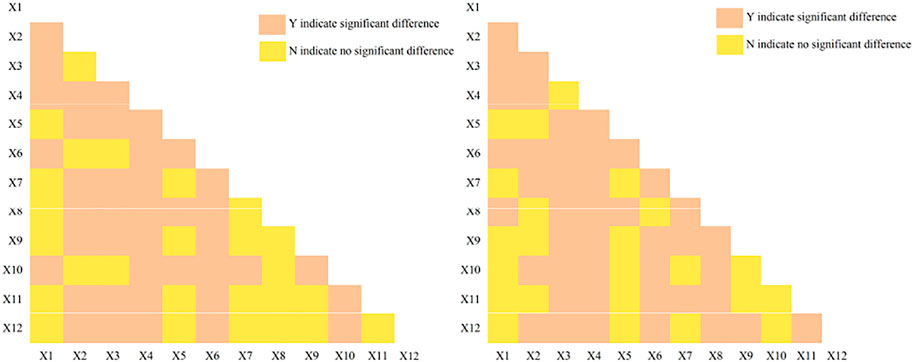
The results in Table 3 represented the selected 12 driving factors’ influence on carbon emission using the factor detector model in 2003 and 2019. Furthermore, the ecological detector was utilized to test the distinct differences among these influencers regarding the spatial heterogeneity of regional carbon emission (see Figure 10,
Based on Table 3, these drivers were found to differ in their impacts on carbon emission in China, with most drivers showing significant effects, among which TRA (0.586), PGDP (0.561), INF (0.365), PD (0.325), and OPEN (0.247) had the strongest determinative power. In detail, the influences of the twelve factors mentioned before on carbon emission in China are elaborated further:
(1) It can be seen that TRA was closely associated with carbon emissions in China, with the PD value changing from 0.667 in 2003 to 0.586 in 2019, which implied that the influence of TRA appeared to have weakened during the study period. The finding that transportation infrastructure expansion stimulated pollution comprising carbon emissions was not surprising, which was consistent with other studies (Xie et al., 2017; Huang et al., 2019a). This indicated that rapid economic growth and population expansion increased travel needs which further caused more traffic carbon emissions. Notably, with the appeal for sustainable economic development and green travel, TRA tended to form a more energy-saved and low-carbon style, as fossil energy was being replaced gradually by cleaner sources of energy such as solar in the transportation sector.
(2) The results showed that AGDP posed a huge environmental hazard to carbon reduction with the PD value up to 0.561 in 2019, while AGDP portrayed a smaller role that determined only 0.380 of the change of carbon emission in 2003. The reason for this result may be the extensive economic development mode characterized by high energy, high polluting, and high emission, which made the economy to become the second decisive and influential driver. As the economy grew faster, the number of resources and energy consumption increased rapidly, which in turn led to more carbon emissions (Ma et al., 2021). With this in mind, economic development must offset its environmental damage to a great extent, to simultaneously attain a win-win scenario with China’s economic growth and carbon abatement.
(3) According to the estimated results, the explanatory power of INF has had a negative and an obstructive impact on carbon emission, with the PD value ranging from 0.447 in 2003 to 0.365 in 2019. Similar results include Anser et al. (2021); on the one hand, the widespread application of information technology has enhanced enterprise green knowledge and innovation capacity, and on the other hand, it brought about opportunities for socioeconomic cleaner production and low-carbon development. In addition, the INF can promote environmental information exchange and resource sharing and will serve as a technological foundation for the government to strengthen environmental supervision, which can lead to lower carbon emission.
(4) The decisive power of PD on carbon emission in 2003 was 0.215, while it increased to 0.325 in 2019, indicating that PD has added considerable pressure on carbon mitigation. Our findings also echoed the argument that the positive correlation between population density and environmental pollution existed in China (Sharma et al., 2021; Xu et al., 2021). The possible reason was that high PD levels accelerated urbanization, leading to an enormous increase in energy resource consumption, and thus the environment was seriously damaged. To sum up, the side-effects on the environment caused by PD must, these aforementioned results suggested, be properly arranged in the enactment and deployment of emission-inhibiting policies.
(5) Consistent with a previous study produced by Wang and Zhang (2020), OPEN showed a quite significant, adverse effect on carbon emission in the research period, with the PD value decreasing dramatically from 2003’s 0.376 to 2019’s 0.247. Along with the implementation of reform and opening up, China has been active in formulating various measures that yielded sound, long-term economic and environmental benefits, including expanding its import–export trade and attracting massive foreign investment. We can conclude that a higher openness level is greatly conducive for ceasing the growth of carbon emissions. Further deepening the internal–external opening should be recognized as an important impetus for the high-quality environment, and bringing into full play a promoting role of OPEN on carbon abatement was of great magnitude in China.
(6) It is noted that the PD values of the remaining seven factors all stayed low in the years 2003 and 2019, implying a relatively smaller decisive power on carbon emission. It can be found that INV, IS, and RD had exerted a positive, incentive influence on carbon emission. Conversely, FDI and FIN hindered the growth of carbon emission. Moreover, from a long-term perspective, ER and EI’s PD values exhibited a downward trend and were no longer significant in 2019.
Furthermore, this study used the ecological detector to examine the significant differences in the impacts of factors on carbon emission at the 0.05 significance level. As is indicated in Figure 10, a great majority of those drivers showed a rather remarkable difference. For instance, in 2003, the impacts of TRA (X4) had a distinct difference as compared to those of ER (X7) and PD (X8). Results from the ecological detector showed that significant differences existed between PGDP (X3) and any other factors on the spatial distribution of carbon emission except TRA (X4) by 2019. The effects of TRA (X4) and INF(X6) on carbon emission were also significantly different, while the influences of INV(X5) and FIN(X10) were not significant (Figure 10).
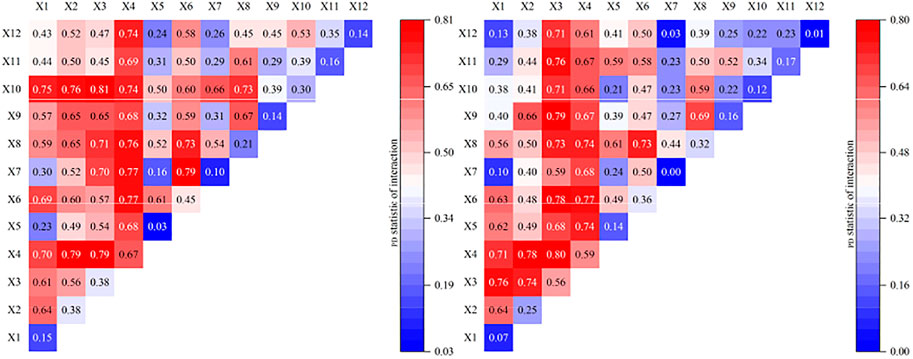
The results of the interaction relationships between every two drivers in the years 2003 and 2019 are shown in Figure 11. The PD statistics on the diagonal represented the same separate effects of each driver, as listed in Table 3, while those distributed in the upper triangular matrix referred to the interactive effects. From the figure, it can be found, obviously, that interactions between most factors showed enhanced and non-linear effects on the carbon emission in China but some had an enhanced and bivariate effect. Taking FDI (X1) and OPEN (X2) for example, the relationship between X1 and X2
The factor detection model was applied to further reveal the main driving factors affecting carbon emission regionally. The whole China was divided into four regions based on its geographical location, as shown in Table 4. The results are outlined as follows: in the eastern region, TRA was the primary factor affecting carbon emission both in 2003 and 2019 (with PD value increased by 0.037). PGDP (0.692), INF (0.438), INV (0.370), and PD (0.336) were also the important factors for increasing carbon emission. In 2003, PGDP (0.605) had the strongest determinative power on carbon emission in the central region; TRA (0.601), FIN (0.460), INF (0.390), and EI (0.327) also exerted major impacts on carbon emission. By comparison, TRA (0.688) surpassed PGDP (0.508) and became the primary influencing factor in 2019. Obviously, the PD values of FIN (0.436) and INF (0.321) decreased during the study period, thus indicating that the financial development and information construction in central areas reduced their impacts on carbon emission. As for the western part of China, the influence of TRA, FIN, and INF on carbon emission decreased significantly from 2003 to 2019, whereas that of FDI, PGDP, IS, and RD increased, resulting in more carbon emission. That might be due to the fact that cities in the western region were relatively intensive in energy resources but lagged in technology, short in innovation and poor in research. The effects on PGDP and TRA was weakened (with PD values decreased by 0.044 and 0.076, respectively) in the northeastern region, whereas the OPEN showed a growing impact on carbon emission (with the PD value remarkably increased from 0.016, 2003 to 0.334, 2019), which signified that trade openness exacerbated carbon emission.
4. Conclusion and Policy Implications
4.1 Conclusion
This study investigated the spatiotemporal differences and driving factors of carbon emission in 284 Chinese cities for the period 2003–2019. Specifically, we used the spatial correlation analysis, standard deviation ellipse, and Dagum Gini coefficient methods to derive the spatiotemporal evolution pattern of carbon emission and revealed the main sources of regional differences. Moreover, the geographical detector model was introduced to identify the major drivers of carbon emission in China. We draw the following conclusions:
(1) From the spatiotemporal evolution, the annual average carbon emission in China was 100.974 Mt for the period 2003–2019 and exhibited a general upward trend over time. Among the four regions, carbon emission was the highest in the eastern region and then followed by northeastern and western regions, while the center region was the lowest. In addition, all the four regions presented a persistent increase in carbon emission, and the western region enjoyed the largest growth rate. In addition to that, the results showed that the carbon emission portrayed a “northeast–southwest” spatial distribution direction and represented a strong positive spatial correlation with an imbalance polarization trend of “east-hot and west-cold.”
(2) The overall differences in carbon emission for cities showed a gradual downward trend during the research period from the Dagum Gini coefficient analysis, with higher Gini coefficients in eastern and central regions and lower Gini coefficients in western and northeastern regions, indicating that the regional differences in carbon emission were shrinking. Moreover, the contribution of interregional differences was obviously the largest and still increasing, thus narrowing the interregional differences should be set as the crucial point to reduce the overall carbon emission from a policy perspective.
(3) As for the driving factors of carbon emission, the results of the geographical detector model showed that transportation infrastructure, informatization level, and trade openness had the strongest determinative power in 2003, while transportation infrastructure, economic development level, and informatization level were the primary drivers affecting carbon emission in 2019. In the eastern, central, and northeastern regions, transportation infrastructure and the economic development level exerted a greater effect on carbon emission; however, the explanatory powers of transportation infrastructure and the foreign direct investment level were larger than other factors in the western region. In addition, the interactions can be classified into two kinds: enhanced and nonlinear and enhanced and bivariate. Also, the interactive effects between any two factors showed greater influence on carbon emission than their separate effects.
4.2 Policy Implications
In line with the conclusions obtained, the following policy implications for carbon emission mitigation in China can be put forward:
First, and most importantly, China has to seek new ways to simultaneously guarantee sustained economic growth and carbon emission reduction. As the largest developing country, China still needs to spare no efforts to develop its economy, and the carbon emission may continue to increase at the same time. Over the long term, under such urgent circumstances of extreme climate change, degeneration of ecological conditions, and exhaustion of resources, the first task for the Chinese government should be looking for alternative ways to change the economic growth from high inputs, high consumption, and high discharge to green and low carbon. For example, the government should prioritize clean vehicle research, economic structure adjustment, information technology improvement, and increased trade openness to curb carbon emission. Meanwhile, the interactions between factors should also be given full play to achieve the steady progress of China’s economy while reducing carbon emission, for example, considering the interactions with other factors during economic development, accelerating the development of new energy transportation, and improving the level of informatization, so as to achieve a win–win scenario with economic development and carbon mitigation.
Rather, the disparity between regions was the largest contributor to the total difference of carbon emission, so narrowing the gap between regional carbon emissions in urban areas should be treated as an effectual approach in mitigation policymaking. According to the aforementioned analysis results, the difference between eastern and western regions was the largest; thus, it is necessary for the local government to take the top priority for policies implementation about shrinking the gap across the cities belonging to eastern and western regions. For cities with higher emissions in the eastern region, the enactment of emission mitigation policies should be based on promoting green- and low-carbon economic transformation, so as to cease the growth of carbon emission. Strengthening the polluting industries and capital control and maintaining the current low-carbon development status, for lower cities in the western region, can assist in significantly curbing carbon emission. In addition, given that the carbon emission showed strong spatial positive correlation, the regional cooperation system should also be established to promote information exchange and cooperation, which can accelerate the emission-inhibiting process.
Last, in view of the distinguished decisive power of driving factors affecting regional carbon emission, it is pertinent for the Chinese government to formulate several flexible and targeted policies to facilitate its carbon-abatement agenda which are suitable for different parts of China. To be specific, the cities in all regions should stay devoted to modifying the traditional means of transportation into a cleaner way. In addition, to reduce carbon emission, the eastern region also has to put the main attention on economic progress and the enhancement of informatization level. Also, improving economic development quality and financial development level, increasing efforts to attract FDI, and accelerating research and development could serve as tools for carbon emission mitigation both in central and western regions. Regarding cities in the northeastern region, it is thus imperative for the local government to spur regional economic growth and expand the opening in trade during the carbon emission reduction.
However, there still exist some limitations that can be further improved in the future. First, carbon emission is an important catalyst for global warming, which could be triggered by various natural causes such as climatic types in different regions (Cai et al., 2018). Therefore, the analysis of impact factors on carbon emission should be considered into climatic types in future studies. Furthermore, the interactive influences in this study provided by the geographical detector model may not be comprehensive due to the complex relationships between variables (Zhu et al., 2020). With the improvement of the model, there is a need for future research to probe the interactive effects among three or more influencing factors on carbon emission in China. Finally, since December 2019, the global COVID-19 pandemic has been exerting profound impacts on human health and economic development. How will it affect carbon emission? With the extension of the study period and the update of data, this topic is worthy of further research.
Data Availability Statement
The raw data supporting the conclusion of this article will be made available by the authors without undue reservation.
Author Contributions
Conceptualization: K-LW; writing—original draft: R-YX; data curation: R-YX and F-QZ; supervision: K-LW and Y-HC.
Conflict of Interest
The authors declare that the research was conducted in the absence of any commercial or financial relationships that could be construed as a potential conflict of interest.
The reviewer (JW) declared a shared affiliation with the author (YC) to the handling editor at the time of review.
Publisher’s Note
All claims expressed in this article are solely those of the authors and do not necessarily represent those of their affiliated organizations, or those of the publisher, the editors, and the reviewers. Any product that may be evaluated in this article, or claim that may be made by its manufacturer, is not guaranteed or endorsed by the publisher.
Acknowledgments
We sincerely acknowledge the financial support provided by the National Natural Science Foundation of China (Nos. 71973131, 71973132, and 71403003) and Major Project of National Social Science Foundation of China (No. 19VHQ002).
References
Ali, R., Bakhsh, K., and Yasin, M. A. (2019). Impact of Urbanization on CO2 Emissions in Emerging Economy: Evidence from Pakistan. Sust. Cities Soc. 48, 101553. doi:10.1016/j.scs.2019.101553
Anser, M. K., Ahmad, M., Khan, M. A., Zaman, K., Nassani, A. A., Askar, S. E., et al. (2021). The Role of Information and Communication Technologies in Mitigating Carbon Emissions: Evidence from Panel Quantile Regression. Environ. Sci. Pollut. Res. 28, 21065–21084. doi:10.1007/s11356-020-12114-y
Cai, B., Guo, H., Cao, L., Guan, D., and Bai, H. (2018). Local Strategies for China's Carbon Mitigation: An Investigation of Chinese City-Level CO2 Emissions. J. Clean. Prod. 178, 890–902. doi:10.1016/j.jclepro.2018.01.054
Cai, A., Zheng, S., Cai, L., Yang, H., and Comite, U. (2021). How Does Green Technology Innovation Affect Carbon Emissions? A Spatial Econometric Analysis of China’s Provincial Panel Data. Front. Environ. Sci. 9, 813811. doi:10.3389/fenvs.2021.813811
Chen, J., Gao, M., Mangla, S. K., Song, M., and Wen, J. (2020). Effects of Technological Changes on China's Carbon Emissions. Technol. Forecast. Soc. Change 153, 119938. doi:10.1016/j.techfore.2020.119938
Chen, Z., Shu, W., Guo, H., and Pan, C. (2021). The Spatial Characteristics of Sustainable Development for Agricultural Products E-Commerce at County-Level: Based on the Empirical Analysis of China. Sustainability 13, 6557. doi:10.3390/su13126557
Chuai, X., and Feng, J. (2019). High Resolution Carbon Emissions Simulation and Spatial Heterogeneity Analysis Based on Big Data in Nanjing City, China. Sci. Total Environ. 686, 828–837. doi:10.1016/j.scitotenv.2019.05.138
Dagum, C. (1997). A New Approach to the Decomposition of the Gini Income Inequality Ratio. Empirical Econ. 22, 515–531. doi:10.1007/bf01205777
Dong, F., Dai, Y., Zhang, S., Zhang, X., and Long, R. (2019a). Can a Carbon Emission Trading Scheme Generate the Porter Effect? Evidence from Pilot Areas in China. Sci. Total Environ. 653, 565–577. doi:10.1016/j.scitotenv.2018.10.395
Dong, F., Wang, Y., Su, B., Hua, Y., and Zhang, Y. (2019b). The Process of Peak CO2 Emissions in Developed Economies: A Perspective of Industrialization and Urbanization. Resour. Conservation Recycling 141, 61–75. doi:10.1016/j.resconrec.2018.10.010
Dong, K., Hochman, G., and Timilsina, G. R. (2020). Do drivers of CO2 Emission Growth Alter Overtime and by the Stage of Economic Development? Energy Policy 140, 111420. doi:10.1016/j.enpol.2020.111420
Du, Q., Deng, Y., Zhou, J., Wu, J., and Pang, Q. (2022). Spatial Spillover Effect of Carbon Emission Efficiency in the Construction Industry of China. Environ. Sci. Pollut. Res. 29, 2466–2479. doi:10.1007/s11356-021-15747-9
Eggleston, H., Buendia, L., Miwa, K., Ngara, T., and Tanabe, K. (2006). 2006 IPCC Guidelines for National Greenhouse Gas Inventories.
Essandoh, O. K., Islam, M., and Kakinaka, M. (2020). Linking International Trade and Foreign Direct Investment to CO2 Emissions: Any Differences between Developed and Developing Countries? Sci. Total Environ. 712, 136437. doi:10.1016/j.scitotenv.2019.136437
Gao, P., Yue, S., and Chen, H. (2021). Carbon Emission Efficiency of China's Industry Sectors: From the Perspective of Embodied Carbon Emissions. J. Clean. Prod. 283, 124655. doi:10.1016/j.jclepro.2020.124655
Han, F., and Xie, R. (2017). Does the Agglomeration of Producer Services Reduce Carbon Emissions. J. Quantitative Tech. Econ. 3, 40. (in Chinese).
Han, X., Yu, J., Xia, Y., and Wang, J. (2021). Spatiotemporal Characteristics of Carbon Emissions in Energy-Enriched Areas and the Evolution of Regional Types. Energ. Rep. 7, 7224–7237. doi:10.1016/j.egyr.2021.10.097
Huang, F., Zhou, D., Wang, Q., and Hang, Y. (2019a). Decomposition and Attribution Analysis of the Transport Sector's Carbon Dioxide Intensity Change in China. Transportation Res. A: Pol. Pract. 119, 343–358. doi:10.1016/j.tra.2018.12.001
Huang, Q., Yu, Y., and Zhang, S. (2019b). Internet Development and Productivity Growth in Manufacturing Industries: Internal Mechanism and China Experiences. China Ind. Econ. 8, 5–23. (in Chiinese).
Huang, H., Hong, J., Wang, X., Chang-Richards, A., Zhang, J., and Qiao, B. (2022). A Spatiotemporal Analysis of the Driving Forces behind the Energy Interactions of the Chinese Economy: Evidence from Static and Dynamic Perspectives. Energy 239, 122104. doi:10.1016/j.energy.2021.122104
Huang, Y., and Matsumoto, K. i. (2021). Drivers of the Change in Carbon Dioxide Emissions under the Progress of Urbanization in 30 Provinces in China: A Decomposition Analysis. J. Clean. Prod. 322, 129000. doi:10.1016/j.jclepro.2021.129000
Karmellos, M., Kosmadakis, V., Dimas, P., Tsakanikas, A., Fylaktos, N., Taliotis, C., et al. (2021). A Decomposition and Decoupling Analysis of Carbon Dioxide Emissions from Electricity Generation: Evidence from the EU-27 and the UK. Energy 231, 120861. doi:10.1016/j.energy.2021.120861
Lefever, D. W. (1926). Measuring Geographic Concentration by Means of the Standard Deviational Ellipse. Am. J. Sociol. 32, 88–94. doi:10.1086/214027
Li, J., and Li, S. (2020). Energy Investment, Economic Growth and Carbon Emissions in China-Empirical Analysis Based on Spatial Durbin Model. Energy Policy 140, 111425. doi:10.1016/j.enpol.2020.111425
Liu, B., Shi, J., Wang, H., Su, X., and Zhou, P. (2019a). Driving Factors of Carbon Emissions in China: A Joint Decomposition Approach Based on Meta-Frontier. Appl. Energ. 256, 113986. doi:10.1016/j.apenergy.2019.113986
Liu, H., Nie, J., Cai, B., Cao, L., Wu, P., Pang, L., et al. (2019b). CO2 Emissions Patterns of 26 Cities in the Yangtze River Delta in 2015: Evidence and Implications. Environ. Pollut. 252, 1678–1686. doi:10.1016/j.envpol.2019.06.102
Liu, H., Wang, C., Tian, M., and Wen, F. (2019c). Analysis of Regional Difference Decomposition of Changes in Energy Consumption in China during 1995-2015. Energy 171, 1139–1149. doi:10.1016/j.energy.2019.01.067
Liu, Q., Wu, S., Lei, Y., Li, S., and Li, L. (2021). Exploring Spatial Characteristics of City-Level CO2 Emissions in China and Their Influencing Factors from Global and Local Perspectives. Sci. Total Environ. 754, 142206. doi:10.1016/j.scitotenv.2020.142206
Ma, X., Dong, B., Wang, C., Gu, G., Chen, R., Li, Y., et al. (2019). Carbon Emissions from Energy Consumption in China: Its Measurement and Driving Factors. Sci. Total Environ. 648, 1411–1420. doi:10.1016/j.scitotenv.2018.08.183
Ma, Q., Murshed, M., and Khan, Z. (2021). The Nexuses between Energy Investments, Technological Innovations, Emission Taxes, and Carbon Emissions in China. Energy Policy 155, 112345. doi:10.1016/j.enpol.2021.112345
Moran, P. A. P. (1950). Notes on Continuous Stochastic Phenomena. Biometrika 37, 17–23. doi:10.1093/biomet/37.1-2.17
Ord, J. K., and Getis, A. (1995). Local Spatial Autocorrelation Statistics: Distributional Issues and an Application. Geographical Anal. 27, 286–306. doi:10.1111/j.1538-4632.1995.tb00912.x
Pu, Z., Yue, S., and Gao, P. (2020). The Driving Factors of China's Embodied Carbon Emissions. Technol. Forecast. Soc. Change 153, 119930. doi:10.1016/j.techfore.2020.119930
Ren, X., Liu, Y., and Zhao, G. (2020). The Impact and Transmission Mechanism of Economic Agglomeration on Carbon Intensity. Chin. J. Popul. Resour. Environ. 30, 95–106. (in Chinese). doi:10.1007/s11769-020-1149-5
Salvia, M., Reckien, D., Pietrapertosa, F., Eckersley, P., Spyridaki, N.-A., Krook-Riekkola, A., et al. (2021). Will Climate Mitigation Ambitions lead to Carbon Neutrality? an Analysis of the Local-Level Plans of 327 Cities in the EU. Renew. Sust. Energ. Rev. 135, 110253. doi:10.1016/j.rser.2020.110253
Sharma, R., Sinha, A., and Kautish, P. (2021). Does Renewable Energy Consumption Reduce Ecological Footprint? Evidence from Eight Developing Countries of Asia. J. Clean. Prod. 285, 124867. doi:10.1016/j.jclepro.2020.124867
Shen, L., Wu, Y., Lou, Y., Zeng, D., Shuai, C., and Song, X. (2018). What Drives the Carbon Emission in the Chinese Cities?-A Case of Pilot Low Carbon City of Beijing. J. Clean. Prod. 174, 343–354. doi:10.1016/j.jclepro.2017.10.333
Shen, W., Liang, H., Dong, L., Ren, J., and Wang, G. (2021). Synergistic CO2 Reduction Effects in Chinese Urban Agglomerations: Perspectives from Social Network Analysis. Sci. Total Environ. 798, 149352. doi:10.1016/j.scitotenv.2021.149352
Song, Y., Zhang, M., and Shan, C. (2019). Research on the Decoupling Trend and Mitigation Potential of CO2 Emissions from China's Transport Sector. Energy 183, 837–843. doi:10.1016/j.energy.2019.07.011
Sun, H., Edziah, B. K., Kporsu, A. K., Sarkodie, S. A., and Taghizadeh-Hesary, F. (2021). Energy Efficiency: The Role of Technological Innovation and Knowledge Spillover. Technol. Forecast. Soc. Change 167, 120659.
Wang, J. F., Li, X. H., Christakos, G., Liao, Y. L., Zhang, T., Gu, X., et al. (2010). Geographical Detectors-Based Health Risk Assessment and its Application in the Neural Tube Defects Study of the Heshun Region, China. Int. J. Geographical Inf. Sci. 24, 107–127. doi:10.1080/13658810802443457
Wang, J.-F., Zhang, T.-L., and Fu, B.-J. (2016). A Measure of Spatial Stratified Heterogeneity. Ecol. Indicators 67, 250–256. doi:10.1016/j.ecolind.2016.02.052
Wang, S., Shi, C., Fang, C., and Feng, K. (2019). Examining the Spatial Variations of Determinants of Energy-Related CO2 Emissions in China at the City Level Using Geographically Weighted Regression Model. Appl. Energ. 235, 95–105. doi:10.1016/j.apenergy.2018.10.083
Wang, K. L., Xu, R. Y., Zhang, F. Q., Miao, Z., and Peng, G. (2021). Spatiotemporal Heterogeneity and Driving Factors of PM2.5 Reduction Efficiency: An Empirical Analysis of Three Urban Agglomerations in the Yangtze River Economic Belt, China. ECOLOGICAL INDICATORS 132. 108308 doi:10.1016/j.ecolind.2021.108308
Wang, Q., and Jiang, R. (2019). Is China's Economic Growth Decoupled from Carbon Emissions? J. Clean. Prod. 225, 1194–1208. doi:10.1016/j.jclepro.2019.03.301
Wang, Q., and Zhang, F. (2020). Does Increasing Investment in Research and Development Promote Economic Growth Decoupling from Carbon Emission Growth? an Empirical Analysis of BRICS Countries. J. Clean. Prod. 252, 119853. doi:10.1016/j.jclepro.2019.119853
Wang, Y., and Zheng, Y. (2021). Spatial Effects of Carbon Emission Intensity and Regional Development in China. Environ. Sci. Pollut. Res. 28, 14131–14143. doi:10.1007/s11356-020-11557-7
Wei, Y., Zhu, X., Li, Y., Yao, T., and Tao, Y. (2019). Influential Factors of National and Regional CO2 Emission in China Based on Combined Model of DPSIR and PLS-SEM. J. Clean. Prod. 212, 698–712. doi:10.1016/j.jclepro.2018.11.155
Wei, W., Zhang, P., Yao, M., Xue, M., Miao, J., Liu, B., et al. (2020). Multi-scope Electricity-Related Carbon Emissions Accounting: A Case Study of Shanghai. J. Clean. Prod. 252, 119789. doi:10.1016/j.jclepro.2019.119789
Wu, L., Sun, L., Qi, P., Ren, X., and Sun, X. (2021). Energy Endowment, Industrial Structure Upgrading, and CO2 Emissions in China: Revisiting Resource Curse in the Context of Carbon Emissions. Resour. Pol. 74, 102329. doi:10.1016/j.resourpol.2021.102329
Xie, R., Fang, J., and Liu, C. (2017). The Effects of Transportation Infrastructure on Urban Carbon Emissions. Appl. Energ. 196, 199–207. doi:10.1016/j.apenergy.2017.01.020
Xu, B., and Lin, B. (2019). Can Expanding Natural Gas Consumption Reduce China's CO2 Emissions? Energ. Econ. 81, 393–407. doi:10.1016/j.eneco.2019.04.012
Xu, B., and Lin, B. (2021). Investigating Spatial Variability of CO2 Emissions in Heavy Industry: Evidence from a Geographically Weighted Regression Model. Energy Policy 149, 112011. doi:10.1016/j.enpol.2020.112011
Xu, L., Du, H., and Zhang, X. (2021). Driving Forces of Carbon Dioxide Emissions in China's Cities: An Empirical Analysis Based on the Geodetector Method. J. Clean. Prod. 287, 125169. doi:10.1016/j.jclepro.2020.125169
Yang, X., Jia, Z., Yang, Z., and Yuan, X. (2021). The Effects of Technological Factors on Carbon Emissions from Various Sectors in China-A Spatial Perspective. J. Clean. Prod. 301, 126949. doi:10.1016/j.jclepro.2021.126949
Yang, Z., Yu, L., Liu, Y., Yin, Z., and Xiao, Z. (2022a). Financial Inclusion and Carbon Reduction: Evidence from Chinese Counties. Front. Environ. Sci. 9, 793221. doi:10.3389/fenvs.2021.793221
Yang, Z., Yuan, Y., and Zhang, Q. (2022b). Carbon Emission Trading Scheme, Carbon Emissions Reduction and Spatial Spillover Effects: Quasi-Experimental Evidence from China. Front. Environ. Sci. 9, 824298. doi:10.3389/fenvs.2021.824298
Zhan, D., Kwan, M.-P., Zhang, W., Yu, X., Meng, B., and Liu, Q. (2018). The Driving Factors of Air Quality index in China. J. Clean. Prod. 197, 1342–1351. doi:10.1016/j.jclepro.2018.06.108
Zhang, X., and Zhao, Y. (2018). Identification of the Driving Factors' Influences on Regional Energy-Related Carbon Emissions in China Based on Geographical Detector Method. Environ. Sci. Pollut. Res. 25, 9626–9635. doi:10.1007/s11356-018-1237-6
Zhang, W., Li, G., Uddin, M. K., and Guo, S. (2020). Environmental Regulation, Foreign Investment Behavior, and Carbon Emissions for 30 Provinces in China. J. Clean. Prod. 248, 119208. doi:10.1016/j.jclepro.2019.119208
Zhang, Y., Pan, J., Zhang, Y., and Xu, J. (2021). Spatial-temporal Characteristics and Decoupling Effects of China's Carbon Footprint Based on Multi-Source Data. J. Geogr. Sci. 31, 327–349. doi:10.1007/s11442-021-1839-7
Zhang, Y., Yu, Z., and Zhang, J. (2022). Research on Carbon Emission Differences Decomposition and Spatial Heterogeneity Pattern of China’s Eight Economic Regions. Environ. Sci. Pollut. Res., 1–17. doi:10.1007/s11356-021-17935-z
Zhao, G., Geng, Y., Sun, H., and Zhao, G. (2020). Spatial Effects and Transmission Mechanism of Inter-provincial Carbon Emission Intensity in China. China Popul. Resour. Environ. 30, 49–55.
Zhou, D., Zhou, F., and Wang, X. (2019a). Impact of Low-Carbon Pilot Policy on the Performance of Urban Carbon Emissions and its Mechanism. Resour. Sci. 41, 546–556. (in Chinese).
Zhou, Y., Liu, W., Lv, X., Chen, X., and Shen, M. (2019b). Investigating interior Driving Factors and Cross-Industrial Linkages of Carbon Emission Efficiency in China's Construction Industry: Based on Super-SBM DEA and GVAR Model. J. Clean. Prod. 241, 118322. doi:10.1016/j.jclepro.2019.118322
Keywords: urban carbon emissions, spatiotemporal differences, driving factors, geographical detector model, interaction
Citation: Wang K-L, Xu R-Y, Zhang F-Q and Cheng Y-H (2022) Reinvestigating the Spatiotemporal Differences and Driving Factors of Urban Carbon Emission in China. Front. Environ. Sci. 10:880527. doi: 10.3389/fenvs.2022.880527
Received: 21 February 2022; Accepted: 10 March 2022;
Published: 06 April 2022.
Edited by:
Huaping Sun, Jiangsu University, ChinaReviewed by:
Mian Yang, Wuhan University, ChinaJianmin Wang, Anhui University of Science and Technology, China
Licheng Sun, Jiangsu University, China
Copyright © 2022 Wang, Xu, Zhang and Cheng. This is an open-access article distributed under the terms of the Creative Commons Attribution License (CC BY). The use, distribution or reproduction in other forums is permitted, provided the original author(s) and the copyright owner(s) are credited and that the original publication in this journal is cited, in accordance with accepted academic practice. No use, distribution or reproduction is permitted which does not comply with these terms.
*Correspondence: Ke-Liang Wang, klwang@163.com; Yun-He Cheng, yhcheng@aust.edu.cn
 Ke-Liang Wang
 Ru-Yu Xu1