Catchment properties as predictors of greenhouse gas concentrations across a gradient of boreal lakes
 Nicolas Valiente1,2
  Alexander Eiler1
  Lina Allesson1
  Tom Andersen1
  François Clayer3
  Camille Crapart4
  Peter Dörsch5 Laurent Fontaine1
  Jan Heuschele1
  Rolf D. Vogt3 Jing Wei1
  Heleen A. de Wit1,3
  Dag O. Hessen1*
- 1Centre for Biogeochemistry in the Anthropocene, Department of Biosciences, Section for Aquatic Biology and Toxicology, University of Oslo, Oslo, Norway
- 2Division of Terrestrial Ecosystem Research, Center of Microbiology and Environmental Systems Science, University of Vienna, Vienna, Vienna, Austria
- 3Norwegian Institute for Water Research (NIVA), Oslo, Norway
- 4Centre for Biogeochemistry in the Anthropocene, Department of Chemistry, University of Oslo, Oslo, Norway
- 5Faculty of Environmental Sciences and Natural Resource Management, Norwegian University of Life Sciences, Aes, Norway
Boreal lakes are the most abundant lakes on Earth. Changes in acid rain deposition, climate, and catchment land use have increased lateral fluxes of terrestrial dissolved organic matter (DOM), resulting in a widespread browning of boreal freshwaters. This browning affects the aqueous communities and ecosystem processes, and boost emissions of the greenhouse gases (GHG) CH4, CO2, and N2O. In this study, we predicted biotic saturation of GHGs in boreal lakes by using a set of chemical, hydrological, climate, and land use parameters. For this purpose, concentrations of GHGs and nutrients (organic C, -P, and -N) were determined in surface water samples from 73 lakes in south-eastern Norway covering wide ranges in DOM and nutrient concentrations, as well as catchment properties and land use. The spatial variation in saturation of each GHG is related to explanatory variables. Catchment characteristics (hydrological and climate parameters) such as lake size and summer precipitation, as well as NDVI, were key determinants when fitting GAM models for CH4 and CO2 saturation (explaining 71 and 54%, respectively), while summer precipitation and land use data were the best predictors for the N2O saturation, explaining almost 50% of deviance. Our results suggest that lake size, precipitation, and terrestrial primary production in the watershed control the saturation of GHG in boreal lakes. These predictions based on the 73-lake dataset was validated against an independent dataset from 46 lakes in the same region. Together, this provides an improved understanding of drivers and spatial variation in GHG saturation in boreal lakes across wide gradients of lake and catchment properties. The assessment highlights the need to incorporate multiple explanatory parameters in prediction models of GHGs for extrapolation across the boreal biome.
1 Introduction
Boreal ecosystems are expected to be among the most affected biomes by climate change (Ruckstuhl et al., 2008). Regarding inland waters, boreal lakes are the most abundant lakes on Earth (Schindler, 1998). These lakes receive high loading of allochthonous dissolved organic matter (DOM) from the catchment (Dillon and Molot, 1997; Tranvik et al., 2009). As such, these lakes are crucial biogeochemical reactors: on the one hand, they sequester DOM by burial into lake sediments, while on the other hand, they are generally net heterotrophic and act as major conduits for greenhouse gas (GHGs) emissions (Hessen et al., 1990, 2017; Bastviken et al., 2004; Tranvik et al., 2009; Yang et al., 2015; de Wit et al., 2018).
In boreal watercourses the lateral fluxes of colored DOM have increased during the past 2–3 decades, mainly due to reduced deposition of acid rain (de Wit et al., 2007; Monteith et al., 2007), climate change (Mattsson et al., 2005), afforestation and land use changes (Palviainen et al., 2016; Škerlep et al., 2020). The increasing DOM is causing a widespread “browning” of these freshwater ecosystems (Finstad et al., 2016). In the boreal biome, changing climate will result in increased precipitation and runoff (Tranvik et al., 2009). In some regions of the northern hemisphere, like Fennoscandia (the common term for Finland, Norway and Sweden) in general, the proportion of forest cover has increased, leading to larger biomass pools (Fang et al., 2014). This increase in terrestrial biomass (“greening”) has boosted the amount of allochthonous DOM that may be entering into surface waters (Larsen et al., 2011b), with increased rainfall and runoff further enhancing DOM catchment export (Tranvik et al., 2009; de Wit et al., 2016). Browning strongly affects light attenuation (Karlsson et al., 2009; Thrane et al., 2014; Allesson et al., 2021), nutrient dynamics (Dillon and Molot, 2005; Creed et al., 2018) and thus also primary productivity (Solomon et al., 2015; Hessen et al., 2017; Lau et al., 2021). The combined effect of increased DOM and increased light attenuation implies a decrease in photosynthesis, thus promoting the heterotrophy of these systems and the net emissions of GHGs derived from microbial mineralization of DOM (Yang et al., 2015).
A number of studies have addressed the main drivers of carbon dioxide (CO2) and methane (CH4) concentrations in boreal lakes, and how they are linked to DOM and lake productivity (Huttunen et al., 2003b; Bastviken et al., 2004; Juutinen et al., 2009; de Wit et al., 2018; Jahr, 2021) as well as catchment properties (Huttunen et al., 2003b; Li et al., 2020). Fewer studies have addressed nitrous oxide (N2O) in boreal lakes. N2O is an intermediate in the nitrification and denitrification (Trogler, 1999; Butterbach-Bahl et al., 2013) whose production depends on the availability of organic matter (OM), oxygen availability, and reactive nitrogen concentration (Yang et al., 2015; Kortelainen et al., 2020; Clayer et al., 2021). Hydrological parameters, such as lake size or runoff, have been recognized as key underlying factors determining which are the main biogeochemical C processes that are governing the production of GHGs (Jones et al., 2018). In the boreal zone, small lakes have been shown to have relatively higher sedimentation and GHG emission rates than larger lakes (Juutinen et al., 2009; Kankaala et al., 2013). Typically, small lakes are also characterized by higher concentrations of allochthonous OM (Xenopoulos et al., 2003; Einola et al., 2011) and shorter water residence times (Vachon et al., 2017). The residence time has also a strong influence on the quality of DOM. The longer the residence time, the more refractory the DOM becomes, and thus the proportion of C sequestered in the sediments increases relative to what is released as CO2 or CH4 (den Heyer and Kalff, 1998). Most of this production is microbial, yet for all gases the concentrations and emissions are also affected by uptake and conversions by methanogens, denitrifiers, and autotrophs, but also by abiotic factors affecting microbial activity (i.e., temperature, redox conditions). These biotic processes are labelled biogenic and, therefore, traceable (Jones and Grey, 2011). For CO2, the concentrations will also be affected by other processes as photooxidation and in cases also inputs from tributaries and groundwater, yet integrated over the water column of boreal lakes, the biogenic activities generally are by far the most important (Hessen et al., 1990; Larsen et al., 2011a; Allesson et al., 2021).
The goal of this study was to model biotic saturation of GHGs in boreal lakes by using a set of chemical, hydrological, climate, and land use parameters. To date, only a limited number of studies have explored the influence of such factors in GHG saturations from boreal lakes. For this reason, we constructed predictive models for GHG saturation from this survey performed in 2019 (73 lakes) and tested them against an independent dataset of 46 lakes sampled from the epilimnion of lakes in mid-summer 2011 by somewhat different protocols but covering a similar area of southern Norway (Yang et al., 2015). This validation by an independent dataset is a novel take, and both these datasets differ from previous studies on basically lowland sites by encompassing an unusual range in DOM, from very clear, ultraoligotrophic alpine lakes to really brown lowland sites, surrounded by bogs and coniferous forests. The wide span in catchment properties is also reflected in the strong gradient in forest cover, precipitation and temperatures, helping to sort out the relative contribution from these potential drivers on the various GHGs. We tested the hypothesis that differences in GHG saturation can be predicted by water chemistry, catchment properties (hydrological and climate parameters), and land use variables. This approach aids to better predict the effect of on GHG emissions from pristine boreal lakes in climate change scenarios by combining well standardized watershed variables.
2 Material and methods
2.1 Field survey
Surface water samples were collected during autumn 2019 from 73 lakes in south-eastern Norway. This lake survey was conducted by the Centre for Biogeochemistry in the Anthropocene (CBA) at University of Oslo, hence these lakes are labelled “CBA dataset” hereafter. The lakes were selected as a subset of lakes monitored in a concomitant 1000-lake survey of the whole of Norway, conducted by the Norwegian Institute of Water research (NIVA). This synoptic survey repeated previous campaigns conducted in 1986 and 1995 (Henriksen et al., 1998). The CBA dataset span a wide range of water quality properties (e.g., DOM, nutrients) (Crapart et al., 2021), catchment properties, and land use (Lie, 2021). Sampling was performed in late fall, during or after lake overturn. Samples were collected approximately 4 m from the shore by means of a sampling rod with a sampling beaker. Composite water (≈2 L) was collected in a sampling bucket, with as minimal physical disturbance. Where feasible, the outlet of the lake was used as a sampling point. Due to logistical reasons, this was the only feasible way to sample all the lakes of this study. The lake edge may be more responsive to external inputs (i.e., precipitation, sunlight), likely acting more as a hotspot for GHG turnover compared to deeper sections of the lake. However, we believe that such bias is compensated in our models by including watershed hydrological characteristics (Section 2.4). In general, we assume that in these quite wind-exposed lakes, the gases are equally distributed in the epilimnion, but in sites with ebullition from the deepest part, we cannot exclude a non-homogenous distribution. In order to validate the models calibrated using the CBA dataset, a second dataset was used. This dataset, referred as COMSAT hereafter, includes 46 large southern Norwegian lakes sampled in the middle of the lakes by hydroplane in July and August 2011 (Thrane et al., 2014; Yang et al., 2015; Andersen et al., 2020). The selection of lakes was done with different constraints like size (>2 km2) or water pH (>5), as detailed previously (Thrane et al., 2014). The locations of the lakes sampled in both campaigns are shown in Figure 1.
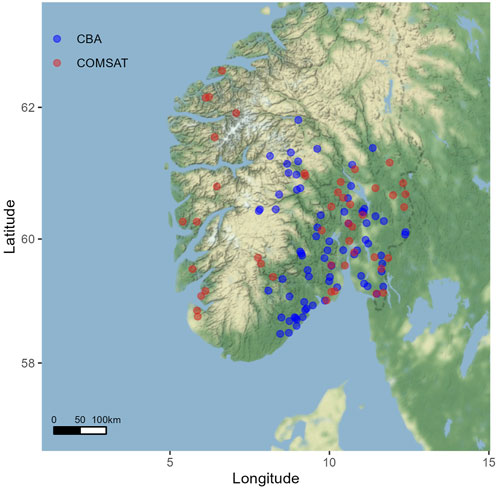
FIGURE 1. Lakes included in CBA (n = 73) and COMSAT (n = 46) surveys.
2.2 Chemical analysis
Water temperature (T), pH, and electrical conductivity (EC) were measured at the CBA lakes immediately after sample collection. From each site, 50 ml of unfiltered water was collected and stored at 10°C in polypropylene tubes. Upon arrival at the laboratory, these samples were frozen at −20°C until total organic carbon (TOC), total nitrogen (TN), and total phosphorus (TP) determination at the University of Oslo. TOC was measured by infrared CO2 detection after catalytic high temperature combustion (Shimadzu TOC-VWP analyzer). TN was measured by detecting nitrogen monoxide by chemiluminescence using a TNM-1 unit attached to the Shimadzu TOC-VWP analyzer. TP was measured on an auto-analyzer as phosphate after wet oxidation with peroxodisulfate. We here use TOC as a proxy of DOM since this is by far the dominant constituent of DOM. By mass DOM is equivalent of DOC, and DOC make typically up some 95% of TOC in these boreal, low-productivity lakes (Larsen et al., 2011a; 2011b).
Concentrations of dissolved Argon (Ar), O2, N2, CH4, CO2, and N2O were determined in duplicate for each lake water sample using the acidified headspace technique (Åberg and Wallin, 2014). From the surface of each lake, a volume of 30 ml was carefully collected directly into a syringe instead of collecting from the bucket to avoid potential disturbances (e.g., outgassing). Subsequently, a 20 ml headspace was created with atmospheric air in each syringe, before 0.6 ml of 3% HCl (≈1 M) was added. Syringes were closed and equilibrium was reached in the headspace at field temperature by shaking them for 3 min. Finally, 15 ml of the headspace gas was transferred into 12 ml evacuated vials and kept at room temperature until further analysis. Gas concentrations were determined at the Norwegian University of Life Sciences by automated gas chromatography (GC) analysis following the methodology outlined by Yang et al. (2015). In brief, 2 ml of headspace gas were sampled (autosampler GC-Pal, CTC, Switzerland) and injected into a GC with He back-flushing (Agilent 7890A, Santa Clara, CA, United States). The GC was equipped with a 20-m wide-bore (0.53 mm) Poraplot Q column operated at 38°C and with He as carrier gas for separation of CH4, CO2, and N2O from bulk gases (i.e., Ar, N2, and O2). N2O and CH4 were measured with an electron capture detector (ECD) operating at 375°C, and a flame ionization detector (FID), respectively. All other gases were measured with a thermal conductivity detector (TCD). Certified standards of CO2, N2O, and CH4 in He were used for calibration (AGA, Germany), whereas N2, O2, and Ar were calibrated against air. The analytical precision for all gases was better than 1%.
2.3 Biogenic GHG saturation
Saturation relative to atmospheric equilibrium was calculated for all gases. For this purpose, Henry’s law constants for 25°C were temperature adjusted to in situ water temperatures using the Clausius–Clapeyron equation with gas-specific solution enthalpies (Sander, 2015). Concentrations of GHGs in equilibrium with the atmosphere were calculated using the temperature adjusted Henry’s law constants. The concentrations of GHGs in the surface water of the lakes were normalized relative to the concentration of dissolved Argon (Ar). Unlike Ar, which in water is only controlled by physical processes, O2, N2, CH4, CO2 and N2O concentrations in water governed by both physical and biogenic processes (Aeschbach-Hertig et al., 1999). For this reason, the relative saturation of GHGs normalized to Ar was used as a proxy for the saturation of the biogenically derived lake GHG turnover (Yang et al., 2015). Thus, unless otherwise specified, hereafter the variables CH4, CO2 and N2O are mentioned to refer to the normalized relative saturations of each GHG. A similar approach was used for the gas data collected during the COMSAT campaign (Thrane et al., 2014).
2.4 Catchment characteristics: Hydrological and climate parameters
Lake Altitude (in meters above sea level, m a.s.l.), lake surface (LakeArea in km2), and catchment surface (CatchmentArea in km2) were obtained using the “Lake database” (https://temakart.nve.no/tema/innsjodatabase) from the Norwegian Water Resources and Energy Directorate (NVE, https://www.nve.no). Drainage ratio (Drainage) was calculated as the ratio between catchment area and lake surface area, both in km2. Lake depth (LakeDepth in m) was measured from an Airbus AS350 helicopter with an echosounder held within the top 0.5 m of the lake water column above the expected deepest point (Hindar et al., 2020). The remaining hydrological and climate parameters were compiled from the “NEVINA” database provided by the NVE (http://nevina.nve.no/). These were: specific runoff (Runoff in L s−1 km−2); average inclination in the watershed (Slope in %); average annual air temperature (AnnualT in °C); average air temperature during the summer period (01/05–30/09) (SummerT in °C); average air temperature during the winter period (01/10–30/04) (WinterT in °C); average annual precipitation (AnnualP in mm); average precipitation during the summer period (SummerP in mm); and average precipitation during the winter period (WinterP in mm). Water residence time (Residence in yr) was estimated for each catchment from lake surface, lake depth, catchment surface, and specific runoff by assuming a cone-shaped morphometry for all lakes (Lindström et al., 2005).
2.5 Land use coverage
Land use data for each catchment were obtained from the Copernicus Land Monitoring Service (CLMS), using CORINE Land Cover (CLC) databases 2018 and 2012, for CBA and COMSAT, respectively (see (Feranec et al., 2007) for further details). In the CLC database the land use is classified into seven categories: agricultural areas (Cultivated), forested areas (Forest), human-derived and artificial impervious areas (Artificial), open areas with little or no vegetation (Fell), areas covered by glaciers and perpetual snow (Glacier), inland wetland areas (Peatland), and inland waterbodies in the watershed, including lake’s surface itself (Waterbodies). The CLC databases were clipped and intersected with the catchment areas using the open-source software QuantumGIS (QGIS, version 3.20.1). The area covered by the different land use types were calculated as percentage of the total surface using QGIS field calculator. In addition, the average Normalized Difference Vegetation Index (NDVI) value was calculated for each catchment and year (2019 and 2011, for CBA and COMSAT, respectively) using the average values of the summer months (June, July, and August) obtained from Copernicus data (https://land.copernicus.eu/global/products/NDVI).
2.6 Statistical analysis
Data analysis was performed using the open-source software R version 4.1.0 (R Core Team, 2021). The package raster (Hijmans et al., 2015) was used to obtain average NDVI values per catchment. To determine significant differences in dissolved gas concentrations between CBA and COMSAT datasets, the Mann-Whitney test was used at a significance level of p < 0.05. Variables were checked for normality using the bestNormalize package (Peterson, 2021) and transformed to logarithmic, exponential, or square root where needed to reduce heteroscedasticity and obtain normally distributed residuals. However, variables were not standardized (i.e., mean centering and scaling) as comparisons of rescaled coefficients across datasets are problematic (King, 1986). A detailed list with the applied transformations is listed in the Supplementary Table S1. Once the transformations were performed, correlations were calculated using Spearman’s correlation coefficients. In addition, principal component analysis (PCA) was performed for dimension reduction. This analysis was followed by K-means clustering. This non-hierarchical clustering method aims to partition the studied variables into k groups such that the sum of squares from points to the assigned cluster centres is minimized. Variation partitioning (function varpart in vegan package) (Oksanen et al., 2013) was used to evaluate the percentage of variance in biogenic GHG saturations that were in these clusters. Statistical modelling was carried out using the mgcv package (Wood and Wood, 2015) by fitting generalized additive models (GAM) to predict selected dependent variables (CH4, CO2, and N2O). The selection of the predictive variable in the GAM models was performed by applying additional shrinkage on the null space of the penalty (select = TRUE argument in the mgcv:gam function) (Marra and Wood, 2011). To compare the contribution of each factor in explaining the total deviance of the model, we also formulated reduced models where we removed one of the terms at a time, as well as a null model. To be able to compare deviances, we fixed the smoothing parameters to the original model containing all terms (sp argument in the mgcv:gam function) and then calculated the contribution of each factor in the model as described previously (Ribic et al., 2010).
3 Results
3.1 Greenhouse gases
Across CBA lakes, the median surface concentrations of Ar, N2, and O2 were 19.8, 735, and 397 μmol/L, respectively. For GHGs, median concentrations were 0.10, 75.5, and 0.02 μmol/L for CH4, CO2, and N2O, respectively (Figure 2A). GHG concentrations ranged widely across the CBA lakes, with CH4 having a greater relative variability (CV = 183%) than N2O (CV = 158%) and CO2 (CV = 82.5%). On the contrary, Ar, N2, and O2 showed smaller coefficients of relative variation (7.6, 6.7, and 7.0%, respectively). The biogenic gas saturations were low for O2 (median = 96.7%) and N2 (median = 101%), while they were high for the GHGs: N2O (median = 115%), CO2 (median = 263%), and CH4 (median = 2248%) (Figure 2B).
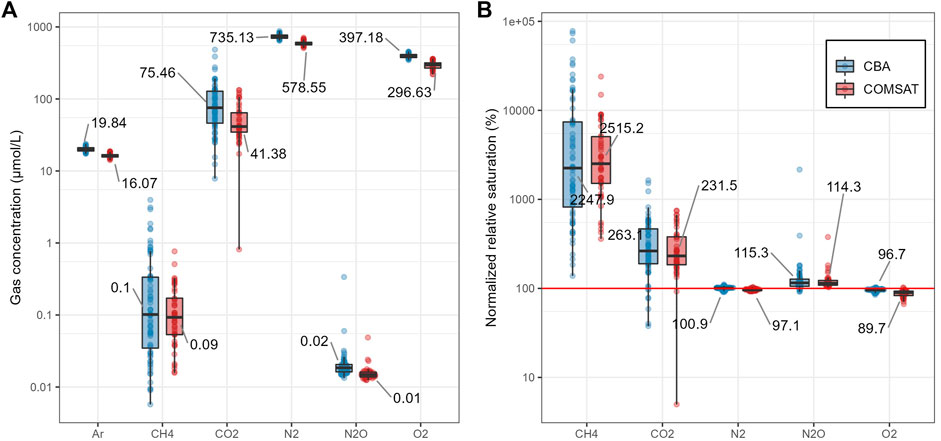
FIGURE 2. Surface water gas concentrations (A) and gas saturations (B) for CBA (blue) and COMSAT (red) datasets. Vertical axis are on a 10-base logarithmic scale. Data labels show median values for gas concentrations and saturations.
There were significant differences between all gas concentrations in the CBA data and the COMSAT datasets (p < 0.05, Mann-Whitney), except for CH4 (p = 0.50) (Figure 2A). However, by comparing the relative biogenic gas saturations between both datasets, significant differences were found only for N2 and O2 (p < 0.05) (Figure 2B). The saturations of the biogenically derived CH4 (p = 0.74), CO2 (p = 0.42), and N2O (p = 0.86) did not differ statistically between the two datasets.
3.2 Chemical-, catchment- and land use data
Besides varying in pH (4.4–7.9) and conductivity (0.39–151 μS/cm), CBA lakes varied widely in TOC from 2.54 to 116 mg/L (median = 13.3 mg/L), TN from 0.05 to 1.07 mg/L (median = 0.27 mg/L), and TP from 3.0 to 48.5 μg/L (median = 8.90 μg/L). A complete description of the chemical data can be found in the Supplementary Figure S1.
Catchment and Lake sizes varied from 0.02 to 369 km2 (median = 0.93 km2) and from 0.48 to 16,530 km2 (median = 11.0 km2), respectively. Drainage ratios varied from 2.76 to 405.8 (median = 24.6). The depths of the lakes ranged from 0.60 to 333 m (median = 12.0 m) and they are located at altitudes between 4 and 1,151 m a.s.l. (median = 190 m a.s.l.). Watershed slopes varied between 0.9 and 18.3% (median = 7.8%), while runoff values ranged from 8.0 to 41.8 L s−1 km−2 (median = 18.1 L s−1 km−2). Estimated water residence times varied widely from 0.01 to 7.4 years (median = 0.29 years). Detailed information about the catchment variables is provided in the Supplementary Figure S2.
Most of the sampling sites in the CBA survey are first order lakes receiving drainage from pristine catchments. Forest was the main dominating land use type the watersheds (Forest, median = 83.7%), followed by inland waterbodies (Waterbodies; median = 3.7%) and agricultural land (Cultivated; median = 1.2%). Although generally comprising minor fractions of the catchment, peats and bogs (Peatland) and human-derived impervious surfaces (Artificial) reached coverages of up to 40.2 and 32.0%, respectively, in single catchments (see Supplementary Figure S3).
3.3 Explorative statistical analyses
Multivariate statistical analysis was performed on the transformed variables from the CBA dataset in order to explore whether the saturation of the biogenically derived GHGs significantly differed among explanatory variable groups. PCA of the transformed variables showed that 13 components were needed to explain 95% of the variance, with the first three components accounting for 59.1% of the total variance (30.0, 16.8, and 12.3%, respectively). Subsequent K-means clustering analysis revealed three main groups of explanatory variables (Figure 3). The purpose of K-Means analysis is to group variables by minimizing data similarity between clusters, while maximizing data similarity within each cluster.
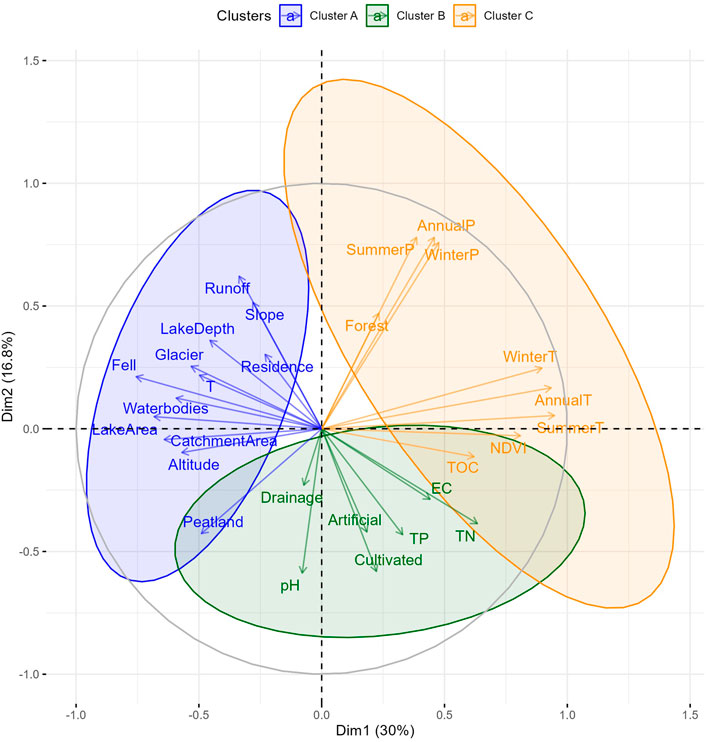
FIGURE 3. PCA analysis of the transformed variables depicting the two main principal components (PC) of parameter loading with the three defined clusters labeled in blue, green and orange (Clusters A, B and C, respectively). The two PCA axes explain 36.8% of total variability in the dataset.
Cluster A (within the blue circle in Figure 3) includes water temperature measured during sampling (T) and non-forested land use (Waterbodies, Peatland, Fell, and Glacier), along with catchment physical properties (CatchmentArea, LakeArea and LakeDepth, Altitude, Residence, Slope, and Runoff). Cluster B (within the green circle in Figure 3) contains the water physicochemical parameters (pH and EC), nutrients (TN and TP), the coverage of Artificial and Cultivated land use types, as well as the Drainage ratio. Cluster C parameters (orange circle in Figure 3) are the biotic-related variables (Forest coverage, NDVI, and TOC) as well as climate factors in the watershed (temperature and precipitation).
Spearman rank-correlation analyses, using log transformed variables, provided information about internal correlation between the variables within the clusters, but also with the biogenic GHGs. Biogenic CH4 normalized saturation was negatively correlated with lake size (LakeArea; R = −0.78; p < 0.001), watershed size (CatchmentArea; R = −0.70; p < 0.001), and lake depth (LakeDepth; R = −0.50; p = 0.003), whereas it was positively correlated with air temperature in the catchment (AnnualT; R = 0.55; p < 0.001) and NDVI (R = 0.61; p < 0.001). NDVI was positively correlated with average air temperature (AnnualT; R = 0.69; p < 0.001) (reflecting the altitude gradient) and thus Forest cover (R = 0.53; p < 0.001), whereas it was less negatively correlated with the percentage of water in the catchment (Waterbodies; R = −0.54; p < 0.001). The percentage of water in the watershed was also negatively correlated with the biogenic CO2 normalized saturation (R = −0.49; p = 0.004), and as expected, positively correlated with lake size (LakeArea; R = 0.75; p < 0.001) and catchment size (CatchmentArea; R = 0.64; p < 0.001). Spearman’s correlation plots are provided in Supplementary Figure S4.
Variation partitioning analyses (VPA) with transformed variables were carried out to assess relative contributions of the variables, grouped into the above defined clusters, to the biotic saturations of GHGs (Supplementary Figure S5). The combination of these variables explained 65.8% of the observed variation in biotic CH4 saturation (Supplementary Figure S5A). The VPA showed that 38.1% of the total variation was shared between Cluster A, related mainly to catchment physical properties, and Cluster C, related to biotic and climate factors. Cluster A alone explained a large proportion of the variation (22.5%). The variance of biotic CO2 saturation that could be explained by combining the whole set of variables was 39.7% (Supplementary Figure S5B). The largest explanatory value was shared by the three clusters (18.6%), explaining alone 4.4% (Cluster A) and 2.2% (Cluster B). Only 18.3% of the total variation of N2O saturation was explained by the three clusters, with the variables within Cluster B providing most of the explanatory value to the spatial variation in biogenic N2O saturation (11.4%) (Supplementary Figure S5C). This approach seems to be useful for CH4 saturation. However, the high residuals observed for CO2 and N2O saturation makes the VPA not so informative about the contribution of each cluster to the total variation.
3.4 Modeling biogenic CH4 saturation
Based on the explorative analyses (i.e., PCA, correlation, and VPA analyses), a stepwise selection was done to fit a GAM model (Model 1) to the transformed (i.e., log) normalized relative CH4 saturation by minimizing the residual deviance. Lake surface (LakeArea; log), NDVI (exp) and average summer precipitation (SummerP; sqrt) were selected as independent variables, explaining 71.1% of the total variance with a
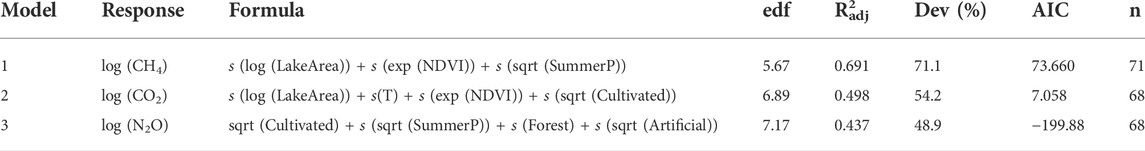
TABLE 1. Results of the generalized additive models (GAMs) calculated for biogenic saturation of CH4, CO2, and N2O using both linear terms and smoothers (indicated with s before the variable). Edf: effective degrees of freedom. R2adj: R-squared adjusted for the number of predictors in the model. Dev: deviance explained by each model in %. AIC: Akaike information criterion.
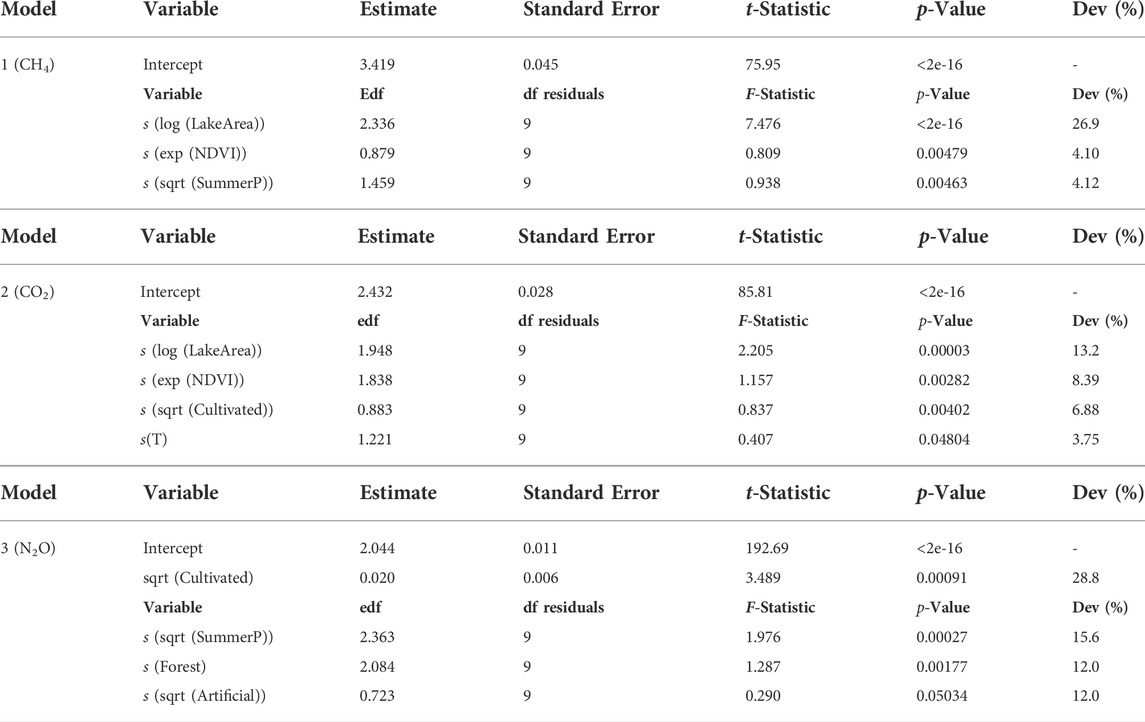
TABLE 2. Output of each generalized additive models (GAM). Edf: effective degrees of freedom. Dev: deviance explained by each factor of the model in %.
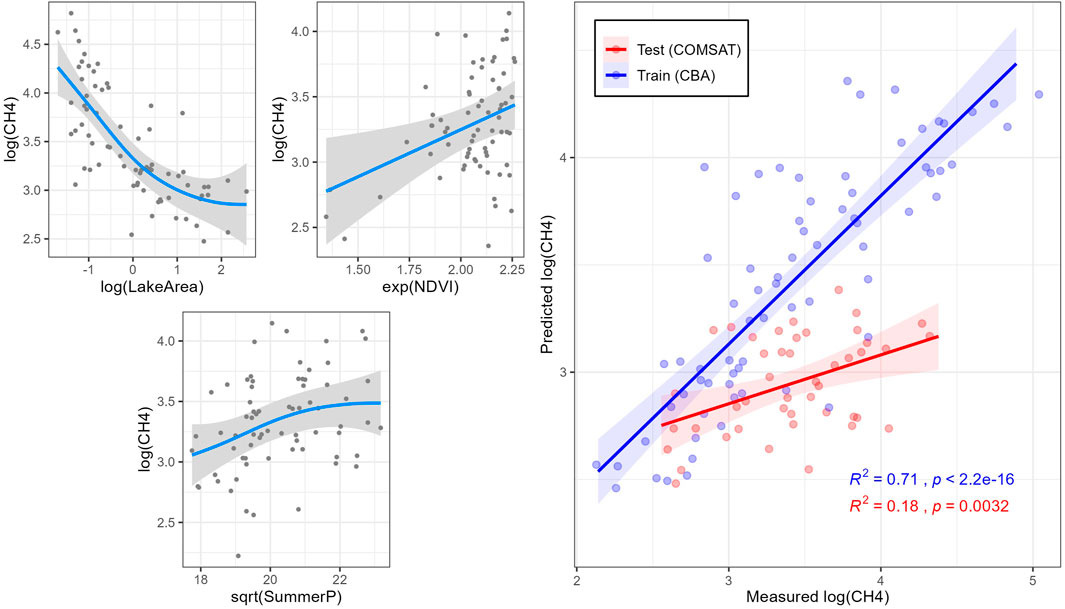
FIGURE 4. Simulations (blue lines) of normalized relative CH4 saturations in the CBA dataset by generalized additive model (GAM) 1. On the right side, model training with CBA dataset (red) and test with COMSAT dataset (blue) for each model. Shaded gray areas indicate 95% confidence intervals.
3.5 Modeling biogenic CO2 saturation
A second GAM model (Model 2) was fitted to the normalized relative CO2 saturation (in log) following the approach described above. A deviance of 54.2% (
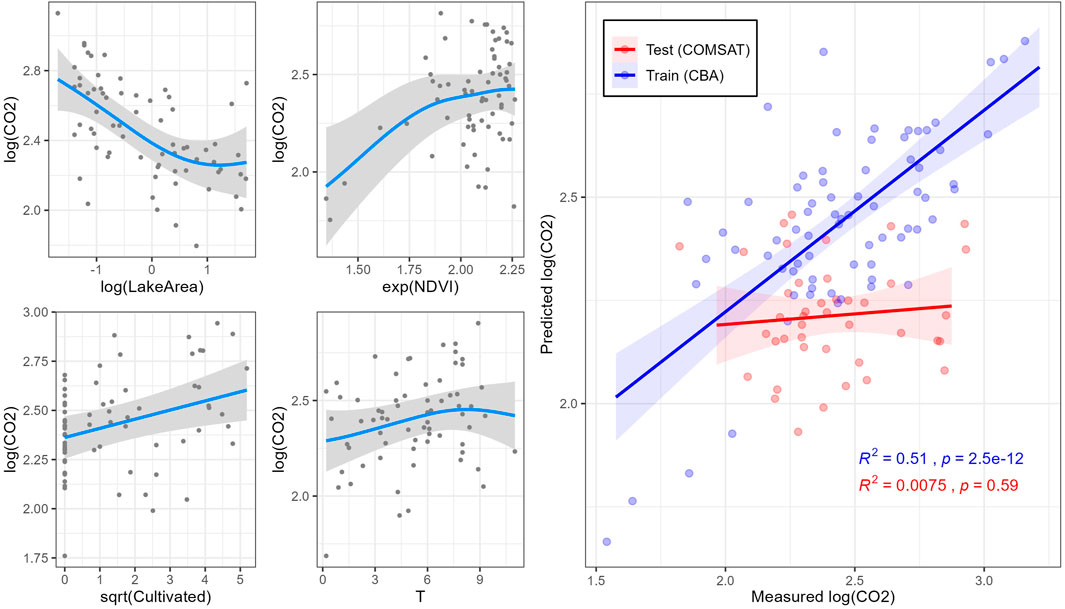
FIGURE 5. Simulations (blue lines) of normalized relative CO2 saturations in the CBA dataset by generalized additive model (GAM) 2. On the right side, model training with CBA dataset (red) and test with COMSAT dataset (blue) for each model. Shaded gray areas indicate 95% confidence intervals.
3.6 Modeling biogenic N2O saturation
Differences in normalized N2O saturation (48.9%) were predicted by fitting a GAM model (Model 3) including as independent variables agricultural area (Cultivated; sqrt), average summer Precipitation (SummerP; sqrt), Forest area (Forest) and impervious land (Artificial; sqrt) (
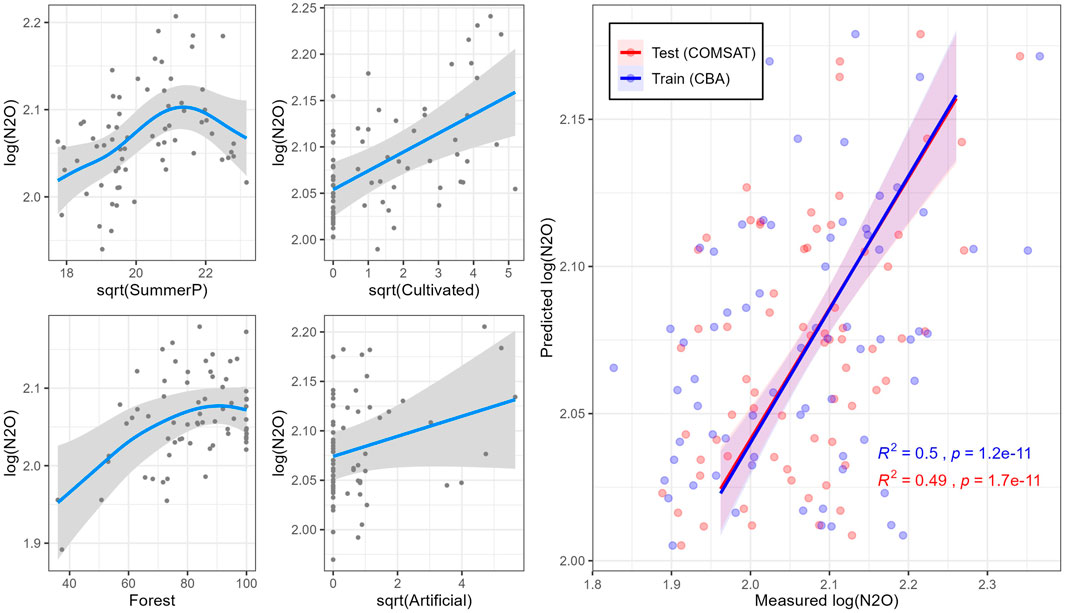
FIGURE 6. Simulations (blue lines) of normalized relative N2O saturations in the CBA dataset by generalized additive model (GAM) 3. On the right side, model training with CBA dataset (red) and test with COMSAT dataset (blue) for each model. Shaded gray areas indicate 95% confidence intervals.
4 Discussion
4.1 Greenhouse gas saturation
The biogenic GHG saturation levels were in close accordance to those reported for boreal lakes in COMSAT dataset (Yang et al., 2015). The biogenic oversaturation of CH4, CO2, and N2O demonstrated a substantial impact of biogenic processes on GHG concentrations (Figure 2B). Methanogenesis and denitrification are microbially-mediated processes, which are affected by physical (e.g., temperature, rainfall) and chemical (e.g., nutrients) levels in the lake (Roland et al., 2017; Peña Sanchez et al., 2022). The well oxygenated waters of the study lakes (median = 96.7%, Figure 2B) are likely to constrain methanogenesis and promote methanotrophy in most of the water column. Still a pronounced CH4 oversaturation (median = 2248%) was found, reflecting a pronounced methanogenesis in deep waters and sediments. In small lakes (<1 km2), convective mixing in the epilimnion and deepening of the mixing layer may be the main mechanism transporting CH4 to lake surface layers (Kankaala et al., 2013). Prior studies in small boreal lakes have noted the importance of convective cooling of water masses in autumn, where CH4 effluxes exceed CH4 oxidation in the water column (Kankaala et al., 2006). This is a possible explanation for the observed results, as our survey was conducted in autumn and 37 of the 73 lakes (51%) are classified as small. In large lakes (>1 km2), CH4 can be originated from shallow epilimnetic sediments (Bastviken et al., 2008) and be transported laterally from the littoral/riparian zone and the catchment area (López Bellido et al., 2013). It is important to bear in mind the possible bias in large lakes, as the sampling was performed from the littoral zone (Section 2.1). Nevertheless, the consistency between these datasets are noteworthy, even if the COMSAT lakes were sampled in the middle of the lakes in contrast to the littoral sampling of the current (CBA) dataset.
CO2 exchange is mainly governed by biotic processes, specifically by the balance between photosynthesis and respiration. In boreal lakes, CO2 oversaturation is to a large degree an effect of microbial respiration boosted by allochthonous C (Hessen et al., 1990), regulated by factors like catchment area or residence time (Larsen et al., 2011a). Our results showed CO2 oversaturation in the CBA survey (median = 263.1%, Figure 2B) similar to those observed in the COMSAT survey (median = 231.5%). The lakes from the CBA survey were located in catchments dominated by coniferous forests, primarily spruce and pine. The positive correlation between CO2 saturation and TOC concentrations (R = 0.3; p < 0.001) (Supplementary Figure S4) suggests in-lake CO2 production by TOC mineralization. These results are in line with previous studies (Kortelainen et al., 2006; Whitfield et al., 2011). In addition, a positive correlation was found between CO2 saturation and TN concentrations (R = 0.36; p < 0.001) (Supplementary Figure S4). Primary production in boreal lakes can be promoted by N availability (Elser et al., 2009). Nutrients also boost microbial activity, and our data demonstrate that boreal lakes generally retain net heterotrophy in spite of nutrient loading and potentially high primary production, in support of Huttunen et al. (2003a). These positive correlations with TOC and TN suggest the transport of bioavailable OM from catchment soils to lakes and in-lake breakdown of DOM is a main driver for dissolved CO2 (Sobek et al., 2003; Whitfield et al., 2011). Furthermore, lateral export of DIC from soils to aquatic environments may contribute to lake CO2 (Öquist et al., 2009; Vachon et al., 2017). In boreal catchments, DIC may derive from the dissolution of soil CO2 as well as from mineral weathering (Nydahl et al., 2020). Water pH may regulate the CO2 concentration by keeping a large proportion of the DIC as free CO2 at low pH values, which in turn depends on the input of humic acids (Nydahl et al., 2019). Our results followed this trend, with a weak negative correlation between CO2 saturation and pH (R = -0.21; p > 0.001) (Supplementary Figure S4).
Consistent with the literature (Huttunen et al., 2003a; Whitfield et al., 2011; Yang et al., 2015; Kortelainen et al., 2020), our research found N2O oversaturation, but lower than CH4 and CO2. While being relatively low, the oversaturation of N2O (median = 115.3%, Figure 2B) reflects the potential of boreal lakes as to act a net source for N2O due to nitrification and denitrification processes. A positive correlation was found between N2O saturation and TOC concentrations (R = 0.35; p < 0.001) (Supplementary Figure S4). Since DOM (or TOC) mainly derives from allochthonous sources, it suggests that N2O concentration also depends on the transport of bioavailable OM from catchment soils. N2O saturation in boreal lakes has been generally associated with agricultural land in the watershed (Kortelainen et al., 2020). Our results support this by a strong correlation between N2O saturation and agricultural land cover (Cultivated) (R = 0.32; p < 0.001), but also with artificial impervious areas (Artificial) (R = 0.3; p < 0.001) (Supplementary Figure S4). In lakes, N2O production and emissions is boosted by atmospheric N-deposition (Yang et al., 2015), as well as nitrate load from land to lakes (Huttunen et al., 2003b). This latter flux may be enhanced in the boreal landscape by rising temperatures leading to earlier floods due to snow melt (Blöschl et al., 2017) and consequent transport of nitrates to surface waters (Kortelainen et al., 2020).
4.2 Hydrological and climate determinants of GHG saturation
The generalized additive models (GAMs) calculated for biogenic saturation of GHG included either or both hydrological (LakeArea) and climate (SummerP, T) parameters as explanatory variables (Table 1). Variation partitioning analyses indicated that hydrological parameters had the greatest contribution to biogenic CH4 saturation (22.5%, Supplementary Figure S5A), supporting earlier studies (Kankaala et al., 2013; Li et al., 2020). In that sense, lake size (LakeArea) was the main explanatory factor for the spatial differences in biogenic CH4 saturation (26.9% of the total deviance; Table 2), further supporting evidence from previous studies (Bastviken et al., 2004; Juutinen et al., 2009; Kankaala et al., 2013; Holgerson, 2015; Denfeld et al., 2020; Jahr, 2021). Biogenic CH4 saturation level was negatively correlated with lake surface (LakeArea; Figure 4). This result may be explained by the fact that small lakes have a high perimeter/surface area ratio, which means that they receive relatively higher loads of allochthonous DOM relative to water volume (Holgerson and Raymond, 2016). The increased contribution of allochthonous DOM promotes microbial metabolism (Tranvik, 1998; Forsström et al., 2013). Therefore, littoral sediments can play a major role in increasing pelagic lacustrine CH4 due to horizontal mixing in the surface layer (Juutinen et al., 2003; Rasilo et al., 2015; Bartosiewicz et al., 2016). This is also supported by the negative correlation found between log (CH4) and log (LakeDepth) in (R = −0.50; Supplementary Figure S4). As stated, our sampling strategy may involve some bias in the results for large lakes. Lake size was also included as variable in the CO2 saturation model (GAM model 2), showing a negative correlation between both (Figure 5). LakeArea explained 13.2% of the total deviance (Table 2) and was the sole catchment parameter included in the model (Figure 5). Compared to the CH4 model, this predictor explained less deviance (22.5 vs. 13.2%) but it was still the strongest predictor in the model (Table 2). Our CO2 model 2 predicted higher CO2 saturations in lakes with smaller surface areas (LakeArea), in line with previous studies showing significantly higher CO2 emissions in small lakes (Kortelainen et al., 2006), most likely as a result of increasing lateral OM fluxes (de Wit et al., 2018).
As climate parameters, the average precipitation during the summer period (SummerP) was selected as independent variable in the CH4 model (Model 1; Table 1). It explained 4.12% of the total deviance (Table 2), showing a positive correlation to the variation in biogenic CH4 saturation (Figure 4). Summer precipitation was orthogonal to the loading vectors, reflecting lake size within Cluster A (i.e., LakeArea, CatchmentArea, and LakeDepth; Figure 3).
Precipitation boosted GHG-production (cf. Model 3; Table 1), and more so for CH4 than for N2O saturation (Table 2 and Figure 6). These results are in line with previous studies showing that increased precipitation is associated with larger allochthonous DOM inputs to lakes (Rantakari and Kortelainen, 2005; Natchimuthu et al., 2014). For the CO2 saturation model (Model 2; Table 1), water temperature (T) was included as explanatory variable showing a positive correlation (Figure 5). By itself, it explained 3.75% of the total deviance (Table 2), being the only model where T was selected. Water temperature reflects on the seasonal changes in air temperature. It also strongly affects microbial metabolism and promotes mineralization in lake sediments (Gudasz et al., 2010). However, this trend may be the opposite depending on the season of the year in which sampling is performed because of phytoplankton activity (Tadonléké et al., 2012). Since the CBA sampling was conducted in late fall, close to lake overturn, we can rule out CO2 uptake by phytoplankton as a main driver.
The stepwise selection of variables for the GAM models highlighted the importance of catchment characteristics (hydrological and climate parameters) in predicting biogenic GHG saturation from boreal lakes. In fact, both LakeArea and SummerP may be understood as proxies for water residence time in the watershed. Previous studies have noted that mineralization capacity of lakes at the catchment scale was closely correlated to the mean residence time of surface water in the watershed (Algesten et al., 2004). An inverse relationship between the rate of OM decay (i.e., biogenic CH4 production) and residence time have been reported (Catalán et al., 2016). In that sense, higher decomposition rates are found in systems with short residence times, as a result of the constant renewal of the labile organic pool (Jones et al., 2018). Headwaters can be considered as hotspots for OM processing as they receive fresh allochthonous OM. Thus, the lability of the allochthonous OM decreases along the aquatic continuum (Clayer et al., 2021). Our results are consistent with those previous studies. Although our estimated water residence times (Residence) were not included as explanatory variables in the GAM models, significant negative correlations were found between Residence and normalized CH4 saturation (R = −0.34; p < 0.001), and normalized N2O saturation (R = −0.27; p < 0.001) (Supplementary Figure S4). Using TOC as proxy for OM inputs, the negative correlation observed between TOC and Residence (R = −0.25; p < 0.001) (Supplementary Figure S4) points to residence time as a key driver. This also implies that changes in precipitation and runoff also will affect GHG-metabolism in lakes via this mechanism.
4.3 The influence of terrestrial primary production on GHG saturations
Variables related to primary production in the catchment were also included in the generalized additive models (GAMs) calculated for biogenic saturation of GHG. In general, higher GHG saturations were found coupled to higher values of the primary production proxies in the catchment (i.e., NDVI, Cultivation and Forest cover). NDVI was selected as explanatory variable for CH4 and CO2 saturation models (Table 1). CH4 model (Model 1) ranked NDVI as the third most explanatory variable (4.10% of the total deviance; Table 2), while it accounted for a higher deviance in the CO2 model (8.39% of the total deviance; Table 2). NDVI is a proxy for terrestrial vegetation and primary production. NDVI was strongly correlated with TOC, AnnualT, and Forest cover (R of 0.43, 0.69, and 0.53, respectively; p < 0.001) (Supplementary Figure S4). Previous studies have shown a close link between NDVI in the watershed and levels of DOM/TOC in the runoff, suggesting that leachates from terrestrial primary production of litterfall are a major source of OM in boreal lakes (Larsen et al., 2011a; Finstad et al., 2016; Škerlep et al., 2020). The wide gradient of catchment NDVI and lake DOM is our studied lakes clearly reveals that the supply of allochthonous OM stimulates heterotrophic metabolism resulting in higher CH4 and CO2 saturations, which is observed in both models (Figures 4, 5).
Cultivation coverage was included in both CO2 and N2O saturation models (Table 1). It explained 6.88 and 28.8% of the total deviance explained in CO2 and N2O models, respectively (Table 2). The positive correlation between the agricultural land cover (Cultivated) and CO2 concentrations in boreal lakes has been pointed out previously (Kortelainen et al., 2006), likely reflecting inputs of easily degradable DOM (Crapart et al., 2021) as well as nutrient loads from croplands (Rantakari and Kortelainen, 2005). For N2O saturation, a positive correlation between N2O saturation and agricultural land cover has previously been reported previously for boreal lakes (Kortelainen et al., 2020). Our research shows that agricultural land cover and TN are positively correlated (R = 0.54; p < 0.001) (Supplementary Figure S4). N from fertilizers applied in the watershed are microbially processed in lakes, producing N2O as by-product of both nitrification and denitrification. N2O saturation model (Model 3; Table 1) also included Forest and Artificial, explaining respectively 12.0 and 12.0% of the total deviance (Table 2). Higher proportions of these uses were associated with higher N2O saturations in lake waters (Figure 6). Likewise, Forest and/or Artificial land cover seems to be associated with DOM inputs into lakes (Mattsson et al., 2005; Pellerin et al., 2006; Finstad et al., 2016), promoting processes such as denitrification (Liu et al., 2015). In forest dominated areas from the boreal landscape, soil N seems to leach from catchment soils directly into the lakes in form of nitrate (Khalili et al., 2010), which can be denitrified giving N2O as a by-product.
4.4 Evaluation of biogenic GHG saturation models
Given the major role of boreal lakes for GHG-emissions (Tranvik et al., 2009), accurate models are needed to better predict biogenic GHG saturations in lakes across the boreal landscape. In that sense, our GAM models were tested on the independent COMSAT dataset. Despite COMSAT lakes were all sampled in the middle of the lakes, our results showed that the datasets are basically consistent. In fact, the COMSAT lakes tend to be a bit lower in GHGs, which can be attributed to a somewhat larger area. The major levels and patterns in saturation of the three GHGs was basically consistent between the two datasets. In decreasing order, the trained models had the highest testing success for N2O > CH4 > CO2. The N2O model (Model 3; Table 1) was validated using COMSAT dataset, obtaining similar results as those obtained when using the training dataset (CBA) (Figure 6). The relatively low deviance explained by Model 3 (48.9%) probably reflects the low variability in biogenic N2O concentrations, as well as the lack of likely key governing factors for the in lake biogeochemical N2O production, such as N-deposition (Pregitzer et al., 2008; McCrackin and Elser, 2010; Kortelainen et al., 2013).
Despite the consistency in patterns and levels of saturation between the two independent datasets, the CH4 saturation model (Model 1; Table 1) showed a poor correlation between predicted and measured biogenic CH4 saturations with the COMSAT dataset (
Also the CO2 saturation model (Model 2; Table 1) showed only weak correlation between predicted and measured biogenic CO2 saturation in the COMSAT dataset (
These findings show the difficulties in achieving good models for predicting GHG saturations in boreal lakes. When modeling, increasing the number of variables used in the models may increase the variance explained, but complicate the interpretation and application of the models. Within the CBA dataset, we achieved robust predictions. Despite the patterns and levels of GHGs saturations are consistent between the two datasets, the generation of robust models predicting GHGs demands multiple explanatory parameters, including size and seasonality.
5 Conclusion
The purpose of the current study was to model biotic saturation of GHGs in boreal lakes by using a set of chemical, hydrological, climate, and land use parameters. Our models were trained on a dataset of boreal lakes (n = 73) sampled in 2019 and then validated with an additional dataset of boreal lakes (n = 46) sampled in 2011. Both these datasets encompass an extraordinary gradient in altitude, precipitation, temperature and not the least their content of organic matter, and allowed us to tease apart various drivers. We find that: i) hydrological and climate parameters are key drivers for predicting GHG saturation; ii) the influence of external OM inputs (i.e., terrestrial) plays a key role in biogeochemical cycling. Most of the variation in biogenic CH4 saturation was explained by lake size: the larger the lake, the lower the CH4 saturation. On the contrary, summer precipitation and NDVI exhibited a positive correlation with CH4 saturation. Biogenic CO2 saturation was mainly explained by lake size (negative correlation) followed by NDVI, proportion of cultivated area, and water temperature (positive correlation in all of them). For biogenic N2O saturation, the differences in land use (cultivated, forest, and artificial area) were the strongest predictors showing a positive correlation, as well as summer precipitation. The insights given by our extraordinary range of catchment and lakes variables provides new insights in drivers of GHG-production in boreal lakes, which again improve predictions of impacts of climate change and human activities. The comparison of two independent datasets, and using one as a training dataset for model prediction, nevertheless demonstrate that predicting GHGs demands multiple explanatory parameters, including seasonality, for generation robust models.
Data availability statement
The datasets presented in this study can be found in online repositories. The names of the repository/repositories and accession number(s) can be found below: https://osf.io/r39ng/?view_only=e9a3b3de84794bfc9883db481cb9a483.
Author contributions
NV, AE, and DH conceived the idea. All authors were involved in either fieldwork and/or sample analysis, in the analysis of data and final writing. All authors contributed to the article and approved the submitted version.
Funding
The work has been funded by CBA, as well as EU-BioDiversa/Belmont Forum and The Research Council of Norway within ARCTIC-BIODIVER project (“Scenarios of freshwater biodiversity and ecosystem services in a changing Arctic”). University of Oslo provides funding for open access publication.
Acknowledgments
This study was carried out thanks to close cooperation between researchers from the Centre for Anthropocene Biogeochemistry (CBA, University of Oslo) and the Norwegian Institute for Water Research (NIVA). The authors acknowledge all of the participants involved in the CBA-100 lakes survey, NIVA for providing depth data, and especially to Per-Johan Færøvig and Berit Kaasa for their support with practicality issues in the labs.
Conflict of interest
The authors declare that the research was conducted in the absence of any commercial or financial relationships that could be construed as a potential conflict of interest.
Publisher’s note
All claims expressed in this article are solely those of the authors and do not necessarily represent those of their affiliated organizations, or those of the publisher, the editors and the reviewers. Any product that may be evaluated in this article, or claim that may be made by its manufacturer, is not guaranteed or endorsed by the publisher.
Supplementary material
The Supplementary Material for this article can be found online at: https://www.frontiersin.org/articles/10.3389/fenvs.2022.880619/full#supplementary-material
References
Åberg, J., and Wallin, B. (2014). Evaluating a fast headspace method for measuring DIC and subsequent calculation of pCO2 in freshwater systems. Inland Waters 4, 157–166. doi:10.5268/IW-4.2.694
Aeschbach-Hertig, W., Peeters, F., Beyerle, U., and Kipfer, R. (1999). Interpretation of dissolved atmospheric noble gases in natural waters. Water Resour. Res. 35, 2779–2792. doi:10.1029/1999WR900130
Algesten, G., Sobek, S., Bergström, A.-K., Ågren, A., Tranvik, L. J., and Jansson, M. (2004). Role of lakes for organic carbon cycling in the boreal zone. Glob. Chang. Biol. 10, 141–147. doi:10.1111/j.1365-2486.2003.00721.x
Allesson, L., Koehler, B., Thrane, J.-E., Andersen, T., and Hessen, D. O. (2021). The role of photomineralization for CO 2 emissions in boreal lakes along a gradient of dissolved organic matter. Limnol. Oceanogr. 66, 158–170. doi:10.1002/lno.11594
Andersen, T., Hessen, D. O., Håll, J. P., Khomich, M., Kyle, M., Lindholm, M., et al. (2020). Congruence, but no cascade—pelagic biodiversity across three trophic levels in nordic lakes. Ecol. Evol. 10, 8153–8165. doi:10.1002/ece3.6514
Bartosiewicz, M., Laurion, I., Clayer, F., and Maranger, R. (2016). Heat-wave effects on oxygen, nutrients, and phytoplankton can alter global warming potential of gases emitted from a small shallow lake. Environ. Sci. Technol. 50, 6267–6275. doi:10.1021/acs.est.5b06312
Bastviken, D., Cole, J., Pace, M., and Tranvik, L. (2004). Methane emissions from lakes: Dependence of lake characteristics, two regional assessments, and a global estimate. Glob. Biogeochem. Cycles 18, 2238. doi:10.1029/2004GB002238
Bastviken, D., Cole, J. J., Pace, M. L., and Van de Bogert, M. C. (2008). Fates of methane from different lake habitats: Connecting whole-lake budgets and CH4 emissions. J. Geophys. Res. 113, 608. doi:10.1029/2007JG000608
Blöschl, G., Hall, J., Juraj, P., Perdigão Rui, A. P., Bruno, M., Berit, A., et al. (2017). Changing climate shifts timing of European floods. Science 357, 588–590. doi:10.1126/science.aan2506
Butterbach-Bahl, K., Baggs, E. M., Dannenmann, M., Kiese, R., and Zechmeister-Boltenstern, S. (2013). Nitrous oxide emissions from soils: How well do we understand the processes and their controls? Phil. Trans. R. Soc. B 368, 20130122. doi:10.1098/rstb.2013.0122
Catalán, N., Marcé, R., Kothawala, D. N., and Tranvik, Lars. J. (2016). Organic carbon decomposition rates controlled by water retention time across inland waters. Nat. Geosci. 9, 501–504. doi:10.1038/ngeo2720
Clayer, F., Thrane, J.-E., Brandt, U., Dörsch, P., and de Wit, H. A. (2021). Boreal headwater catchment as hot spot of carbon processing from headwater to fjord. JGR. Biogeosciences 126, e2021JG006359. doi:10.1029/2021JG006359
Crapart, C., Andersen, T., Hessen, D. O., Valiente, N., and Vogt, R. D. (2021). Factors governing biodegradability of dissolved natural organic matter in lake water. Water 13, 2210. doi:10.3390/w13162210
Creed, I. F., Bergström, A.-K., Trick, C. G., Grimm, N. B., Hessen, D. O., Karlsson, J., et al. (2018). Global change-driven effects on dissolved organic matter composition: Implications for food webs of northern lakes. Glob. Chang. Biol. 24, 3692–3714. doi:10.1111/gcb.14129
de Wit, H. A., Mulder, J., Hindar, A., and Hole, L. (2007). Long-term increase in dissolved organic carbon in streamwaters in Norway is response to reduced acid deposition. Environ. Sci. Technol. 41, 7706–7713. doi:10.1021/es070557f
de Wit, H. A., Valinia, S., Weyhenmeyer, G. A., Futter, M. N., Kortelainen, P., Austnes, K., et al. (2016). Current browning of surface waters will Be further promoted by wetter climate. Environ. Sci. Technol. Lett. 3, 430–435. doi:10.1021/acs.estlett.6b00396
de Wit, H. A., Couture, R.-M., Jackson-Blake, L., Futter, M. N., Valinia, S., Austnes, K., et al. (2018). Pipes or chimneys? For carbon cycling in small boreal lakes, precipitation matters most. Limnol. Oceanogr. Lett. 3, 275–284. doi:10.1002/lol2.10077
den Heyer, C., and Kalff, J. (1998). Organic matter mineralization rates in sediments: A within- and among-lake study. Limnol. Oceanogr. 43, 695–705. doi:10.4319/lo.1998.43.4.0695
Denfeld, B. A., Lupon, A., Sponseller, R. A., Laudon, H., and Karlsson, J. (2020). Heterogeneous CO2 and CH4 patterns across space and time in a small boreal lake. Inland Waters 10, 348–359. doi:10.1080/20442041.2020.1787765
Dillon, P. J., and Molot, L. A. (1997). Effect of landscape form on export of dissolved organic carbon, iron, and phosphorus from forested stream catchments. Water Resour. Res. 33, 2591–2600. doi:10.1029/97WR01921
Dillon, P. J., and Molot, L. A. (2005). Long-term trends in catchment export and lake retention of dissolved organic carbon, dissolved organic nitrogen, total iron, and total phosphorus: The Dorset, Ontario, study, 1978–1998. J. Geophys. Res. 110, G01002. doi:10.1029/2004JG000003
Einola, E., Rantakari, M., Kankaala, P., Kortelainen, P., Ojala, A., Pajunen, H., et al. (2011). Carbon pools and fluxes in a chain of five boreal lakes: A dry and wet year comparison. J. Geophys. Res. 116, G03009. doi:10.1029/2010JG001636
Elser, J., Andersen, T., Baron Jill, S., Ann-Kristin, B., Mats, J., Marcia, K., et al. (2009). Shifts in lake N:P stoichiometry and nutrient limitation driven by atmospheric nitrogen deposition. Science 326, 835–837. doi:10.1126/science.1176199
Fang, J., Guo, Z., Hu, H., Kato, T., Muraoka, H., and Son, Y. (2014). Forest biomass carbon sinks in East Asia, with special reference to the relative contributions of forest expansion and forest growth. Glob. Chang. Biol. 20, 2019–2030. doi:10.1111/gcb.12512
Feranec, J., Hazeu, G., Christensen, S., and Jaffrain, G. (2007). Corine land cover change detection in Europe (case studies of The Netherlands and Slovakia). Land Use Policy 24, 234–247. doi:10.1016/j.landusepol.2006.02.002
Finstad, A. G., Andersen, T., Larsen, S., Tominaga, K., Blumentrath, S., de Wit, H. A., et al. (2016). From greening to browning: Catchment vegetation development and reduced S-deposition promote organic carbon load on decadal time scales in Nordic lakes. Sci. Rep. 6, 31944. doi:10.1038/srep31944
Forsström, L., Roiha, T., and Rautio, M. (2013). Responses of microbial food web to increased allochthonous DOM in an oligotrophic subarctic lake. Aquat. Microb. Ecol. 68, 171–184. doi:10.3354/ame01614
Gudasz, C., Bastviken, D., Steger, K., Premke, K., Sobek, S., and Tranvik, L. J. (2010). Temperature-controlled organic carbon mineralization in lake sediments. Nature 466, 478–481. doi:10.1038/nature09186
Henriksen, A., Skjelvåle, B. L., Mannio, J., Wilander, A., Harriman, R., Curtis, C., et al. (1998). Northern European lake survey, 1995: Finland, Norway, Sweden, Denmark, Russian kola, Russian karelia, scotland and wales. Ambio 27, 80–91.
Hessen, D. O., Andersen, T., and Lyche, A. (1990). Carbon metabolism in a humic lake: Pool sires and cycling through zooplankton. Limnol. Oceanogr. 35, 84–99. doi:10.4319/lo.1990.35.1.0084
Hessen, D. O., Håll, J. P., Thrane, J.-E., and Andersen, T. (2017). Coupling dissolved organic carbon, CO2 and productivity in boreal lakes. Freshw. Biol. 62, 945–953. doi:10.1111/fwb.12914
Hijmans, R. J., Van Etten, J., Cheng, J., Mattiuzzi, M., Sumner, M., Greenberg, J. A., et al. (2015). Package ‘raster.’ R package 734.
Hindar, A., Garmo, Ø. A., Austnes, K., and Sample, J. E. (2020). Nasjonal innsjøundersøkelse 2019. Oslo, Norway: NIVA-rapport.
Holgerson, M. A. (2015). Drivers of carbon dioxide and methane supersaturation in small, temporary ponds. Biogeochemistry 124, 305–318. doi:10.1007/s10533-015-0099-y
Holgerson, M. A., and Raymond, P. A. (2016). Large contribution to inland water CO2 and CH4 emissions from very small ponds. Nat. Geosci. 9, 222–226. doi:10.1038/ngeo2654
Huttunen, J. T., Alm, J., Liikanen, A., Juutinen, S., Larmola, T., Hammar, T., et al. (2003a). Fluxes of methane, carbon dioxide and nitrous oxide in boreal lakes and potential anthropogenic effects on the aquatic greenhouse gas emissions. Chemosphere 52, 609–621. doi:10.1016/S0045-6535(03)00243-1
Huttunen, J. T., Juutinen, S., Alm, J., Larmola, T., Hammar, T., Silvola, J., et al. (2003b). Nitrous oxide flux to the atmosphere from the littoral zone of a boreal lake. J. Geophys. Res. 108, 4421. doi:10.1029/2002JD002989
Jones, R. I., and Grey, J. (2011). Biogenic methane in freshwater food webs. Freshw. Biol. 56, 213–229. doi:10.1111/j.1365-2427.2010.02494.x
Jones, S. E., Zwart, J. A., Kelly, P. T., and Solomon, C. T. (2018). Hydrologic setting constrains lake heterotrophy and terrestrial carbon fate. Limnol. Oceanogr. Lett. 3, 256–264. doi:10.1002/lol2.10054
Juutinen, S., Alm, J., Larmola, T., Huttunen, J. T., Morero, M., Martikainen, P. J., et al. (2003). Major implication of the littoral zone for methane release from boreal lakes. Glob. Biogeochem. Cycles 17, 2105. doi:10.1029/2003GB002105
Juutinen, S., Rantakari, M., Kortelainen, P., Huttunen, J. T., Larmola, T., Alm, J., et al. (2009). Methane dynamics in different boreal lake types. Biogeosciences 6, 209–223. doi:10.5194/bg-6-209-2009
Kankaala, P., Huotari, J., Peltomaa, E., Saloranta, T., and Ojala, A. (2006). Methanotrophic activity in relation to methane efflux and total heterotrophic bacterial production in a stratified, humic, boreal lake. Limnol. Oceanogr. 51, 1195–1204. doi:10.4319/lo.2006.51.2.1195
Kankaala, P., Huotari, J., Tulonen, T., and Ojala, A. (2013). Lake-size dependent physical forcing drives carbon dioxide and methane effluxes from lakes in a boreal landscape. Limnol. Oceanogr. 58, 1915–1930. doi:10.4319/lo.2013.58.6.1915
Karlsson, J., Byström, P., Ask, J., Ask, P., Persson, L., and Jansson, M. (2009). Light limitation of nutrient-poor lake ecosystems. Nature 460, 506–509. doi:10.1038/nature08179
Khalili, M. I., Temnerud, J., Fröberg, M., Karltun, E., and Weyhenmeyer, G. A. (2010). Nitrogen and carbon interactions between boreal soils and lakes. Glob. Biogeochem. Cycles 24, 3668. doi:10.1029/2009GB003668
King, G. (1986). How not to lie with statistics: Avoiding common mistakes in quantitative political science. Am. J. Political Sci. 30, 666–687. doi:10.2307/2111095
Kortelainen, P., Larmola, T., Rantakari, M., Juutinen, S., Alm, J., and Martikainen, P. J. (2020). Lakes as nitrous oxide sources in the boreal landscape. Glob. Change Biol. 26, 1432–1445. doi:10.1111/gcb.14928
Kortelainen, P., Rantakari, M., Huttunen, J. T., Mattsson, T., Alm, J., Juutinen, S., et al. (2006). Sediment respiration and lake trophic state are important predictors of large CO2 evasion from small boreal lakes. Glob. Chang. Biol. 12, 1554–1567. doi:10.1111/j.1365-2486.2006.01167.x
Kortelainen, P., Rantakari, M., Pajunen, H., Huttunen, J. T., Mattsson, T., Juutinen, S., et al. (2013). Carbon evasion/accumulation ratio in boreal lakes is linked to nitrogen. Glob. Biogeochem. Cycles 27, 363–374. doi:10.1002/gbc.20036
Larsen, S., Andersen, T., and Hessen, D. O. (2011a). Predicting organic carbon in lakes from climate drivers and catchment properties. Glob. Biogeochem. Cycles 25, 3908. doi:10.1029/2010GB003908
Larsen, S., Andersen, T., and Hessen, D. O. (2011b). The pCO2 in boreal lakes: Organic carbon as a universal predictor? Glob. Biogeochem. Cycles 25, 3864. doi:10.1029/2010GB003864
Lau, D. C. P., Jonsson, A., Isles, P. D. F., Creed, I. F., and Bergström, A. (2021). Lowered nutritional quality of plankton caused by global environmental changes. Glob. Chang. Biol. 27, 6294–6306. doi:10.1111/gcb.15887
Li, M., Peng, C., Zhu, Q., Zhou, X., Yang, G., Song, X., et al. (2020). The significant contribution of lake depth in regulating global lake diffusive methane emissions. Water Res. 172, 115465. doi:10.1016/j.watres.2020.115465
Lie, R. O. (2021). Effect of catchment characteristics on biodegradability of dissolved natural organic matter.
Lindström, E. S., Agterveld, K.-V., and Zwart, G. (2005). Distribution of typical freshwater bacterial groups is associated with pH, temperature, and lake water retention time. Appl. Environ. Microbiol. 71, 8201–8206. doi:10.1128/AEM.71.12.8201-8206.2005
Liu, W., Wang, Z., Zhang, Q., Cheng, X., Lu, J., and Liu, G. (2015). Sediment denitrification and nitrous oxide production in Chinese plateau lakes with varying watershed land uses. Biogeochemistry 123, 379–390. doi:10.1007/s10533-015-0072-9
López Bellido, J., Tulonen, T., Kankaala, P., and Ojala, A. (2013). Concentrations of CO2 and CH4 in water columns of two stratified boreal lakes during a year of atypical summer precipitation. Biogeochemistry 113, 613–627. doi:10.1007/s10533-012-9792-2
Marra, G., and Wood, S. N. (2011). Practical variable selection for generalized additive models. Comput. Statistics Data Analysis 55, 2372–2387. doi:10.1016/j.csda.2011.02.004
Mattsson, T., Kortelainen, P., and Räike, A. (2005). Export of DOM from boreal catchments: Impacts of land use cover and climate. Biogeochemistry 76, 373–394. doi:10.1007/s10533-005-6897-x
McCrackin, M. L., and Elser, J. J. (2010). Atmospheric nitrogen deposition influences denitrification and nitrous oxide production in lakes. Ecology 91, 528–539. doi:10.1890/08-2210.1
Monteith, D. T., Stoddard, J. L., Evans, C. D., de Wit, H. A., Forsius, M., Høgåsen, T., et al. (2007). Dissolved organic carbon trends resulting from changes in atmospheric deposition chemistry. Nature 450, 537–540. doi:10.1038/nature06316
Natchimuthu, S., Panneer Selvam, B., and Bastviken, D. (2014). Influence of weather variables on methane and carbon dioxide flux from a shallow pond. Biogeochemistry 119, 403–413. doi:10.1007/s10533-014-9976-z
Nydahl, A. C., Wallin, M. B., Tranvik, L. J., Hiller, C., Attermeyer, K., Garrison, J. A., et al. (2019). Colored organic matter increases CO2 in meso-eutrophic lake water through altered light climate and acidity. Limnol. Oceanogr. 64, 744–756. doi:10.1002/lno.11072
Nydahl, A. C., Wallin, M. B., Laudon, H., and Weyhenmeyer, G. A. (2020). Groundwater carbon within a boreal catchment: Spatiotemporal variability of a hidden aquatic carbon pool. J. Geophys. Res. Biogeosci. 125, e2019JG005244. doi:10.1029/2019JG005244
Oksanen, J., Blanchet, F. G., Kindt, R., Legendre, P., Minchin, P. R., O’hara, R., et al. (2013). Package ‘vegan.’ Community ecology package. version 2, 1–295.
Öquist, M. G., Wallin, M., Seibert, J., Bishop, K., and Laudon, H. (2009). Dissolved inorganic carbon export across the soil/stream interface and its fate in a boreal headwater stream. Environ. Sci. Technol. 43, 7364–7369. doi:10.1021/es900416h
Palviainen, M., Laurén, A., Launiainen, S., and Piirainen, S. (2016). Predicting the export and concentrations of organic carbon, nitrogen and phosphorus in boreal lakes by catchment characteristics and land use: A practical approach. Ambio 45, 933–945. doi:10.1007/s13280-016-0789-2
Pellerin, B. A., Kaushal, S. S., and McDowell, W. H. (2006). Does anthropogenic nitrogen enrichment increase organic nitrogen concentrations in runoff from forested and human-dominated watersheds? Ecosystems 9, 852–864. doi:10.1007/s10021-006-0076-3
Peña Sanchez, G. A., Mayer, B., Wunderlich, A., Rein, A., and Einsiedl, F. (2022). Analysing seasonal variations of methane oxidation processes coupled with denitrification in a stratified lake using stable isotopes and numerical modeling. Geochimica Cosmochimica Acta 323, 242–257. doi:10.1016/j.gca.2022.01.022
Peterson, R. A. (2021). Finding optimal normalizing transformations via bestNormalize. R J. 13, 310–329. doi:10.32614/RJ-2021-041
Pregitzer, K. S., Burton, A. J., Zak, D. R., and Talhelm, A. F. (2008). Simulated chronic nitrogen deposition increases carbon storage in Northern Temperate forests. Glob. Chang. Biol. 14, 142–153. doi:10.1111/j.1365-2486.2007.01465.x
R Core Team (2021). R: A language and environment for statistical computing. Vienna, Austria: R Foundation for Statistical Computing. Available at: https://www.R-project.org/.
Rantakari, M., and Kortelainen, P. (2005). Interannual variation and climatic regulation of the CO2 emission from large boreal lakes. Glob. Chang. Biol. 11, 1368–1380. doi:10.1111/j.1365-2486.2005.00982.x
Rasilo, T., Prairie, Y. T., and del Giorgio, P. A. (2015). Large-scale patterns in summer diffusive CH4 fluxes across boreal lakes, and contribution to diffusive C emissions. Glob. Change Biol. 21, 1124–1139. doi:10.1111/gcb.12741
Ribic, C. A., Sheavly, S. B., Rugg, D. J., and Erdmann, E. S. (2010). Trends and drivers of marine debris on the Atlantic coast of the United States 1997–2007. Mar. Pollut. Bull. 60, 1231–1242. doi:10.1016/j.marpolbul.2010.03.021
Roland, F. A. E., Darchambeau, F., Morana, C., and Borges, A. V. (2017). Nitrous oxide and methane seasonal variability in the epilimnion of a large tropical meromictic lake (Lake Kivu, East-Africa). Aquat. Sci. 79, 209–218. doi:10.1007/s00027-016-0491-2
Ruckstuhl, K. E., Johnson, E. A., and Miyanishi, K. (2008). Introduction. The boreal forest and global change. Phil. Trans. R. Soc. B 363, 2243–2247. doi:10.1098/rstb.2007.2196
Sander, R. (2015). Compilation of Henry’s law constants (version 4.0) for water as solvent. Atmos. Chem. Phys. 15, 4399–4981. doi:10.5194/acp-15-4399-2015
Schindler, D. W. (1998). A Dim Future for Boreal Waters and Landscapes: Cumulative effects of climatic warming, stratospheric ozone depletion, acid precipitation, and other human activities. BioScience 48, 157–164. doi:10.2307/1313261
Škerlep, M., Steiner, E., Axelsson, A.-L., and Kritzberg, E. S. (2020). Afforestation driving long-term surface water browning. Glob. Change Biol. 26, 1390–1399. doi:10.1111/gcb.14891
Sobek, S., Algesten, G., Bergström, A.-K., Jansson, M., and Tranvik, L. J. (2003). The catchment and climate regulation of pCO2 in boreal lakes. Glob. Chang. Biol. 9, 630–641. doi:10.1046/j.1365-2486.2003.00619.x
Solomon, C. T., Jones, S. E., Weidel, B. C., Buffam, I., Fork, M. L., Karlsson, J., et al. (2015). Ecosystem consequences of changing inputs of terrestrial dissolved organic matter to lakes: Current knowledge and future challenges. Ecosystems 18, 376–389. doi:10.1007/s10021-015-9848-y
Tadonléké, R. D., Marty, J., and Planas, D. (2012). Assessing factors underlying variation of CO2 emissions in boreal lakes vs. reservoirs. FEMS Microbiol. Ecol. 79, 282–297. doi:10.1111/j.1574-6941.2011.01218.x
Thrane, J.-E., Hessen, D. O., and Andersen, T. (2014). The absorption of light in lakes: Negative impact of dissolved organic carbon on primary productivity. Ecosystems 17, 1040–1052. doi:10.1007/s10021-014-9776-2
Tranvik, L. J. (1998). “Degradation of dissolved organic matter in humic waters by bacteria,” in Aquatic humic substances: Ecology and biogeochemistry. Editors D. O. Hessen, and L. J. Tranvik (Berlin, Heidelberg: Springer Berlin Heidelberg), 259–283. doi:10.1007/978-3-662-03736-2_11
Tranvik, L. J., Downing, J. A., Cotner, J. B., Loiselle, S. A., Striegl, R. G., Ballatore, T. J., et al. (2009). Lakes and reservoirs as regulators of carbon cycling and climate. Limnol. Oceanogr. 54, 2298–2314. doi:10.4319/lo.2009.54.6_part_2.2298
Trogler, W. C. (1999). Physical properties and mechanisms of formation of nitrous oxide. Coord. Chem. Rev. 187, 303–327. doi:10.1016/S0010-8545(98)00254-9
Vachon, D., Prairie, Y. T., Guillemette, F., and del Giorgio, P. A. (2017). Modeling allochthonous dissolved organic carbon mineralization under variable hydrologic regimes in boreal lakes. Ecosystems 20, 781–795. doi:10.1007/s10021-016-0057-0
Whitfield, C. J., Aherne, J., and Baulch, H. M. (2011). Controls on greenhouse gas concentrations in polymictic headwater lakes in Ireland. Sci. Total Environ. 410–411, 217–225. doi:10.1016/j.scitotenv.2011.09.045
Xenopoulos, M. A., Lodge, D. M., Frentress, J., Kreps, T. A., Bridgham, S. D., Grossman, E., et al. (2003). Regional comparisons of watershed determinants of dissolved organic carbon in temperate lakes from the Upper Great Lakes region and selected regions globally. Limnol. Oceanogr. 48, 2321–2334. doi:10.4319/lo.2003.48.6.2321
Keywords: catchment, lake interactions, boreal lake, methane biogeochemistry, land use, land cover change, brownification
Citation: Valiente N, Eiler A, Allesson L, Andersen T, Clayer F, Crapart C, Dörsch P, Fontaine L, Heuschele J, Vogt RD, Wei J, de Wit HA and Hessen DO (2022) Catchment properties as predictors of greenhouse gas concentrations across a gradient of boreal lakes. Front. Environ. Sci. 10:880619. doi: 10.3389/fenvs.2022.880619
Received: 21 February 2022; Accepted: 23 August 2022;
Published: 09 September 2022.
Edited by:
Yves T. Prairie, Université du Québec à Montréal, CanadaReviewed by:
Peter Regier, Pacific Northwest National Laboratory (DOE), United StatesBanwari Dandotiya, Jiwaji University, India
Copyright © 2022 Valiente, Eiler, Allesson, Andersen, Clayer, Crapart, Dörsch, Fontaine, Heuschele, Vogt, Wei, de Wit and Hessen. This is an open-access article distributed under the terms of the Creative Commons Attribution License (CC BY). The use, distribution or reproduction in other forums is permitted, provided the original author(s) and the copyright owner(s) are credited and that the original publication in this journal is cited, in accordance with accepted academic practice. No use, distribution or reproduction is permitted which does not comply with these terms.
*Correspondence: Dag O. Hessen, d.o.hessen@mn.uio.no