Role of Financial Development, Green Technology Innovation, and Macroeconomic Dynamics Toward Carbon Emissions in China: Analysis Based on Bootstrap ARDL Approach
 Jiayu Yang
 Yunpeng Sun
 Huaping Sun
 Chi Keung Marco Lau
 Nicholas Apergis
 Kun Zhang
- 1School of Finance, Nankai University, Tianjin, China
- 2School of Economics, Tianjin University of Commerce, Tianjin, China
- 3School of Finance and Economics, Jiangsu University, Jiangsu, China
- 4Department of Economics and Finance, Hang Seng University of Hong Kong, Hong Kong, Hong Kong SAR, China
- 5Department of Banking and Financial Management, University of Piraeus, Piraeus, Greece
This study focuses on determining the relationship between carbon emissions, financial development, population, green technology innovation, energy Consumption, and employment rate from 1980 to 2019 in China. The study applies the unit root test, bootstrapped ARDL cointegration, and the Granger causality to examine the data properties and association between the variables of interest. Empirical findings indicate that green technology innovations and financial development play a major role in environmental protection, specifically in the long run. In contrast, energy consumption and employment rate are more vulnerable to protecting the natural environment in China. On the other side, the findings under short-run estimation do not support the role of green technology innovation in reducing environmental degradation. Based on the empirical findings, it is suggested that a strong financial system would help to achieve long-run sustainability and the emissions mitigating effects can be further strengthen by implementing green technologies across industries. In doing so, strict environmental regulations can regulate the financial and traditional industrial sector in adoption of energy efficient technologies.
1 Introduction
For the sustainable development of human society, changing climate is a significant threat and leads to a range of ecological consequences (Ahmad et al., 2021; Yuaningsih et al, 2021; Irfan et al., 2022). These issues are melting snow and ice, extreme weather conditions, and increasing temperature levels (Yang et al., 2021a; Iqbal et al., 2021; Ahmad et al., 2022; Wen et al., 2022). Such climate changes are largely caused by a range of human activities like burning coal and oil (Nawaz et al., 2021b; Chien et al., 2021; Irfan et al., 2022a). However, such changing climate threats could be reduced by avoiding greenhouse gas emissions in the natural environment (Ali et al., 2021; Chandio et al., 2021; Abbasi et al., 2022). Turning toward the Chinese economy, it has become the world’s largest carbon emitter during 2006, whereas the largest energy consumer in 2009 (Hao et al., 2021; Rauf et al., 2021; Nuvvula et al., 2022). Furthermore, the carbon emission in China was reached 9.15 billion during 2015, which accounts for 27.3% of the world’s emissions (Zhang et al., 2017; Irfan and Ahmad 2022).
Meanwhile, in recent years, China’s emissions will probably increase by 500 Mt in CO2 due to increasing demand for energy during 2020, whereas in 2021 it was almost 600 Mt CO2 (IEA, 2021). Although the contribution of fossil fuels is higher in CO2 emission in China, coal is expected to be dominant while contributing almost 70% (IEA, 2021). This higher level of coal is mainly in the power sector. Contrary to higher carbon emission, there is a growing trend for energy from renewable sources (Irfan et al., 2022b), which is almost 7% during 2019–2021. Figure 1 provides the outlook for the total energy supply through different sources. Coal is at the highest rank, followed by natural gas; hydro, wind, and solar; biofuel and waste; and oil and nuclear, respectively.
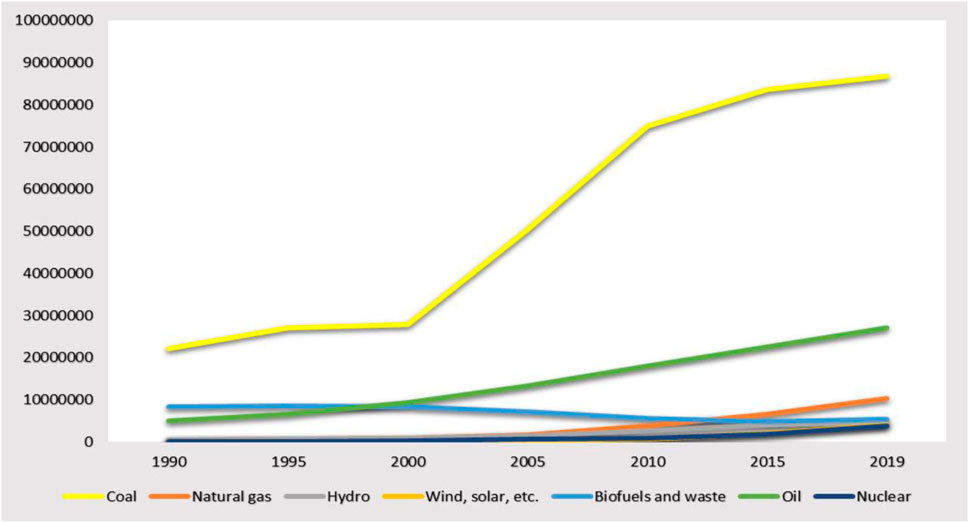
FIGURE 1. Total energy supply (TES) by source, People’s Republic of China 1990–2019 Source: International Energy Agency (2022).
In addition, as per the findings of the International Energy Agency (2021), there is a significant gap in the energy sector’s carbon emission between the Stated Policies Scenario (STEPS) and Announced Pledges Scenario (APS), which are specifically opened up after 2030. These challenges are achieving carbon neutrality while accelerating clean and green energy technologies. More specifically, after the recent pandemic of COVID-19 and its economic impacts, there is an upward trajectory in the emissions after a decline in the growth rate during 2020. It is expected that emissions will reach 6 Gt in 2060, which is to be considered as more than 35% below their level during 2020. However, in APS, emissions are expected to follow a similar path to 2030 but fall much more rapidly and reach net zero in 2060 (IEA, 2021). Besides, carbon emission from fossil fuel combustion will be around 450 Mt by 2060. Figure 2 provides a better outlook for the energy-related CO2 emissions in China by scenario during 2015–2060.
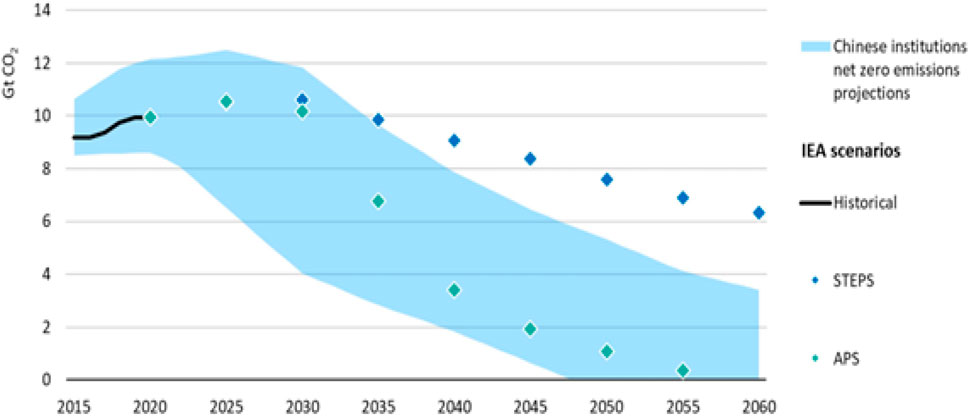
FIGURE 2. CO2 emissions from the existing energy-related infrastructure in China Source: (IEA, 2021).
There is much interest in carbon neutrality, the most important factor in developing green technologies (GTIs) (Tanveer et al., 2021; Shi et al., 2022; Xiang et al., 2022). The reason is that GTI is dynamic in the long run while minimizing environmental pollution compared to traditional techniques (Razzaq et al., 2021a; Fang et al., 2022). At the same time, financial development in any economy plays a major role in dealing with environmental concerns while utilizing more energy-efficient technologies (Tamazian and Rao, 2010; Tang et al., 2022). According to the OECD (2019), the performance of the GTIs can be viewed in a context that they help protect natural resources and preserve their value. However, the notion related to population growth is normally accepted as a major cause of environmental challenges (Cramer, 2000; Sun et al., 2020). However, there is a significant difference across the countries regarding the world’s population, GDP growth and CO2 emissions, financial development, and energy consumption (An et al., 2021; Razzaq, et al., 2021b; Sun et al., 2022; Yu et al., 2021). According to Walz (2011), production techniques and technology greatly influence the economy’s structure. This research paper focuses on determining the relationship between CO2 emissions, FD, PoP, GTI, ENC, and ER using a dataset from 1980 to 2019 in China. The study applies the unit root while using the ADF and ZA tests and BARDL estimation. In this regard, various studies have been found while applying the stated techniques. For example, considered the autoregressive distributive lag (ARDL) model. By applying a bootstrap autoregressive-distributed lag (BARDL) test proposed by McNown et al. (2018). The bootstrapping ARDL bound testing technique was applied to evaluate the cointegration among key factors.
The motivation for conducting this research highlights several important points. First, to the best of our knowledge, the literature supporting examining the role of financial development, green technology innovation, energy consumption, population, and employment rate under the shadow of environmental Kuznets curve and STIRPAT show some mixed findings. For this reason, our study incorporates all of these stated variables to provide some meaningful policy implications specifically from the context of China. Second, our study provides both long-run and short-run estimations for examining the relationship between the variables of interest. A sustainable perspective regarding carbon neutrality would be easily developed. Third, the Chinese economy has achieved outstanding economic and social development by transforming the planned socialist system to a more open and market-based economy. Its GDP has been growing 30 times larger than in the 1980s. This remarkable growth rate has also created some serious challenges in terms of environmental sustainability, for which this research has provided some meaningful empirical evidence and practical solutions. The following sections have been included to finish the paper: Section 2 focuses on the literature review, section three covers the research methodology, data collection, and research design. Section 4 covers the results and discussion, whereas the last section mainly considers the conclusion and policy implications.
2 Literature Review
2.1 Influence of FD, GTI, and GDP on Environmental Pollution
A study conducted by Zaidi et al. (2019) demonstrated that FD affects natural quality, whereas Chen et al. (2020) demonstrate that political globalization reduced environmental pollution. Salahuddin et al. (2018) used the VECM Granger causality test and shows that GDP, FDI, and FD are linked with environmental concerns. Ertugrul et al. (2016) explored that economic growth plays an important role in the growth of CO2 emissions. Akalpler and Hove, 2019) determined a strong correlation between economic output, capital expenditures, energy consumption, and environmental concerns. Jiang et al. (2019) revealed that FD directly affects environmental pollution. According to GDP and FDI contributed to natural collapse by increasing CO2 emissions. Meanwhile, Dzator and Acheampong (2020) discovered that GTI has a favorable impact on CO2 emissions. Usman and Hammer (2020) revealed that the FD and GTI protect environmental quality over the long run. As GTI getting improves, there is a reduction in environmental pollution. (Abdouli and Hammami, 2017).
In addition, Razzaq et al. (2021) stated that uncertainty exists in economic patterns because of time-varying factors. For this reason, it is quite imperative to examine the nexus between environmental and economics. Their study mainly focuses on the Chinese economy to explore long-run and short-run non-linear associations between financial development, carbon emission, globalization, and natural resources for 1980–2017. In doing so, they applied a non-linear autoregressive distributed lag (NARDL) framework and observed that financial development and globalization are positively linked with carbon emissions. However, negative shocks in natural resources also positively determine China’s environmental pollution. Khan et al. (2020) observed the panel heterogeneity among 192 economies for carbon emission, financial development, and energy consumption. The study results confirm that through panel quantile regression estimation, financial development has its increasing influence, whereas clean energy consumption reflects a negative influence on carbon emission. Acheampong et al. (2020) conducted a comparative analysis of CO2 emission intensity and financial market development while considering developed and emerging economies. The empirical findings infer that the development of financial markets increases the intensity of carbon emission among frontier financial economies.
In contrast, there is no linear relationship between financial market development and carbon emission intensity in standalone financial economies (Khan et al., 2022). Shan et al. (2021) examined the impact of green technology innovation, and renewable energy on carbon emission in the Turkish economy through bootstrapping ARDL. The authors confirmed that green technology innovation and renewable energy help in reducing carbon emission, whereas non-renewable energy boosts carbon emission (Sun and Razzaq, 2022a). Furthermore, both population and personal income have their determinantal effect on carbon emissions. Shan et al. (2021) analyzed the effects of GDP, energy sources, and carbon emission in the OECD and BRICS economies in the long and short run through panel data estimation. It has been finalized that there is a negative correlation between GDP and carbon emission, whereas a negative association exists between non-renewable energy and carbon emission, respectively.
2.2 Population Growth Impact on CO2 Emissions
According to Haseeb et al. (2016), urbanization harms environmental sustainability, whereas discovered a strong relationship between GDP, energy consumption, FDI, exchange transparency, and CO2 neutrality. Vélez-Henao (2020) found that population development in cities is a major cause of natural debasement. Amin et al. (2020) discovered that energy usage reduces the natural quality, but trade openness and population improve environmental pollution in the long term. Sadorsky (2014) described that population growth shows its influence on CO2 emissions. However, the size of the population is a very important factor that directly affects CO2 emissions (Dagar et al., 2021; Atchike et al., 2022; Cui et al., 2019; Xiang et al., 2022). Dong et al. (2018) observed the trends in CO2 emission through economic growth, population, and renewable energy sources across different regions. Considering the cross-sectional dependence and slope heterogeneity during 1990–2014, their study mainly observes that at both regional and global levels, and population and economic growth have their significant and direct role toward a higher level of carbon emission. However, energy from renewable sources is causing a decline in CO2 emissions. Furthermore, it also confirms that panel causality exists along with the variables of interest. Khan et al., 2021 examined renewable and non-renewable energy sources, natural resources, population growth toward CO2 emission, and ecological footprints. The study findings confirm that population growth and non-renewable energy sources degrade environmental quality. Weber and Sciubba (2019) stated a long-lasting dispute regarding the extent to which population growth is playing its role toward environmental degradation. However, it is stated that regional level analysis may provide some robust output while isolating the effect of population on the carbon dioxide emission during 1990–2006. Their findings provide some considerable outcomes for the regional population growth on the carbon emission. Sulaiman and Abdul-Rahim (2018) explained in its theoretical context that population growth is to be considered as playing its role toward greenhouse gas emission, specifically in the form of CO2 due to a range of human activities. For 1971–2010, their study mainly considers the autoregressive distributed lag model. However, the study findings confirm that population is not a determinant factor toward carbon dioxide emissions. In contrast, economic growth has its long-term determinantal effect on the carbon emission during the study period.
3 Research Methodology
3.1 Data Collection Sources
To carry out the statistical analysis, data were collected from 1980 to 2019. Data for the financial development were collected from the official website of the International Monetary Fund (IMF). In contrast, data for the population, employment rate, carbon dioxide emissions, and energy consumption were collected from the official data portal of the World Development Indicator during the study period. Furthermore, the data for green technology innovations have been collected from the official data portal of OECD statistics.
3.2 Theoretical Framework
The IPAT is an equation format that integrates sustainability outputs to three major causal factors: population, affluence, and technology. The equation of IPAT was initially proposed during the 1970s to deeply understand the change in population, affluence, and technology toward their environmental impact (I) (Ehrlich and Holdren, 1972). More specifically, in the IPAT application, the term T mainly determines the environmental impact per unit for the economic activity. Such activities are normally determined through economic growth in the form of gross domestic product with the help of I/GDP ratio. Furthermore, technical efficiency is observed as a key factor to reduce the cause of the environmental outcomes caused by anthropogenic activities.
Meanwhile, among IPAT applications, climate change is very popular, specifically among those studies that are energy-emission based (Wang et al., 2017; Zaman and Abd-el Moemen, 2017; Ozcan and Ulucak, 2021). The preceding (Raskin, 1995) discoveries have provided evidence for using the IPAT model to figure out what causes carbon dioxide emissions to occur (Paramati et al., 2020). The IPAT model is extended into a stochastic variation called Stochastic Effects of Relapse on Popular and Technology (STIRPAT) (Dietz, 1997). Although the implication of the IPAT model was reasonable enough, there was a range of limitations linked with it. To overcome this issue, Rosa and Dietz (1998) have proposed the STIRPAT model. A major advantage of the STIRPAT model comes from its ability to test hypotheses empirically and the conditions that will be present during the experiment,
The above-expressed model was taken on from the exploration commitments (Paramati et al., 2017). In the above condition (Eq. 1), CO2 consists of the components of the population, financial development, energy consumption, green technology innovation, and employment rate, respectively.
3.3 Research Design
This research applies the bootstrapping autoregressive distributed lagged (BARDL) bound testing technique as it is unique for two major reasons. First, this model is not complex toward the integration properties of the study variables. Second, this approach is also suitable for dynamic time-series data. However, compared to conventional ARDL models, the BARDL addresses the issues like inconclusive cases, as expressed by McNown et al. (2018). It also helps in reducing indecision cases because critical values are generated. Furthermore, this method is moderate and dynamic with multiple explanatory variables. Goh et al. (2017) have expressed their view that the BARDL approach in its traditional concept can be specified with the help of the following equation:
wherein in Eq. 2, the small letters i, j, k, and l show the lags. Meanwhile, the term t shows the time duration, and yt indicates the main dependent variable: carbon dioxide emission. Furthermore, xt and zt show the key predictors or explanatory variables. Additionally, Dt, i reflects the dummy variable in structural breaks (Kim and Perron, 2009).
Here, the terms
Meanwhile, the above equation indicates the significance of the three null hypotheses to explain the cointegration among the variables.
I) All relevant error-correction terms are tested by the F1 test (
II) All of the explanatory variable terms are tested by F2 (
III) Lagged dependent variables are tested by (
In addition, the traditional ARDL estimation helps generate the critical values test for the F1 and T tests, respectively. Meanwhile, BARDL helps in generating some critical values.
4 Results and Findings
Descriptive results are reported in Table 1, where both central tendency and dispersion measures are provided. It shows that Green technology innovations report a higher mean score, followed by employment rate, population growth, and financial development. However, the lowest mean trend is reported from energy consumption which is 1.02. On the other side, all the study variables show a standard deviation below 1, which is a good sign for the low risk in the dataset. Additionally, for the Jarque–Bera test, the following null and alternative hypotheses are tested.
H0: The distribution of the study data is normal.
H1: The distribution of the study data is not normally distributed.
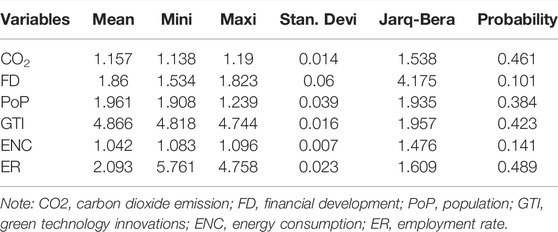
TABLE 1. Conversation valuation reports.
The findings for the Jarque–Bera test through probability values reflect that all the variables are found to be statistically insignificant. Therefore, H0 is not rejected; hence, data for the study variables are normally distributed. Therefore, we can move on toward further empirical investigation in both the long and short run, respectively.
4.1 Correlation Analysis Estimates
Table 2 covers the pairwise correlation matrix for the study variables. A positive and significant correlation exists between CO2 emissions, FD, GTI, and energy consumption, respectively. More specifically, a highly positive and significant correlation exists between carbon emission and financial development during the study period. On the other hand, energy consumption, green technology innovation, GTI, and employment rate are also positively and significantly correlated. Furthermore, this research examines the VIF scores along with the tolerance level (1/VIF) to justify whether the correlation is problematic or not. As shown in Table 2, all the variables of interest reflect a VIF score of less than 5, and similar is the case with Mean VIF. Accordingly, the tolerance level is also above 0.10; hence, it is inferred that the correlation between the variables of interest is acceptable.
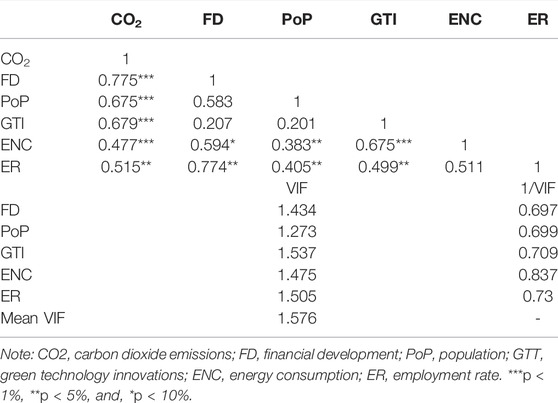
TABLE 2. Correlation analysis’s best-guess estimates.
4.2 Preliminary Unit Root Tests
The study employs an ADF unit root test, which is very useful in detecting the unit root for each study variable (Tissue et al., 2009). Meanwhile, as stated under Table 3, through different years and relative quantiles, multiple structural breaks have been presented and tested accordingly. Furthermore, the level of integration between the variables also plays an important role in the justification of the relevant technique’s hereafter. Meanwhile, the ADF unit root test has greater explanatory power than some traditional unit root tests, providing some accurate findings. The study findings in Table 3 report that under ADF (level), all the variables have reported unit root problems. For this reason, with the first difference, the variables are found to be statistically significant. Furthermore, the findings under the ZA test confirm that at ZA (Δ), the study variables are statistically significant with the different structural breaks. This would justify the argument that variables have distinctive order of integration; therefore, our study applies cointegration techniques to examine the presence of cointegration.
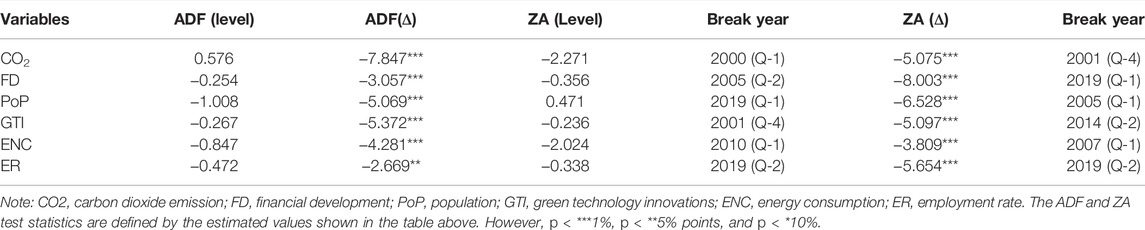
TABLE 3. Preliminary estimates on the number of unit root tests.
4.3 BARDL Co-Integration Estimation
After analyzing the structural breaks in the data, our study considers the BARDL cointegration analysis through estimated models, lag length, break year, F score, T score, and the rest of the results under Table 4. The findings under Table 4 through F and T values confirm a long-run equilibrium cointegration association between the study variables such as population, energy consumption, economic growth, employment rate, financial development, and carbon emission, respectively. The results of bootstrapped ARDL cointegration test disclosures from the F test and T test, CO2 emissions are accounted for all of the identifying factors, which has a value of R2 which accounts for 80.6% variation in the model. Finally, the results of the JB test show that the variables of interest are normally distributed during the study period. TDV served as the t-value for the dependent variable, whereas TIV was the t-value of the major explanatory variables of the study.
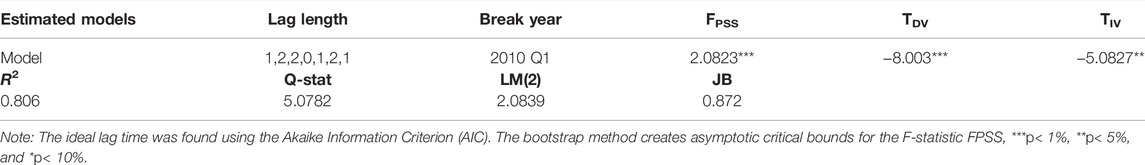
TABLE 4. BARDL cointegration analysis results.
4.4 Analysis of BARDL Co-Integration (Long Run)
To examine the long-run cointegrated association between the outcome and explanatory and outcome variables, findings are presented in Table 5. It confirms that financial development in Chinese economy reduces the carbon emission in a significant manner (i.e., beta = −0.231, t-value = −2.003, p-value = 0.001). It justifies that more development of financial markets and related institutions in the Chinese economy is a productive indication of environmental degradation; hence, such financial development reflects its sustainable outlook. The existing literature has found supporting and contrary evidence for the nexus between financial development and carbon emissions. In this regard, Amin et al. (2020) explored different proxies of financialization toward carbon emission among top emitters with the help of quantile estimation. It is confirmed that financial development increases carbon emission at low quantiles, negatively affecting pollution over higher quantiles when examined through nine different proxies. However, some other studies have contrary findings. For example, Shahzad et al. (2017) showed that financial development increases the carbon emission by 16.5% under long-run estimation, whereas this impact is observed as 8.7% under short-run, respectively. Zhang (2011) also exerted that financial development is an important driver of carbon emission in the past.
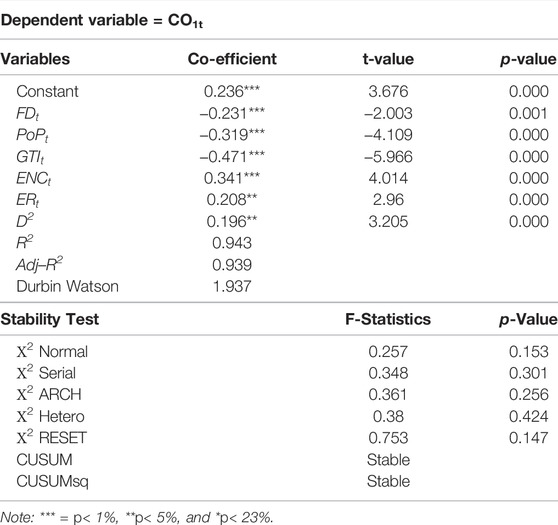
TABLE 5. Results of BARDL (long run) cointegration analysis.
Furthermore, the effect of population toward carbon emission is also negatively significant at 1% as shown in Table 6. This means that increasing population is not a problematic sign of environmental pollution. One of the several reasons for this negative nexus between population and carbon emission might be shifting energy sources from non-renewable to renewable ones. Khan et al. (2021) confirmed that population growth and carbon emissions are related. However, Sulaiman and Abdul-Rahim (2018) claimed that population, among other macroeconomic variables, has a direct role toward more emission and vice versa. Qi and Li (2020) focused on estimating the transfer in carbon through population migration and energy use in China. They highlight that migration flows in China are causing differential outcomes in residential carbon emissions. However, China’s population migration has increased the national total carbon emission.
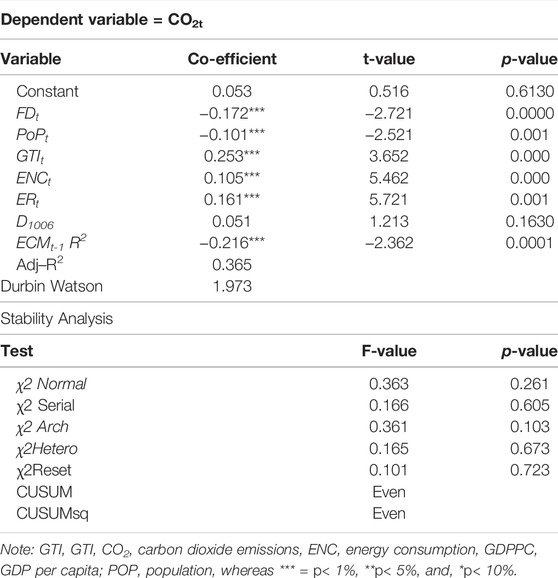
TABLE 6. BARDL cointegration analysis estimations (short-run).
The findings also report that energy consumption and green technology innovations show their positive/negative role toward carbon emission in the Chinese economy as observed through long-run estimation. More specifically, it shows that a 1% change in GTI and ENC is causing an upward/downward shift of 47.1 and 34.1% in the carbon emission in China. The increasing utilization of energy is among the major carbon emission sources, as highlighted in recent and past studies. Zaman and Moemen (2017) focused on various environmental hypotheses to explore the nexus between energy consumption, carbon emission, and economic growth. The study findings confirm that more energy consumption induces carbon emission. Nawaz et al. (2021a) confirmed the empirical association between energy consumption from non-renewable sources and carbon emission, whereas a long-run positive correlation between energy consumption and carbon emission also exists. The literature also supports mixed evidence about the nexus between green technology innovation and carbon emission. For instance, Du and Li (2019) investigated the trends in carbon dioxide emission through green technology innovation for 71 panel economies. Their results show that ecological innovations do not significantly reduce carbon emissions, specifically among economies below a threshold income level. However, contrary to our findings, Du and Li (2019) stated that it is difficult to find significant evidence for the positive effect of green technology innovation toward carbon productivity, specifically among less developed economies.
Furthermore, we observe that the employment rate among the macroeconomic indicators is directly causing environmental pollution. The coefficient of ER is 0.208, with a t-value of 2.96. This would reflect a significant and positive nexus between the employment rate and carbon emission in China. Yu and Li (2021) examined the association between carbon emission and enterprises’ labour demands. It is stated that approximately 11.5% total employment effect of carbon emission trading policy is found in China.
Likewise, the findings under short-run estimation through the BARDL method show that financial development and population are causing a reduction in carbon emission. In contrast, green technology innovation, energy consumption, and employment rate are causing environmental degradation. The findings under short-run estimations are quite identical to long-run estimation except for the change in the coefficient for the green technology innovation. Furthermore, it is observed that the adjusted value of the R2 is found to be 36.5% under short-run estimation, reflecting a reasonable variation in the main dependent variable entitled carbon dioxide emission. Using Durbin Watson’s statistics, the autocorrelation is identified and determined to be non-existent in the empirical findings. Besides, stability analysis has provided satisfactory empirical findings both in the long and short run, respectively.
4.5 6l Granger Causality Test Estimations
Finally, our study considers the Granger Causality test estimation for the variables of interest. The findings are presented under Table 7 and observe that study variables are Granger cause with each other at 1% level of significance, except for the CO2-FD, which is significant at 10%.
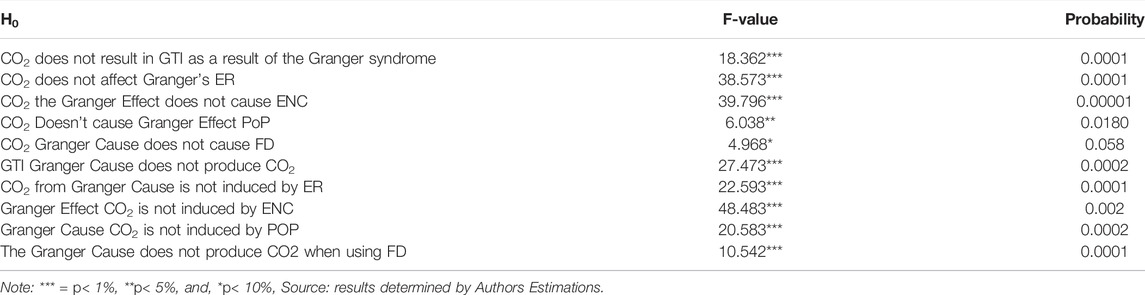
TABLE 7. Results of the Granger causality test estimations.
5 Conclusion and Policy Implications
The research paper focuses on determining the relationship between CO2 emissions, financial development, energy consumption, population, employment rate, green technology innovation, and carbon emissions in China from 1980 to 2019. The study applies unit root testing to examine the structural breaks and unit root properties. The bootstrapped ARDL cointegration (short- and long-run) analysis is also under consideration, whereas the Granger causality test was applied to find the causal relationships between all variables. The study findings through descriptive scores confirm the normal distribution of the data. In contrast, the correlational matrix also determines that interdependency is not problematic as VIF scores for all the variables are below the threshold level. In addition, the findings through long-run estimation confirm that financial development in the Chinese economy is playing a significant role in reducing environmental pollution like CO2. In contrast, the population also shows a negative trend toward carbon emission. Meanwhile, the long-run estimation confirms that the energy consumption and employment rate directly contributes to more pollution and environmental degradation during the study period. At the same time, our study analysis confirms a significant and constructive role of financial development in China under short-run estimation in treating climate issues. Besides, green technology innovations are among the core sources in reducing environmental issues in China, but only for the long run. Besides, the model’s explanatory power under short-run estimation is lower than the long-run estimation.
Based on the empirical findings, it is suggested that a better and strong financial system in the form of financial markets and efficiency would provide some outstanding long-run outcomes in the form of low carbon emission. Therefore, financial development should be among the key priorities in the Chinese region. However, contrary to financial development, green technology innovations should also be coupled with government policy. In short-run estimations, more promotion is required to achieve sustainable outcomes in lower carbon dioxide emissions. For this reason, it is suggested that environmental regulations may be considered a promotional tool for different industries in utilizing those technologies having their sustainable results. Besides, this study is limited in regional implications and non-consideration of different proxies of financial development (i.e., financial markets and financial institutions), green growth, and energy transition. Future studies are highly suggested to add these factors in analyzing the trends in carbon emission in different economies.
Data Availability Statement
The original contributions presented in the study are included in the article/Supplementary Material, further inquiries can be directed to the corresponding authors.
Author Contributions
JY: conceptualization, data, methodology, formal analysis, and visualization; YS: conceptualization, writing—original draft, writing; HS: data, methodology, formal analysis, and visualization; CL: conceptualization, writing—original draft, and writing—review and editing; NA: writing—review and editing; and KZ: writing—review and editing.
Conflict of Interest
The authors declare that the research was conducted in the absence of any commercial or financial relationships that could be construed as a potential conflict of interest.
Publisher’s Note
All claims expressed in this article are solely those of the authors and do not necessarily represent those of their affiliated organizations, or those of the publisher, the editors, and the reviewers. Any product that may be evaluated in this article, or claim that may be made by its manufacturer, is not guaranteed or endorsed by the publisher.
Acknowledgments
National Statistical Science Research Project (2021LY055);Jiangsu Soft Science Research Project (BR2021030).
References
Abbasi, K. R., Shahbaz, M., Zhang, J., Irfan, M., and Alvarado, R. (2022). Analyze the Environmental Sustainability Factors of China: The Role of Fossil Fuel Energy and Renewable Energy. Renew. Energ. 187, 390–402. doi:10.1016/j.renene.2022.01.066
Abdouli, M., and Hammami, S. (2017). The Impact of FDI Inflows and Environmental Quality on Economic Growth: an Empirical Study for the MENA Countries. J. Knowl Econ. 8 (1), 254–278. doi:10.1007/s13132-015-0323-y
Acheampong, A. O., Amponsah, M., and Boateng, E. (2020). Does Financial Development Mitigate Carbon Emissions? Evidence from Heterogeneous Financial Economies. Energ. Econ. 88, 104768. doi:10.1016/j.eneco.2020.104768
Ahmad, B., Irfan, M., Salem, S., and Asif, M. H. (2022). Energy Efficiency in the Post-COVID-19 Era: Exploring the Determinants of Energy-Saving Intentions and Behaviors. Front. Energ. Res. 9, 824318. doi:10.3389/fenrg.2021.824318
Ahmad, N., Ullah, Z., Arshad, M. Z., Kamran, H. w., Scholz, M., and Han, H. (2021). Relationship between Corporate Social Responsibility at the Micro-level and Environmental Performance: The Mediating Role of Employee Pro-environmental Behavior and the Moderating Role of Gender. Sustainable Prod. Consumption 27, 1138–1148. doi:10.1016/j.spc.2021.02.034
Akalpler, E., and Hove, S. (2019). Carbon Emissions, Energy Use, Real GDP Per Capita and Trade Matrix in the Indian Economy-An ARDL Approach. Energy 168, 1081–1093. doi:10.1016/j.energy.2018.12.012
Ali, S., Yan, Q., Sajjad Hussain, M., Irfan, M., Ahmad, M., Razzaq, A., et al. (2021). Evaluating Green Technology Strategies for the Sustainable Development of Solar Power Projects: Evidence from Pakistan. Sustainability, 13(23), 12997.doi:10.3390/su132312997
Amin, A., Dogan, E., and Khan, Z. (2020). The Impacts of Different Proxies for Financialization on Carbon Emissions in Top-Ten Emitter Countries. Sci. Total Environ. 740, 140127. doi:10.1016/j.scitotenv.2020.140127
An, H., Razzaq, A., Nawaz, A., Noman, S. M., and Khan, S. A. R. (2021). Nexus between green Logistic Operations and Triple Bottom Line: Evidence from Infrastructure-Led Chinese Outward Foreign Direct Investment in Belt and Road Host Countries. Environ. Sci. Pollut. Res. 28 (37), 51022–51045. doi:10.1007/s11356-021-12470-3
Atchike, D. W., Salem, S., Irfan, M., and Rehman, M. A. (2022). Waste-to-renewable Energy Transition: Biogas Generation for Sustainable Development. Front. Environ. Sci. 107, 840588. doi:10.3389/fenvs.2022.840588
Chandio, A. A., Jiang, Y., Akram, W., Adeel, S., Irfan, M., and Jan, I. (2021). Addressing the Effect of Climate Change in the Framework of Financial and Technological Development on Cereal Production in Pakistan. J. Clean. Prod. 288, 125637. doi:10.1016/j.jclepro.2020.125637
Chen, T., Gozgor, G., Koo, C. K., and Lau, C. K. M. (2020). Does International Cooperation Affect CO 2 Emissions? Evidence from OECD Countries. Environ. Sci. Pollut. Res. 27 (8), 8548–8556. doi:10.1007/s11356-019-07324-y
Chien, F., Sadiq, M., Kamran, H. W., Nawaz, M. A., Hussain, M. S., and Raza, M. (2021). Co-movement of Energy Prices and Stock Market Return: Environmental Wavelet Nexus of COVID-19 Pandemic from the USA, Europe, and China. Environ. Sci. Pollut. Res. 28 (25), 32359–32373. doi:10.1007/s11356-021-12938-2
Dagar, V., Khan, M. K., Alvarado, R., Rehman, A., Irfan, M., Adekoya, O. B., et al. (2021). Impact of Renewable Energy Consumption, Financial Development and Natural Resources on Environmental Degradation in OECD Countries with Dynamic Panel Data. Environ. Sci. Pollut. Res., 1–11. doi:10.1007/s11356-021-16861-4
Dong, K., Hochman, G., Zhang, Y., Sun, R., Li, H., and Liao, H. (2018). CO2 Emissions, Economic and Population Growth, and Renewable Energy: Empirical Evidence across Regions. Energ. Econ. 75, 180–192. doi:10.1016/j.eneco.2018.08.017
Du, K., and Li, J. (2019). Towards a green World: How Do green Technology Innovations Affect Total-Factor Carbon Productivity. Energy Policy 131, 240–250. doi:10.1016/j.enpol.2019.04.033
Dzator, J., and Acheampong, A. O. (2020). “The Impact of Energy Technology on Carbon Emission Mitigation: An Empirical Evidence from OECD Countries,” in Handbook of Environmental Materials Management. Editor C. M. Hussain (Springer International Publishing), 1–19. doi:10.1007/978-3-319-58538-3_213-1
Ehrlich, P. R., and Holdren, J. P. (1972). Critique. Bull. At. Scientists 28 (5), 16–27. doi:10.1080/00963402.1972.11457930
Ertugrul, H. M., Cetin, M., Seker, F., and Dogan, E. (2016). The Impact of Trade Openness on Global Carbon Dioxide Emissions: Evidence from the Top Ten Emitters Among Developing Countries. Environ. Indicators 67, 543–555. doi:10.1016/j.ecolind.2016.03.027
Fang, Z., Razzaq, A., Mohsin, M., and Irfan, M. (2022). Spatial Spillovers and Threshold Effects of Internet Development and Entrepreneurship on green Innovation Efficiency in China. Techn. Soc. 68, 101844. doi:10.1016/j.techsoc.2021.101844
Hao, Y., Gai, Z., Yan, G., Wu, H., and Irfan, M. (2021). The Spatial Spillover Effect and Nonlinear Relationship Analysis between Environmental Decentralization, Government Corruption and Air Pollution: Evidence from China. Sci. Total Environ. 763, 144183. doi:10.1016/j.scitotenv.2020.144183
Haseeb, M., Hassan, S., and Azam, M. (2016). Rural-urban Transformation, Energy Consumption, Economic Development, and CO2 Emissions Using STRIPAT Model for BRICS Countries. Environ. Prog. Sustain. Energ. 36 (2), 523–531. doi:10.1002/ep.12461
IEA (2021). An Energy Sector Roadmap to Carbon Neutrality in China. Retrieved from https://iea.blob.core.windows.net/assets/9448bd6e-670e-4cfd-953c-32e822a80f77/AnenergysectorroadmaptocarbonneutralityinChina.pdf.
Iqbal, W., Tang, Y. M., Chau, K. Y., Irfan, M., and Mohsin, M. (2021). Nexus between Air Pollution and NCOV-2019 in China: Application of Negative Binomial Regression Analysis. Process Saf. Environ. Prot. 150, 557–565. doi:10.1016/j.psep.2021.04.039
Irfan, M., and Ahmad, M. (2022). Modeling Consumers' Information Acquisition and 5G Technology Utilization: Is Personality Relevant? Personal. Individual Differences 188, 111450. doi:10.1016/j.paid.2021.111450
Irfan, M., Elavarasan, R. M., Ahmad, M., Mohsin, M., Dagar, V., and Hao, Y. (2022b). Prioritizing and Overcoming Biomass Energy Barriers: Application of AHP and G-TOPSIS Approaches. Technol. Forecast. Soc. Change 177, 121524. doi:10.1016/j.techfore.2022.121524
Irfan, M., Razzaq, A., Suksatan, W., Sharif, A., Elavarasan, R. M., Yang, C., and Rauf, A. (2022). Asymmetric Impact of Temperature on COVID-19 Spread in India: Evidence from Quantile-On-Quantile Regression Approach. J. Therm. Biol. 104, 103101. doi:10.1016/j.jtherbio.2021.103101
Irfan, M., Shahid, A. L., Ahmad, M., Iqbal, W., Elavarasan, R. M., Ren, S., et al. (2022a). Assessment of Public Intention to Get Vaccination against COVID‐19: Evidence from a Developing Country. J. Eval. Clin. Pract. 28 (1), 63–73. doi:10.1111/jep.13611
Khan, H., Khan, I., and Binh, T. T. (2020). The Heterogeneity of Renewable Energy Consumption, Carbon Emission and Financial Development in the globe: A Panel Quantile Regression Approach. Energ. Rep. 6, 859–867. doi:10.1016/j.egyr.2020.04.002
Khan, I., Hou, F., and Le, H. P. (2021). The Impact of Natural Resources, Energy Consumption, and Population Growth on Environmental Quality: Fresh Evidence from the United States of America. Sci. Total Environ. 754, 142222. doi:10.1016/j.scitotenv.2020.142222
Khan, I., Hou, F., Zakari, A., Irfan, M., and Ahmad, M. (2022). Links Among Energy Intensity, Non-linear Financial Development, and Environmental Sustainability: New Evidence from Asia Pacific Economic Cooperation Countries. J. Clean. Prod. 330, 129747. doi:10.1016/j.jclepro.2021.129747
McNown, R., Sam, C. Y., and Goh, S. K. (2018). Bootstrapping the Autoregressive Distributed Lag Test for Cointegration. Appl. Econ. (50), 1509–1521. doi:10.1080/00036846.2017.1366643
Nawaz, M. A., Hussain, M. S., Kamran, H. W., Ehsanullah, S., Maheen, R., and Shair, F. (2021a). Trilemma Association of Energy Consumption, Carbon Emission, and Economic Growth of BRICS and OECD Regions: Quantile Regression Estimation. Environ. Sci. Pollut. Res. 28 (13), 16014–16028. doi:10.1007/s11356-020-11823-8
Nawaz, M. A., Hussain, M. S., Kamran, H. W., Ehsanullah, S., Maheen, R., and Shair, F. (2021b). Trilemma Association of Energy Consumption, Carbon Emission, and Economic Growth of BRICS and OECD Regions: Quantile Regression Estimation. Environ. Sci. Pollut. Res. 28 (13), 16014–16028. doi:10.1007/s11356-020-11823-8
Nuvvula, R. S., Devaraj, E., Elavarasan, R. M., Taheri, S. I., Irfan, M., and Teegala, K. S. (2022). Multi-objective Mutation-Enabled Adaptive Local Attractor Quantum Behaved Particle Swarm Optimisation Based Optimal Sizing of Hybrid Renewable Energy System for Smart Cities in India. Sustainable Energ. Tech. Assessments 49, 101689. doi:10.1016/j.seta.2021.101689
Ozcan, B., and Ulucak, R. (2021). An Empirical Investigation of Nuclear Energy Consumption and Carbon Dioxide (CO2) Emission in India: Bridging IPAT and EKC Hypotheses. Nucl. Eng. Techn. 53 (6), 2056–2065.
Qi, W., and Li, G. (2020). Residential Carbon Emission Embedded in China's Inter-provincial Population Migration. Energy Policy 136, 111065. doi:10.1016/j.enpol.2019.111065
Rauf, A., Ozturk, I., Ahmad, F., Shehzad, K., Chandiao, A. A., Irfan, M., et al. (2021). Do Tourism Development, Energy Consumption and Transportation Demolish Sustainable Environments? Evidence from Chinese Provinces. Sustainability 13 (22), 12361. doi:10.3390/su132212361
Razzaq, A., Ajaz, T., Li, J. C., Irfan, M., and Suksatan, W. (2021a). Investigating the Asymmetric Linkages between Infrastructure Development, green Innovation, and Consumption-Based Material Footprint: Novel Empirical Estimations from Highly Resource-Consuming Economies. Resour. Pol. 74, 102302. doi:10.1016/j.resourpol.2021.102302
Razzaq, A., Sharif, A., Najmi, A., Tseng, M.-L., and Lim, M. K. (2021b). Dynamic and Causality Interrelationships from Municipal Solid Waste Recycling to Economic Growth, Carbon Emissions and Energy Efficiency Using a Novel Bootstrapping Autoregressive Distributed Lag. Resour. Conservation Recycling 166, 105372. doi:10.1016/j.resconrec.2020.105372
Rosa, E. A., and Dietz, T. (1998). Climate Change and Society: Speculation, Construction and Scientific Investigation. Int. Sociol. 13 (4), 421–455. doi:10.1177/026858098013004002
Salahuddin, M., Alam, K., Ozturk, I., and Sohag, K. (2018). The Effects of Electricity Consumption, Economic Development, FD and Foreign Direct Investment on CO2 Emissions in Kuwait. Renew. Sustain. Energ. Rev. 81, 2002–2010. doi:10.1016/j.rser.2017.06.009
Shahzad, S. J. H., Kumar, R. R., Zakaria, M., and Hurr, M. (2017). Carbon Emission, Energy Consumption, Trade Openness and Financial Development in Pakistan: A Revisit. Renew. Sustain. Energ. Rev. 70, 185–192. doi:10.1016/j.rser.2016.11.042
Shan, S., Genç, S. Y., Kamran, H. W., and Dinca, G. (2021). Role of green Technology Innovation and Renewable Energy in Carbon Neutrality: A Sustainable Investigation from Turkey. J. Environ. Manage. 294, 113004. doi:10.1016/j.jenvman.2021.113004
Shi, R., Irfan, M., Liu, G., Yang, X., and Su, X. (2022). Analysis of the Impact of Livestock Structure on Carbon Emissions of Animal Husbandry: A Sustainable Way to Improving Public Health and green Environment. Front. Public Health 10, 835210. doi:10.3389/fpubh.2022.835210
Sulaiman, C., and Abdul-Rahim, A. (2018). Population Growth and CO2 Emission in Nigeria: a Recursive ARDL Approach. Sage Open 8 (2), 2158244018765916. doi:10.1177/2158244018765916
Sun, H., Edziah, B. K., Kporsu, A. K., Sarkodie, S. A., and Taghizadeh-Hesary, F. (2021a). Energy Efficiency: The Role of Technological Innovation and Knowledge Spillover, Technol. Forecast. Soc. Change. 167, 120659. doi:10.1016/j.techfore.2021a.12065910.1016/j.techfore.2021.120659
Sun, H., Kporsu, A. K., Taghizadeh-Hesary, F., and Edziah, B. K. (2020). Estimating Environmental Efficiency and Convergence: 1980 to 2016. Energy, 118224. doi:10.1016/j.energy.2020.118224
Sun, Y., Anwar, A., Razzaq, A., Liang, X., and Siddique, M. (2022). Asymmetric Role of Renewable Energy, green Innovation, and Globalization in Deriving Environmental Sustainability: Evidence from Top-10 Polluted Countries. Renew. Energ. 185, 280–290. doi:10.1016/j.renene.2021.12.038
Sun, Y., and Razzaq, A. (2022a). Composite Fiscal Decentralisation and green Innovation: Imperative Strategy for Institutional Reforms and Sustainable Development in OECD Countries. Sustainable Development, 1–14. doi:10.1002/sd.2292
Tamazian, A., and Rao, B. B. J. E. e. (2010). Do economic, Financial and Institutional Developments Matter for Environmental Degradation? Evid. transitional economies 32 (1), 137–145. doi:10.1016/j.eneco.2009.04.004
Tang, C., Irfan, M., Razzaq, A., and Dagar, V. (2022). Natural Resources and Financial Development: Role of Business Regulations in Testing the Resource-Curse Hypothesis in ASEAN Countries. Resour. Pol. 76, 102612. doi:10.1016/j.resourpol.2022.102612
Tanveer, A., Zeng, S., Irfan, M., and Peng, R. (2021). Do perceived Risk, Perception of Self-Efficacy, and Openness to Technology Matter for Solar PV Adoption? an Application of the Extended Theory of Planned Behavior. Energies 14 (16), 5008. doi:10.3390/en14165008
Usman, M., and Hammar, N. (2020). Dynamic Relationship between Technological Technologies, FD, Renewable Energy, and Environmental Footprint: Fresh Insights Based on the STIRPAT Model for Asia pacific Economic Cooperation Countries. Environ. Sci. Pollut. Res. 28 (12), 15519–15536. doi:10.1007/s11356-020-11640-z
Vélez-Henao, J. A. (2020). Does Population Boost Environmental Impacts in Colombia? an Extended STIRPAT–LCA Approach. Qual. Quantity 54 (3), 851–866. doi:10.1007/s11135-019-00961-y
Wang, C., Wang, F., Zhang, X., Yang, Y., Su, Y., Ye, Y., et al. (2017). Examining the Driving Factors of Energy Related Carbon Emissions Using the Extended STIRPAT Model Based on IPAT Identity in Xinjiang. Renew. Sustain. Energ. Rev. 67, 51–61. doi:10.1016/j.rser.2016.09.006
Weber, H., and Sciubba, J. D. (2019). The Effect of Population Growth on the Environment: Evidence from European Regions. Eur. J. Popul. 35 (2), 379–402. doi:10.1007/s10680-018-9486-0
Wen, C., Akram, R., Irfan, M., Iqbal, W., Dagar, V., Acevedo-Duqued, Á., et al. (2022). The Asymmetric Nexus between Air Pollution and COVID-19: Evidence from a Non-linear Panel Autoregressive Distributed Lag Model. Environ. Res. 209, 112848. doi:10.1016/j.envres.2022.112848
Xiang, H., Chau, K. Y., Iqbal, W., Irfan, M., and Dagar, V. (2022). Determinants of Social Commerce Usage and Online Impulse Purchase: Implications for Business and Digital Revolution. Front. Psychol. 13, 837042. doi:10.3389/fpsyg.2022.837042
Yang, B., Jahanger, A., and Ali, M. (2021a). Remittance Inflows Affect the Environmental Footprint in BICS Countries: Do Technological Technology and FD Matter? Environ. Sci. Pollut. Res. 28, 23482–23500. doi:10.1007/s11356-021-12400-3
Yu, D.-J., and Li, J. (2021). Evaluating the Employment Effect of China's Carbon Emission Trading Policy: Based on the Perspective of Spatial Spillover. J. Clean. Prod. 292, 126052. doi:10.1016/j.jclepro.2021.126052
Yu, Z., Razzaq, A., Rehman, A., Shah, A., Jameel, K., and Mor, R. S. (2021). Disruption in Global Supply Chain and Socio-Economic Shocks: a Lesson from COVID-19 for Sustainable Production and Consumption. Operations Manag. Res., 1–16. doi:10.1007/s12063-021-00179-y
Yuaningsih, L., Febrianti, R. A. M., and Hafiz, W. K. (2021). Climate Change and Energy Consumption Patterns in Thailand: Time Trends during 1988-2013. Int. J. Energ. Econ. Pol. 11 (1), 571. doi:10.32479/ijeep.11888
Zaidi, S. A. H., Zafar, M. W., Shahbaz, M., and Hou, F. (2019). Dynamic Linkages between Globalization, FD and Carbon emissions:Evidence from Asia Pacific Economic Cooperation Countries. J. Clean. Prod. 228, 533–543. doi:10.1016/j.jclepro.2019.04.210
Zaman, K., and Abd-el Moemen, M. (2017). Energy Consumption, Carbon Dioxide Emissions and Economic Development: Evaluating Alternative and Plausible Environmental Hypothesis for Sustainable Growth. Renew. Sustain. Energ. Rev. 74, 1119–1130. doi:10.1016/j.rser.2017.02.072
Zaman, K., and Moemen, M. A.-e. (2017). Energy Consumption, Carbon Dioxide Emissions and Economic Development: Evaluating Alternative and Plausible Environmental Hypothesis for Sustainable Growth. Renew. Sustain. Energ. Rev. 74, 1119–1130. doi:10.1016/j.rser.2017.02.072
Zhang, Y.-J., Peng, Y.-L., Ma, C.-Q., and Shen, B. (2017). Can Environmental Innovation Facilitate Carbon Emissions Reduction? Evidence from China. Energy Policy 100, 18–28. doi:10.1016/j.enpol.2016.10.005
Keywords: fd, ER, CO2 emissions, pop, GdpP, bootstrapped ARDL cointegration method, granger causality test
Citation: Yang J, Sun Y, Sun H, Lau CKM, Apergis N and Zhang K (2022) Role of Financial Development, Green Technology Innovation, and Macroeconomic Dynamics Toward Carbon Emissions in China: Analysis Based on Bootstrap ARDL Approach. Front. Environ. Sci. 10:886851. doi: 10.3389/fenvs.2022.886851
Received: 01 March 2022; Accepted: 28 March 2022;
Published: 16 May 2022.
Edited by:
Asif Razzaq, Dalian University of Technology, ChinaReviewed by:
Tahseen Ajaz, Quaid-i-Azam University, PakistanTayyaba Rani, Xi’an Jiaotong University, China
Hafizq Kamran, Iqra University, Pakistan
Copyright © 2022 Yang, Sun, Sun, Lau, Apergis and Zhang. This is an open-access article distributed under the terms of the Creative Commons Attribution License (CC BY). The use, distribution or reproduction in other forums is permitted, provided the original author(s) and the copyright owner(s) are credited and that the original publication in this journal is cited, in accordance with accepted academic practice. No use, distribution or reproduction is permitted which does not comply with these terms.
*Correspondence: Jiayu Yang, yangjiayu@nankai.edu.cn; Yunpeng Sun, tjwade3@126.com; Huaping Sun, shp797@163.com; Chi Keung Marco Lau, marcolau@hsu.edu.hk