Impact of Environmental Regulation on High-Quality Economic Development
 Xiaowei Ma1
  Junwei Xu2,3*
- 1School of Economics, Fujian Normal University, Fuzhou, China
- 2Research Center for Economic Law of Anhui University, Hefei, China
- 3Law School, Anhui University, Hefei, China
Based on the connotation of high-quality economic development (HQED) in China, this study uses panel data of 30 provinces (cities and regions) in China from 2005 to 2019 to construct an evaluation index system of HQED with three dimensions of “economic development—social life—ecological environment,” and establishes a fuzzy comprehensive evaluation model to calculate the HQED index. The results show that the high-quality development level of China’s economy shows an upward trend of fluctuation, but the development level is still low and there are obvious regional differences. The eastern region enjoys the highest level of HQED, followed by the central region and western region. The panel data regression model is further established to analyze the impact of environmental regulation on economic development. It is found that there is an inverted u-shaped relationship between environmental regulation and HQED, and there is a “cost compliance” effect between environmental regulation and quantitative economic development. Strict environmental regulation measures will inhibit economic quantity growth. The results of heterogeneity analysis show that environmental regulation has different impacts on the economic development of the three regions due to the differences in resource endowment. The influence of environmental regulation on economic development in eastern China is similar to that in the whole country. However, in the central region, there is an “innovation compensation” effect between environmental regulation and HQED, and a “U” shape relationship between environmental regulation and quantitative economic development. In western China, the enhancement of environmental regulation will inhibit high-quality and quantitative economic development.
1 Introduction
Since 1978, China has seen a rapid increase in its level of economic development and a significant improvement in people’s living standards. However, the ecological and environmental problems caused by overexploitation, sloppy utilization, and extravagant waste of the early resources are increasingly prominent (Vennemo et al., 2009; Qashou et al., 2022; Samour and Pata, 2022). Since the 1980s, China has paid increasingly close attention to the issue of coordinated economic and environmental development, and has successively put forward major strategic ideas such as the sustainable development strategy and the scientific outlook on development. In addition, China is constantly improving its laws related to environmental protection. Since the 18th Party Congress, China has innovatively developed new concepts and ideas, such as the “Two Mountains Theory” and the Community of Life between man and nature, and has continuously enriched and improved the theoretical system of harmonious coexistence between man and nature. Currently, China’s economic development has entered a new period, and it has shifted from the stage of high-speed growth to the stage of high-quality development.
“High-quality development” is rich in connotation. It covers both quantitative development and qualitative development and has distinctive characteristics of the times (Zhu et al., 2020). High-quality economic development (HQED) means that economic development no longer simply pursues the quantity of economic development and economic development speed, but more often takes into account the ecological environment, industrial coordination, regional coordination, etc., to improve the quality of economic development. Since the reform and opening up, China has shifted its focus to economic construction and solved the problem of economic quantity. Now, people are more concerned about the quality of economic growth under the ecological crisis (Abumunshar et al., 2020; Altarhouni et al., 2021; Samour et al., 2022). China proposes HQED, which solves the problem of economic quality (Zhou et al., 2020). China has proposed five major development concepts: innovation, coordination, green, openness, and sharing. HQED should not only meet these five development concepts, but also be a development with fewer production input factors, higher efficiency in resource allocation, lower resource and environmental costs, and better economic and social benefits. China’s HQED should balance the total amount of economic development and the quality of economic development, consider the coordination of economic growth with environmental protection and ecological civilization, and pay more attention to the comprehensive development of economy, politics, society, culture, and ecology (Liu et al., 2021).
Before the concept of HQED was introduced, scholars generally used the quality of economic growth to measure the “quality” of China’s economy, such as total factor productivity, green total factor productivity (Mei and Chen, 2016; Zhao et al., 2022a; Zhao et al., 2022b), and value-added rate (Hu et al., 2020). Although these indicators make up for the previous shortcomings of simply measuring the quantity of economic development, and can reflect the quality of economic development to a certain extent, they still have limitations and reflect relatively single economic information. Since the 19th Party Congress, scholars have set out to study issues related to China’s HQED and to construct comprehensive evaluation models. For example, Hu et al. (2020) constructed a six-dimensional economic quality development evaluation index system including technological innovation, infrastructure construction, ecological environment, economic efficiency, economic stability, and market mechanism to study the level of rural economic development, but the results of the study were evaluated only from the perspective of rural areas and could not reflect the overall level of China’s economic quality development. Chen and Wang (2021) constructed a comprehensive evaluation index system including green development, residents’ living standard, innovation ability, economic vitality, and coordinated development based on the data of Chinese prefecture-level cities, but the three-level indicators only contain positive and negative indicators, and do not include moderate indicators such as urban-rural income ratio and urban-rural consumption ratio.
According to Chen (2009), unregulated polluting behavior can affect economic growth through two pathways. When the pollutant emission level is lower than the natural environmental carrying capacity, the natural environment dissipates the waste by self-cleaning, which brings positive impact on economic development; when the pollutant emission level is higher than the natural environmental carrying capacity, in the short term, enterprises obtain economic growth through high energy consumption, high pollution, and high emission, but the continuous emission of pollutants will reduce the environmental quality and trigger negative externalities, which will eventually negatively affect economic development (Chen and Chen, 2018). To ensure long-term sustainable economic development, the state introduces environmental regulation mechanism. Environmental regulation aims to prevent and control pollution, improve the environment, and achieve harmonious development of economy and resources and environment. Regarding the impact of environmental regulation on economic development, some scholars support the “innovation compensation theory,” which argues that appropriate environmental regulation can stimulate business innovation and promote economic growth. For pollution-intensive industries, higher environmental regulation standards can force enterprises to improve technological innovation, reduce environmental pollution and energy consumption, and improve the quality of economic development (Zhu et al., 2014). Some scholars support the “cost of compliance” theory, arguing that in the short term, strict environmental regulations raise production costs and reduce the profitability of enterprises (Greenstone et al., 2012), and even “force” enterprises to move to areas with less stringent regulations, creating “pollution havens” that are not conducive to improving the quality of economic development (Conrad and Wastl, 1995).
In recent years, China has attached great importance to the issue of environmental pollution by re-establishing the Ministry of Natural Resources to unify the management of natural resources. At the same time, China has strengthened environmental regulations and improved the accountability system for ecological and environmental protection, seeking to better coordinate the development relationship between population, economy, and resources. From the literature, it can be seen that HQED includes the concept of “population-economy-society-resources” coordinated development. In the comprehensive evaluation of HQED, the existing researches have their characteristics. However, there are still many shortcomings, such as the results of some literature are rather one-sided, which cannot reflect the overall characteristics of China’s HQED; some literature has not selected reasonable indicators and needs to be improved. Therefore, this study constructs a scientific evaluation index system from the connotation of HQED, and incorporates environmental regulation variables to analyze its impact on HQED. The contribution of this research is mainly reflected in the following aspects. First, this study considers the positive indicators, negative indicators, and moderate indicators affecting the HQED, and constructs a scientific, systematic, and comprehensive evaluation index system for HQED. Second, this study uses panel data of 30 Chinese provinces (cities and districts) from 2005 to 2019 to measure the level of China’s HQED by region, analyzes the temporal trends and spatial differences in China’s HQED, and objectively and truly grasps the current status of China’s HQED. Third, this paper introduces environmental regulation variables, and uses economic quality development and economic quantity development as explanatory variables, respectively, to comprehensively analyze the impact of environmental regulation on economic development and its regional heterogeneity, and provide countermeasures for promoting economic quality.
2 Research Design
2.1 Measurement of China’s HQED Index Based on Fuzzy Comprehensive Evaluation Method
2.1.1 Construction of an Evaluation Index System for China’s HQED
As mentioned above, the definition of HQED includes the concept of coordinated development of population-economy-society-resources, which covers three aspects: economic development progress, social life stability, and ecological environment optimization. Therefore, this study takes into account the scientific and systematic nature of the evaluation system, as well as the availability of indicator data, and uses data from 30 provinces (cities and regions) in China (due to the serious lack of indicators in China, Hong Kong, Macao, Taiwan, and Tibet are not included in this study) to construct an evaluation index system for measuring China’s HQED index, with the criterion layer consisting of 3 dimensions, including economic development, social life, and ecological environment. The sub-criteria layer consists of 13 dimensions such as economic development quantity, economic development speed, and industrial structure coordination, and the indicator layer contains 28 indicators such as real regional GDP, real GDP per capita, GDP growth rate, and GDP per capita growth rate, as shown in Table 1.
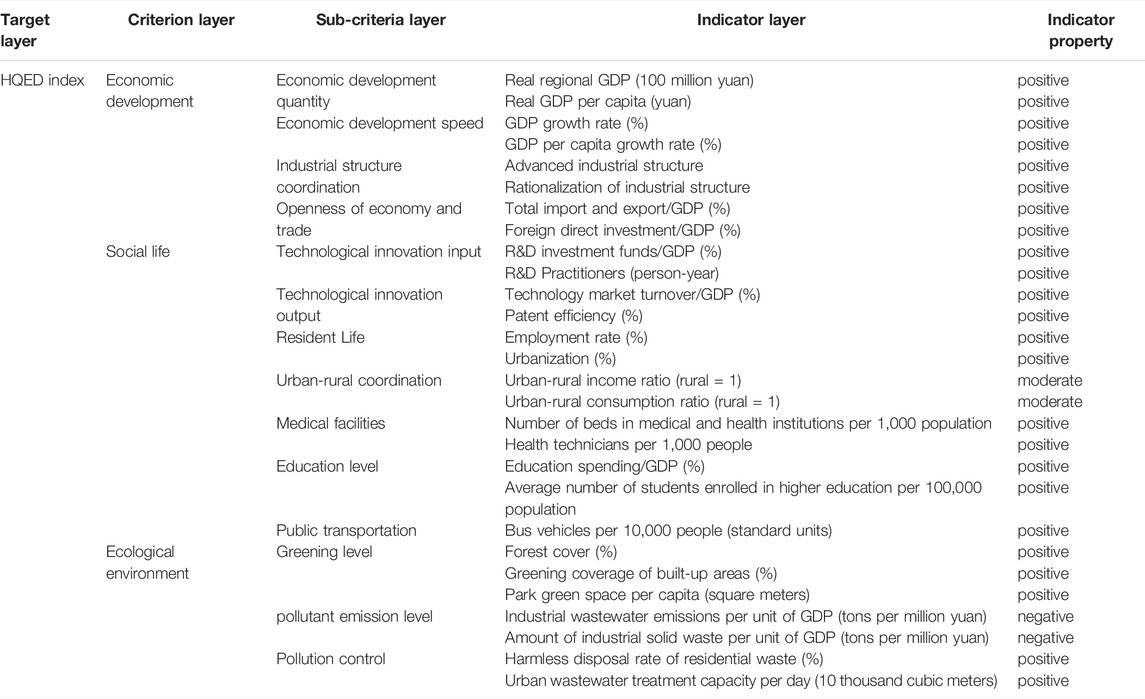
TABLE 1. Evaluation index system of China’s HQED index.
In terms of economic development, four aspects are included: the quantity of economic development, the speed of economic development, the coordination of industrial structure, and the openness of economy and trade. Specifically, the quantity of economic development is measured by real regional GDP and real GDP per capita, the speed of economic development is measured by GDP growth rate and GDP per capita growth rate, the coordination of industrial structure is measured by advanced industrial structure and rationalized industrial structure, and the openness of economy and trade is measured by the proportion of total import and export and the proportion of foreign direct investment. In terms of social life, six aspects are examined: technological innovation, residents’ life, urban-rural coordination, medical facilities, education level, and public transportation. Specifically, technological innovation includes both technological innovation inputs and technological innovation outputs. Technological innovation inputs are measured by the ratio of R&D input funds and the full-time equivalent of R&D employees, and technological innovation outputs are measured by the ratio of technology market turnover and patent efficiency. The employment rate and urbanization level measure the living standard of residents; the urban-rural income ratio and urban-rural consumption ratio measure the coordination of urban-rural development; the number of beds in medical and health institutions per unit of population and the number of health technicians per 1,000 people measure the level of medical facilities; the proportion of education expenditure and the average number of students in higher education schools per 100,000 people measure the level of education; and the number of public transportation vehicles per 10,000 people measures the level of public transportation. In terms of the ecological environment, three aspects are included: greening level, pollutant emission level, and pollution control. Specifically, the greening level is measured by the forest coverage rate, the greening coverage rate of built-up areas, and the per capita park green area; the pollutant emission level is measured by the industrial wastewater emission per unit of GDP and the industrial solid waste per unit of GDP; and the pollution control capacity is measured by the harmless treatment rate of residential waste and the daily treatment capacity of urban sewage.
Both real regional GDP and real per capita GDP are calculated by using GDP index and per capita GDP index respectively, taking 2005 as the base period. When measuring the degree of industrial structure coordination, this study adopts the ratio of the output value of the tertiary industry to the output value of the secondary industry to measure the level of the advanced industrial structure according to Clark’s law. A larger ratio indicates a higher level of advanced industrial structure. The level of industrial structure rationalization reflects the dynamic process of continuous strengthening of coordination ability and increasing level of association between industries in a country. This study uses the Thiel index to measure the degree of industrial structure rationalization in each province (city, region). The equation is
2.1.2 Fuzzy Comprehensive Evaluation Model Construction
In this study, the indicators of HQED index are divided into three categories: positive indicators, negative indicators, and moderate indicators. Due to the different attributes and different units of measurement among different indicators, to facilitate analysis and comparison, this study establishes a fuzzy benefit-type matrix by dimensionless method, and transforms all elements of the matrix into positive indicators. Then, this paper uses the coefficient of variation method to determine the index weights. Finally, the comprehensive evaluation model is constructed as follows.
where
2.2 Panel Data Regression Model
To further assess the impact of environmental regulation on HQED and regional heterogeneity, this study constructs the following benchmark regression model based on relevant data from 30 provinces (cities and regions) in three major regions of China: east, central and west from 2005 to 2019.
where i represents the province,
To fully explore the impact of environmental regulation on economic development, this study introduces the explanatory variable, the level of quantitative economic development, expressed as the logarithm of real GDP per capita (
In formula (Eq. 3), except for the explanatory variables, the meanings of the remaining indicators are the same as in model (2).
2.3 Data Source
In this study, the data of each indicator are obtained from the official website of the National Bureau of Statistics of China, the China Statistical Yearbook, the China Environmental Statistical Yearbook, and the China Population and Employment Statistical Yearbook of the corresponding year, and the missing data are filled in using interpolation method.
3 Analysis of China’s HQED
3.1 The Evaluation Results of HQED
The measured results of China’s economic high-quality development index for each province (city, region) and the three major regions are shown in Table 2 and Figure 1. It can be seen that the overall level of China’s economic quality development showed a fluctuating upward trend from 2005 to 2019. The HQED index increased by 22% from 27.87 to 33.95. In 2007, the quality development index of China’s economy reached the lowest point of 25.34. In 2019, the high-quality development index of China’s economy reached its highest value of 33.95. During the study period, the average value of the China HQED index is 29.16. According to the HQED index of the three major regions, from 2005 to 2019, the HQED index of the eastern, central, and western regions of China all showed a fluctuating upward trend. Among them, the eastern region had the best level of economic high-quality development for a long time, ranking first among the three regions and higher than the national average. From 2005 to 2019, the HQED index of the eastern region rose from 40.82 to 44.93, with an increase of 10%. In 2007, the HQED index of the eastern region reached its lowest value of 36.99; in 2019, the index of HQED in the eastern region rose to the highest value of 44.93. During the study period, the average value of the HQED in the eastern region was 40.64, which was much higher than the average value in the central and western regions and the country. The HQED index in the central region ranks second among the three regions, but it is lower than the national average for a long time. From 2005 to 2019, the index of HQED in the central region rose from 22.87 to 30.33, with an increase of 33%. In 2007, the level of HQED in the central region reached the lowest value of 21.02; in 2019, the level of HQED in the central region rose to the highest value of 30.33. During the study period, the average value of the HQED in the central region was 24.90. The western region had the lowest level of HQED among the three regions for a long time. From 2005 to 2019, the western region’s economic quality development index increased from 18.55 to 25.60, with an increase of 38%. It is the highest growth rate among the three regions. In 2007, the western region’s economic quality development index reached its lowest value of 16.84 and rebounded to its highest value of 25.60 in 2019. During the study period, the average value of the HQED index in the western region was 20.77.
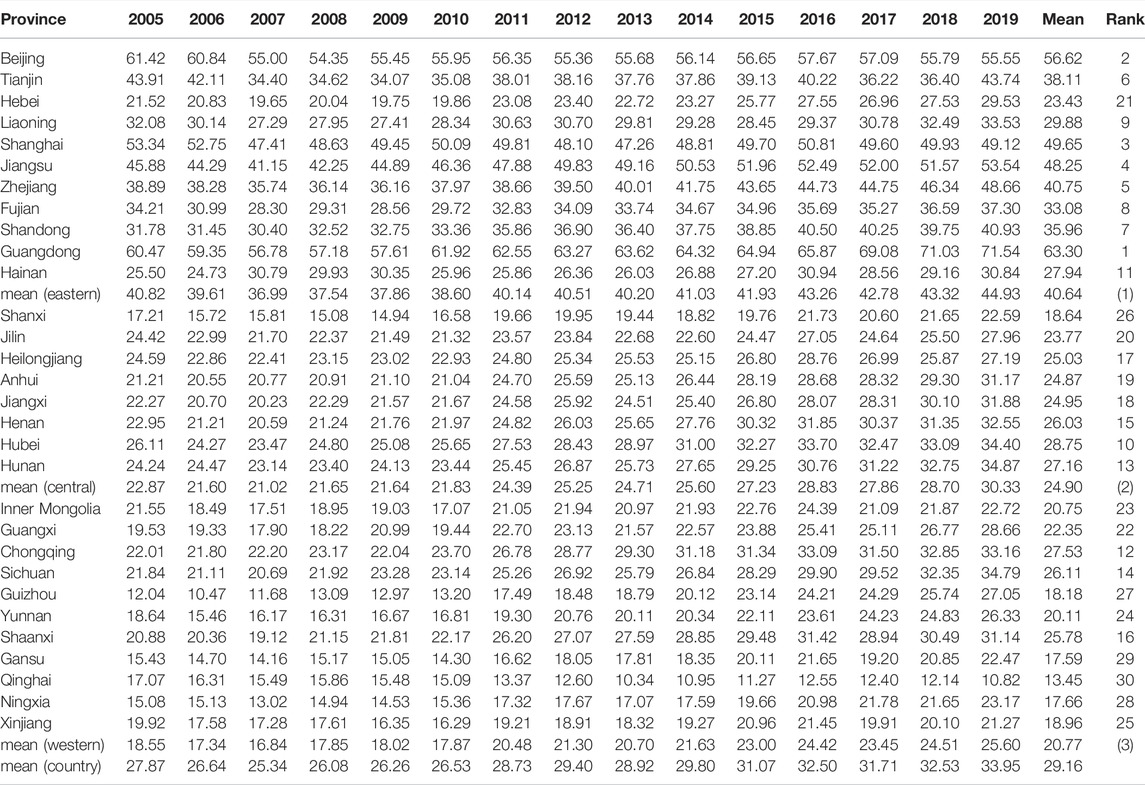
TABLE 2. Regional HQED index of China from 2005 to 2019.
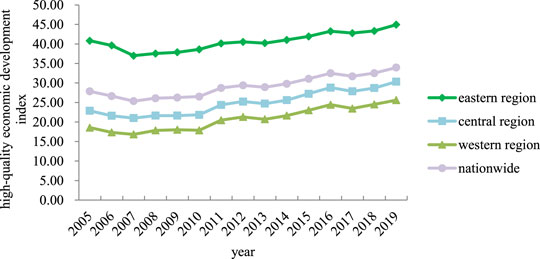
FIGURE 1. High-quality development trend of China’s economy from 2005 to 2019.
To better analyze the level of HQED of each province (city or region), this study classifies the high, medium, low levels of high-quality development according to the ratio of 20%, 80%, and 20%. Specifically, among the 30 provinces (cities and regions), the top six provinces (cities and regions) are divided into the high-level group of HQED, the seventh to twenty-fourth ranked provinces (cities and regions) are divided into the medium level group of HQED, and the bottom six provinces (cities and regions) are divided into the low-level group of HQED. According to Table 2, Guangdong, Beijing, Shanghai, Jiangsu, Zhejiang, and Tianjin belong to the high-level group; Qinghai, Gansu, Ningxia, Guizhou, Shanxi, and Xinjiang belong to the low-level group, and the rest of the provinces (cities and regions) belong to the medium level group. A comparative analysis shows that the six provinces (cities and districts) in the high-level group are all located in the eastern part of China; five of the six provinces (cities and districts) in the low-level group are located in the western part of China. Among them, the average value of Guangdong’s HQED index is 63.30, ranking first among 30 provinces (cities and regions); while the average value of Qinghai is 13.45, ranking the last among 30 provinces (cities and regions), less than a quarter of Guangdong, and the level of economic quality development needs to be improved.
Taking the score of 60 as the passing line of the HQED index, it can be found that China’s HQED level is relatively backward, with an average score of 29.16 nationwide and average scores of 40.64, 24.90, and 20.77 in the eastern, central and western regions respectively, which are far below the passing line level. Among the 30 provinces (cities and regions), only Guangdong Province has an index score slightly above 60, that is 63.30, while the remaining 29 provinces (cities and regions) have a failing index score, indicating that China’s HQED still has a long way to go.
3.2 The Reasons for Regional Difference of HQED
The above results indicate that the HQED of China’s economy shows an upward trend of fluctuation, and there are obvious differences among the three regions. To analyze the reasons for this result, this study calculated the scores of economic development, social life, and ecological environment, as shown in Table 3. At the national level, the economic development level showed a fluctuating upward trend. The ecological environment showed an obvious upward trend, while the social life index showed a downward trend. Therefore, under the comprehensive action of economy, society, and ecology, the level of HQED showed a fluctuating upward trend. In addition, the economic development level, social living standard, and ecological environment index of the eastern region are all higher than that of the central and western regions, especially the economic development level, which was about 2.5 times that of the central region and about three times that of the western region. Therefore, under the multiple drives of economy, society, and ecology, eastern China enjoys the best level of HQED.
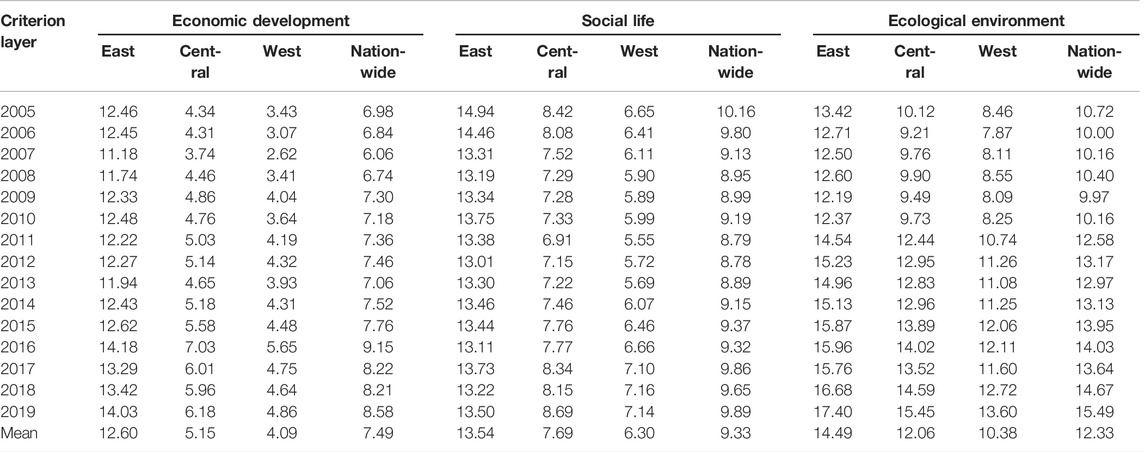
TABLE 3. The scores of three criterion layers.
4 Impact of Environmental Regulation on the HQED
4.1 Descriptive Statistical Analysis
Table 4 shows the results of descriptive statistical analysis of each variable. According to Table 4, it can be seen that the mean (absolute value) of all variables is much larger than the standard deviation, except for the mean absolute value of environmental regulation indicators, which is relatively similar to the standard deviation, indicating that the dispersion of the data is low; the variance inflation factors are all much smaller than 10, indicating that there is no multicollinearity among the variables. In summary, the data can be used for further analysis.

TABLE 4. Descriptive statistics.
4.2 Cointegration Test
To test whether there is a long-term equilibrium relationship between the level of HQED, the quantity of economic development, and the explanatory variables, this study selects the Pedroni test for cointegration, and the results are shown in Table 5. According to Table 5, the p-values of the three test statistics of the pedroni test are all much less than 0.01, which strongly rejects the null hypothesis of “no cointegration relationship” and indicates that there is a long-term equilibrium relationship among the indicator variables.
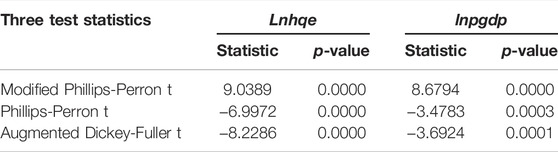
TABLE 5. The results of the cointegration test.
4.3 Empirical Results
4.3.1 Impact of Environmental Regulation on the HQED
Table 6 shows the influences of environmental regulation on HQED and quantitative economic development. Columns (1) and (3) indicate the effects of environmental regulation on HQED and quantitative economic development without control variables, respectively. Columns (2) and (4) show the results with control variables. The magnitude, direction, and significance of the core explanatory variables have no significant difference whether control variables are added or not. It also verifies the robustness of the regression results. Since the inclusion of control variables can avoid the endogeneity problem caused by omitted variables and make the test results more consistent with objective facts, the model results with the control variables are selected for analysis in this study.
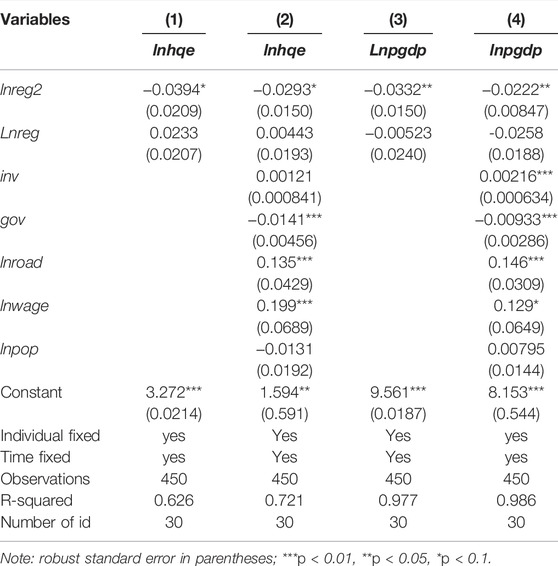
TABLE 6. The influence of environmental regulation on economic development.
According to the regression results in column (2) of Table 6, the quadratic coefficient of environmental regulation is −0.0293 at 10% significance level, while the primary coefficient is 0.00443, indicating that there is an inverted “U” shaped relationship between environmental regulation and HQED, which rises and then falls. When the level of environmental regulation is below 0.0756, there is an “innovation compensation” effect between environmental regulation and HQED, and the level of China’s HQED tends to increase with the increase of environmental regulation, because HQED pays more attention to the coordinated development of economy, society, and ecology. According to Porter’s hypothesis, appropriate environmental regulation can stimulate enterprises to engage in technological innovation and reduce environmental pollution, thus promoting HQED. However, when the environmental regulation level is bigger than 0.0756, the level of HQED keeps decreasing as environmental regulation increases, because strict environmental regulation increases the cost of pollution control, squeeze out the R&D investment in enterprise, and even break the reasonable industrial chain, thus inhibiting HQED.
According to column (4) of Table 6, the coefficient of the quadratic term of environmental regulation is −0.0222 and the coefficient of the primary term is −0.0258 at 5% level of significance, indicating that there is a negative relationship between environmental regulation and quantitative economic development. That is, the relationship between environmental regulations and quantitative economic development exhibits a “compliance cost” effect, with stronger environmental regulations inhibiting economic volume growth. At present, China’s economic growth still depends on energy consumption, fossil fuel burning, and secondary industry development. Strict environmental regulations restrict the development of pollution-intensive industries, which puts high energy consumption and high pollution enterprises under greater cost pressure and even triggers the phenomenon of enterprise closure and industrial transfer, leading to a decline in the development level of the region’s economic quantity.
According to the coefficient of the control variables, there is a positive effect of the size of fixed asset investment on both HQED and quantitative economic development. For every 1 percentage point increase in the scale of fixed asset investment, the level of HQED increases by 0.121% on average, and the level of quantitative economic development increases by 0.216% on average. It indicates that expanding the scale of fixed asset investment helps to increase the vitality of enterprises, thus promoting economic development. There is a significant negative effect of government intervention on both HQED and quantitative economic development. For every 1 percentage point increase in government intervention, the level of HQED decreases by 1.41% on average, and the level of quantitative economic development decreases by 0.933% on average. This indicates that although government intervention can solve the problem of “market failure” to some extent, excessive government intervention may inhibit enterprise innovation and is detrimental to the efficient allocation of resources, thus reducing the economic development level. Road area per capita and disposable income per inhabitant have a significant contribution to the development of economic high-quality and economic quantity. For every 1% increase in road area per capita, the level of HQED increases by 0.135% on average, and the level of economic quantity development increases by 0.146% on average. For every 1% increase in per capita disposable income, the average increase in the level of HQED is 0.199% and the average increase in the level of economic quantity development is 0.129%. It can be seen that the increase of transportation convenience can promote regional exchange, science and technology exchange, which is beneficial to economic development; at the same time, higher per capita disposable income means higher living standard, and higher living standard helps to achieve economic development. There is a negative correlation between urban population density and HQED, and a positive correlation with the level of quantitative economic development. For every 1% increase in population density, the average level of HQED decreases by 0.0131%, while the average level of quantitative economic development increases by 0.00795%. The reason is that population gathering brings a large amount of labor force, which can pull the economic quantity growth. However, too much population means an increase in resource demand, energy consumption, and pollution emissions, which is not conducive to HQED.
4.3.2 Regional Heterogeneity Analysis of the Impact of Environmental Regulation on China’s HQED
Table 7 shows the impact of environmental regulation on the HQED and the quantitative economic development in China’s eastern, central, and western regions. According to column (1), the quadratic coefficient of environmental regulation is −0.00945 and the primary coefficient is 0.00788, indicating that there is an inverted U-shaped nonlinear correlation between environmental regulation and HQED in the eastern region. When the level of environmental regulation is lower than 0.4169, there is an “innovation compensation” effect between environmental regulation and HQED; when the level of environmental regulation is higher than 0.4169, the increase of environmental regulation will inhibit HQED in the eastern region. According to column (2), the quadratic coefficient of environmental regulation is -0.0201 and the primary coefficient is −0.0357, indicating that there is a “cost of compliance” effect between environmental regulation and quantitative economic development in the eastern region. It can be seen that in the eastern region, although environmental regulation reduces the level of quantitative economic development, appropriate regulatory measures are conducive to social and ecological development for the better, and the social and ecological gains outweigh the economic losses, thus increasing the level of quality economic development in the region. According to column (3), there is an “innovation compensation” effect between environmental regulation and HQED in the central region, and the level of HQED in the region gradually increases with the strengthening of environmental regulation. The regression results in column (4) show that there is a “U” shaped relationship between environmental regulation and quantitative economic development in the central region. When the level of environmental regulation is lower than 0.5786, the relationship between environmental regulation and quantitative economic development shows the “cost of compliance” effect, and the increase of environmental regulation will inhibit economic quantity development; when the level of environmental regulation is higher than 0.5768, it shows the promotion effect on economic quantity development. It can be seen that in the central region, strict environmental regulation measures increase the cost of pollution for enterprises and force them to reform through technological innovation and other means to promote economic quantity and quality. Columns (5) and (6) demonstrate the effect of environmental regulation on economic development in the western region. According to the regression results, there is a “cost compliance effect” between environmental regulation and economic development in the western region, i.e., enhanced environmental regulation inhibits economic quality development and economic quantity development. The reasons may lie in the lack of talent in the western region, the level of technological innovation is more backward, economic development is dominated by traditional industries, and strict environmental regulations restrict economic development in the western region, resulting in a decline in both economic quality and economic quantity. In summary, there is obvious regional heterogeneity in environmental regulation effects due to differences in geographic location, resource endowment, and other aspects.
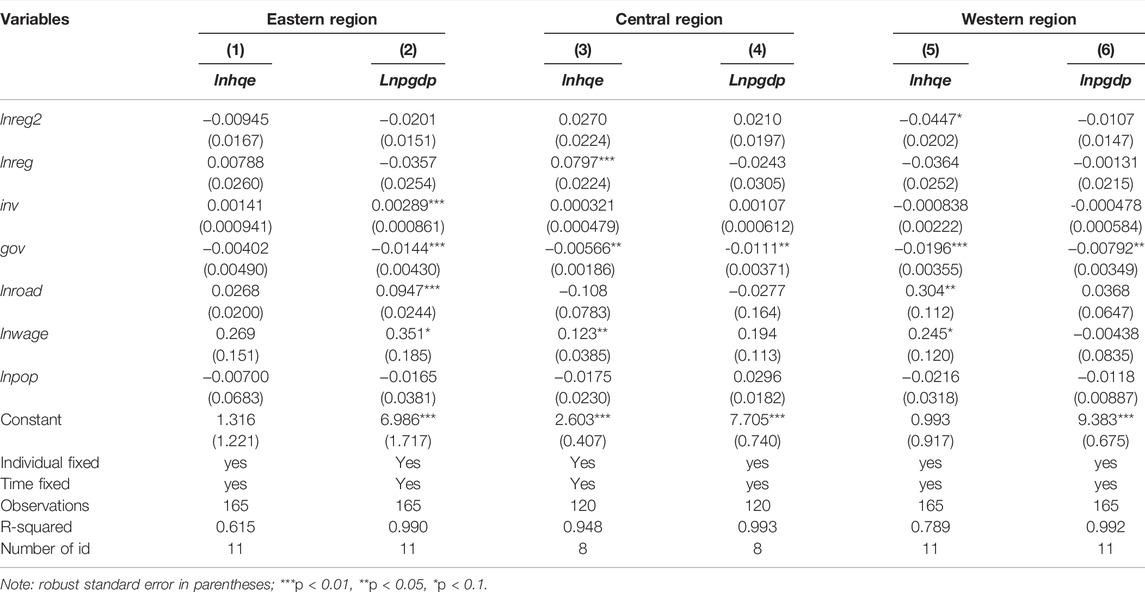
TABLE 7. The regional heterogeneity of environmental regulation.
4.3.3 Robustness Test
To test the reliability of the model results, this study applies the core variable substitution method for robustness testing. Specifically, regressions are conducted with the value of HQED (hqe) as the explanatory variable, the squared term of environmental regulation (reg2), and the primary term of environmental regulation (reg) as the core explanatory variables. In addition, regressions are conducted by using log regional GDP (lngdp) as an indicator of economic quantitative development and the squared term of log environmental regulation (lnreg2) and the primary term of log environmental regulation (lnreg) as the core explanatory variables. The results of the robustness tests are shown in Table 8. Only the direction of lnreg coefficient in column (4) and the direction of reg coefficient in column (7) differs from the previous results. However, the basic conclusion remains the same, both reflecting that stronger environmental regulation has a suppressive effect on the quantitative development of the eastern economy and the high-quality development of the western economy. So far, the robustness of the model is verified.
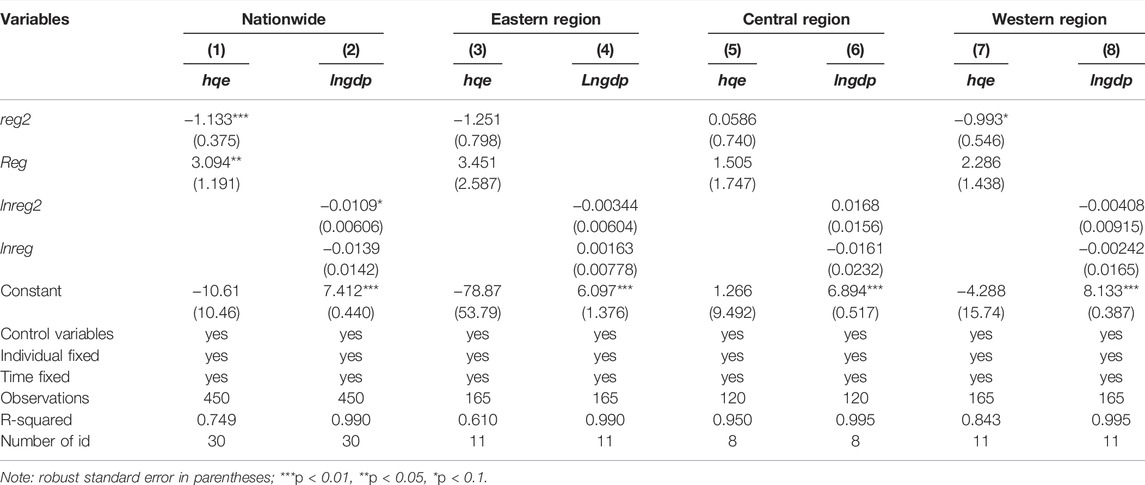
TABLE 8. The results of empirical test.
5 Conclusion and Policy Suggestions
5.1 Conclusion
To realize the win-win of economic development and environmental protection is always the focus of people’s attention. As China enters a new stage of historical development, HQED has become the goal pursued by China in the new era. Given this, this study constructs an economic quality development evaluation index system based on panel data of 30 provinces (cities and regions) in China, and establishes a panel data regression model to explore the impact of environmental regulation on HQED. This study mainly draws the following conclusions. First, China’s overall and regional HQED index shows a fluctuating upward trend. Among them, the high-quality development index of China’s economy increases from 27.87 to 33.95, with an increase of 22%. The HQED index of the eastern region increases by 10% from 40.82 to 44.93. The central region’s index increases by 33% from 22.87 to 30.33. The western region’s index increases by 38% from 18.55 to 25.60. Second, China’s economic high-quality development index shows obvious regional differences. Among them, the HQED index of the eastern region has always been the best, far higher than that of the central and western regions. The central region ranks second among the three regions, but has been lower than the national average for years. The HQED index in the western region has been the lowest for years, and there is a large room for progress. Third, the level of high-quality development of the Chinese economy is low. Both at the national and regional level, the HQED has not reached the passing level. Among the 30 provinces (cities, regions), only Guangdong province barely passes the high-quality level of economic development. Fourth, there is an inverted “U” shaped relationship between environmental regulation and HQED, and a “cost of compliance” effect between environmental regulation and quantitative economic development. Fifth, in China, the effect of environmental regulation has certain regional heterogeneity. Specifically, the impact of environmental regulation on economic development in eastern China is similar to that in the whole country. However, in the central region, there is an “innovation compensation” effect between environmental regulation and HQED, while there is a “U” shape relationship between environmental regulation and quantitative economic development. In the western region, strict environmental regulation has a restraining effect on HQED and quantitative economic development.
5.2 Policy Suggestions
According to the conclusion, this study put forward the following suggestions. First, it is necessary to attach importance to coordinated regional development and coordinate the high-quality and all-round improvement of the economy in the eastern, central, and western regions. It is found that although the HQED of China and the three regions shows an upward trend, there are obvious regional differences in the HQED index. Therefore, it is important to strengthen the exchange of talents, technology, and other factors between regions, narrow the regional development gap, comprehensively improve the quality of China’s economic development level, and promote the coordinated development of the high-quality economy. Second, it is of great significance to firmly establish the concept of HQED and promote steady progress of HQED. The level of high-quality development of China’s economy is relatively backward, with no region reaching the pass mark except Guangdong Province. Therefore, all government departments, enterprises, and individuals should firmly establish the idea of HQED, protect the environment and save resources, abandon the “GDP only” theory, formulate and abide by the scientific macroeconomic control system, and promote the transformation of economic growth from quantity to quality. Third, it is a top priority to develop green industries and promote economic progress while maintaining stability. Appropriate environmental regulation is conducive to improving the level of HQED. At the same time, it will eliminate pollution-intensive industries, resulting in the reduction of the level of economic quantitative development. To ensure steady economic progress, it is necessary to develop green industries, promote industrial transformation and upgrading, stimulate consumer demand and support steady and sound economic development. Fourth, we should adopt appropriate environmental regulation measures under local conditions, and avoid the idea of “one size fits all”. China is a vast country with different customs, people, and resources. Therefore, for different regions, field research and other measures should be taken as far as possible to grasp the regional reality, formulate and adjust environmental regulation measures according to the actual situation, effectively guarantee people’s livelihood needs, protect ecological resources, and make decisions that are most conducive to the high-quality development of the local economy.
This research measures the level of high-quality economic development and studies the impact of environmental regulation on it. However, there are still some limitations in this study. When studying the impact of environmental regulations on high-quality economic development, on the one hand, the economic effects of different environmental regulations are not considered. In the future, the impact of heterogeneous environmental regulations on high-quality economic development can be studied. On the other hand, the influence of spatial factor is ignored. In the future, spatial econometric models can be used for analysis.
Data Availability Statement
Publicly available datasets were analyzed in this study. This data can be found here: https://data.cnki.net/Yearbook/Navi?type=type&code=A.
Author Contributions
Conceptualization XM; Data curation JX; Formal analysis XM and JX; Investigation XM; Methodology XM; Project administration JX; Resources JX; Software XM; Supervision JX; Validation XM; Visualization XM; Writing—original draft XM; Writing—review & editing JX.
Conflict of Interest
The authors declare that the research was conducted in the absence of any commercial or financial relationships that could be construed as a potential conflict of interest.
Publisher’s Note
All claims expressed in this article are solely those of the authors and do not necessarily represent those of their affiliated organizations, or those of the publisher, the editors and the reviewers. Any product that may be evaluated in this article, or claim that may be made by its manufacturer, is not guaranteed or endorsed by the publisher.
References
Abumunshar, M., Aga, M., and Samour, A. (2020). Oil Price, Energy Consumption, and CO2 Emissions in Turkey. New Evidence from a Bootstrap ARDL Test. Energies 13 (21), 5588. doi:10.3390/en13215588
Altarhouni, A., Danju, D., and Samour, A. (2021). Insurance Market Development, Energy Consumption, and Turkey's CO2 Emissions. New Perspectives from a Bootstrap ARDL Test. Energies 14 (23), 7830. doi:10.3390/en14237830
Chen, M., and Wang, H. (2021). Import Technology Sophistication and High-Quality Economic Development: Evidence from City-Level Data of China. Econ. Research-Ekonomska Istraživanja, 1–36. doi:10.1080/1331677x.2021.1956362
Chen, S., and Chen, D. (2018). Air Pollution, Government Regulation and High-Quality Economic Development. Econ. Res. J. 53 (02), 20–34. doi:10.1016/j.jebo.2018.02.004
Chen, S. (2009). Energy Consumption, CO2 Emission and Sustainable Development in Chinese Industry. Econ. Res. J. 44 (04), 41–55.
Conrad, K., and Wastl, D. (1995). The Impact of Environmental Regulation on Productivity in German Industries. Empirical Econ. 20 (4), 615–633. doi:10.1007/bf01206060
Greenstone, M., List, J. A., and Syverson, C. (2012). The Effects of Environmental Regulation on the Competitiveness of US Manufacturing (No. W18392). National Bureau of Economic Research.
Hu, H., Ma, Y., and Wu, S. (2020). Fuzzy Comprehensive Evaluation on High-Quality Development of China's Rural Economy Based on Entropy Weight. J. Intell. Fuzzy Syst. 38 (6), 7531–7539. doi:10.3233/jifs-179825
Liu, Y., Liu, M., Wang, G., Zhao, L., and An, P. (2021). Effect of Environmental Regulation on High-Quality Economic Development in China-An Empirical Analysis Based on Dynamic Spatial Durbin Model. Environ. Sci. Pollut. Res. 28 (39), 54661–54678. doi:10.1007/s11356-021-13780-2
Mei, L., and Chen, Z. (2016). The Convergence Analysis of Regional Growth Differences in China: the Perspective of the Quality of Economic Growth. J. Serv. Sci. Manage. 9 (6), 453–476. doi:10.4236/jssm.2016.96049
Qashou, Y., Samour, A., and Abumunshar, M. (2022). Does the Real Estate Market and Renewable Energy Induce Carbon Dioxide Emissions? Novel Evidence from Turkey. Energies 15 (3), 763. doi:10.3390/en15030763
Samour, A., Baskaya, M. M., and Tursoy, T. (2022). The Impact of Financial Development and FDI on Renewable Energy in the UAE: A Path towards Sustainable Development. Sustainability 14 (3), 1208. doi:10.3390/su14031208
Samour, A., and Pata, U. K. (2022). The Impact of the US Interest Rate and Oil Prices on Renewable Energy in Turkey: A Bootstrap ARDL Approach. Environ. Sci. Pollut. Res. doi:10.1007/s11356-022-19481-8
Vennemo, H., Aunan, K., Lindhjem, H., and Seip, H. M. (2009). Environmental Pollution in China: Status and Trends. Rev. Environ. Econ. Pol. 3 (2), 209–230. doi:10.1093/reep/rep009
Zhao, X., Ma, X., Shang, Y., Yang, Z., and Shahzad, U. (2022a). Green Economic Growth and its Inherent Driving Factors in Chinese Cities: Based on the Metafrontier-Global-SBM Super-Efficiency DEA Model. Gondwana Res. 106, 315–328. doi:10.1016/j.gr.2022.01.013
Zhao, X., Mahendru, M., Ma, X., Rao, A., and Shang, Y. (2022b). Impacts of Environmental Regulations on Green Economic Growth in China: New Guidelines Regarding Renewable Energy and Energy Efficiency. Renew. Energ. 187, 728–742. doi:10.1016/j.renene.2022.01.076
Zhou, B., Zeng, X., Jiang, L., and Xue, B. (2020). High-Quality Economic Growth under the Influence of Technological Innovation Preference in China: A Numerical Simulation from the Government Financial Perspective. Struct. Change Econ. Dyn. 54, 163–172. doi:10.1016/j.strueco.2020.04.010
Zhu, H., Zhu, J., and Zou, Q. (2020). Comprehensive Analysis of Coordination Relationship between Water Resources Environment and High-Quality Economic Development in Urban Agglomeration in the Middle Reaches of Yangtze River. Water 12 (5), 1301. doi:10.3390/w12051301
Keywords: high-quality economic development, environmental regulation, regional heterogeneity, fuzzy comprehensive evaluation, panel data regression
Citation: Ma X and Xu J (2022) Impact of Environmental Regulation on High-Quality Economic Development. Front. Environ. Sci. 10:896892. doi: 10.3389/fenvs.2022.896892
Received: 15 March 2022; Accepted: 24 March 2022;
Published: 07 April 2022.
Edited by:
Lianbiao Cui, Anhui University of Finance and Economics, ChinaCopyright © 2022 Ma and Xu. This is an open-access article distributed under the terms of the Creative Commons Attribution License (CC BY). The use, distribution or reproduction in other forums is permitted, provided the original author(s) and the copyright owner(s) are credited and that the original publication in this journal is cited, in accordance with accepted academic practice. No use, distribution or reproduction is permitted which does not comply with these terms.
*Correspondence: Junwei Xu, xujunwei0420@126.com