Characterization of Soil Pores Through X-Ray Computed Microtomography and Carbon Mineralization Under Contrasting Tillage and Land Configurations in the Indo-Gangetic Plains of India
 Tridiv Ghosh
  Pragati Pramanik Maity1*
  T. K. Das1*
  P. Krishnan1
  Debashis Chakraborty1 Arti Bhatia1 Mrinmoy Ray2
  Aditi Kundu1
  Ranjan Bhattacharyya1
- 1ICAR-Indian Agricultural Research Institute, Pusa Campus, New Delhi, India
- 2ICAR - Indian Agricultural Statistical Research Institute, Pusa Campus, New Delhi, India
Contrasting tillage and land configuration have important roles in porosity and pore size distribution (PSD), which in turn affects the carbon mineralization in soil. Information on the effects of these treatments on PSD and subsequent carbon mineralization is very limited. Hence, an attempt was made to evaluate the long-term impact of soil tillage and land configurations on the distribution of soil pores and its relationship with soil carbon mineralization under a maize (Zea mays)-wheat (Triticum aestivum) rotation. There were five treatments, that is, conventional tillage, (CT); permanent broad bed, (PBB); PBB + residue (R); zero tillage, (ZT); and ZT + R. Soil pores were quantified by X-ray computed tomography (μ-CT). The conversion of CT to ZT and PBB with or without residue retention (+R) resulted in the reduction of pores >60 μm diameter and was mostly due to a reduction in the number of larger size macro-pores (>110 μm). This resulted in restricted drainage. However, under these practices, pores with larger diameters (60–110 μm) facilitated soil aeration. The total organic carbon (TOC) was 15–48% and 17–47% higher under PBB, PBB + R, ZT, and ZT + R than that under CT in the 0–5 and 5–15 cm layers. The highest MWD (1.01 mm) was in the plots under PBB + R, and the lowest was in the CT plots, and all residue-retained plots (ZT + R and PBB + R) had a higher MWD than residue removal plots (ZT and PBB). Relative to CT, soil C mineralization rates in 0–5 and 5–15 cm soil depths were 63 and 55% higher in the alternate tillage practices, respectively, and the highest value occurred in PPB + R treatments. Increased labile C concentrations were indicative of greater mineralization and were correlated with pores >60 μm, particularly in the size range 110–500 μm and TOC concentrations of 0–15 cm soil layer. Thus, the transition to alternate tillage from the conventional tillage enhanced soil organic carbon concentration (16–47.5%), improved soil structure, reduced the diameter of pores up to >60 μm, and facilitated C mineralization by altering the pore size distribution of soil under a maize-wheat system in the IGP.
Introduction
Uninterrupted use of conventional tillage (CT), which is resource consuming in nature, in agriculture has resulted in various agricultural challenges. The challenges are loss of soil organic carbon (SOC) through faster oxidation (Zhang et al., 2008; Bhattacharyya et al., 2012), increased greenhouse gas (GHG) emissions (Pathak et al., 2017), loss of important plant-available nutrients, poor soil health (Bhattacharya et al., 2020), and extended land degradation (Jat et al., 2014). Widespread degradation of soils and natural resources poses a big challenge for researchers to come out with an advanced natural resource management practice to improve soil health (Bhattacharya et al., 2020) and sustain agricultural productivity (Jat et al., 2014). In this context, conservation tillage/alternate tillage had emerged as an alternative to address the concerns of agricultural sustainability on a wider scale (Saharawat et al., 2010; Das et al., 2018).
The adoption of contrasting tillage/land configurations had changed most of the patterns of farming practices through modern mechanized agricultural operations (Alam et al., 2014). Field experiments conducted in several parts of the globe reported the benefits of crop yields and carbon sequestration under zero-tilled soils compared with tilled soils (Chakrabarti et al., 2014; Pathak et al., 2017). Land configuration techniques, such as bed planting, usually save irrigation water (Aggarwal et al., 2017) and labor requirement without affecting crop productivity (Ladha et al., 2009). Lichter et al. (2008) reported that a permanent bed planting system resulted in higher production, reduced the input cost and resource conservation, and maintained the permanent soil cover for efficient rain-water storage and conservation. However, other soil properties such as porosity and pore size distribution (PSD), carbon mineralization, and their relationships under contrasting tillage and land configurations were less emphasized. Hence, in recent years, several researchers revealed that no-tillage (NT) plus cover crop increased the SOC, which led to better soil physical structures and hydraulic properties (Ghosh et al., 2020), accelerated biological activity (Varvel et al., 2006), improved porosity and PSD (Bhattacharyya et al., 2006), and amplified C pools and nutrient cycling (Rabbi et al., 2016). Several studies reported that the CT system modified the pore shape and decreased the pore branch length and connectivity and the percentage of transmission pores (Pagliai et al., 2004; Dal Ferro et al., 2014). The CT system showed more vertically oriented macro-pores such as root channels and earthworm holes that can enhance soil aeration and moisture storage (Soane et al., 2012). Thus, various tillage and agronomic practices not only modify the total porosity and PSD (i.e., pore dimensions) but also alter the pore architecture and morphology (Piccoli et al., 2017). In general, C mineralization is greatly influenced by the pore size (Bouckaert et al., 2013). However, studies on porosity and PSD under contrasting tillage/land configuration and also their comparisons with CT are scanty.
The pore structure and connectivity in the soil greatly determine the flow of water in the soil which in turn affects the water transmission and soil moisture conservation (Rezanezhad et al., 2009). Decomposition of added organic matter was high in soil with a moderately high volume of pores (with neck diameters 15–60 mm). However, less organic matter decomposition was observed in soils with a fairly high volume of pores (with neck diameters <4 mm and 60–300 mm) (Strong et al., 2004). The PSD regulates the soil’s biological activities in two ways: first, microorganisms could be present in pores with a neck diameter three times their body size (Foster 1988), and second, the PSD controlled gaseous exchange and water allocation in the soil matrix. As the PSD had a great influence on soil microbial processes and community composition, PSD significantly regulates the soil organic matter (SOM) content (Bouckaert et al., 2013). The characterization of both soil pores and PSD has not been studied directly because of the paucity of information on the 3D structure of the soil pore network and their spatial arrangements in relation to carbon (C) dynamics (Young et al., 2001).
X-ray computed tomography (μ-CT) is a non-destructive and high-resolution (mm- to μm- scale) imaging technique for the visualization and quantification of PSD. As μ-CT is non-destructive and non-invasive in nature, it can provide spatial information on macro-pore networks and generate information about the process and fate of the SOM (Kravchenko and Guber, 2017). This technique can fetch more detailed information about the spatial variability of root systems and rhizosphere processes. The μ-CT technique has been effectively used in the study of PSD, morphology, and connectivity of pores in both undisturbed and packed soil columns (Anderson, 2020).
μ-CT allows the study of pore structures at a micron scale, but quantifiable data on how the pores affect the fate, protection, and mineralization of SOC are crucial. Several researchers have observed a greater number of macro-pores in CT than in contrasting tillage (Josa et al., 2013; Mangalassery et al., 2014). From a literature survey, it is clear that the quantification of porosity and PSD under contrasting tillage and land configuration practices using 3D μ-CT is scanty. Hence, the objective of the study was to evaluate how long-term contrasting tillage and land configurations affect porosity, PSD, soil structure, and subsequently carbon mineralization in soils. The hypothesis of the study was that i) permanent broad bed along with residue retention (PBB + R) and zero-tillage along with residue retention (ZT + R) would have improved the pore size distribution compared with conventional tillage (CT) and ii) PBB + R and ZT + R would have more soil carbon and greater C mineralization than CT and other alternate tillage practices without residues.
Materials and Methods
Experimental Site
The experiment was conducted in a maize (Zea mays L.)–wheat (Triticum aestivum L.) cropping system, and soil samples were collected at maize sowing during the kharif season (July 2019), at the Research Farm of the Indian Agricultural Research Institute (IARI), New Delhi, India (77º9′N, 28º37′E, 228.7 m asl). The study area falls under semi-arid climatic conditions, prevalent with dry hot summer and cold winter seasons. The mean annual precipitation is 710 mm, and ∼80% of the total rainfall occurs from July to September due to the south-west monsoon, and the rest occurs from December to February due to the Western disturbances (Das et al., 2018). The soil up to 15 cm soil depth of the experimental field has a sandy clay loam texture with pH 7.7, electrical conductivity (EC) of 0.64 dSm−1, Walkley and Black C (oxidizable SOC) 5.2 g kg−1, KMnO4 oxidizable N 182.3 kg ha−1, 0.5 M NaHCO3 extractable P 23.3 kg ha−1, and 1 N NH4OAc extractable K 250.5 kg ha−1. More details about initial soil characteristics of the experimental site are given in the study by Das et al. (2018).
Experimental Details
The long-term field experiment was initiated in the year 2010 with contrasting tillage treatments: conventional tillage (CT), zero tillage (ZT) (since 2012), and ZT with the residue retention of previous crops (ZT + R) (since 2012); two land configurations were used in our study, that is, permanent narrow bed (PNB) (one row of maize per 0.4 m wide bed and 0.3 m wide-furrow), permanent broad bed (PBB) (two rows of maize per 1.1 m wide bed and 0.3 m wide-furrow), PBB along with crop residue retention (PBB + R), and PNB with crop residue retention (PNB + R) were considered. For this study, we carried out observations from five treatments, that is, CT, PBB, PBB + R, ZT, and ZT + R. Two treatments, that is, PNB and PNB + R were not considered in our study. The treatments were laid in a completely randomized block design. There were 1.5 m wide gaps between the plots, and every plot was bordered by ridges for the application of irrigation water.
The CT plots were prepared by ploughing with a tractor-drawn disk plough, cultivator, and harrow, followed by leveling, during every season for getting good tilth. For ZT and PBB plots, both with and without residue retentions, no tillage was performed. In the residue retention plots, about 40% of wheat straw yield and 40% of maize stover were retained. In 2009–10, the wheat straw yield was ∼6.5 t ha−1. Therefore, nearly 2.6 t ha−1 ex situ wheat residue was applied to the PBB + R plots of maize at the beginning of the experiment (2010–11).
The in-situ maize and wheat crop residues were left on the residue retained plots (i.e., ZT + R and PBB + R) which were accessible from the winter season (i.e., wheat) of the first year onward. For CT and residue removal plots, the wheat and maize crops were manually harvested by cutting the plants at about 3–4 cm above the soil surface. Therefore, it was estimated that ∼4.5% of wheat straw was kept as stubble in CT and other residue removal plots in all years. In the case of residue retention plots, the standing maize plants were manually cut at 0.4 m height from the base and kept in situ as anchored residues and valued; if 40% retention was not fulfilled, then the loose residue was uniformly applied in the residue retention plot. Similarly, wheat was harvested at 0.4 m height from the base of the plants with a combination, and the rest was left as stubble. The 3 years’ cumulative amount of residue inputs to the maize-wheat system were ∼0.92, 0.90, 14.90, 1.20, and 10.90 Mg ha−1 in the plots under CT, PBB, PBB + R, ZT, and ZT + R, respectively, (Das et al., 2018).
Soil Sampling Details and Analysis
For the analysis of all soil parameters, samples were collected in two sets: one was collected by using a core cylinder of 15 cm height and 5.5 cm diameter for pore size distribution, bulk density, and mineralization study, and another was collected as loose samples for the carbon and aggregate analysis using a tube auger (Ghosh et al., 2018). Soil samples were collected from 0–0.05 and 0.05–0.015 m soil depth with three replications per treatment before sowing maize (July 6, 2019).
Soil Aggregation
The aggregate stability analysis was performed by using Yoder’s wet sieving apparatus (Kemper and Rosenau, 1986). At first, 100 g of air-dried soil was taken after passing through an 8 mm sieve, and then the soil sample was kept uniformly on top of a 2-mm sieve. Beneath that sieve, a layer of two sieves was observed with opening sizes of 0.25 and 0.053 mm. The sieve set was lowered into the water bath in such a way that the soil in the top sieve was just below the water level in the upstroke of the machine. The sieve set was moving up and down in the water approximately 30 times per 10 min (Yoder, 1936). After that, the sieves were taken out from the water. Each sieve was washed several times separately, and the residue was passed through a filter paper, and then the, oven-dried (105°C) weight was taken. The mean weight diameter (MWD) (Van Bavel, 1949) was calculated by following the procedure given in Bhattacharyya et al. (2020).
The MWD of the water-stable aggregates was calculated using the following equation (Singh et al., 2018):
where xi is the mean diameter of ith class (mm), and wi is the weight of ith class.
Total Organic Carbon and Soil Carbon Pools
The total organic carbon (TOC) in soil was measured by using the automatic TOC analyzer (Vario EL, Elementar Analysensysteme GmBH, Hanau, Germany). The main principle behind the TOC analyzer is the catalytic oxidation combustion technique in the presence of a high temperature of 720°C (Bhattacharya et al., 2020). The generated concentration of carbon dioxide was estimated by using a non-dispersive infrared sensor. For the analysis of carbon fractions, less than 0.2 mm size air-dried soil samples were used. The oxidizable organic carbon content of soils was measured using the wet oxidation method given by Walkley and Black (1934). The different fractions were estimated by following the modified Walkley and Black method, as elaborated by Chan et al. (2001).
Here, 5, 10, and 20 ml of concentrated H2SO4 were used, and it resulted in three acid aqueous solutions of ratios 0.5:1, 1:1, and 2:1, respectively, and it corresponded to 12N, 18N, and 24N of H2SO4, respectively.
Pool I: (very labile)—Amount of organic carbon oxidized by 12N H2SO4.
Pool II: (labile)—Difference in the amount of carbon oxidized by 18N and 12N H2SO4.
Pool III: (less labile)—Difference in the amount of carbon oxidized by 24N and that by 18N H2SO4.
Pool IV: (non-labile)—Difference in the total carbon and carbon oxidized by 24N
Labile fraction = Pool I + Pool II
Less/moderately labile fraction = Pool III
Recalcitrant fraction = Pool IV
Porosity and Pore Size Distribution Under Different Contrasting Tillage and Land Configurations
The porosity and PSD were measured by X-ray computed microtomography (μ-CT). The instrument can broadly be classified into three parts: an X-ray source, a sample holder, and a detector. The fundamental principle of μ-CT is directing the X-ray through the object at different orientations, and the decrease in intensity is measured by the detector (Ketcham and Carlson, 2001). The oven-dried (105°C) bulk density samples were used for μ-CT scanning.
For generating the X-ray, a voltage of 120 kV and 90 μAm current was applied. For scanning the soil sample, a voxel size (volumetric representation of a 2D pixel in 3D) of 60 μm was used. The sample was rotated from −180° to +180° in front of the X-ray source so that about 1,000 projection images can be taken from each sample utilizing 500 μs exposure of the detector. Sample mounting, scanning and image processing, and analysis are the three main steps associated with the determination of the porosity of the soil sample through X-ray μ-CT. The soil samples were mounted on a separate sample holder which was kept in front of the X-ray source. Thereafter, the samples were scanned individually with the help of an X-ray μ-CT system (Phoenix Vtomexs, GE Sensing and Inspection Technologies GmbH, Wunstorf, Germany) for analyzing their porosity.
After the acquisition of corrected volumetric data from the system, the images were processed by VG Studio Max software (Version 2.2.3, Volume Graphics GmbH, Heidelberg, Germany). The 3D model of the sample was generated by selecting the threshold of the material and the background. The porosity of the sample was determined by selecting the porosity module of the piece of software. As the voxel size was 60 μm, pores smaller than 60 μm were not detected by the X-ray μ-CT system. Thus, the analyzed pores were >60 μm (macro-pores). Several scientists have classified the soil pores into different classes based on the diameter of the pores. In this study, we have classified the soil pores into 60–100 μm (Class 1), 110–500 μm (Class 2), 510–1,500 μm (Class 3), and >1,500 μm (Class 4), based on the classification proposed by Clothier (2008). The proportion of the number of pores >60 μm in each class was also computed.
Carbon Mineralization
The soil samples were taken from 0–5 cm and 5–15 cm depths using a core sampler. The moisture content of the soil samples was fixed at 60% of the water-filled pore space (WFPS). All soil cores were kept in a closed airtight glass container with a lid and septum. These containers were then placed in an incubator at 30°C for 28 days. The rate of carbon mineralization was monitored by taking the gas samples at 30 min intervals with a 250 ml syringe at 1, 4, 7, 11, 18, 21, and 28 days. After collecting the gas samples, the containers were opened for 30 min for free gas exchange and oxygen supply; also, the moisture content of the samples was adjusted with distilled water on a weight basis. The gas samples were analyzed using a gas chromatography (GC) method (Zibilske, 1994; Bouckaert et al., 2013). In GC, the emitted CO2 from the soil sample was converted to methane through the process of methanization and measured by using the flame ionization detector (FID). The results obtained from GC were converted to the equivalent amount of soil carbon by taking into consideration the molecular weight of CO2.
Kinetics Model of Carbon Mineralization
Decomposition kinetics of the soil organic matter was fitted to a first-order exponential model (Stanford and Smith, 1972). The model is written as follows (Eq. 2):
where Cm—cumulative CO2, C emission, C0—potentially mineralizable C (mg g−1), kc—decomposition rate constant (day−1), and t—time of incubation (days).
Statistical Analysis
The data obtained from the analyses of the soils were subjected to the analysis of variance (ANOVA) for a randomized block design (RBD) with three replications. Duncan’s multiple range test (DMRT), a significant difference test, was used as a post hoc mean separation test (p < 0.05) using SPSS 21 (IBM). The values followed by the same letters within a column are not significantly different at p < 0.05.
Results
Porosity and Pore Size Distribution of Soil
Among the different treatments tested in this study, huge variations in the number of soil pores were observed in the 0–5 cm soil depth (Table 1; Figure 1). The total number of macro-pores (>60 μm) was the highest in the ZT + R plots, followed by PBB + R plots, and the lowest number of pores was in PBB, followed by the ZT plots (Table 1; Figure 1). In the CT plots, the number of macro-pores was ∼12.4% higher than ZT. However, the number of macro-pores was higher by 88 and 92.74% in the plots under PBB + R and ZT + R, respectively. All residue applied plots (PBB + R and ZT + R) had a greater number of macro-pores (an average of 84.9%) than residue removal plots (PBB and ZT). In the size range of 60–100 μm, the plots under ZT + R had ∼5.7% more pores than PBB + R plots. The percentage of pore number in the size range >1,500 μm was maximum in CT (0.11% of the total pores) and minimum in ZT (Table 1).
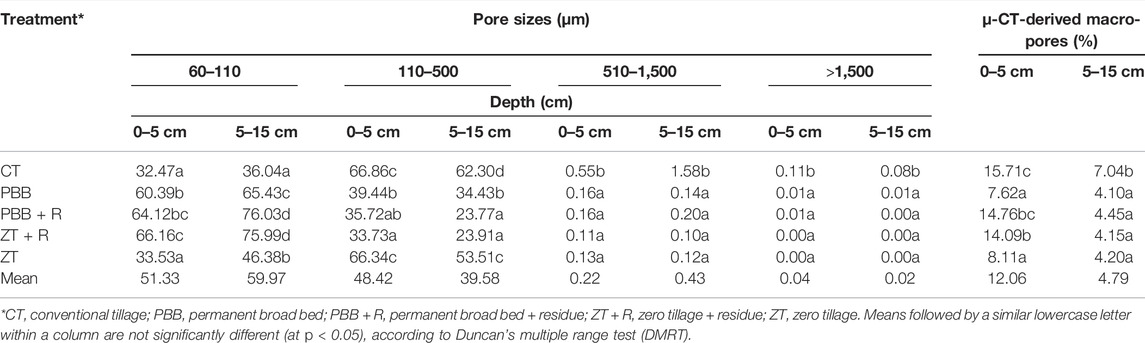
TABLE 1. Percentage of the number of pores >60 µm in each size range for 0–5 cm and 5–15 cm depths under different treatments.
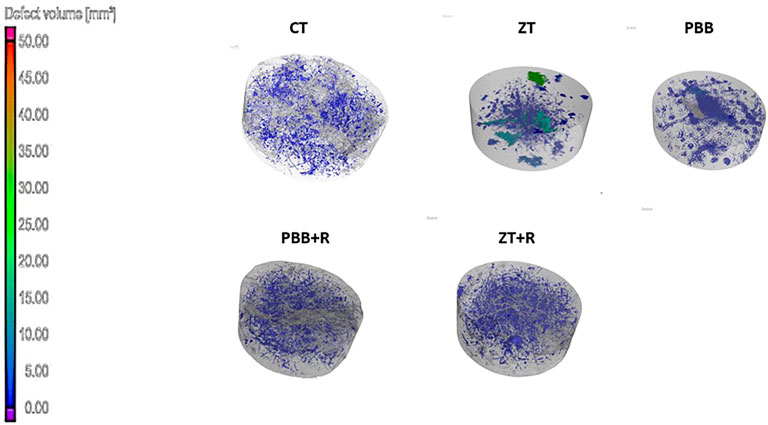
FIGURE 1. Three dimensional view of the pore characteristics of a soil core (0–5 cm layer) under conventional tillage (CT) and zero tillage practices with residue (ZT + R), without residue (ZT), and permanent broad bed (PBB) with residue (PBB + R).
The average number of pores under alternate tillage and land configuration-based plots in the range of >1,500 μm was 5 compared to 105 in CT plots (Figure 1). In CT and ZT plots, the percentage of pore numbers in the size range 110–500 μm was significantly higher than in other treatments. In the 110–500 μm size range, residue retained plots had ∼60% more pores than residue removal plots. Under CT plots, ∼197% more pores were found in the 510–1,500 μm and 110–500 μm size ranges than all alternative tillage and configuration-based plots. Plots with CT and ZT had a significantly lower proportion of pore numbers in 60–100 μm and 110–500 μm size ranges in the 5–15 cm depth (Figure 2).
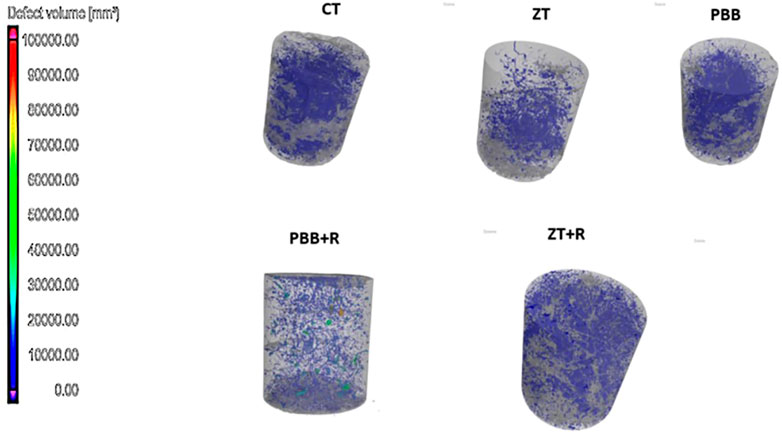
FIGURE 2. Three dimensional view of the pore characteristics of a soil core (5–15 cm layer) under conventional tillage (CT) and zero tillage practices with residue (ZT + R), without residue (ZT), permanent broad bed (PBB), and PBB residue (PBB + R).
The μ-CT-derived macro-porosity ranged from 7.6 to 15.2% in all treatments, with an average of 11.6%. The macro porosity was maximum in CT plots, and among all treatments, the trend was as follows: CT > PBB + R > ZT + R > ZT > PBB. The μ-CT-derived average macro-porosity was maximum in the CT plots (7%), and in all other plots, it was ∼4.2%. Irrespective of the treatments, the amount of macro-porosity decreased with the increase in soil depth. In the present study, a huge variation was observed in the number of soil pores among the treatments. In 0–5 cm of soil depth, the total number of pores in the >60 μm range was the highest in ZT + R, followed by PBB + R, and the lowest was found in PBB, followed by ZT (Table 1). Irrespective of the treatments, as the depth increased, the smaller pores increased and macro-porosity decreased (Figure 2). The number of detected pores in each class was reduced with the increased pore diameter.
Total Organic Carbon and Soil Carbon Pools
The average TOC content of all the plots was 9.3 g/kg soil in 0–5 cm soil depth. Among all treatments considered in this study, CT plots had the lowest TOC content of 7.50 g/kg (Table 2), and PBB + R plots had the highest. The magnitude of the TOC content in different treatments followed the order as PBB + R > ZT + R > PBB > ZT > CT. At 0–5 cm soil depth, the TOC varied from 15 to 48% in all other treatments, when compared with CT. In the 5–15 cm soil depth, CT plots had the lowest, and PBB + R plots had the highest TOC values among all treatments. The TOC contents in the CT plots were 31.9, 47.3, 16.9, and 30.9% higher than PBB, PBB + R, ZT, and ZT + R, respectively, in the 5–15 cm soil depth. Residue retained plots (+R) had ∼18 and 12% more TOC content in the 0–0.05 and 5–15 cm soil depths, respectively, than residue removal plots (-R).
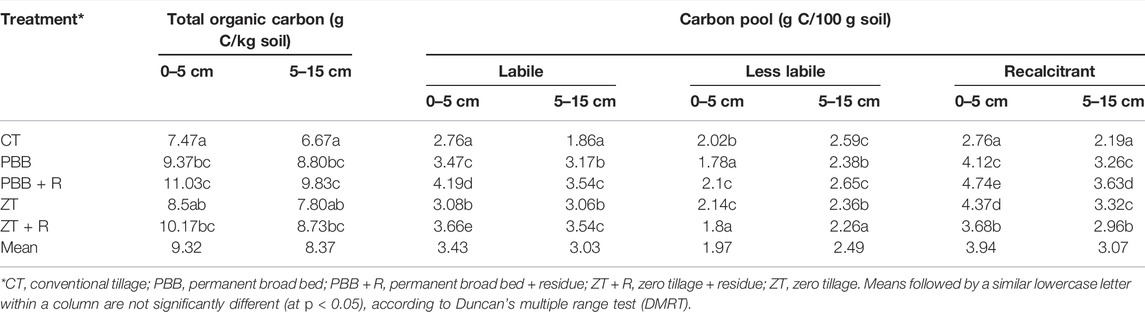
TABLE 2. Total organic carbon content (g/kg) and organic carbon pools (g/100 g soil) in 0–5 and 5–15 cm of soil layers.
Mean Weight Diameter and Soil Aggregation
In the 0–5 cm soil depth, the highest MWD (1.01 mm) was in the plots under PBB + R, and the lowest was in the CT plots (Table 3). All residue retained plots had a higher MWD than residue removal plots. In the 5–15 cm soil depth, the lowest MWD (0.79 mm) was in the plots under CT, and it was the lowest among all treatments (Table 3). Plots under CT had a range of 5.0–14.6% lower MWD than all other treatments, with a reduction of 5.12% in MWD from 0–5 and 5–15 cm soil depths. The retention of residues (PBB + R and ZT + R plots) improved the MWD by 6 and 4% in 0–5 cm and 5–15 cm soil depths, respectively. In the 0–0.05 m soil depth, the lowest macro-aggregates were observed under the CT plots, which was the lowest among all treatments (Table 3). The plots under PBB + R had the highest macro-aggregates (54.9 g/100 g soil). Macro-aggregates of PBB and ZT + R plots were not significantly different from each other. Residue retained plots had an average macro-aggregate of 3.8 g/100 g soil more than residue removal plots (i.e., ZT and PBB plots). Significantly lower macro-aggregates of 42.1 g/100 g soil were observed in CT plots than in the PBB + R plots in the 0.05–0.15 m soil depth (Table 3).
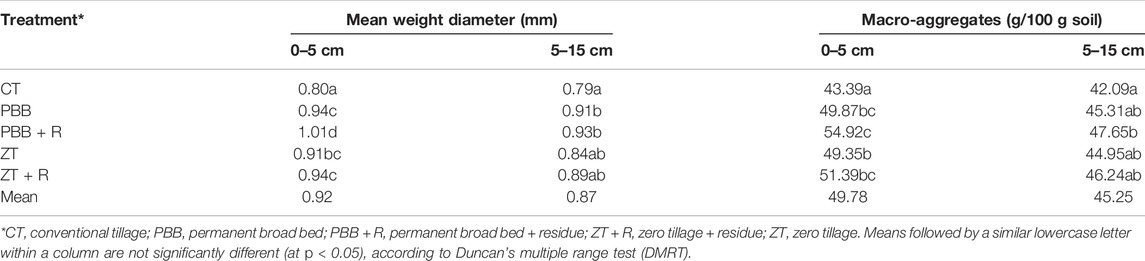
TABLE 3. Macro-aggregates and mean weight diameters of soil aggregates in 0–5 and 5–15 of soil layers.
Carbon Mineralization in Contrasting Tillage and Land Configurations
Cumulative mineralization (Cm) was the lowest under the CT plots, and the percentage of the TOC mineralized was 9.79 in the 0–5 cm soil depth (Table 4 and Figure 3). In general, all CA plots had ∼57% more mineralization than CT plots. The highest Cm was obtained in the plots under PBB + R, although PBB plots had similar Cm to the PBB + R plots. All residue retained plots had ∼22% more TOC mineralization than the residue removal plots. In 5–15 cm of soil depth, the lowest Cm value was obtained for the CT plots, and the trend followed was PBB + R > PBB > ZT + R > ZT > CT. After 28 days of incubation, the Cm in CT plots was 53.6 mg/100 g of soil, and an average Cm value of 86.1 mg/100 g of soil was observed in all the CA plots (Table 3). Residue retained plots (PBB + R and ZT + R) had ∼40.5 mg/100 g soil of more mineralization than the residue removal plots (PBB and ZT plots). The lowest kc value was obtained in the CT plots, and the highest kc was in PBB plots (Table 3). As the depth increased from 0–5 cm and 5–15 cm, the proportion of the TOC mineralized decreased by ∼17.7% in the CT plots. However, in all other plots, the average decrease in the proportion of the TOC mineralized was ∼20.5%.
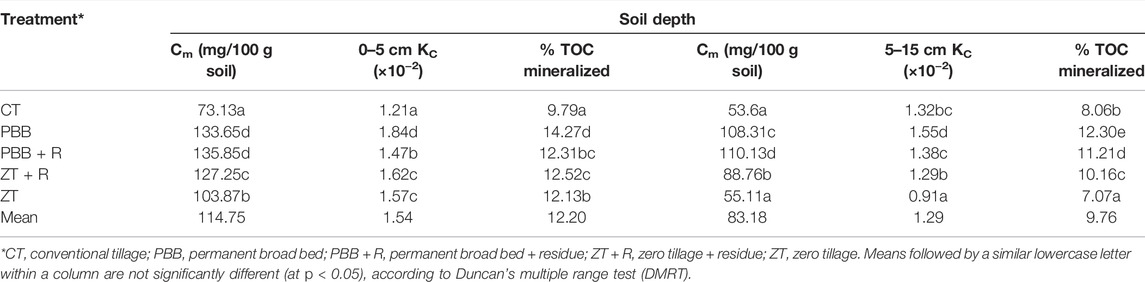
TABLE 4. Mineralized carbon (Cm) and decomposition constant (Kc) values in 0–5 and 5–15 cm soil layers.
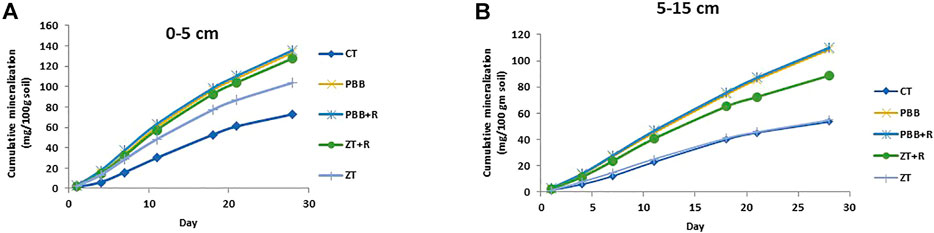
FIGURE 3. Cumulative carbon mineralization affected by different CA practices (A) 0–5 cm (B) 5–15 cm soil depth.
Relationships Between Total Organic Carbon, Soil Aggregation, Porosity, and Pore Size Distribution With Carbon Mineralization
The Pearson correlation matrix was calculated among the various soil parameters, such as mineralization, field observed porosity (calculated from BD and particle density data, data not shown), μ-CT-derived macro porosity, pores of different sizes, soil aggregates (i.e., macro-aggregates and MWD), and TOC concentration (Table 5). Results showed that the mineralization rate was positively and strongly correlated with the porosity, MWD, macro porosity, and TOC concentration. Mineralization was positively correlated with 60–100, 110–500, and 510–1,500 μm size ranges. The correlation between the mineralization rate and the number of pore sizes of 110–500 μm was significant. The porosity was positively correlated with the pore number of different sizes, but the correlation was significant only with 110–500 μm pores. Macro porosity had a negative correlation with 60–100 μm pores, a significant positive correlation with 110–500 μm pores (r = 0.54; p < 0.05), and a positive correlation with 510–1,500 and >1,500 μm pores. Pores >1,500 μm had a negative correlation with the MWD, macro porosity, and TOC.
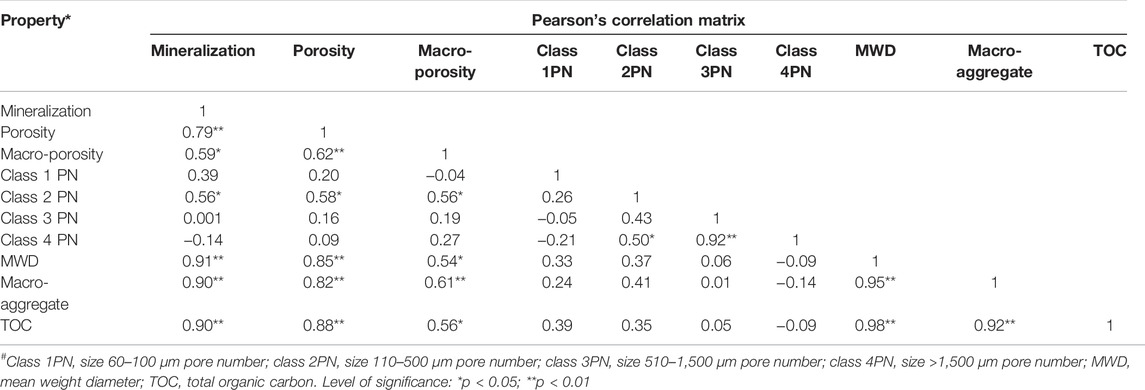
TABLE 5. Correlation matrix of soil C mineralization and porosity, number of different size pores, mean weight diameter, amount of macro-aggregates, and total organic C.
Discussion
The tillage caused the distribution of soil pores with time, and alternative tillage practices such as minimum tillage and zero tillage had a greater number of water-filled pores than CT due to better aggregate formation (Bhattacharya et al., 2020). Similar to our studies, Hussain et al. (1998) also observed that CT plots had more tillage-induced macro-pores in the surface soil layer, but these are not properly connected to the pores in the deeper depth. In contrast to our study, Anikwe and Ubochi (2007) observed that the ZT system was associated with substantial modifications in soil porosity, particularly in the topsoil when compared to CT treatments. Sasal et al. (2006) found 3.5% more porosity (obtained from BD and particle density) than ZT in the 0–15 cm soil layer, which is in agreement with our study.
More number of macro-pores was observed in in CT than in conservation tillage by Josa et al. (2013) and Mangalassery et al. (2014). Galdos et al. (2019) reported that the average macro porosity obtained from μ-CT was 14% for the plots under CT, and the value was similar to our observation of 15.7%. However, they obtained around 19.7% macro porosity under ZT; but in this study, we obtained a lesser amount of macro porosity from μ-CT scan images. This might be due to the presence of a greater number of micro pores, which our system might not have captured. In our study, despite the number of pores in 110–500 μm size being the maximum under CT, the total number of macro-pores was more in the plots under PBB + R and ZT + R (Table 1; Figure 1). The maximum number of pores in the 110–500 μm size range under the CT plots (Table 1; Figure 1) might be due to tillage practices and the breakdown of soil aggregates (Bauer et al., 2015).
In a study from Southern Brazil, Tuzzin de Moraes et al., 2016 reported a greater macro-porosity in the CT plots in the top 0–10 cm of the soil layer than in long-term minimum tillage and ZT plots. A decrease in pores >60 μm due to the conversion of CT to ZT and permanent bed (PBB) with or without residue retention was contributed mostly by larger size macro-pores (>110 μm). This indicates restricted free drainage under these alternate tillage practices and land preparations. A higher pore volume in the 60–110 μm size range, on the other hand, facilitates soil aeration in these practices.
In the present study, the total organic carbon concentration was 16–47.5% higher under alternate tillage practices (Table 2). A higher TOC under PBB + R plots might be due to the addition of fresh organic matter, which leads to the formation of particulate organic matter (POM) and protected SOC that remained in intra-aggregates (Jat et al., 2019). Similarly, the residue also protects the soil surface from the destructive action of rainwater and wind (Das et al., 2013), thus leading to more TOC in the topsoil. Repeated use of heavy machinery in the CT system always results in the rapid decomposition of the organic matter and a faster increase in the temperature in the soil profile, leading to reduced total SOC stock (Das et al., 2017).
In contrast to our findings, in two different experiments conducted by Nyamadzawo et al. (2008) and Gwenzi et al. (2009), the SOC was greater under NT and minimum tillage after 5 and 10 years of adoption. A reduced amount of tillage can decrease the amount of the SOC lost by forming macro-aggregates, thus providing physical protection to the POM (Mohanty et al., 2015; Page et al., 2019; Kan et al., 2021).
In our study, the average labile C pool was higher in the residue retention plots than the residue removal plots (Table 2). Residue-retained plots (PBB + R and ZT + R) had ∼20 and 14% more labile carbon pools in the 0–5 and 5–15 cm soil depths than the residue removal plots. In the 0–5 cm soil depth, the average recalcitrant pool compared to the labile pool was about 70.4% in all treatments. A study conducted by Bhattacharya et al. (2020) reported that under ZT + R, labile C pools were ∼36 and 22%, respectively, more than CT in the 0–15 cm and 15–30 cm soil depths. Similarly, the recalcitrant C pool was ∼12 and 9% more than CT plots (Table 2). This might be because of a higher labile SOC concentration in CA plots, due to greater biomass C inputs (Jat et al., 2019). In this study, the plots under PBB + R had a higher concentration of labile SOC than PBB with residue removal plots (-R) and a similar increase of 10–23% in each pool of SOC under alternate tillage practices.
Residue retention resulted in high C mineralization in the plots under PBB + R and ZT + R (Table 4; Figure 3). This might be because SOC mineralization is directly related to the amount of labile C pools present in the soil (Guo et al., 2019), and the addition of organic material in the soil accelerates the nutrient release process and significantly increases the mineralization of soil carbon pools (Grunwald et al., 2016). We observed a high kc value in the PBB plots than in PBB + R. This might be due to the better aggregation in the residue retained plots, thus protecting the SOC as intra-particulate organic matter, resulting in low kc values (Lamparter et al., 2009).
In general, the macro-aggregate content of PBB + R plots was not significantly different. Similar to our results, Choudhary et al. (2019) reported that the residue application increased the MWD and was the maximum in the 0–5 cm soil layer compared with the lower soil depths. Higher SOC content in the 0–15 cm soil layer under ZT might have caused more stable macroaggregates (Singh and Malhi, 2006). A higher amount of SOC helps in the aggregation of soil particles (i.e., clay and silt fraction), thus improving the soil structure and MWD (Ghosh et al., 2018). Chemicals produced during the decomposition process and root exudates and higher earthworm activity encourage clay and silt particle aggregation by temporary binding agents (i.e., fungal hyphae) and thus improve macro-aggregation (Bhattacharyya et al., 2019).
In CT plots, reduced aggregation occurred due to the physical destruction of soil through repeated tillage. The slaking and mechanical breakdown of soil aggregates in CT plots was more than in the system with higher inputs of organic matter. This results in higher microbial activity (Ghosh et al., 2016). In general, more SOC in ZT plots along with residue retention might lead to better stable aggregation in large macro-aggregates (Modak et al., 2020). Our study showed that plots under CA (ZT + R and PBB + R) improved macro-aggregate formation in the 0–5 and 5–15 cm soil depth, which is in agreement with the results observed by Bhattacharyya et al. (2018). This might be due to the fact that the addition of fresh organic material helps to build up hotspots for microbial activity. This promotes new soil aggregate formation, thereby causing larger macro-aggregates with residue retention (Ghosh et al., 2016; Kan et al., 2020). In general, more fungal biomass and huge root networks in no or reduced tillage treatments might have had a positive effect (Spurgeon et al., 2013).
Similar to our study, Bouckaert et al. (2013) reported a strong correlation between porosity and C mineralization. Mtambanengwe et al. (2004) also observed a good correlation between labeled substrate C mineralization and the clay content, bulk density, and soil pore spaces. They have also shown a negative correlation between pores with diameter <75 μm and C mineralization. In our study, a significant positive correlation between pore diameters of 110–510 μm with C mineralization was observed. Mtambanengwe et al. (2004) also reported that pores of <75 μm were inaccessible to microbes and help in soil carbon stabilization. We found that pores having diameters >1,500 μm had a negative correlation with C mineralization as larger pores (>300 μm) have a negative influence on SOM decomposition (Strong et al., 2004). Guo et al. (2019) reported a strong correlation between C mineralization, soil properties, and soil microbial composition. We observed that when the amount of SOC was more, the amount of C mineralized was also more as C mineralization is directly related to the amount of native SOC present in the soil (Chen et al., 2014), and as SOC increased, the aeration of the soil rises due to better aggregate formation (Parihar et al., 2019). But in this context, the availability of different components of SOC should be studied and linked with the pore diameter, and microbial habitation in different sizes of pores should be characterized to obtain more details regarding the PSD and its role in C mineralization.
Conclusion
The hypothesis of our study was that PBB + R and ZT + R would improve the pore size distribution and would have more TOC and greater mineralization ability as compared to CT. The results showed that μ-CT is an effective technique to characterize the pore size distribution in soils. The total number of detected pores in the 0–5 cm soil was the highest in ZT + R plots, followed by PBB + R plots, and the lowest was in PBB, followed by ZT plots. In CT plots, the number of macro-pores was ∼12.4% higher than ZT. However, the number of macro-pores was greater by ∼88 and 92.7% in plots under PBB + R and ZT + R, respectively. Pores of >1,500 μm size showed a negative correlation with parameters such as MWD, macro-porosity, and TOC. As the depth increased from 0 to 0.05 and from 0.05 to 0.15 m, the proportion of TOC mineralized decreased by 17.7% in CT plots. The mineralization rate showed a positive and significant correlation with the porosity, MWD, macro-porosity, and TOC.
Our long-term study suggested that contrasting tillage practices and land configurations (PBB + R and ZT + R) have the potential to maintain better pore size distribution and TOC. An increase in labile C pools indicate greater mineralization, which correlated significantly with pores larger than 60 μm and also with the size range 110–500 μm and TOC. Both labile and recalcitrant C pools were higher in contrasting tillage and land configuration practices. This indicated that C mineralization is healthy for the soil, and at the same time, there is a scope for C sequestration/accumulation over time in contrasting tillage and land configuration practices. Pores >1,500 μm, which were more in CT, were observed to be not desirable for maintaining a good soil physical environment. In this context, a C-mineralization study should be carried out in future, along with a microbial population study in the field as the microbial habitat was affected by different classes of pores and substrate availability.
Data Availability Statement
The data analyzed in this study is subject to the following licenses/restrictions. Our Institute does not allow sharing of data publicly. Requests to access these datasets should be directed to director@iari.res.in.
Author Contributions
TG, PM, TD, and DC carried out the research work, conceptualization, manuscript writing, and editing. AB, AK and MR contributed to research facility and analysis. PK was responsible for editing and institutional facility.
Conflict of Interest
The authors declare that the research was conducted in the absence of any commercial or financial relationships that could be construed as a potential conflict of interest.
Publisher’s Note
All claims expressed in this article are solely those of the authors and do not necessarily represent those of their affiliated organizations, or those of the publisher, the editors, and the reviewers. Any product that may be evaluated in this article, or claim that may be made by its manufacturer, is not guaranteed or endorsed by the publisher.
References
Aggarwal, P., Bhattacharyya, R., Mishra, A. K., Das, T. K., Šimůnek, J., Pramanik, P., et al. (2017). Modelling soil water balance and root water uptake in cotton grown under different soil conservation practices in the Indo-Gangetic Plain. Agric. Ecosyst. Environ. 240, 287–299.
Alam, M. D., Islam, M., Salahin, N., and Hasanuzzaman, M. (2014). Effect of tillage practices on soil properties and crop productivity in wheat-mungbean-rice cropping system under subtropical climatic conditions. Scient. World J. 240, 287–299.
Anderson, S. H. (2020). Soil-water-root Processes: Advances in Tomography and Imaging. New York: John Wiley & Sons.
Anikwe, M. A. N., and Ubochi, J. N. (2007). Short-term Changes in Soil Properties under Tillage Systems and Their Effect on Sweet Potato (Ipomea Batatas L.) Growth and Yield in an Ultisol in South-Eastern Nigeria. Soil Res. 45, 351–358. doi:10.1071/sr07035
Bauer, T., Strauss, P., Grims, M., Kamptner, E., Mansberger, R., and Spiegel, H. (2015). Long-term Agricultural Management Effects on Surface Roughness and Consolidation of Soils. Soil Tillage Res. 151, 28–38. doi:10.1016/j.still.2015.01.017
Bhattacharya, P., Maity, P. P., Mowrer, J., Maity, A., Ray, M., Das, S., et al. (2020). Assessment of Soil Health Parameters and Application of the Sustainability Index to Fields under Conservation Agriculture for 3, 6, and 9 Years in India. Heliyon 6 (12), e05640. doi:10.1016/j.heliyon.2020.e05640
Bhattacharyya, R., Bhatia, A., Das, T. K., Lata, S., Kumar, A., Tomer, R., et al. (2018). Aggregate-associated N and Global Warming Potential of Conservation Agriculture-Based Cropping of Maize-Wheat System in the North-Western Indo-Gangetic Plains. Soil Tillage Res. 182, 66–77. doi:10.1016/j.still.2018.05.002
Bhattacharyya, R., Das, T. K., Das, S., Dey, A., Patra, A. K., Agnihotri, R., et al. (2019). Four Years of Conservation Agriculture Affects Topsoil Aggregate-Associated 15nitrogen but Not the 15nitrogen Use Efficiency by Wheat in a Semi-arid Climate. Geoderma 337, 333–340. doi:10.1016/j.geoderma.2018.09.036
Bhattacharyya, R., Prakash, V., Kundu, S., and Gupta, H. S. (2006). Effect of Tillage and Crop Rotations on Pore Size Distribution and Soil Hydraulic Conductivity in Sandy Clay Loam Soil of the Indian Himalayas. Soil Tillage Res. 86 (2), 129–140. doi:10.1016/j.still.2005.02.018
Bhattacharyya, R., Tuti, M. D., Kundu, S., Bisht, J. K., and Bhatt, J. C. (2012). Conservation Tillage Impacts on Soil Aggregation and Carbon Pools in a Sandy Clay Loam Soil of the Indian Himalayas. Soil Sci. Soc. Am. J. 76 (2), 617–627. doi:10.2136/sssaj2011.0320
Bouckaert, L., Sleutel, S., Van Loo, D., Brabant, L., Cnudde, V., Van Hoorebeke, L., et al. (2013). Carbon Mineralisation and Pore Size Classes in Undisturbed Soil Cores. Soil Res. 51 (1), 14–22. doi:10.1071/sr12116
Chakrabarti, B., Pramanik, P., Mina, U., Sharma, D. K., Mittal, R., et al. (2014). Impact of conservation agricultural practices in wheat on soil physico-chemical properties. Int. J. Agric. Sci. 55.
Chan, K. Y. (2001). Soil particulate organic carbon under different land use and management. Soil Use Manage. 17(4), 217–221.
Chen, R., Senbayram, M., Blagodatsky, S., Myachina, O., Dittert, K., Lin, X., et al. (2014). Soil C and N Availability Determine the Priming Effect: Microbial N Mining and Stoichiometric Decomposition Theories. Glob. Change Biol. 20 (7), 2356–2367. doi:10.1111/gcb.12475
Choudhary, M., Rana, K. S., Meena, M. C., Bana, R. S., Jakhar, P., Ghasal, P. C., et al. (2019). Changes in Physico-Chemical and Biological Properties of Soil under Conservation Agriculture Based Pearl Millet - Mustard Cropping System in Rainfed Semi-arid Region. Archives Agron. Soil Sci. 65 (7), 911–927. doi:10.1080/03650340.2018.1538556
Dal Ferro, N., Sartori, L., Simonetti, G., Berti, A., and Morari, F. (2014). Soil Macro- and Microstructure as Affected by Different Tillage Systems and Their Effects on Maize Root Growth. Soil Tillage Res. 140, 55–65. doi:10.1016/j.still.2014.02.003
Das, A., Patel, D. P., Kumar, M., Ramkrushna, G. I., Mukherjee, A., Layek, J., et al. (2017). Impact of Seven Years of Organic Farming on Soil and Produce Quality and Crop Yields in Eastern Himalayas, India. Agric. Ecosyst. Environ. 236, 142–153. doi:10.1016/j.agee.2016.09.007
Das, T. K., Bhattacharyya, R., Sharma, A. R., Das, S., Saad, A. A., and Pathak, H. (2013). Impacts of Conservation Agriculture on Total Soil Organic Carbon Retention Potential under an Irrigated Agro-Ecosystem of the Western Indo-Gangetic Plains. Eur. J. Agron. 51, 34–42. doi:10.1016/j.eja.2013.07.003
Das, T. K., Saharawat, Y. S., Bhattacharyya, R., Sudhishri, S., Bandyopadhyay, K. K., Sharma, A. R., et al. (2018). Conservation Agriculture Effects on Crop and Water Productivity, Profitability and Soil Organic Carbon Accumulation under a Maize-Wheat Cropping System in the North-western Indo-Gangetic Plains. Field Crops Res. 215, 222–231. doi:10.1016/j.fcr.2017.10.021
Foster, R. C. (1988). Microenvironments of Soil Microorganisms. Biol. Fertil. soils 6 (3), 189–203. doi:10.1007/bf00260816
Galdos, M. V., Pires, L. F., Cooper, H. V., Calonego, J. C., Rosolem, C. A., and Mooney, S. J. (2019). Assessing the Long-Term Effects of Zero-Tillage on the Macroporosity of Brazilian Soils Using X-Ray Computed Tomography. Geoderma 337, 1126–1135. doi:10.1016/j.geoderma.2018.11.031
Ghosh, A., Bhattacharyya, R., Meena, M. C., Dwivedi, B. S., Singh, G., Agnihotri, R., et al. (2018). Long-term Fertilization Effects on Soil Organic Carbon Sequestration in an Inceptisol. Soil Tillage Res. 177, 134–144. doi:10.1016/j.still.2017.12.006
Ghosh, B. N., Meena, V. S., Alam, N. M., Dogra, P., Bhattacharyya, R., Sharma, N. K., et al. (2016). Impact of Conservation Practices on Soil Aggregation and the Carbon Management Index after Seven Years of Maize-Wheat Cropping System in the Indian Himalayas. Agric. Ecosyst. Environ. 216, 247–257. doi:10.1016/j.agee.2015.09.038
Ghosh, T., Maity, P. P., Das, T. K., Krishnan, P, Bhatia, A. R. T. I., Bhattacharya, P., et al. (2020). Variation of Porosity, Pore Size Distribution and Soil Physical Properties under Conservation Agriculture. Indian J. Agric. Sci. 90, 2051–2058.
Grunwald, D., Kaiser, M., and Ludwig, B. (2016). Effect of Biochar and Organic Fertilizers on C Mineralization and Macro-Aggregate Dynamics under Different Incubation Temperatures. Soil Tillage Res. 164, 11–17. doi:10.1016/j.still.2016.01.002
Guo, Q., Yan, L., Korpelainen, H., Niinemets, Ü., and Li, C. (2019). Plant-plant Interactions and N Fertilization Shape Soil Bacterial and Fungal Communities. Soil Biol. Biochem. 128, 127–138. doi:10.1016/j.soilbio.2018.10.018
Gwenzi, W., Gotosa, J., Chakanetsa, S., and Mutema, Z. (2009). Effects of Tillage Systems on Soil Organic Carbon Dynamics, Structural Stability and Crop Yields in Irrigated Wheat (Triticum aestivum L.)-cotton (Gossypium Hirsutum L.) Rotation in Semi-arid Zimbabwe. Nutr. Cycl. Agroecosyst 83 (3), 211–221. doi:10.1007/s10705-008-9211-1
Hussain, I., Olson, K. R., and Siemens, J. C. (1998). Long-term Tillage Effects on Physical Properties of Eroded Soil. Soil Sci. 163 (12), 970–981. doi:10.1097/00010694-199812000-00007
Jat, R. A., Sahrawat, K. L., Kassam, A. H., and Friedrich, T. (2014). “Conservation Agriculture for Sustainable and Resilient Agriculture: Global Status, Prospects and Challenges,” in Conservation Agriculture: Global Prospects and Challenges. Editors R.A Jat, K.L Sahrawat, and A.H Kassam (Wallingford, Oxfordshire, UK: CABI International), 1–25. doi:10.1079/9781780642598.0001
Jat, S. L., Parihar, C. M., Dey, A., Nayak, H. S., Ghosh, A., Parihar, N., et al. (2019). Dynamics and Temperature Sensitivity of Soil Organic Carbon Mineralization under Medium-Term Conservation Agriculture as Affected by Residue and Nitrogen Management Options. Soil Tillage Res. 190, 175–185. doi:10.1016/j.still.2019.02.005
Josa, R., Gorchs, G., Ginovart, M., and Solé-Benet, A. (2013). Influence of Tillage on Soil Macropore Size, Shape of Top Layer and Crop Development in a Sub-humid Environment. Biologia 68 (6), 1099–1103. doi:10.2478/s11756-013-0250-y
Kan, Z.-R., Liu, Q.-Y., Virk, A. L., He, C., Qi, J.-Y., Dang, Y. P., et al. (2021). Effects of Experiment Duration on Carbon Mineralization and Accumulation under No-Till. Soil Tillage Res. 209, 104939. doi:10.1016/j.still.2021.104939
Kan, Z.-R., Virk, A. L., He, C., Liu, Q.-Y., Qi, J.-Y., Dang, Y. P., et al. (2020). Characteristics of Carbon Mineralization and Accumulation under Long-Term Conservation Tillage. Catena 193, 104636. doi:10.1016/j.catena.2020.104636
Ketcham, R. A., and Carlson, W. D. (2001). Acquisition, Optimization and Interpretation of X-Ray Computed Tomographic Imagery: Applications to the Geosciences. Comput. Geosciences 27 (4), 381–400. doi:10.1016/s0098-3004(00)00116-3
Kravchenko, A. N., and Guber, A. K. (2017). Soil Pores and Their Contributions to Soil Carbon Processes. Geoderma 287, 31–39.
Ladha, J. K., Kumar, V., Alam, M. M., Sharma, S., Gathala, M., Chandna, P., et al. (2009). Integrating crop and resource management technologies for enhanced productivity, profitability, and sustainability of the rice-wheat system in South Asia. , pp.69-108. Integr. Crop Resour. Manage. Rice Wheat Syst. South Asia 69–108.
Lamparter, A., Bachmann, J., Goebel, M. O., and Woche, S. K. (2009). Carbon Mineralization in Soil: Impact of Wetting–Drying, Aggregation and Water Repellency. Geoderma 150 (3-4), 324–333. doi:10.1016/j.geoderma.2009.02.014
Lichter, K., Govaerts, B., Six, J., Sayre, K. D., Deckers, J., Dendooven, L., et al. (2008). Aggregation and C and N contents of soil organic matter fractions in a permanent raised-bed planting system in the Highlands of Central Mexico. Plant Soil 305 (1), 237–252.
Mangalassery, S., Sjögersten, S., Sparkes, D. L., Sturrock, C. J., Craigon, J., and Mooney, S. J. (2014). To what Extent Can Zero Tillage Lead to a Reduction in Greenhouse Gas Emissions from Temperate Soils? Sci. Rep. 4 (1), 4586–4588. doi:10.1038/srep04586
Modak, K., Biswas, D. R., Ghosh, A., Pramanik, P., Das, T. K., Das, S., et al. (2020). Zero Tillage and Residue Retention Impact on Soil Aggregation and Carbon Stabilization within Aggregates in Subtropical India. Soil Tillage Res. 202, 104649. doi:10.1016/j.still.2020.104649
Mohanty, A., Mishra, K. N., Roul, P. K., Dash, S. N., and Panigrahi, K. K. (2015). Effects of Conservation Agriculture Production System (CAPS) on Soil Organic Carbon, Base Exchange Characteristics and Nutrient Distribution in a Tropical Rainfed Agro-Ecosystem. Int. J. Plant, Animal Environ. Sci. 5, 310–314.
Mtambanengwe, F., Mapfumo, P., and Kirchmann, H. (2004). Decomposition of Organic Matter in Soil as Influenced by Texture and Pore Size Distribution Managing Nutrient Cycles to Sustain Soil Fertility in Sub-saharan Africa, Nairobi, Kenya, 261.
Nyamadzawo, G., Chikowo, R., Nyamugafata, P., Nyamangara, J., and Giller, K. E. (2008). Soil Organic Carbon Dynamics of Improved Fallow-Maize Rotation Systems under Conventional and No-Tillage in Central Zimbabwe. Nutr. Cycl. Agroecosyst 81 (1), 85–93. doi:10.1007/s10705-007-9154-y
Page, K. L., Dang, Y. P., Dalal, R. C., Reeves, S., Thomas, G., Wang, W., et al. (2019). Changes in Soil Water Storage with No-Tillage and Crop Residue Retention on a Vertisol: Impact on Productivity and Profitability over a 50 Year Period. Soil Tillage Res. 194, 104319. doi:10.1016/j.still.2019.104319
Pagliai, M., Vignozzi, N., and Pellegrini, S. (2004). Soil Structure and the Effect of Management Practices. Soil Tillage Res. 79 (2), 131–143. doi:10.1016/j.still.2004.07.002
Parihar, C. M., Singh, A. K., Jat, S. L., Ghosh, A., Dey, A., Nayak, H. S., et al. (2019). Dependence of Temperature Sensitivity of Soil Organic Carbon Decomposition on Nutrient Management Options under Conservation Agriculture in a Sub-tropical Inceptisol. Soil Tillage Res. 190, 50–60. doi:10.1016/j.still.2019.02.016
Pathak, H. (2014). Emission and Mitigation of Greenhouse Gases in Indian Agriculture. Agric. Under Clim. Change: Threats, Strateg. Pol. 1, 255.
Piccoli, I., Camarotto, C., Lazzaro, B., Furlan, L., and Morari, F. (2017). Conservation Agriculture Had a Poor Impact on the Soil Porosity of Veneto Low‐lying Plain Silty Soils after a 5‐year Transition Period. Land Degrad. Dev. 28 (7), 2039–2050. doi:10.1002/ldr.2726
Rabbi, S. M. F., Daniel, H., Lockwood, P. V., Macdonald, C., Pereg, L., Tighe, M., et al. (2016). Physical Soil Architectural Traits Are Functionally Linked to Carbon Decomposition and Bacterial Diversity. Sci. Rep. 6, 33012. doi:10.1038/srep33012
Rezanezhad, F., Quinton, W. L., Price, J. S., Elrick, D., Elliot, T. R., and Heck, R. J. (2009). Examining the Effect of Pore Size Distribution and Shape on Flow through Unsaturated Peat Using Computer Tomography. Hydrol. Earth Syst. Sci. 13, 1993. doi:10.5194/hess-13-1993-2009
Sasal, M. C., Andriulo, A. E., and Taboada, M. A. (2006). Soil Porosity Characteristics and Water Movement under Zero Tillage in Silty Soils in Argentinian Pampas. Soil Tillage Res. 87 (1), 9–18. doi:10.1016/j.still.2005.02.025
Saharawat, Y. S., Singh, B., Malik, L. K., Ladha, J. K., Gathala, M., Jat, M. L., et al. (2010). Evaluation of alternative tillage and crop establishment methods in a rice‐wheat rotation in North Western IGP. Field Crops Res. 116 (3), 260–267. doi:10.1002/ldr.2726
Stanford, G., and Smith, S. J. (1972). Nitrogen mineralization potentials of soils. Soil Sci. Soc. Amer. J. 36 (3), 465–472.
Singh, B., and Malhi, S. S. (2006). Response of Soil Physical Properties to Tillage and Residue Management on Two Soils in a Cool Temperate Environment. Soil Tillage Res. 85 (1-2), 143–153. doi:10.1016/j.still.2004.12.005
Singh, G., Bhattacharyya, R., Das, T. K., Sharma, A. R., Ghosh, A., Das, S., et al. (2018). Crop Rotation and Residue Management Effects on Soil Enzyme Activities, Glomalin and Aggregate Stability under Zero Tillage in the Indo-Gangetic Plains. Soil Tillage Res. 184, 291–300. doi:10.1016/j.still.2018.08.006
Soane, B. D., Ball, B. C., Arvidsson, J., Basch, G., Moreno, F., and Roger-Estrade, J. (2012). No-till in Northern, Western and South-Western Europe: A Review of Problems and Opportunities for Crop Production and the Environment. Soil Tillage Res. 118, 66–87. doi:10.1016/j.still.2011.10.015
Spurgeon, D. J., Keith, A. M., Schmidt, O., Lammertsma, D. R., and Faber, J. H. (2013). Land-use and Land-Management Change: Relationships with Earthworm and Fungi Communities and Soil Structural Properties. BMC Ecol. 13 (1), 46. doi:10.1186/1472-6785-13-46
Strong, D. T., Wever, H. D., Merckx, R., and Recous, S. (2004). Spatial Location of Carbon Decomposition in the Soil Pore System. Eur. J. Soil Sci. 55 (4), 739–750. doi:10.1111/j.1365-2389.2004.00639.x
Tuzzin de Moraes, M., Debiasi, H., Carlesso, R., Cezar Franchini, J., Rodrigues da Silva, V., and Bonini da Luz, F. (2016). Soil Physical Quality on Tillage and Cropping Systems after Two Decades in the Subtropical Region of Brazil. Soil Tillage Res. 155, 351–362. doi:10.1016/j.still.2015.07.015
Van Bavel, C. H. M. (1949). Mean Weight-Diameter of Soil Aggregates as a Statistical Index of Aggregation. Proc. Soil Sci. Soc. Am. 14, 20–23.
Varvel, G., Riedell, W., Deibert, E., McConkey, B., Tanaka, D., Vigil, M., et al. (2006). Great Plains Cropping System Studies for Soil Quality Assessment. Renew. Agric. Food Syst. 21 (1), 3–14. doi:10.1079/raf2005121
Walkley, A., and Black, I. A. (1934). An Examination of the Degtjareff Method for Determining Soil Organic Matter, and a Proposed Modification of the Chromic Acid Titration Method. Soil Sci. 37 (1), 29–38. doi:10.1097/00010694-193401000-00003
Young, I. W., Crawford, J. W., and Rappoldt, C. (2001). New methods and models for characterising structural heterogeneity of soil. Soil Tillage Res. 61 (1-2), 33–45.
Yoder, R. E. (1936). A Direct Method of Aggregate Analysis of Soils and a Study of the Physical Nature of Erosion Losses 1. Agron. J. 28 (5), 337–351. doi:10.2134/agronj1936.00021962002800050001x
Zhang, Y., Zhao, Y. C., Shi, X. Z., Lu, X. X., Yu, D. S., Wang, H. J., et al. (2008). Variation of soil organic carbon estimates in mountain regions: a case study from Southwest China. Geoderma 146(3-4) (5), 449–456.
Keywords: conservation agriculture, carbon mineralization, porosity, pore size distribution, X-ray computed microtomography
Citation: Ghosh T, Maity PP, Das TK, Krishnan P, Chakraborty D, Bhatia A, Ray M, Kundu A and Bhattacharyya R (2022) Characterization of Soil Pores Through X-Ray Computed Microtomography and Carbon Mineralization Under Contrasting Tillage and Land Configurations in the Indo-Gangetic Plains of India. Front. Environ. Sci. 10:898249. doi: 10.3389/fenvs.2022.898249
Received: 17 March 2022; Accepted: 15 April 2022;
Published: 25 May 2022.
Edited by:
Lu-Jun Li, Northeast Institute of Geography and Agroecology (CAS), ChinaReviewed by:
Ahmad Latif Virk, China Agricultural University, ChinaMengyang You, Northeast Institute of Geography and Agroecology (CAS), China
Copyright © 2022 Ghosh, Maity, Das, Krishnan, Chakraborty, Bhatia, Ray, Kundu and Bhattacharyya. This is an open-access article distributed under the terms of the Creative Commons Attribution License (CC BY). The use, distribution or reproduction in other forums is permitted, provided the original author(s) and the copyright owner(s) are credited and that the original publication in this journal is cited, in accordance with accepted academic practice. No use, distribution or reproduction is permitted which does not comply with these terms.
*Correspondence: Pragati Pramanik Maity, pragati.iari@gmail.com; T. K. Das, tkdas64@gmail.com