Impacts of Winter and Summer COVID-19 Lockdowns on Urban Air Quality in Urumqi, Northwest China
- 1Institute of Desert Meteorology, China Meteorological Administration, Urumqi, China
- 2Taklimakan Desert Meteorology Field Experiment Station of CMA, Urumqi, China
- 3National Observation and Research Station of Desert Meteorology, Taklimakan Desert of Xinjiang/Xinjiang Key Laboratory of Desert Meteorology and Sandstorm, Urumqi, China
- 4Key Laboratory of Tree-Ring Physical and Chemical Research, China Meteorological Administration, Urumqi, China
- 5Key Laboratory for Aerosol-Cloud-Precipitation of China Meteorological Administration, Nanjing University of Information Science and Technology, Nanjing, China
- 6Newsroom of Xinjiang Meteorological Bureau, Urumqi, China
After the COVID-19 pandemic began in 2020, Urumqi, a remote area in northwest China, experienced two lockdowns, in January and July 2020. Based on ground and satellite observations, this study assessed the impacts of these lockdowns on the air quality in Urumqi and the seasonal differences between them. The results showed that, during the wintertime lockdown, PM10, PM2.5, NO2, CO, and SO2 levels decreased by 38, 40, 45, 27, 8%, respectively, whereas O3 concentrations increased by 113%. During the summer lockdown, PM10, PM2.5, NO2, CO, and SO2 levels decreased by 39, 24, 59, 2, and 13%, respectively, and the O3 concentrations increased by 21%. During the lockdowns, the NO2 concentrations decreased by 53% in winter and 13% in summer in the urban areas, whereas they increased by 23% in winter and 9% in summer in the suburbs. Moreover, large seasonal differences were observed between winter and summer SO2, CO, and O3. The lockdown played a vital role in the rapid decline of primary air pollutant concentrations, along with fewer meteorological impacts on air pollution changes in this area. The increase in O3 concentrations during the COVID-19 lockdowns reflects the complexity of air quality changes during reductions in air pollutant emissions.
Introduction
In response to the COVID-19 pandemic, most countries adopted anti-epidemic measures, such as lockdowns, home isolation, and travel restrictions, to reduce the spread of the virus (Maier and Brockmann, 2020). In addition, the lockdowns provided air quality benefits (He et al., 2020). Owing to reductions in urban traffic during lockdowns, levels of NO2, CO, CO2, and particulate matter (PM) were greatly reduced, resulting in improved urban air quality (Beckerman et al., 2008; Guo et al., 2020). By using ground-based and satellite observation data, the impacts of epidemic lockdown on air quality are studied. For example, Daniel et al. (Goldberg et al., 2020) used Sentinel 5P data and found that atmospheric NO2 concentrations in the United States and Canada decreased significantly. Liu et al. (2019), Zhang et al. (2021), and Huang and Sun (2020) analyzed satellite remote sensing data during lockdowns and found that NO2 levels in China decreased significantly during the COVID-19 pandemic, similar to those reported in India (ESA, 2020a) and Italy (ESA, 2020b). Nevertheless, analyzing ground-based measurements are the most direct method for quantifying local air quality changes. Studies using ground-based monitoring data in India, Barcelona, Madrid, Morocco, South America, and North America found that the varying levels of pandemic prevention and control measures in each location resulted in significant differences in air quality (Baldasano, 2020; Berman and Ebisu, 2020; Dantas et al., 2020; Otmani et al., 2020; Sharma et al., 2020; Tobías et al., 2020). Most studies on air quality during COVID-19 lockdowns in China have focused on cities in central and eastern China (Chang et al., 2020; Shi and Brasseur, 2020; Yuan et al., 2021; Zhang et al., 2022). Wang et al. (2020) found that PM2.5, NO2, and CO decreased by 9.9–64.0% during a lockdown in winter. However, few studies have reported on the arid region of northwest China.
Urumqi, a major city in northwest China, and its surrounding areas have been affected by COVID-19, with two lockdowns in 2020. The first lockdown was during winter (NHC (National Health Center), 2022a), from January 23 to 8 March 2020, and the second was during summer, from July 16 to 29 August 2020 (NHC (National Health Center), 2022b). During the two epidemics, the city implemented a full lockdown for all communities and restricted access to parks to prevent transmission of the virus. As targets were achieved for each phase of the epidemic prevention and control measures, the city gradually resumed industrial production and social activities in an orderly manner. These lockdown measures provided an unexpected opportunity to study the impact of human activities on air quality. This study analyzed the changes in air pollutant concentrations, specifically PM2.5, PM10, SO2, NO2, and O3, during the lockdowns in Urumqi using comparisons with air quality during the same periods in 2015 and 2019. These results could improve our scientific understanding of the effects of emission reduction on air quality.
Materials and Methods
Study Area
Urumqi is located at the northern foot of the central Tianshan Mountains and the southern edge of the Junggar Basin in northwest China with a semi-arid continental climate. The total area of Urumqi is 13,800 km2 with a permanent population of 3.552 million. It is the largest and the most prosperous city in Central Asia (UG (Urumqi Government), 2022). In 2020, Urumqi suffered two COVID-19 epidemics in winter with the lockdowns from February 7 to 8 March 2020 and in summer from July 16 to 7 September 2020.
Measurement Data
This study used 24 h averages of air quality monitoring data from 2015 to 2020 for the periods of January 11 to March 31 and July 1 to September 8 from five monitoring stations in Urumqi. The data were downloaded from the National Environmental Quality Monitoring Center (www.cnemc.cn/en).
In this study, the method used by Berman (Berman and Ebisu, 2020) was applied to average these measurement data to obtain daily average air quality data for the city. Data from January 23 to March 7 and July 17 to August 29 of 2015–2019 were regarded as ‘historical’ data, whereas data from the periods of January 23 to March 7 and July 17 to August 29 during 2020 were considered ‘current’ data. Data from January 11 to January 26 and July 1 to 16 July 2020, were used as ‘control’ data. All monitoring instruments in the Urumqi Air Quality Automatic Monitoring System operated automatically to continuously measure aerosol particles (PM2.5, PM10) and gaseous pollutants (NO2, SO2, CO, O3) in the air. PM2.5 and PM10 levels were monitored using a tapered element oscillating microbalance (TEOM; Thermo Fisher Scientific, Waltham, MA, United States ) and a BAM 1020 on-line particulate matter monitor (Met One Instruments, Grants Pass, OR, United States ). The gaseous pollutants were monitored using TEI-43i, TEI-42i, TEI-48i, and TEI-49i gas analyzers (Thermo Fisher Scientific).
We also used data from the Sentinel-5P NO2 satellite because the wide coverage of the satellite data complements the surface site observations. Owing to serious concerns about air quality, the Copernican Sentinel-5P (https://scihub.copernicus.eu/) was launched in October 2017 to observe air pollutants worldwide. This satellite carries one of the most advanced sensors to date, TROPO spheric Monitoring Instrument (TROPOMI). This instrument detects the unique fingerprints of atmospheric gases to accurately image atmospheric pollutants with a high spatial resolution.
In this study, the NO2 data from the Sentinel-5P satellite from January 11 to January 26 and July 1 to 16 July 2020, were used to represent the concentrations of NO2 in Urumqi before the lockdown. The NO2 data from January 23 to March 7 and July 17 to 29 August 2020, were used to represent the concentrations during the lockdown, and the 14-days moving average was used for the average NO2 concentrations in the urban area. The concentrations of short-term pollutants, such as NO2, are indicators of economic slowdown, which can be connected to emission changes. Using the 14-days average eliminates the effects of short-term meteorological changes and better reflects the effects of air pollutant emission changes.
Results
The comparisons between the weather conditions during the lockdowns and those during the corresponding historical periods showed minimal differences, indicating that the changes in air pollutant concentrations during the lockdowns were primarily due to local anthropogenic emissions. Therefore, this study focused on the seasonal impacts of the lockdowns on the urban air quality in Urumqi.
The winter and summer lockdowns impacted air pollutants differently. After the winter lockdown measures were implemented, the impacts on gaseous pollutants (NO2, SO2, CO, and O3) were significant (Figure 1). During both winter and summer, the concentrations of NO2, SO2, and CO dropped rapidly after the implementation of strict lockdown measures and subsequently varied over time. O3 was the only air pollutant whose concentration increased during the lockdowns.
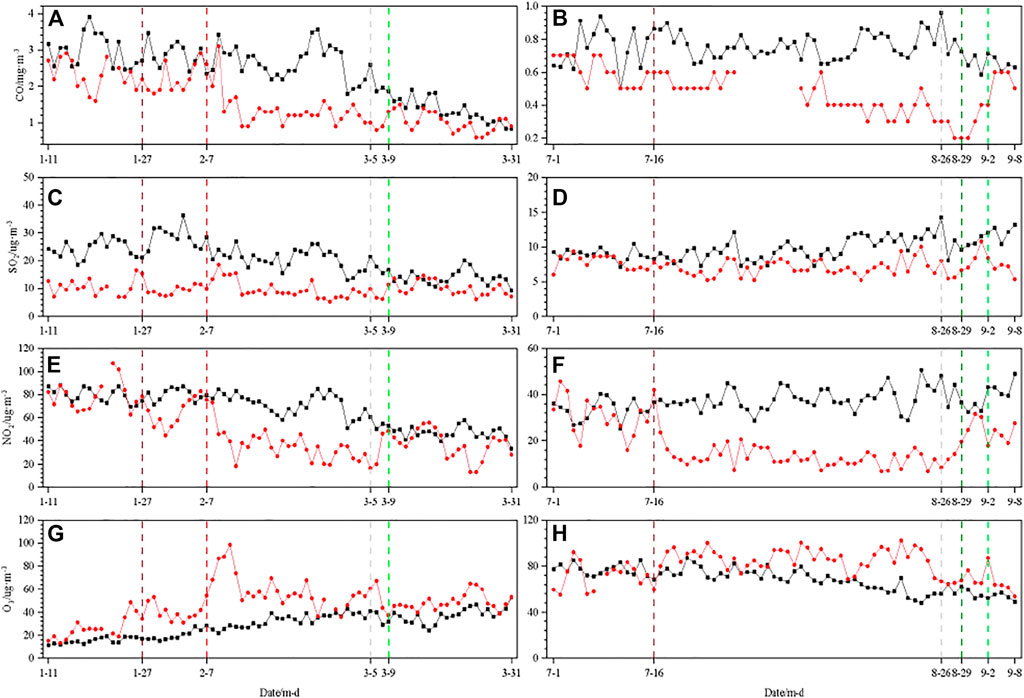
FIGURE 1. Daily average CO, SO2, NO2, and O3 concentrations during the (A–D) winter and (E–H) summer lockdowns in Urumqi. The black dots represent the 2015–2019 historical data and the red dots represent the 2020 data. The dark red vertical line indicates the beginning of the winter lockdown. The red vertical lines indicate the beginning of strict lockdown measures, and the gray vertical lines indicate the initial lifting of lockdown measures. The dark green line indicates the lifting of vehicle restrictions during the summer lockdown, and the green lines indicate the complete lifting of lockdown measures.
Before the winter and summer lockdowns, the CO concentrations were 2.21 and 0.58 mg m−3, respectively (Table 1). During the winter lockdown, the CO concentration dropped to 1.62 mg m−3, which was a decrease of 1.06 mg m−3 (39.54% decrease) compared to the corresponding historical period and 0.59 mg m−3 (27.0%) compared to the period before the lockdown. During the summer lockdown, the CO concentrations decreased by 0.17 mg m−3 (22.6%) compared with the corresponding historical period and by 0.01 mg m−3 (2.4%) compared with the period before the lockdown. These seasonal differences in CO reductions indicate the importance of local anthropogenic emissions to regional air quality.
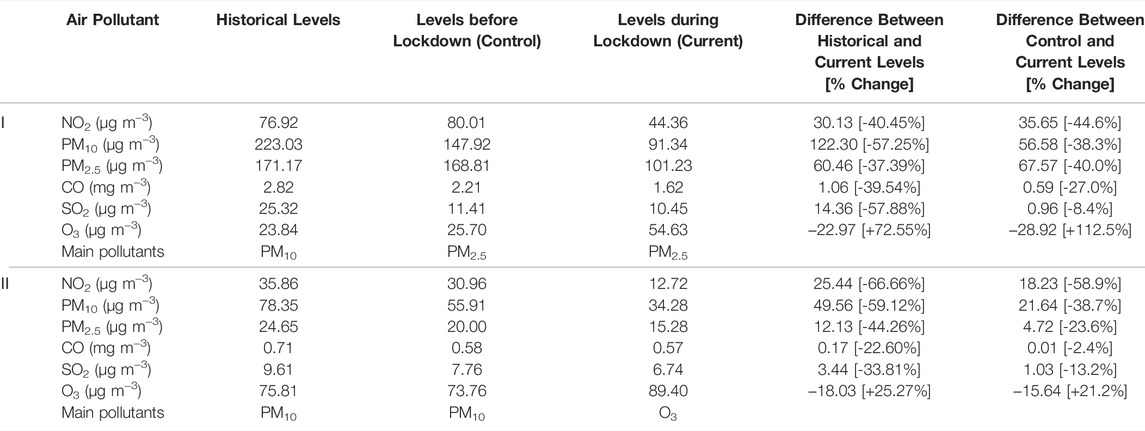
TABLE 1. Mean concentrations of air pollutants in Urumqi during the winter (I) and summer (II) lockdowns.
Variations in the SO2 concentrations during the lockdowns differed slightly from those in CO (Figure 1). During the winter lockdown, the variations in SO2 concentration markedly differed compared to those during the corresponding historical period. After strict home isolation measures were adopted on February 7, the SO2 concentration declined by a maximum of 57.88%; however, this decrease was not as rapid as those observed in other pollutants. After the lockdown was lifted, SO2 concentration increased rapidly. During the summer lockdown, the SO2 concentration decreased compared to that during the corresponding historical and control periods, but the rate of the decrease (a decline of 33.81%) was lower than that during the winter lockdown.
After the most stringent measures began, the NO2 concentrations decreased rapidly. They gradually recovered by March 5, and the NO2 concentration did not increase substantially after commercial and industrial production fully resumed on March 8. As the summer lockdown began, the NO2 concentration decreased rapidly on July 17. NO2 concentrations decreased the most during the strict home isolation measures (Figure 1). During the winter lockdown, the NO2 concentration decreased by 40.45 and 44.6% compared to that during the historical and control periods, respectively. During the summer lockdown, the NO2 concentration decreased by 66.66 and 58.9% compared to that during the historical and control periods.
In the early stages of the winter lockdown, the O3 concentrations were generally higher than those during the corresponding historical period (Figure 1). However, during the summer lockdown, O3 concentrations differed from those observed during the winter lockdown and were higher than those during the corresponding historical and control periods. During the winter lockdown, the O3 concentrations reached 54.6 μg m−3, which was an increase of 23.0 μg m−3 (72.55%) and 28.92 μg m−3 (112.5%) compared to the historical and control periods, respectively. During the summer lockdown, the O3 concentration was 89.4 μg m−3, which was an increase of 18.03 μg m−3 (25.27%) and 15.64 μg m−3 (21.2%) compared to the historical and control periods, respectively.
The lockdown and home isolation measures had similar effects on aerosol particles (PM2.5 and PM10). After strict home isolation measures were adopted and traffic and industrial production were restricted, their concentrations dropped rapidly. With the resumption of work and industrial production, the PM10 and PM2.5 concentrations slowly increased (Figures 2,3). The effects of the summer lockdown occurred more rapidly than those during the winter; PM10 and PM2.5 concentrations dropped rapidly and remained constant. The PM10 and PM2.5 concentrations were 139.95 μg m−3 and 157.36 μg m−3, respectively, during the winter lockdown, and 55.65 μg m−3 and 19.5 μg m−3, respectively, during the summer lockdown.
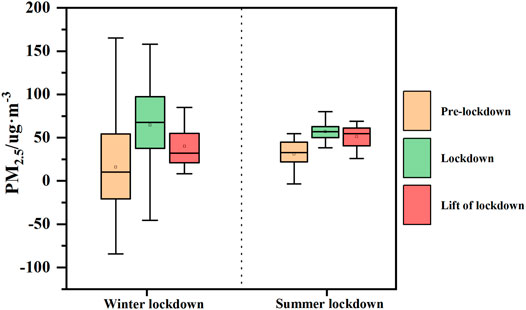
FIGURE 2. Deviation between historical and lockdown periods for PM2.5 concentrations during the winter and summer lockdowns in Urumqi.
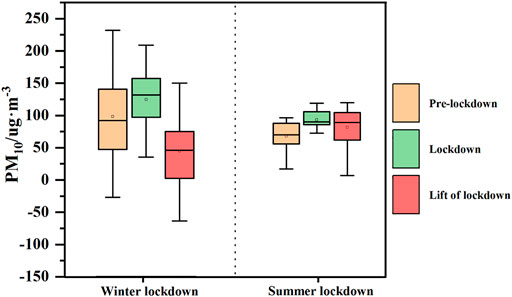
FIGURE 3. Deviation between historical and lockdown periods for PM10 concentrations during the winter and summer lockdowns in Urumqi.
The ground observation is limited for the site, which is insufficient for spatial distribution of air pollutants in an area. Therefore, this study by combining the NO2 data of satellite remote sensing with the surface site observations to explore the variations of air pollutant concentrations affected by the lockdown in Urumqi.
Before the lockdown (Figure 4), the densely populated Tianshan district (TS), Toutunhe district (TTH) and Shayibake district (SYBK) had the highest tropospheric NO2 values, ranging from 100 to 201 μmol m−2 in winter and 80–99 μmol m−2 in summer, which may have been related to significant motor vehicle emissions in these areas. The NO2 concentration in winter to be greater than that in summer, which could be connected with the higher oxidability in the atmosphere with summertime strong solar radiation and high air temperature in this region. Comparing with the urban region, Urumqi County (WLMQ) and Dabancheng district (DBC), in the suburban areas, had lower tropospheric NO2 concentrations, which ranged from 32 to 100 μmol m−2 in winter and from 56 to 80 μmol m−2 in summer; this reflects the impact of urban transportation on air pollutant emissions. During the lockdown, the tropospheric NO2 vertical column content during the lockdown in 90% of the high value areas was −13∼107 μmol m−2 lower than that before the lockdown in winter, and the tropospheric NO2 vertical column content was reduced −9∼21 μmol m−2 in summer.
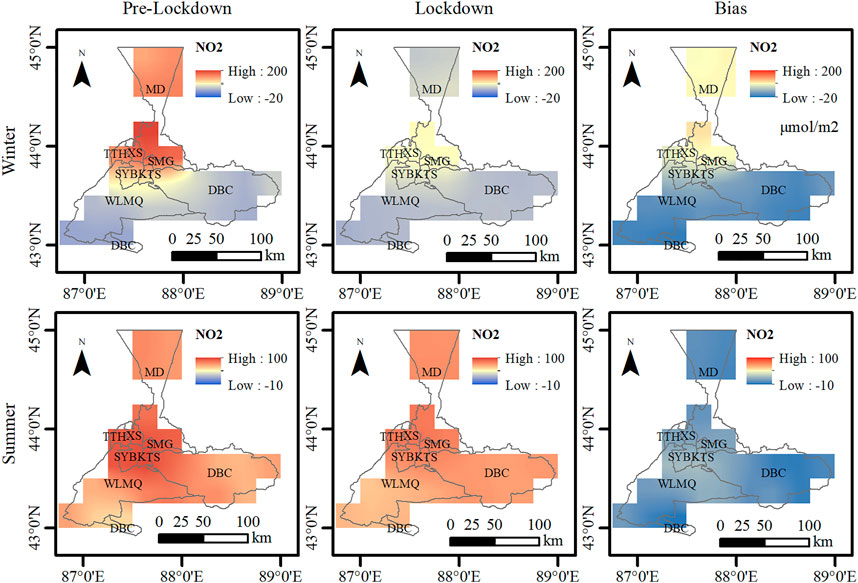
FIGURE 4. The changes in tropospheric NO2 (μmol m−2) in the study region before and during the winter and summer lockdowns, showing the bias before the lockdown minus the lockdown.
Discussion
The lockdowns in Urumqi had the significant impacts on NO2, PM10, PM2.5, and O3 levels. The NO2 concentrations decreased by 44.6% during the winter lockdown and 58.9% during the summer lockdown. During the winter lockdown, PM10 and PM2.5 concentrations decreased by 38.0 and 40%, respectively. During the summer lockdown, the PM10 concentration decreased by 38.7%. However, compared with the historical and control periods, the O3 concentration tended to increase. During the winter lockdown, the O3 concentration increased by 112.5% compared with the control period. Similar positive anomalies in O3 concentrations were observed in the Wuhan and Yangtze River Deltas during their lockdowns (Yuan et al., 2021; Zhang et al., 2022). The increased O3 concentrations in Urumqi and other cities in China during lockdowns reflect the complexity of improving urban air quality by reducing anthropogenic air pollutant emissions (Ju et al., 2021; Peng, 2022). Additionally, the decline in SO2 concentration reflected a reduction in industrial activities under the lockdown measures and was similar in magnitude to the SO2 decline in Hangzhou (Yuan et al., 2021). However, the fluctuations in SO2 concentrations in Urumqi during the lockdown mainly resulted from the many factories in the Midong area, which was northeast of the city.
During the winter lockdown, the NO2 and PM10 concentrations decreased less than those during the summer lockdown. This was mainly due to the higher NO2 and PM10 concentrations in Urumqi during winter from artificial heat sources. Additionally, turbulence in the atmospheric boundary layer is far less intense in winter than that in summer; moreover, the boundary layer height is lower in winter than that in summer (Zhang et al., 2021). Hence, atmospheric pollutant transport was limited, thereby increasing their concentrations. The decline in SO2 and CO concentrations during the two lockdowns differed from that in NO2. During the winter lockdown, SO2 and CO concentrations declined relatively sharply and rapidly. Additionally, O3 concentrations responded at a similar speed but increased instead. The increase in O3 concentrations during the winter lockdown exceeded that during the summer.
However, avoiding the influence of weather systems or external factors on urban air pollution is often impossible, as was the case during the lockdowns. For example, during the summer lockdown, PM10 and PM2.5 concentrations in Urumqi spiked on August 25. The PM10 concentration rose from 40 μg m−3 during the previous day to 144 27 μg m−3; 1 day later, it decreased to 48 μg m−3. The PM2.5 concentration increased from 16 μg m−3 during the previous day to 27 μg m−3; it decreased to 18 μg m−3 the next day. A precipitation event occurred in Urumqi on 25 August, and sand blew into the city at 20:00 (Beijing time). Thus, the air over Urumqi became more turbid and the PM concentration increased, causing the atmospheric visibility to fall to 2.6 km. Precipitation began at approximately 7:00 on the morning of August 26 and lasted until 8:00 on the morning of August 27. The 24-h precipitation was 19.1 mm. Nevertheless, in this study, we did not eliminate the impacts of precipitation on air quality change, considering the low precipitation in Urumqi. In a future work, we will consider the complex influences of precipitation on air pollutant changes in this arid region of Northwest China.
Conclusion
Owing to the COVID-19 lochdowns in Urumqi, the PM10, PM2.5, NO2, SO2 and CO concentrations in the city decreased, and the O3 concentration increased. This effect was notable in the changes in the NO2, PM10, PM2.5, and O3 concentrations. During the lockdown, the NO2 concentrations decreased by 53% in winter and 13% in summer in the main urban areas, whereas they increased by 23% in winter and 9% in summer in the suburbs. These changes reflect the decline in total aerosols and the increase in some short-term air pollutants during lockdowns. Additionally, the various seasons and lockdown levels also had differing effects on the concentrations of urban air pollutants. Changes in pollutant concentrations during the gradual resumption of work and industrial production can provide a reference for the government to balance industrial production and air quality.
Nevertheless, seasonal impacts on SO2, CO, and O3 concentrations and the primary pollutant types exceeded those of the lockdown measures. However, strict city lockdown measures played a vital role in the rapid decline of most air pollutant concentrations. In addition to lockdown measures, external factors and weather conditions influenced the pollution. Therefore, atmospheric pollutant concentrations can be improved by adopting certain government interventions or guidance measures. Notably, the O3 concentration did not decrease during the lockdown. Thus, during the development of future pollution reduction policies, targeted measures should be formulated to reduce O3 concentrations, thereby reducing the pollution and harm caused by O3. Understanding the impacts of urban lockdowns and the subsequent restoration of activities on air quality will aid urban emissions control and further improve urban air pollution strategies.
Data Availability Statement
Publicly available datasets were analyzed in this study. This data can be found from www.cnemc.cn/en https://scihub.copernicus.eu.
Author Contributions
Conceptualization, AM and TZ; methodology, YW and JG; data curation, HS and YW; writing—original draft preparation, AM and YW; writing—review and editing, YW and FY; visualization, WH; supervision, CZ; project administration, JG; funding, YW and AM All authors have read and agreed to the published version of the manuscript.
Funding
This research was funded by the National Natural Science Foundation of China (41875023), Central Scientific Research Institute of the Public Basic Scientific Research Business Professional (IDM2021005, IDM2021001, IDM2017001), Innovative and Development Project of China Meteorological Administration (CXFZ2021J044), the Central Asia Atmospheric Research Foundation (CASS202009), Flexible Talents Introducing Project of Xinjiang (2018).
Conflict of Interest
The authors declare that the research was conducted in the absence of any commercial or financial relationships that could be construed as a potential conflict of interest.
Publisher’s Note
All claims expressed in this article are solely those of the authors and do not necessarily represent those of their affiliated organizations, or those of the publisher, the editors and the reviewers. Any product that may be evaluated in this article, or claim that may be made by its manufacturer, is not guaranteed or endorsed by the publisher.
References
Baldasano, J. M. (2020). COVID-19 Lockdown Effects on Air Quality by NO2 in the Cities of Barcelona and Madrid (Spain). Sci. Total Environ. 741, 140353. doi:10.1016/j.scitotenv.2020.140353
Beckerman, B., Jerrett, M., Brook, J. R., Verma, D. K., Arain, M. A., and Finkelstein, M. M. (2008). Correlation of Nitrogen Dioxide with Other Traffic Pollutants Near a Major Expressway. Atmos. Environ. 42, 275–290. doi:10.1016/j.atmosenv.2007.09.042
Berman, J. D., and Ebisu, K. (2020). Changes in U.S. Air Pollution during the COVID-19 Pandemic. Sci. Total Environ. 739, 139864. doi:10.1016/j.scitotenv.2020.139864
Chang, Y., Huang, R. J., Ge, X., Huang, X., Hu, J., Duan, Y., et al. (2020). Puzzling Haze Events in China during the Coronavirus (COVID‐19) Shutdown. Geophys. Res. Lett. 47, 88533. doi:10.1029/2020GL088533
Dantas, G., Siciliano, B., França, B. B., da Silva, C. M., and Arbilla, G. (2020). The impact of COVID-19 partial lockdown on the air quality of the city of Rio de Janeiro, Brazil. Sci. Total Environ. 729, 139085. doi:10.1016/j.scitotenv.2020.139085
ESA (2020a). Air Pollution Drops in India Following Lockdown. Retrieved from: http://www.esa.int/Applications/Observing_the_Earth/Copernicus/Sentinel-5P/Air_pollution_drops_in_India_following_lockdown January 26, 2022).
ESA (2020b). Coronavirus: Nitrogen Dioxide Emissions Drop over Italy. Retrieved from: http://www.esa.int/ESA_Multimedia/Videos/2022/01/Coronavirus_nitrogen_dioxide_emissions_drop_over_Italy January 26, 2022).
Goldberg, D. L., Anenberg, S. C., Griffin, D., McLinden, C. A., Lu, Z., and Streets, D. G. (2020). Disentangling the Impact of the COVID‐19 Lockdowns on Urban NO 2 from Natural Variability. Geophys. Res. Lett. 47, 17. doi:10.1029/2020GL089269
Guo, S., Hu, M., Peng, J., Wu, Z., Zamora, M. L., Shang, D., et al. (2020). Remarkable Nucleation and Growth of Ultrafine Particles from Vehicular Exhaust. Proc. Natl. Acad. Sci. U.S.A. 117, 3427–3432. doi:10.1073/pnas.1916366117
He, G., Pan, Y., and Tanaka, T. (2020). COVID-19, City Lockdowns, and Air Pollution: Evidence from China. Med. Rxiv 3, 29. doi:10.1101/2020.03.29.20046649
Huang, G., and Sun, K. (2020). Non-negligible Impacts of Clean Air Regulations on the Reduction of Tropospheric NO2 over East China during the COVID-19 Pandemic Observed by OMI and TROPOMI. Sci. Total Environ. 745, 141023. doi:10.1016/j.scitotenv.2020.141023
Ju, M. J., Oh, J., and Choi, Y.-H. (2021). Changes in Air Pollution Levels after COVID-19 Outbreak in Korea. Sci. Total Environ. 750, 141521. doi:10.1016/j.scitotenv.2020.141521
Liu, M., Lin, J., Boersma, K. F., Pinardi, G., Wang, Y., Chimot, J., et al. (2019). Improved Aerosol Correction for OMI Tropospheric NO<sub>2</sub> Retrieval over East Asia: Constraint from CALIOP Aerosol Vertical Profile. Atmos. Meas. Tech. 12 (1), 1–21. doi:10.5194/amt-12-1-2019
Maier, B. F., and Brockmann, D. (2020). Effective Containment Explains Subexponential Growth in Recent Confirmed COVID-19 Cases in China. Science 368, 742–746. 6492. doi:10.1126/science.abb4557
NHC (National Health Center) (2022a). URL: http://www.nhc.gov.cn/xcs/yqtb/202201/c5da49c4c5bf4bcfb320ec2036480627.shtml (accessed January 26, 2022).
NHC (National Health Center) (2022b). URL: http://www.nhc.gov.cn/xcs/yqtb/202201/376d479871e04f19b8e9a444baa9a677.shtml (accessed January 26, 2022).
Otmani, A., Benchrif, A., Tahri, M., Bounakhla, M., Chakir, E. M., El Bouch, M., et al. (2020). Impact of Covid-19 Lockdown on PM10, SO2 and NO2 Concentrations in Salé City (Morocco). Sci. Total Environ. 735, 139541. doi:10.1016/j.scitotenv.2020.139541
Peng, D. (2022). Pollution under the Blue Sky: Ozone Strikes. Available from: http://www.inewsweek.cn/viewpoint (accessed January 26, 2022).
Sharma, S., Zhang, M., AnshikaGao, J., Gao, J., Zhang, H., and Kota, S. H. (2020). Effect of Restricted Emissions during COVID-19 on Air Quality in India. Sci. Total Environ. 728, 138878. doi:10.1016/j.scitotenv.2020.138878
Shi, X., and Brasseur, G. P. (2020). The Response in Air Quality to the Reduction of Chinese Economic Activities during the COVID‐19 Outbreak. Geophys. Res. Lett. 47, 88070. doi:10.1029/2020GL088070
Tobías, A., Carnerero, C., Reche, C., Massagué, J., Via, M., Minguillón, M. C., et al. (2020). Changes in Air Quality during the Lockdown in Barcelona (Spain) One Month into the SARS-CoV-2 Epidemic. Sci. Total Environ. 726 (15), 138540. doi:10.1016/j.scitotenv.2020.138540
UG (Urumqi Government) (2022). URL: http://www.urumqi.gov.cn/wlmjgk/447021.htm (accessed January 26, 2022).
Wang, P., Chen, K., Zhu, S., Wang, P., and Zhang, H. (2020). Severe Air Pollution Events Not Avoided by Reduced Anthropogenic Activities during COVID-19 Outbreak. Resour. Conservation Recycl. 158, 104814. doi:10.1016/j.resconrec.2020.104814
Yuan, Q., Qi, B., Hu, D., Wang, J., Zhang, J., Yang, H., et al. (2021). Spatiotemporal Variations and Reduction of Air Pollutants during the COVID-19 Pandemic in a Megacity of Yangtze River Delta in China. Sci. Total Environ. 751, 141820. doi:10.1016/j.scitotenv.2020.141820
Zhang, Q., Pan, Y., He, Y., Walters, W. W., Ni, Q., Liu, X., et al. (2021). Substantial Nitrogen Oxides Emission Reduction from China Due to COVID-19 and its Impact on Surface Ozone and Aerosol Pollution. Sci. Total Environ. 753 (4), 142238–142433. doi:10.3390/atmos1104043310.1016/j.scitotenv.2020.142238
Keywords: COVID-19, city lockdown, air pollutants, urumqi, satellite remote sensing
Citation: Mamtimin A, Wang Y, Zhao T, Sayit H, Yang F, Huo W, Zhou C and Gao J (2022) Impacts of Winter and Summer COVID-19 Lockdowns on Urban Air Quality in Urumqi, Northwest China. Front. Environ. Sci. 10:910579. doi: 10.3389/fenvs.2022.910579
Received: 01 April 2022; Accepted: 11 May 2022;
Published: 31 May 2022.
Edited by:
Xinyao Xie, Institute of Mountain Hazards and Environment (CAS), ChinaReviewed by:
Hui Xiao, Guangzhou Institute of Tropical and Marine Meteorology (GITMM), ChinaLiang Yuan, Chengdu University of Information Technology, China
Copyright © 2022 Mamtimin, Wang, Zhao, Sayit, Yang, Huo, Zhou and Gao. This is an open-access article distributed under the terms of the Creative Commons Attribution License (CC BY). The use, distribution or reproduction in other forums is permitted, provided the original author(s) and the copyright owner(s) are credited and that the original publication in this journal is cited, in accordance with accepted academic practice. No use, distribution or reproduction is permitted which does not comply with these terms.
*Correspondence: Tianliang Zhao, tlzhao@nuist.edu.cn
 Ali Mamtimin
 Yu Wang
 Tianliang Zhao
 Hajigul Sayit6
  Wen Huo
 Chenglong Zhou
 Jiacheng Gao