 Sina Eslamizadeh
 Amineh Ghorbani
 Rafael Castelo Branco Ferreira Costa
 Rolf Künneke1
- 1Delft University of Technology, Delft, Netherlands
- 2EY Consulting Company, Amsterdam, Netherlands
Considering that the industrial sector consumes almost one-third of the energy demand globally, it is an urgent call to reduce the carbon footprints in this sector. Among different approaches to meet this goal, such as the employment of carbon capture technologies and increasing energy efficiency within industries, transitioning to renewable electricity (RE) would be another outlook to reduce the carbon footprints and increase the energy security of the industries. Collective power generation within communities has shown to be feasible and promising in the industrial sector, where groups of industries collaborate to generate energy and meet their energy demand. In this research, we investigated how the initiation and continuation of industrial community energy systems (InCES) among companies can take place and which financial incentives the government can introduce to support these initiatives. We built an agent-based model that incorporates cost-benefit analysis and cultural factors in the decision making process of industries, to assess the feasibility of initiating/joining an InCES by industries. This study shows that the FIT mechanism had the worst performance in incentivizing the establishment of an InCES among industries. In contrast, the TAX incentive showed the best performance in mobilizing the investments towards InCES. Similarly, the TAX incentive showed relatively superior performance in electricity generation, the number of established InCESs, and the number of companies joining each InCES. Despite the better performance of the TAX incentive, it was also the most expensive option for the governments as a significant share of the establishment costs of an InCES was put on the shoulders of the governments.
Introduction
The industrial sector consumes almost one-third of the energy demand globally (IRENA, 2015). The urgent need to reduce emissions makes it crucial for the industrial sector to take faster and more concrete steps toward this goal. Although deploying solutions such as carbon capture and storage (CCS) technologies can reduce the manufacturing industry’s carbon dioxide (CO2) emissions, they are rather costly and do not necessarily reduce reliance on fossil fuels. Transitioning to a more electrified energy system that dominantly uses renewable resources would be the only way to achieve higher and long-term reductions in the industrial sector’s fossil fuel demand and related emissions.
Shifting from fossil-based energy to renewable electricity requires massive upfront investments given the substantially higher demands and baseloads in the industrial sector than in other sectors (e.g., built environment). This hinders the development of such projects by industrial companies. One way to tackle this investment hurdle is to collectively invest in renewable energy systems and establish “community energy” among industrial companies of an industrial cluster. The shared investment can reduce the costs by almost 30% (IRENA, 2020). And substantially reduce the amount of power loss throughout the grid.
Globally, different incentive mechanisms have been introduced by governments to promote the generation of electricity from renewable resources for CESs, wherein almost all shareholders are households and small businesses (Abolhosseini and Heshmati, 2014). However, given the significant differences in energy demand and energy consumption patterns of industrial companies, these incentive mechanisms can be substantially different. To this date, schemes that can best incentivise industrial companies’ willingness to form an industrial community energy system have not yet been studied to the best of our knowledge.
This research investigates the role of different mechanisms in incentivising the formation of an industrial community energy system (InCES). We use agent-based modelling and simulation to identify the conditions that lead to the formation and continuation of an InCES. This approach has already proven to be an effective method to study bottom-up initiatives such as CESs (e.g., (Verhoog et al., 2016; Fouladvand et al., 2020; Ghorbani et al., 2020; Fouladvand et al., 2022).
The simulation model can help explore how industrial companies can be incentivised to invest in energy cooperatives and how this partnership can sustain over time. We bring the well-pronounced differences in the decision-making styles between industrial companies and households into the spotlight. The model takes a cost-benefit analysis (CBA) approach, which industrial companies often use to evaluate the financial gains of investment plans (Griffin, 1998). Besides the CBA, the model also considers the industrial companies’ societal attributes when deciding to continue their partnership (Eslamizadeh et al., 2022). This conceptualisation builds on Hofstede’s cultural dimensions theory (Hofstede, 2011) combined with Scharpf’s organisational decision-making theory. Using these theories, we create a heterogeneous population of industrial companies with distinguished social reactions in the partnership that influences their sustained membership in the cooperative.
This research uses data from six different countries (Japan, Brazil, Australia, the United States, Iran, and the Netherlands) to inform our model. This choice of country data helps us better generalise the findings due to noticeable differences in economic structures, societal attributes, and biophysical characteristics of these countries. We experiment with the settings for each of these countries to compare how different incentive mechanisms would act in mobilising the investments of the industrial companies in the formation and continuation of InCESs.
The structure of this paper is as follows: In Literature review Section, we position this research by reviewing the literature on collaborations among industrial companies and financial incentives to support community energy. Theoretical background Section provides the theoretical background of this research. Methodology Section describes the methodological steps and the case studies. An agent-based model of InCES Section explains the agent-based model and Results Section presents its results. And finally, Discussions and conclusion Section provides the discussion and conclusion.
Literature review
Collaborations among industrial companies
To proceed with the industrial transition to RE, companies can consider investing in RE generation individually, which would be complicated by high upfront investment costs that include the RE technology as well as the infrastructure. An alternative solution is collective investment in RE generation, which would help industrial companies split a noticeable share of the mentioned costs among participants. Also, in the collective approach, the administrative efforts (e.g. acquiring permits for establishing an RE power plant) would be less. Therefore, despite the difficulties associated with collective decision-making, coordination mechanisms and demand management in an InCES, this approach can be a more economically viable solution toward industrial transition to RE.
Collaboration among industrial companies is not new. There is an extensive body of literature on industrial symbiosis (IS), a type of collaboration in which industrial companies share resources and byproducts (Domenech and Davies, 2011). Industrial collaboration in IS aims to optimise resource consumption and the associated economic and environmental benefits for the industrial companies involved (Lombardi and Laybourn, 2012). InCES can be considered as a type of IS that focuses on collaborative power generation and demand management. In that respect, many collaboration requirements, such as “trust” (Deutz et al., 2007; Chertow and Ehrenfeld, 2012; Walls and Paquin, 2015), “economic benefits” (Chertow and Ehrenfeld, 2012; Walls and Paquin, 2015) and “community spirit” (Golev et al., 2015), seem to be equally relevant for the establishment of an InCES. At the same time, the more physical requirements, such as geographical proximity, which is a crucial element for an IS project (Jensen et al., 2011), might not be essential in InCES. This is because the generated power in an InCES can be transferred from the collective power plant and among industrial companies through the already existing electricity grid.
In addition to the above-mentioned requirements for an InCES, Eslamizadeh et al. (Eslamizadeh et al., 2020), highlighted the importance of collective institutional arrangements for governing such industrial initiatives and the need for incentive mechanisms to help industrial companies overcome the financial barriers of initiating such plans.
Financial incentives to support community energy
There is a considerable body of literature on collective renewable electricity production in local communities of households and small businesses. Energy communities are formed by members who share the values associated with a specific location, such as societal attributes, a particular spatial territory, and common ethics. They engage in a collective investment and consequently benefit from its advantages (Magnani and Osti, 2016). In this regard, energy cooperatives (REscoops) are one of the most known types of energy communities in which renewable energy would be generated and/or supplied to provide power or revenue (or both) to its members (Walker and Devine-Wright, 2008; Bomberg and McEwen, 2012; Kalkbrenner and Roosen, 2016).
High upfront investment costs are among the most critical barriers to establishing a community energy system (CES), especially in developing economies where renewable technologies’ availability and financial feasibility are not yet present (Heeres et al., 2004; Tudor et al., 2007; Yu et al., 2015). There is a body of literature on the incentive mechanisms to promote CESs. These incentives are introduced to support citizens, as local investors, to establish CESs as a path to low-carbon energy transition. Curtin et al. (Curtin et al., 2018) in a recent study explain that in the starting phase of a CES, incentives such as “targeted loans” and “grants” are most effective for the establishment of CESs. Consequently, in the later project stages, “grants”, “feed-in-tariffs (FIT)” and, “tax” incentives can act as market-independent supports for local investors (Curtin et al., 2018). In addition, “tradable green certificates” which are bond-like certificates issued for different levels of RE production, have been introduced as market-type incentives for CESs and RE generation projects in general (Abolhosseini and Heshmati, 2014).
Theoretical background
Initiation of an industrial community energy system
One of the main aspects to consider for the initiation of InCES is the decision-making process. Industrial companies decisions are structured by strategic and rational procedures unlike decision making between private households as in the case of CES(Laroche, 1995; Man Zhang and Greve, 2018). In the former case, these are required for reaching a consensus between different decision-makers with different interests and viewpoints (referred to as political decision-making) (Shepherd and Rudd, 2014; Kreutzer et al., 2015; Elbanna, 2018).
In addition to the decision-making process, InCESs face many technological, socio-economic, environmental, and institutional challenges (Michalena and Hills, 2013). Industrial firms have high demands for electricity with more stringent requirements on the availability and quality of electricity service provision. There are also much more pronounced differences in electricity consumption patterns between industrial companies than between households in a ''conventional’ community energy system. Therefore, reaching a consensus between industrial participants of an energy community may be much more challenging than in a household setting where the members have similar demands (Tudor et al., 2007).
Industrial decision-making process
Industrial companies can be categorised as composite actors when it comes to decision-making. Scharpf presents composite actors as: “Even though individuals may have considerable difficulty in managing their ‘multiple ‘selves’, their partners and opponents will generally not hesitate to treat them as unitary actors” (Scharpf, 1990). In most cases, decisions in the industrial companies are taken by several people, for example, as C-level management, as board of directors or decision board, through employees voting, in an owning family, or a combination of these (Scharpf, 1988a).
Social attributes of industrial companies for participating in an InCES
In this research, we use Scharpf’s game-theoretical decision-making framework for composite actors to simplify the complex decision processes of big organisations (Scharpf, 1988b). The framework, presented in Figure 1, captures the possible decision-styles of composite actors on one axis (Unanimous decision, Majority decision, or Hierarchical decision) and the type of decision rule (Problem-solving, Bargaining or Confrontation) on the other axis. Every actor has a preferred way to make a decision, which is a combination of its predominant decision-style and decision rule (Scharpf, 1988a). In this research, we use the different decision rules to characterise the companies in the way they make decisions and their reactions to the decisions made by other companies in a collective setting.
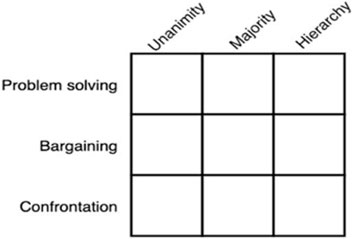
FIGURE 1. Decision-style framework (Scharpf, 1988a).
In addition to the decision-making style, industrial companies are also influenced by the act of their peers within their network, especially when deciding on joining a partnership (Scharpf, 1990). In the realm of network theory, every individual entity follows a network of peers with some social ties known as the “small-world network” (Behrendt, 2015). Practically, the connections within this small-world network can be classified into 1) weak ties and 2) strong ties (Easley and Kleinberg, 2010).
A weak tie implies a relationship between two companies with substantially limited interactions. In contrast, a strong tie reflects a relationship where the two connected companies consider each other similar (the homophily principle). This principle creates several interaction triangles, which, for industrial companies, translates to having a network of partners. The members of the strong network provide a more affluent influence on each other’s decisions (Easley and Kleinberg, 2010).
The small-world network proposed by Watts-Strogatz (Watts and Strogatz, 1998) is a circular graph where each node connects to its neighbour nodes. Each node can rewire and connect nodes across the graph based on a probability; shortening the paths between nodes (Figure 2) (Easley and Kleinberg, 2010). This depicts a relatively close representation of reality as companies connect with their neighbours but may also be strongly connected to companies much further away.
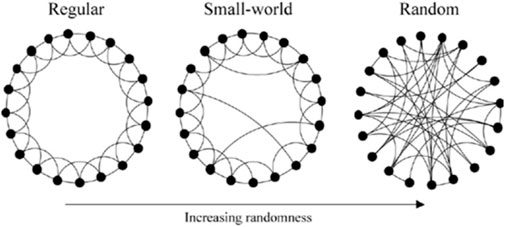
FIGURE 2. Small-world network and randomness (Windfinder, 2019)
Besides considering a network structure, we use Hofstede’s culture dimensions theory (Hofstede, 2011) to define the cultural attributes of a single industry within a cluster, thus making a heterogeneous population. The six dimensions are Power Distance, Individualism vs. Collectivism, Assertiveness vs. Caring, Uncertainty avoidance, Long-Term Orientation, and Indulgence vs. Restraint. For the detailed definition of each dimension, please visit Supplementary Appendix Figure SA2. The cultural dimensions are also used to customise the model for particular countries by using real-world values on each dimension (Hofstede, 2011).
In this research, to reflect the differences in decision-making styles of companies in different cultures, we used the values from Hofstede’s social dimension theory in Scharpf’s decision matrix for each company to reflect the way each company would react (decide) in a collective setting. We use the “decision rule” axis of the matrix and place the companies in terms of their social behaviour into three categories of 1) problem-solving, 2) bargaining and 3) confronting. To allocate different values to each company according to the country it is located in, we use Hofstede’s values of “Power Distance”, “Indulgence vs. restrain” and, “Long-term orientation”. The three mentioned dimensions (the average of these three values) can be interpreted as the higher Hofstede’s values, the more a company’s social characteristics shift from problem-solving to confronting according to Scharpf’s decision rule. In other words, the higher Hofstede’s values, the more companies tend to act selfishly in collective settings.
Financial evaluation of participating in an InCES
The financial soundness of participating in an InCES project is a vital matter for companies. Cost-benefit analysis (CBA) is a technique to model industrial companies as business entities that evaluate the economic feasibility of investments by cataloguing the aggregated benefits (pros) and costs (cons) of a project based on their monetary values. For evaluating projects with a duration of more than one year, companies compare financial benefits based on the net present value (NPV) of the years in which the project has been running. A reliable method for implementing CBA in an RE investment project is calculating the Levelized Cost of Electricity (LCOE) (Tran and Smith, 2018).
Using LCOE (Eq. 1), each company calculates how much renewable electricity unit (kWh) is generated against the project’s total cost. This technique can help compare renewable technologies with different lifespans for generating a desirable amount of electricity (US Department of Energy, 2013).
Eq. 1: LCOE calculation equation.
Where '''I' is the total investment in present value, '''OM’ is the current value of the periodic operations and maintenance costs, '''G' is the total generation of energy during the ‘project’s life span, ‘i' is the project discount rate, and ‘t' is the project life span.
Following Figure 3 by IRENA (IRENA, 2019a), we assume that about 30% of the installation cost associated with the “soft costs” can be divided among stockholders of a solar/wind farm. Therefore, we introduce LCOEind. and LCOEcol.; where LCOEind. measures LCOE when a company decides to generate RE individually (same as Eq. 1), and LCOEcol. calculates LCOE when a company chooses to generate RE collectively within a group of n members (Eq. 2).
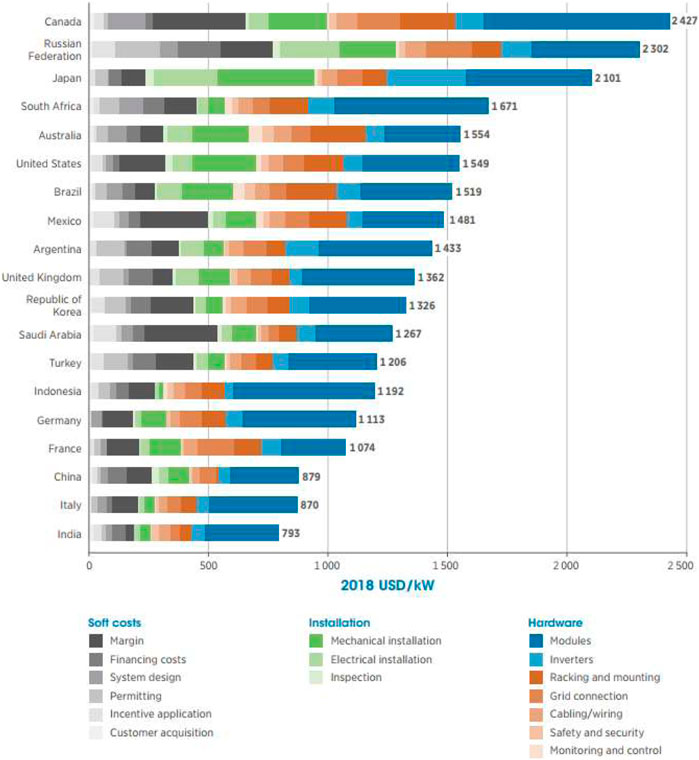
FIGURE 3. Renewable farm installation cost breakdown (IRENA, 2019a).
Eq. 2: LCOE in collective form.
With this method, the financial impact of incentive mechanisms introduced to promote renewable electricity generation can be assessed. This research applies the most common financial incentives in the literature (Abdelaziz et al., 2011; Abolhosseini and Heshmati, 2014; Warbroek and Hoppe, 2017) as listed below:
Feed-in-tariff
FIT is the most commonly used incentive to promote RE generation globally (Ko et al., 2019). Under this incentive, the government guarantees the purchase of generated RE for a fixed price higher than the grid price for a certain period to make investments in RE generation financially more attractive (Abolhosseini and Heshmati, 2014).
Tax incentives
Tax incentives create an exemption of some (or all) taxes related to renewable energy generation. This type of incentive mechanism aims at encouraging renewable energy consumption through applying tax credits or tax deductions on the purchase, installation, generation, and/or consumption of RE, facilitating the penetration of renewable energy deployment into the market. This type of incentive can be a direct discount when purchasing and installing the equipment or a lowered future tax (Abolhosseini and Heshmati, 2014).
Tradable green certificates
Tradable green certificates (TGC) are financial incentives that reward energy producers based on the amount of RE they generate. By doing so, they receive tradable certificates with a fixed face value for every unit (for example, one certificate = fixed dollars = 1 MWh). Such a certificate is treated like stocks bonds and can be traded in the market. TGC is a quantity-based incentive, while the FIT mechanism is price-based. Therefore, to increase the number of certificates, a company only needs to increase RE generation (Calel, 2011; Abolhosseini and Heshmati, 2014).
In this research, we will use the general idea behind these three mentioned incentives to study the role of incentive mechanisms for the formation and continuation of InCES. However, note that these incentives are only loosely used as the exact definition depends on the country and the situation it is being applied to. Other incentive mechanisms or adjustments of these three can be incorporated into the model for further exploration, making the model a tool to study incentives.
Figure 4 illustrates our theoretical approach regarding how an industrial company’s decision is shaped for InCES initiation/participation and continuation.
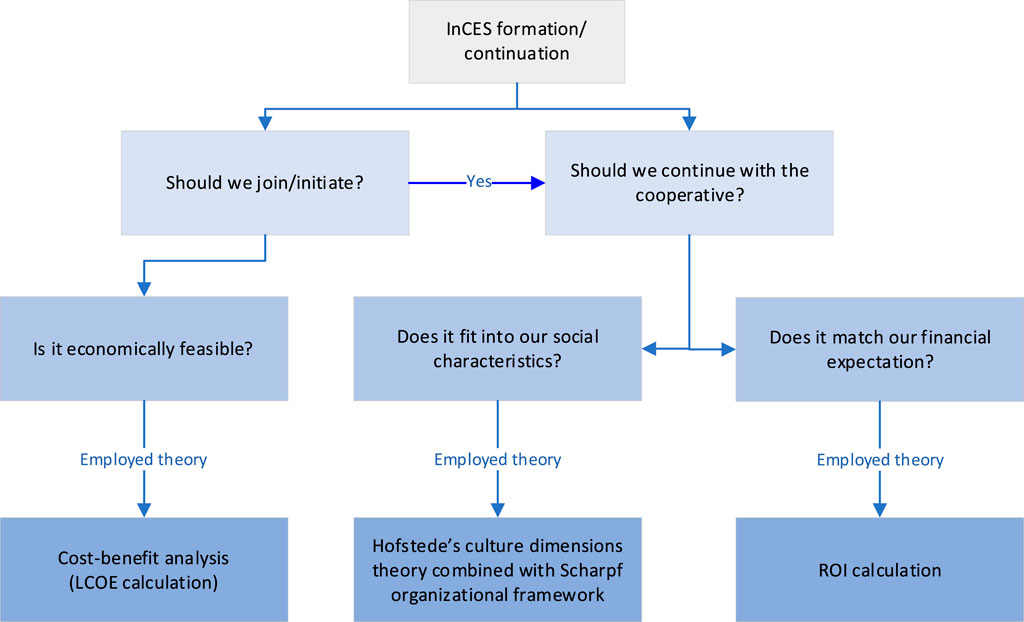
FIGURE 4. Theories used for simulating an InCES establishment.
Methodology
In this research, we built an agent-based model based on the theoretical underpinning explained in Industrial decision-making process Section to investigate the impact of financial incentives on the formation and continuation of an InCES in a context with given socio-economic characteristics. This simulation approach has already proven to have valuable insights when employed to analyse the dynamics of other types of collective actions (Janssen and Ostrom, 2006; Chaigneau and Canessa, 2012; Ghorbani and Bravo, 2016). The model was built using the MESA package for Python, and the results were analysed in Python data analytics packages (Van Rossum and Drake, 1995).
Case studies
As mentioned before, we aim to explore the effectiveness of the financial incentive mechanisms for the formation and continuation of InCESs in an industrial cluster, by considering industrial companies’ societal attributes and economic preferences. Given the factors we are considering in our model (i.e. cultural dimension for decision-making style, biophysical characteristics of the location, the electricity price, the interest rate and the installation costs), the results heavily depend on the country where an InCES is being implemented. Therefore, this paper parameterises the model to represent six different countries in order to gain context-specific insights. These countries are Iran, the U.S., the Netherlands, Australia, Japan, and Brazil, covering a wide range of societal and economic conditions. Since the calculation of the price of electricity generated from renewable resources depends on the biophysical characteristics of the exact location, we select a city within each country (Table 1), to better use the available datasets (e.g., wind speed or Sun irradiation intensity, Supplementary Appendix Figure SA1).
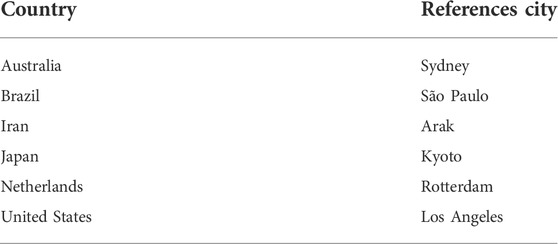
TABLE 1. List of reference cities within our case studies.
An agent-based model of InCES
This section explains the conceptualisation and implementation details of the ABM. The model presents an industrial park with a heterogeneous population of companies (0–50 companies). In the following, we explain this model’s internal mechanisms by first explaining the agents, their attributes, their decision-making processes to initiate/join an InCES, and the dynamics of the model.
Agents
The model consists of two different types of agents: 1) individual companies and 2) InCES. Table 2 shows the description of each of these agents.
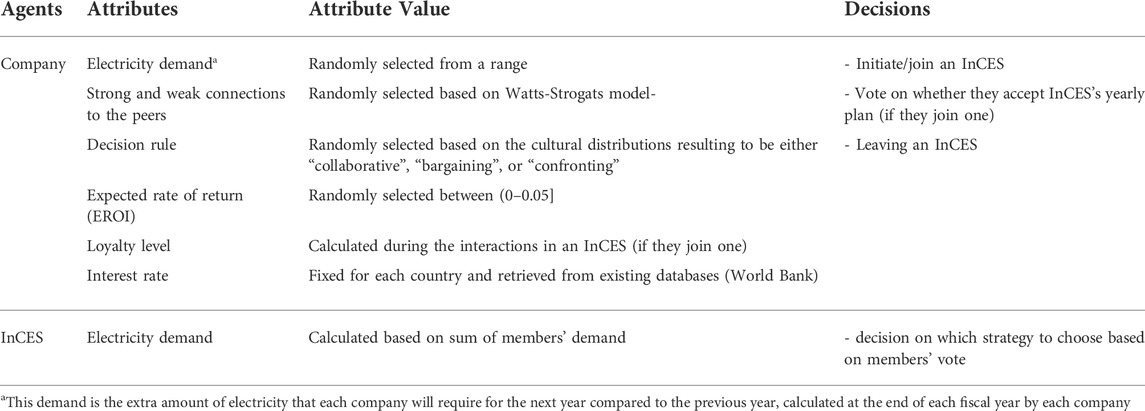
TABLE 2. Agents attributes in the model.
Model dynamics
Companies joining/establishing an InCES
At the end of each fiscal year, each industry calculates how much more electricity they would require in the next year compared to the current year. Consequently, the companies decide whether it is economically viable to satisfy this extra demand1 from renewable resources or not by conducting a cost-benefit analysis using the LCOE calculation (details in Theoretical background Section). In this analysis, companies compare their LCOEind. with the grid tariff. If it is less than the grid tariff, the company looks for an existing InCES in the cluster. If an InCES is present, the industry will join that InCES since the LCOEcol. is assumed to be always less than LCOEind. (Eq. 2). If more than one InCES is present, the company will join the one with more members leading to less LCOEcol.. If there is no existing InCES, the industry will check peers in its strong network with LCOEind. less than grid tariff and join them to initiate an InCES. In that case, an LCOEcol. is calculated, and if it is less than the grid tariff, these companies will initiate an InCES collectively. If there are no InCES in the cluster and there are no companies with LCOEind. less than grid tariff in the strong network, the company will decide to generate renewable power individually.
While calculating LCOEind., if the value is higher than the grid tariff, the company will search the cluster for any existing InCES. In case there is one, the company will calculate the LCOEcol. for that InCES and if it is less than grid tariff, it will join that InCES. If there are more than one InCESs in the cluster, the company will join the one with more members (resulting in less LCOEcol.). If the LCOEind. is higher than the grid tariff, and there are no InCESs existing in the cluster, the company will no longer consider generating renewable power and will continue using the national grid. Figure 5 recaps the decision process that each company follows.
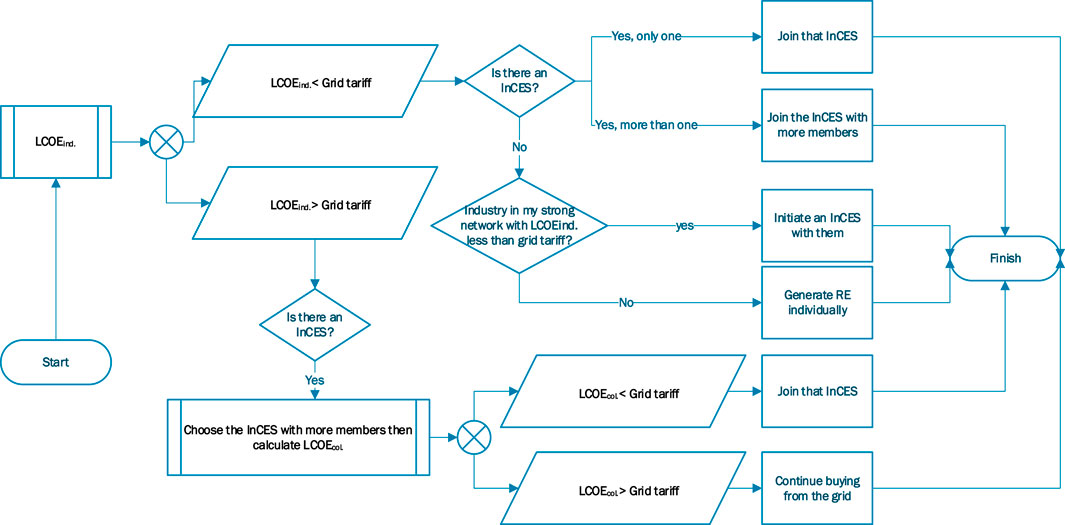
FIGURE 5. Flowchart of an industry joining/establishing an InCES or Exiting one.
The costs in the decision-making process are calculated based on the incentive mechanism under study in the model and the technological availability in that geographical location (this process happens by each individual company before they decide to join/initiate and InCES).
Dynamics of interactions in an established InCES
Once established, an InCES decides whether 1) to generate RE to meet members’ demands or 2) to generate RE to meet members’ demands and sell the excess generated electricity to the grid and pay out dividends. Also, the technology they should choose for these two alternatives is selected.
Technology selection
The InCES agent calculates the LCOE based on three alternative technologies of 1) only solar, 2) only wind, or 3) a combination of both. To select the technology, InCES agent calculates the LCOE under each of the mentioned alternatives and the one with the lowest LCOE will be selected.
Yearly strategy selection
To decide whether the InCES wants to 1) generate RE and provide it to the members or 2) sell the generated electricity to the grid and payout dividends, the InCES considers the return on investment (ROI) ratio. The InCES selects the plan with higher ROI and will put it to vote for the members.
Voting on the proposed plan by the InCES
In the voting session, members of the InCES evaluate whether the plan chosen by the InCES is acceptable to them or not using two criteria: 1) feasibility and 2) financial desirability.
To assess the feasibility of the plan, each industrial company calculates the LCOE and compares it to what they pay to the grid. If the LCOE is less than that amount, they consider this plan feasible.
To assess the financial desirability, each company compares the ROI of the proposed plan to its expected ROI. The expected ROI is randomly assigned to each company from the range (0–0.05] (Table 2). If the ROI of the offered plan by the InCES is higher than the company’s expected rate of return, they would consider the plan a financially desirable plan.
Companies that evaluated the plan as both “feasible” and “financially desirable” will vote “yes”; otherwise, their vote would be “no”. Eventually, if the majority of the members vote “yes” for the plan that the InCES agent offered, it will be selected as the pathway of the InCES for that particular year (tick).
Leaving InCES
The decision for each company to stay or leave the InCES happens based on two dimensions, 1) the loyalty point and 2) the financial desirability (ROI).
By combining Scharpf decision-making framework and Hofstede’s social dimensions theory, we assigned each company a “decision rule” related to Scharpf’s decision matrix. Based on these characteristics, each company reacts differently (adding/subtracting loyalty points) to satisfactory/unsatisfactory events during the course of interactions in an InCES (the voting session in the case of our ABM).
“Decision rule” is the attribute by which companies react to the outcome of the voting sessions in an InCES. To put it in simple word, based on “decision rule”, companies evaluate how their vote was compared to the outcome of the voting session.
To determine a company’s decision rule (i.e., problem-solving, bargaining, or confronting), we generate a normal distribution between 0 and 100 for each country. This distribution is derived by considering its mean as the average of the three cultural dimension (“Power Distance,” “Indulgence vs. restrain” and, “Long-term orientation) for that country. To calculate the standard deviation for this distribution, we utilised the average standard deviation of Hofstede’s values of the mentioned three dimensions per country. Consequently, a random value from this country-specific distribution is assigned to each company for that country (Figure 6). Therefore, companies in different countries can have any of the three different decision rules, but the number of companies belonging to each decision rule category differs depending on the countries’ cultural distribution. As explained in Theoretical background Section, the higher Hofstede’s values for the three cultural dimensions are (we use the average of these three mentioned dimensions), the more companies shift from being problem-solving-oriented towards confronting. Therefore, in the calculated normal distributions per country, values between 0–33 represent problem-solving companies, values in 34–66 are bargaining companies, and values in 67–100 represent confronting companies.
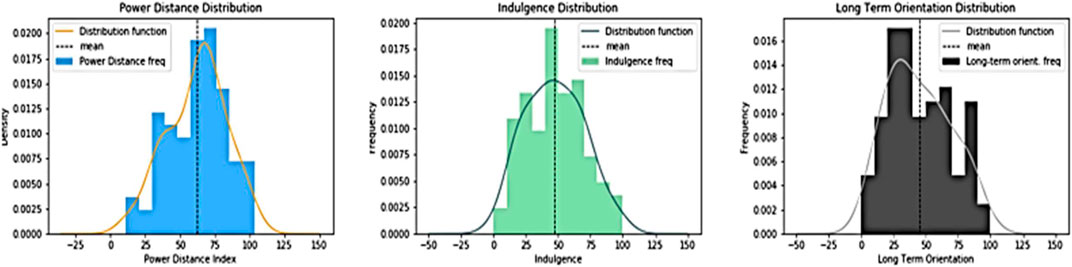
FIGURE 6. Determination of decision rule for one country as an example.
Table 3 shows how each company adds/subtracts loyalty points based on their decision rule and the different outcome alternatives in a voting session.
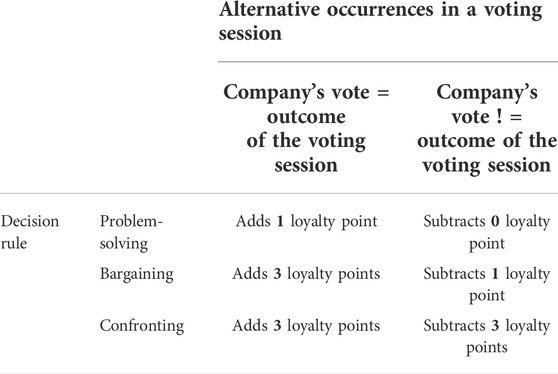
TABLE 3. Assessing the loyalty points.
Based on the dynamics of interactions introduced above, each member would add/subtract loyalty points until it reaches its bear minimum. At this point, the company checks if staying in the InCES is financially desirable (according to its expected ROI). If positive, they will remain with the community. If not, the company will exit.
Parameter setup and model settings
This section describes the parameter setup of the simulation. Three incentive scenarios are defined for each country: Feed-in-tariff, Tax Incentive, and Tradable Green Certificates, as shown in Table 4.
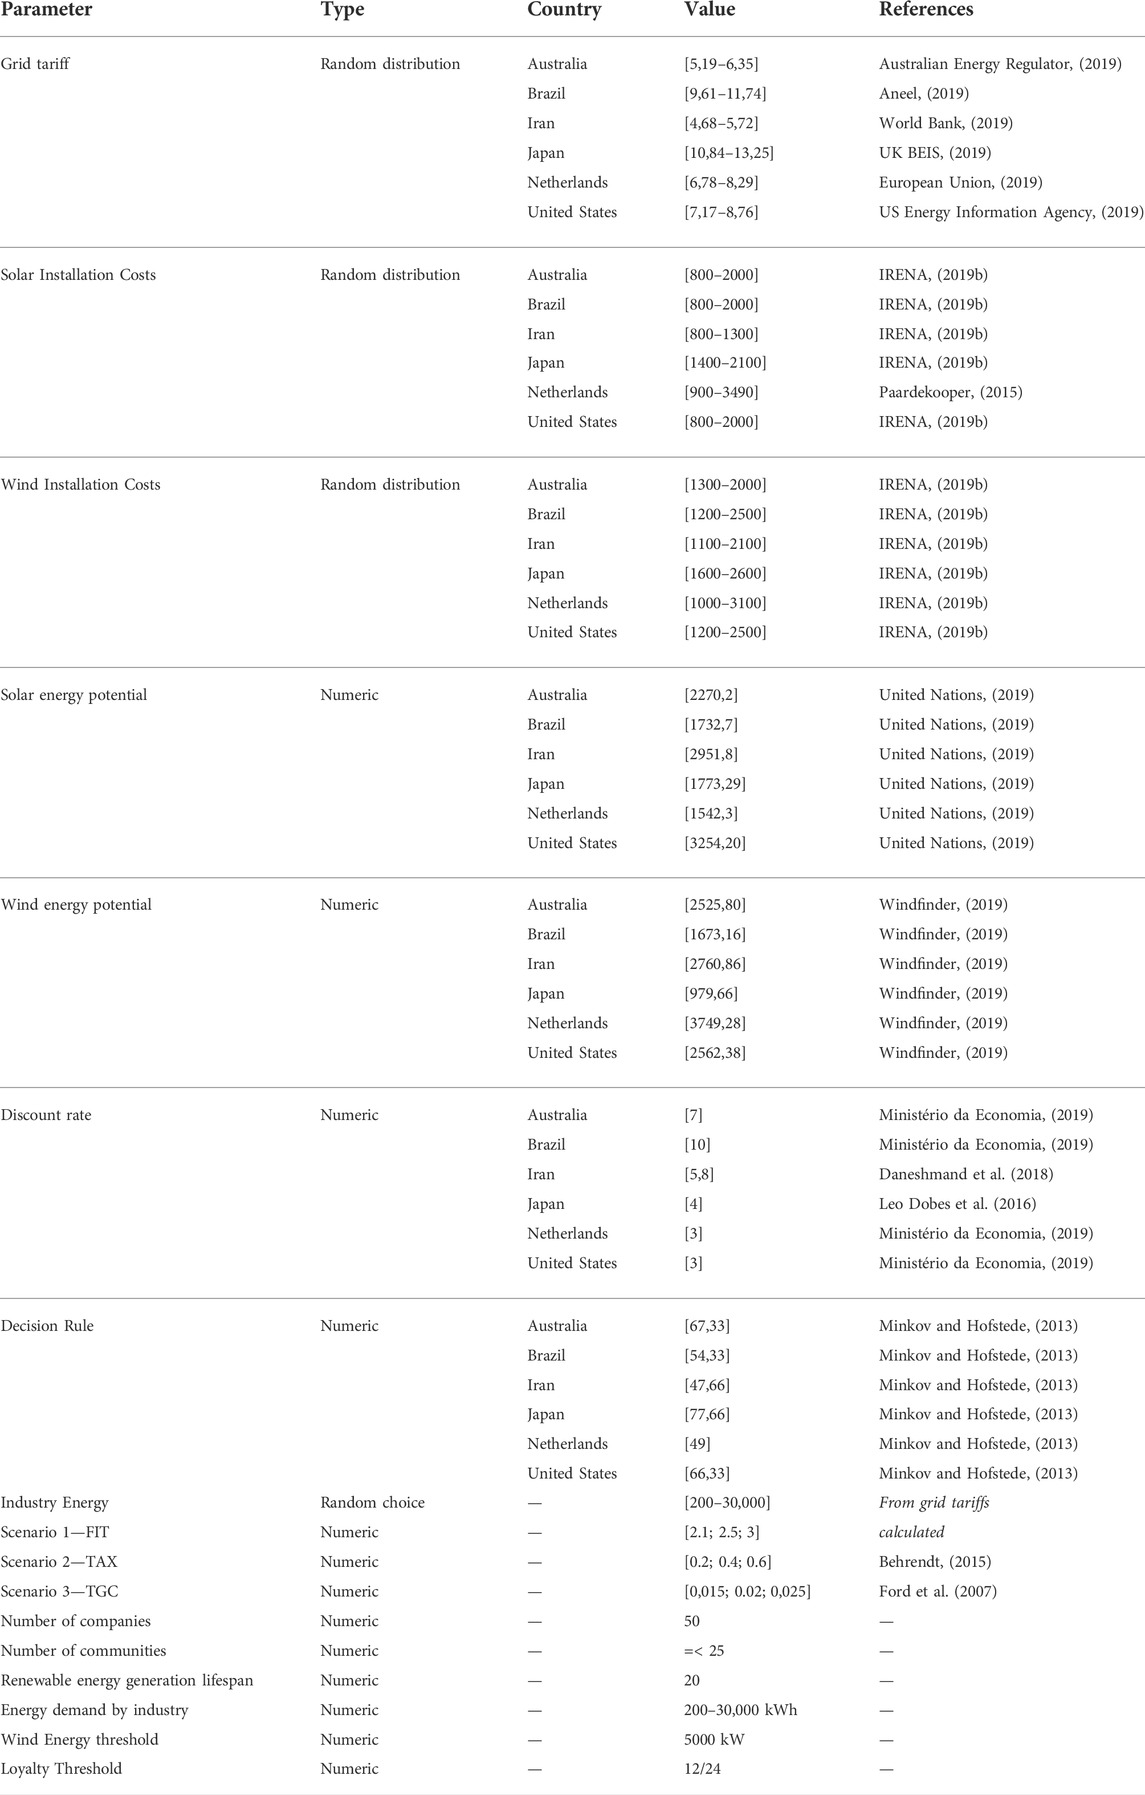
TABLE 4. ABM parameters description.
The maximum number of industrial companies in an industrial cluster is 50, following a definition by World Bank (Saleman and Jordan, 2014) on industrial clusters. We limited the number of InCESs in each cluster to 25 since each InCES needs at least two members to exist. The model stops after 20 ticks representing 20 years, which is currently considered the lifespan of renewable technologies (Behrendt, 2015; GE Power, 2018). Furthermore, each industrial company’s electricity demand is selected randomly from a uniform distribution between 200 kWh and 30,000 kWh. The runs were repeated 500 times. Table 4 outlines the parameters and their values.
Results
To address the main research question of this study, which was to explore the role of different incentive mechanisms on the formation and continuation of InCES, KPIs of 1) electricity production per scenario, 2) number of established InCESs, 3) number of members in each InCES and, 4) number of exited members from each InCES after 20 years, are measured. Additionally, the costs of such incentives for the government are also calculated.
It is important to emphasise that the countries we are presenting here are parameterised using a limited set of values from various data sources. This inevitable simplification implies that there might be other factors (e.g., political) that shape the outcomes of a country differently than the results of this simulation. The same holds for incentive mechanisms: their implementation may be different across countries, and our representation of them may not be accurate in the simulation. Our goal in this research is to do a comparative study; focusing on the relative differences rather than actual output values.
Number of established InCESs
The total number of established InCESs is measured by the sum of all active InCESs for each year per scenario and per country. The outcome shows that the effects of the TAX and TGC incentives were almost the same in establishing InCESs (Figure 7). On the other hand, the FIT incentive shows better performance in initiating InCESs, especially in Australia and the Netherlands (See Table 5). The number of communities is relatively constant, with its numbers increasing rapidly in the initial years and stabilising through the lifetime of the InCES. Peak values start in the second year, showing that almost all companies who might join/establish an InCES have already decided to do so, by the end of the second year. After that, no drastic change in the number of formed InCESs is made.
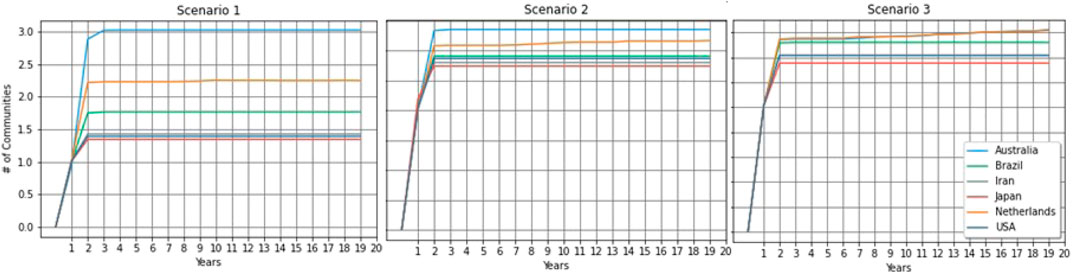
FIGURE 7. Number of established InCESs.
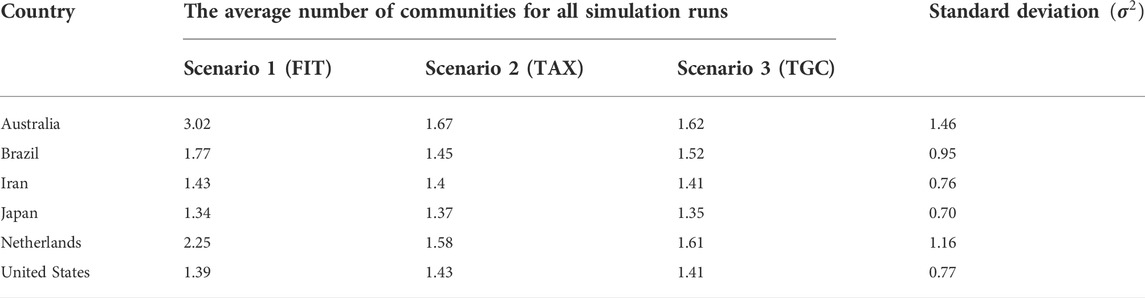
TABLE 5. Number of established InCESs.
Although the number of established InCESs gives a general insight into the effectiveness of the incentive mechanisms, it is not necessarily sufficient to assess the performance of incentive mechanisms. Therefore, we also measured how many companies joined these InCESs and continued with the initiative.
Number of members in established InCESs
Table 6 shows the average maximum number of companies that joined the communities under each incentive scenario.
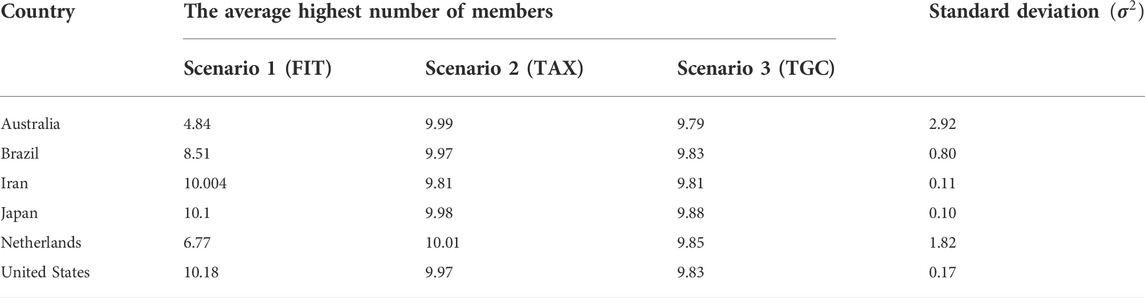
TABLE 6. No. of members in InCESs.
The results of Table 6 illustrate that different types of financial incentives in the United States, Japan, Brazil and Iran do not significantly influence the number of companies that join an InCES. On the other hand, for Australia and the Netherlands, different incentive schemes performed differently where the FIT scenario performs worst.
Number of exited members from InCESs
Exiting an InCES is another crucial metric that should be carefully analysed since leaving an InCES is not straightforward given the high industrial electricity demands (Eslamizadeh et al., 2020). Also, the exit of a member from the community can be a heavy economic burden on the shoulder of an InCES (Eslamizadeh et al., 2020). Therefore, it is vital to measure how many members left the InCES in 20 years and what caused this phenomenon. As mentioned previously in Section 4, the exit of a member happens when both aspects of “loyalty level” and “economic desirability” are not reasonable for that member. Loyalty is determined during the voting process, and reflects how a company perceives its belonging to the community through its interactions with other members of the InCES. Table 7 shows the number of members who left an InCES under different incentive scenarios.
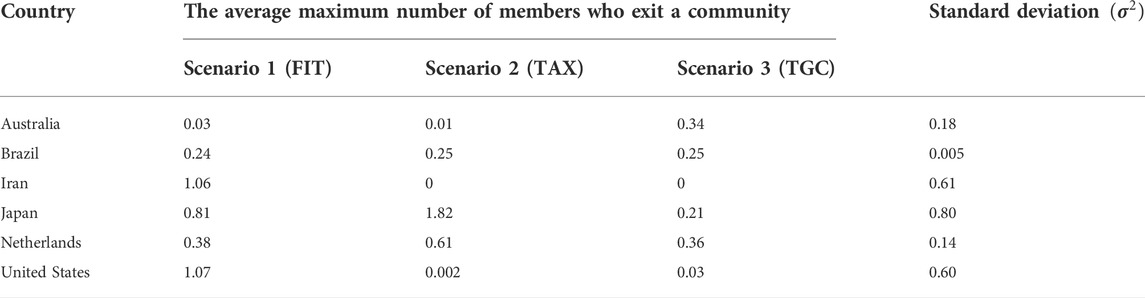
TABLE 7. No. of exited members from InCESs.
Table 7 reflects that the number of members who left an InCES in all countries is far less than the number of companies who joined an InCES. According to Table 7, almost no member exited the InCESs under different scenarios considering the very distinct social preferences (according to Hofstede’s social dimensions theory). The reason behind this lies in the fact that for each member to exit, both thresholds for economic desirability and loyalty level should exceed. Therefore, even if a member is not happy with the social dynamics of an InCES, it stays since the InCES satisfies its economic desirability. Note that there is a noticeable overlap between the CBA when a member decides to establish/join an InCES and economic desirability analysis when a member wants to leave an InCES. Although the methods to conduct these mentioned analyses are different, if an InCES seems economically beneficial for a member to join, it stays economically desirable during the membership period preventing that member from leaving the InCES.
Electricity generation
The amount of generated RE in InCESs is one of the most critical metrics, particularly in the eyes of policymakers. This amount is presented for each country and under different financial incentives in Table 8.
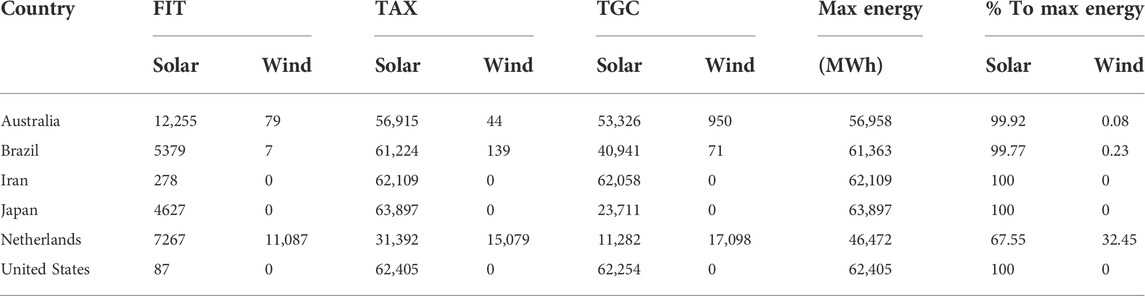
TABLE 8. Amount of generated RE in each country.
Based on the findings reflected in Table 8, wind energy is the least common renewable resource. Netherlands is almost the only country that heavily utilises this resource for electricity generation. The reason behind this outcome is the minimum installation capacity for windmills set to 5 MW, which is reasonable due to higher installation costs of wind parks compared to solar farms. Therefore, the Netherlands is the only country with more than 5 MW of demand which is economically feasible to be supplied from windmills due to having more wind resulting in more wind electricity production potential.
In terms of incentives, the FIT incentive appears to have the worst performance, while the TAX incentive seems to be the most effective one for generating RE.
Nonetheless, although the RE generation potential of our case studies varies significantly (refer to Supplementary Appendix Figure SA1), the total generated RE in each of the case countries is not substantially different. The better performance of a country such as Japan in RE generation within its established InCESs can be justified by the much higher grid tariff than other countries making RE production more economically attractive. However, contrary to Japan, the lower solar potential and the minimum demand requirement for wind energy installation (as mentioned above) made RE generation less financially desirable in the Netherlands.
In addition to the impact of grid tariff, the discount rate in Japan is notably low (refer to Supplementary Appendix Figure SA1), making the LCOE lower and more economically viable.
The total amount of investments
This section investigates the total investment to establish an InCES. By introducing incentive mechanisms, the government contributes to the total amount of investment required to establish an InCES. Tables 9, 10 show the cost composition related to establishing an InCES in each of our cases under different incentive scenarios.
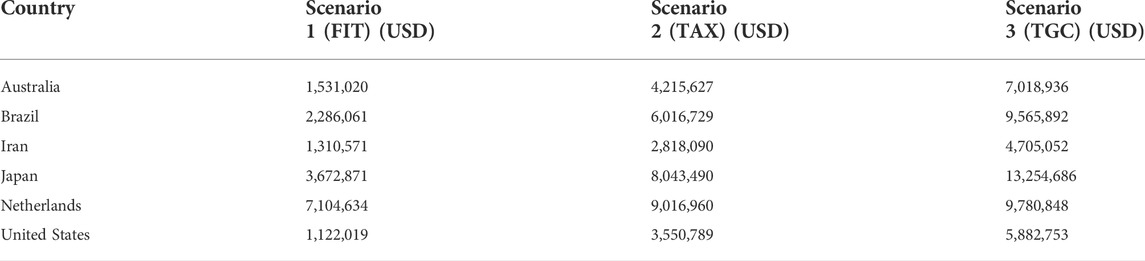
TABLE 9. Investment by InCES members.
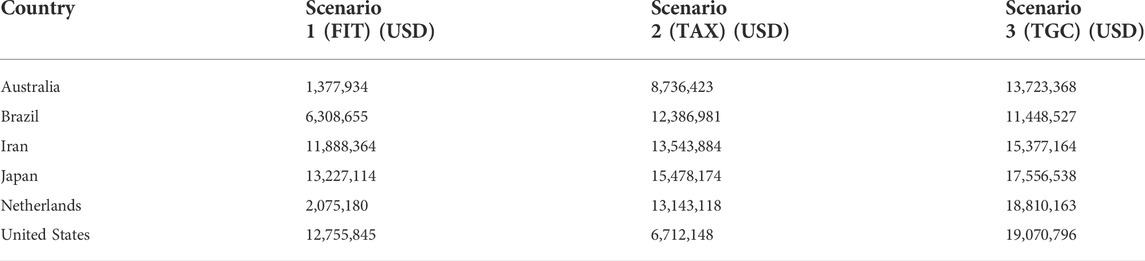
TABLE 10. Investment by the governments.
According to Tables 9, 10, communities made the least investment in the FIT scenario, while the TGC scenario appeared to be the costliest scenario for the governments. But combining the insights from these tables with the total RE generated sheds a brighter light on the performance of the incentive scenarios. Table 11 captures the cost composition related to the most effective incentive for each country in terms of power generation, which happens to be the tax incentive. For some countries, we considered both TAX and TGC scenarios due to small differences in the electricity productivity results.
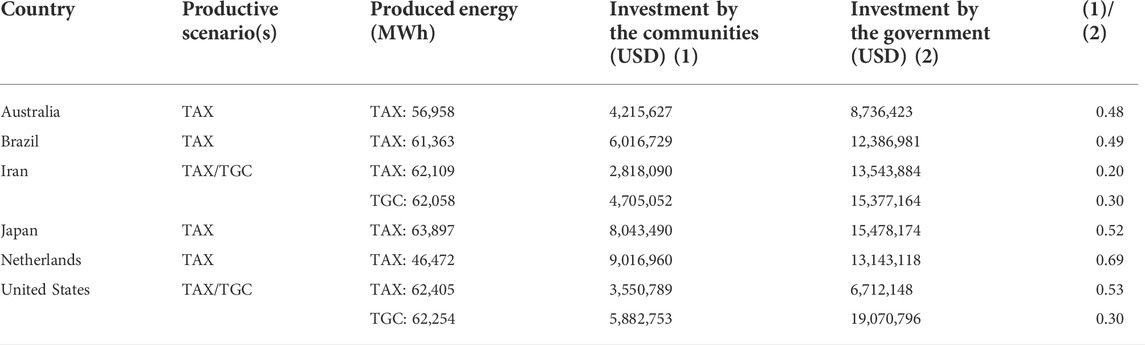
TABLE 11. Cost composition of the incentive mechanism.
The reason which makes the TAX scenario more attractive for industrial companies is that in all of the countries except the Netherlands, communities invest about half and even less of the investment made by the government. Interestingly, for Iran and the United States, the TGC scenario had almost the same impact on electricity generation while a much bigger portion of the expenses to generate the electricity was paid by the government.
Discussion and conclusions
In this research, we aimed to explore the role of financial incentive mechanisms in the formation and continuation of InCESs. To address this goal, we took an agent-based modeling approach. We combined Scharpf’s organisational decision-making theory with Hofstede’s social dimensions theory to determine the decision-making styles of industrial companies based on their culture. Consequently, we simulated the economic impact of the three incentive mechanisms of feed-in-tariff, tax-cut, and tradable green certificates, which were our suggestions of plausible financial mechanisms from governments to promote RE production. To better generalise the findings of this research, we selected six different countries of Australia, Brazil, Iran, Japan, the Netherlands, and the United States, to cover a wide variety of economic and societal characteristics.
This study showed that the FIT incentive scenario was the least effective in encouraging industrial companies to establish/join an InCES. Also, communities generated the least amount of RE under this incentive scenario. On the other hand, the TAX incentive scheme, which operates as a discount in RE technology, turned out to be the most effective scenario regarding RE generation.
The study also showed no substantial differences between incentive scenarios regarding community establishment, the number of members, and the number of member exits from InCESs in 20 years. Yet, the TAX scenario showed superior outcomes in all mentioned aspects, especially regarding RE generation, while putting most of the installation expenditures on the shoulders of the governments. Interestingly, the TGC incentive scheme acted almost the same as the TAX incentive in terms of RE generation but with more investments from both government and communities. Although this reflects the cost efficiency of the TAX incentive, it should be noted that this incentive, even if cheaper than TGC, cannot promote the most efficient RE technologies due to a lack of market mechanism2. Besides, TGC has the potential to create a new bond market, similar to carbon bonds, adding significant value to this option in the near future. These bonds can be traded like any other government bonds producing additional revenue for their holders. Part of the mentioned revenues from TGC could also be used to fund subsidies for reducing carbon emissions. Despite the high potential of the TGC scenario, the TAX incentive creates more liquidity, helping industrial companies’ revenue streams access cash in shorter periods which is a crucial aspect for industrial companies.
The model shows that the answer to “which financial incentive is the most effective between TAX and TGC?” depends on the government’s and policy analysts’ economic preferences. For example, should the government bear more costs or reduce its investments, making communities invest more? This question cannot be simply answered as each government and administration has a different political-economic view on such a problem.
Besides the economic insights, the way industrial companies in different cultures would behave in a partnership (InCES) did not have a noticeable difference in the exit of members from an InCES. This highlights that even though there is a substantial cultural difference between industrial companies in our case countries, companies will not choose to leave an InCES if staying as a member satisfies their economic preferences. If the model had not considered the exit of a member to be dependent on both economic desirability and societal attractiveness (loyalty points), there would have been more exits from the InCESs. However, this was observed while many members’ loyalty points crossed the exit threshold through the 20 years period. Still, members did not exit because the economic desirability threshold had not reached the bare minimum for the same members to exit the cooperative. This seems to be an important finding while we are dealing with industrial companies as the members of a cooperative, while in CESs with households as members, societal challenges would lead to higher percentages of member exits.
This is also in line with the real-life experience with industrial companies, where the economic feasibility highly accounts for many decisions industries make. Also, considering the higher upfront investment industries should make in an InCES due to their large electricity demand would not allow for an easy exit from an InCES, just due to societal challenges.
Finally, it is worth mentioning that this research used various assumptions and simplifications for modeling purposes. Using one incentive mechanism at a time and not investigating the role of a combined scenario is one example of the mentioned simplifications in this study. It is worth reemphasising here that our model made a simple representation of the incentive mechanisms that may influence the outcomes. The goal here was to focus on the fundamental idea behind these incentives and build the model in such a way to allow for other incentives to be implemented in the future in the same model. The same goes for country specifications. The differences were only related to the cultural dimension values, price of electricity, and biophysical differences, resulting in the different potentials for RE production and the economic structure of the countries (interest rate, installation costs, etc.). As such, we are not aiming to determine which country is successful and which one is not, but rather studying them in relation to each other given the differences. Additionally, a deeper dive into why incentive schemes similar to what we considered in this research as the FIT is such a desirable incentive mechanism worldwide, considering its remarkable inferior results shown in this research, seems to be a legit research topic for further investigations. Moreover, this study can be extended by future inquiries on how a TGC incentive mechanism can be a more popular mechanism for promoting RE generation and what lessons can be learned from the “carbon credit market” to avoid its downsides.
Data availability statement
The datasets presented in this study can be found in online repositories. The names of the repository/repositories and accession number(s) can be found below: https://github.com/rafaelcbfc/InCES_model.
Author contributions
All authors contributed to the conception and design of the study. RC developed the agent-based model. SE wrote the first draft of the manuscript. SE and AG contributed to manuscript revision, read, and approved the submitted version.
Conflict of interest
RC was employed by the company EY Consulting Company.
The remaining authors declare that the research was conducted in the absence of any commercial or financial relationships that could be construed as a potential conflict of interest.
Publisher’s note
All claims expressed in this article are solely those of the authors and do not necessarily represent those of their affiliated organizations, or those of the publisher, the editors and the reviewers. Any product that may be evaluated in this article, or claim that may be made by its manufacturer, is not guaranteed or endorsed by the publisher.
Supplementary material
The Supplementary Material for this article can be found online at: https://www.frontiersin.org/articles/10.3389/fenvs.2022.924509/full#supplementary-material
Footnotes
1In this research, we only considered the extra electricity demand of each industrial company per year, since we believe that transitioning to RE in the industrial sector should happen gradually due to large industrial electricity demands. Therefore, this assumption makes the research more in line with what is practically being experienced in the industrial sector
2TGC and FIT are behaving based on a market mechanism. Meaning that the more electricity you generate, the more your financial reward will be. This results in promoting the most efficient technologies to generate the maximum amount of RE. While in TAX incentive, a fixed percentage of the expenses will be paid by the government
References
Abdelaziz, E. A., Saidur, R., and Mekhilef, S. (2011). A review on energy saving strategies in industrial sector. Renew. Sustain. Energy Rev. 15, 150–168. doi:10.1016/j.rser.2010.09.003
Abolhosseini, S., and Heshmati, A. (2014). The main support mechanisms to finance renewable energy development. Renew. Sustain. Energy Rev. 40, 876–885. doi:10.1016/j.rser.2014.08.013
Boekhoudt, A., and Behrendt, L. (2015). Taxes and incentives for renewable energy. KPMG Int. 22. https://assets.kpmg/content/dam/kpmg/pdf/2015/09/taxes-and-incentives-2015-web-v2.pdf.
Bomberg, E., and McEwen, N. (2012). Mobilizing community energy. Energy Policy 51, 435–444. doi:10.1016/J.ENPOL.2012.08.045
Calel, R. (2011). Climate change and carbon markets: A panoramic history. Cent. Clim. Chang. Econ. Policy Work. 62.
Chaigneau, S., and Canessa, E. (2012). The power of collective action: How agents get rid of useless concepts without even noticing their futility. Proc. - Int. Conf. Chil. Comput. Sci. Soc. SCCC, 275–282. doi:10.1109/SCCC.2011.35
Chertow, M., and Ehrenfeld, J. (2012). Organizing self-organizing systems. J. Ind. Ecol. 16, 13–27. doi:10.1111/j.1530-9290.2011.00450.x
Curtin, J., McInerney, C., and Johannsdottir, L. (2018). How can financial incentives promote local ownership of onshore wind and solar projects? Case study evidence from Germany, Denmark, the UK and ontario. Local Econ. 33, 40–62. doi:10.1177/0269094217751868
Daneshmand, A., Jahangard, E., and Abdollah-Milani, M. (2018). A time preference measure of the social discount rate for Iran. J. Econ. Struct. 7, 29. doi:10.1186/s40008-018-0127-x
Deutz P, Lyons D L, Gibbs D & Jackson T (2007). “Editorial”, Special Issue: Industrial Ecology and Regional Development, Progress in Industrial Ecology: an International Journal, 4(3/4), 155–163.
Domenech, T., and Davies, M. (2011). Structure and morphology of industrial symbiosis networks: The case of Kalundborg. Procedia - Soc. Behav. Sci. 10, 79–89. doi:10.1016/j.sbspro.2011.01.011
Easley, D., and Kleinberg, J. (2010). Networks, crowd, and markets - reasoning over a highly connected world. Econom. Theory. 26, b1–b4. doi:10.1017/s0266466609990685
Elbanna, S. (2018). The constructive aspect of political behavior in strategic decision-making: The role of diversity. Eur. Manag. J. 36, 616–626. doi:10.1016/j.emj.2018.06.006
Eslamizadeh, S., Ghorbani, A., Araghi, Y., and Weijnen, M. (2022). Collaborative renewable energy generation among industries: The role of social identity, awareness and institutional design. Sustainability 14, 7007. doi:10.3390/su14127007
Eslamizadeh, S., Ghorbani, A., Künneke, R., and Weijnen, M. (2020). Can industries be parties in collective action? Community energy in an Iranian industrial zone. Energy Res. Soc. Sci. 70, 101763. doi:10.1016/j.erss.2020.101763
Ford, A., Vogstad, K., and Flynn, H. (2007). Simulating price patterns for tradable green certificates to promote electricity generation from wind. Energy Policy 35, 91–111. doi:10.1016/j.enpol.2005.10.014
Fouladvand, J., Mouter, N., Ghorbani, A., and Herder, P. (2020). Formation and continuation of thermal energy community systems: An explorative agent-based model for The Netherlands. Energies 13, 2829. doi:10.3390/en13112829
Fouladvand, J., Rojas, M. A., Hoppe, T., and Ghorbani, A. (2022). Simulating thermal energy community formation: Institutional enablers outplaying technological choice. Appl. Energy 306, 117897. doi:10.1016/j.apenergy.2021.117897
Ghorbani, A., and Bravo, G. (2016). Managing the commons: A simple model of the emergence of institutions through collective action. Int. J. Commons. 10 (1), 200–219. doi:10.18352/ijc.606
Ghorbani, A., Nascimento, L., and Filatova, T. (2020). Growing community energy initiatives from the bottom up: Simulating the role of behavioural attitudes and leadership in The Netherlands. Energy Res. Soc. Sci. 70, 101782. doi:10.1016/j.erss.2020.101782
Golev, A., Corder, G. D., and Giurco, D. P. (2015). Barriers to industrial symbiosis: Insights from the use of a maturity grid. J. Ind. Ecol. 19, 141–153. doi:10.1111/jiec.12159
Griffin, R. C. (1998). The fundamental principles of cost‐benefit analysis. Water Resour. Res. 34, 2063–2071. doi:10.1029/98wr01335
Heeres, R. R., Vermeulen, W. J. V., and de Walle, F. B. (2004). Eco-industrial park initiatives in the USA and The Netherlands: First lessons. J. Clean. Prod. 12, 985–995. doi:10.1016/J.JCLEPRO.2004.02.014
Hofstede, G. (2011). Dimensionalizing cultures: The Hofstede model in context. Online Readings Psychol. Cult. 2, 1–26. doi:10.9707/2307-0919.1014
Inglehart, R., Haerpfer, C., Moreno, A., Welzel, C., Kizilova, K., Diez-Medrano, J., et al. (2014). World values Survey: Round six - country-pooled datafile. Madrid: World Value Survey.
IRENA (2019b). Renewable power generation costs in 2018. Abu Dhabi: IRENA. doi:10.1007/SpringerReference_7300
IRENA (2020). Renewable power generation costs | IRENA, renewable power generation costs in 2019. Abu Dhabi: IRENA. Available at: https://www.irena.org/-/media/Files/IRENA/Agency/Publication/2018/Jan/IRENA_2017_Power_Costs_2018.pdf.
Janssen, M. A., and Ostrom, E. (2006). Empirically based, agent-based models. Ecol. Soc. 11, art37. doi:10.5751/es-01861-110237
Jensen, P. D., Basson, L., Hellawell, E. E., Bailey, M. R., and Leach, M. (2011). Quantifying “geographic proximity”: Experiences from the United Kingdom’s national industrial symbiosis programme. Resour. Conserv. Recycl. 55, 703–712. doi:10.1016/j.resconrec.2011.02.003
Kalkbrenner, B. J., and Roosen, J. (2016). Citizens’ willingness to participate in local renewable energy projects: The role of community and trust in Germany. Energy Res. Soc. Sci. 13, 60–70. doi:10.1016/j.erss.2015.12.006
Ko, W., Al-Ammar, E., and Almahmeed, M. (2019). Development of feed-in tariff for PV in the kingdom of Saudi arabia. Energies 12, 2898. doi:10.3390/en12152898
Kreutzer, M., Walter, J., and Cardinal, L. B. (2015). Organizational control as antidote to politics in the pursuit of strategic initiatives. Strateg. Manag. J. 36, 1317–1337. doi:10.1002/smj.2306
Laroche, H. (1995). From decision to action in organizations: Decision-making as a social representation. Organ. Sci. (Linthicum). 6, 62–75. doi:10.1287/orsc.6.1.62
Leo Dobes, J., Leung, O., and Argyrous, G. (2016). Social cost-benefit analysis in Australia and New Zealand: The state of current practice and what needs to be done. Canberra: Australian National University Press.
Lombardi, D. R., and Laybourn, P. (2012). Redefining industrial symbiosis: Crossing academic-practitioner boundaries. J. Ind. Ecol. 16, 28–37. doi:10.1111/j.1530-9290.2011.00444.x
Magnani, N., and Osti, G. (2016), Does civil society matter? Challenges and strategies of grassroots initiatives in Italy’s energy transition. Energy Res. Soc. Sci. 13, 148–157. doi:10.1016/j.erss.2015.12.012
Man Zhang, C., and Greve, H. R. (2018). Dominant coalitions directing acquisitions: Different decision makers, different decisions. Acad. Manage. J. 62, 44–65. doi:10.5465/amj.2017.0323
Michalena, E., and Hills, J. M. (2013). Renewable energy governance: Complexities and challenges, Lect. Notes Energy 23, 101–116. doi:10.1007/978-1-4471-5595-9
Ministério da Economia (2019). Social discount rate estimative for infrastructure project in Brazil. Brasilia.
Paardekooper, M. (2015). Economic Feasibility of Solar Panels in Amsterdam Assessing and validating the potential of roof top solar panels in the city of Amsterdam.
Saleman, Y., and Jordan, L. (2014). The implementation of industrial parks: Some lessons learned in India. J. Intl. Econ. Comm. Policy 6, 1550005. doi:10.1142/S1793993315500052
Scharpf, F. W. (1988). Decision rules, decision styles, and policy choices. Köln: Max-Planck-Institut für Gesellschaftsforschung.
Scharpf, F. W. (1988). Decision rules, decision styles, and policy choices. Köln: Max-Planck-Institut für Gesellschaftsforschung. Available at: http://hdl.handle.net/10419/125878.
Scharpf, F. W. (1990). Games real actors could play: The problem of connectedness. Köln: Max-Planck-Institut Für Gesellschaftsforsch.
Shepherd, N. G., and Rudd, J. M. (2014). The influence of context on the strategic decision-making process: A review of the literature. Int. J. Manag. Rev. 16, 340–364. doi:10.1111/ijmr.12023
Tran, T. T. D., and Smith, A. D. (2018), Incorporating performance-based global sensitivity and uncertainty analysis into LCOE calculations for emerging renewable energy technologies. Appl. Energy 216, 157–171. doi:10.1016/j.apenergy.2018.02.024
Tudor, T., Adam, E., and Bates, M. (2007). Drivers and limitations for the successful development and functioning of EIPs (eco-industrial parks): A literature review. Ecol. Econ. 61, 199–207. doi:10.1016/J.ECOLECON.2006.10.010
US Energy Information Agency (2019). Electricity data. Washington: U.S Energy Information Administration (EIA).
Van Rossum, G., and Drake, F. L. (1995). Python tutorial, Centrum voor Wiskunde en Informatica Amsterdam. Netherlands.
Verhoog, R., Ghorbani, A., and Dijkema, G. P. J. (2016). Modelling socio-ecological systems with MAIA: A biogas infrastructure simulation. Environ. Model. Softw. 81, 72–85. doi:10.1016/j.envsoft.2016.03.011
Walker, G., and Devine-Wright, P. (2008). Community renewable energy: What should it mean? Energy Policy 36, 497–500. doi:10.1016/j.enpol.2007.10.019
Walls, J. L., and Paquin, R. L. (2015). Organizational perspectives of industrial symbiosis: A review and synthesis. Organ. Environ. 28, 32–53. doi:10.1177/1086026615575333
Warbroek, B., and Hoppe, T. (2017). Modes of governing and policy of local and regional governments supporting local low-carbon energy initiatives; exploring the cases of the Dutch regions of Overijssel and Fryslân. Sustainability 9, 75–36. doi:10.3390/su9010075
Watts, D. J., and Strogatz, S. H. (1998). Collective dynamics of ‘small-world’ networks. Nature 393, 440–442. doi:10.1038/30918
World Bank (2019). Economy profile of Iran. Washington: Islamic Rep. Doing Business 2020 Indicators.
Keywords: industrial community energy system, energy transition, financial incentive, industrial collaboration, community energy systems
Citation: Eslamizadeh S, Ghorbani A, Costa RCBF, Künneke R and Weijnen M (2022) Industrial community energy systems: Simulating the role of financial incentives and societal attributes. Front. Environ. Sci. 10:924509. doi: 10.3389/fenvs.2022.924509
Received: 20 April 2022; Accepted: 25 July 2022;
Published: 07 September 2022.
Edited by:
Narottam Das, Central Queensland University, AustraliaReviewed by:
Taskin Jamal, Ahsanullah University of Science and Technology, BangladeshPavel Atanasoae, Ștefan cel Mare University of Suceava, Romania
Copyright © 2022 Eslamizadeh, Ghorbani, Costa, Künneke and Weijnen. This is an open-access article distributed under the terms of the Creative Commons Attribution License (CC BY). The use, distribution or reproduction in other forums is permitted, provided the original author(s) and the copyright owner(s) are credited and that the original publication in this journal is cited, in accordance with accepted academic practice. No use, distribution or reproduction is permitted which does not comply with these terms.
*Correspondence: Sina Eslamizadeh, cy5lc2xhbWl6YWRlaEB0dWRlbGZ0Lm5s