The establishment of an intermodal walkability index for use in car oriented urban environments: The case of Nicosia
 Antony John Mouzas
 Byron Ioannou
 Paris Fokaides
- 1School of Pure and Applied Sciences, Open University of Cyprus, Latsia, Cyprus
- 2School of Engineering, Frederick University, Nicosia, Cyprus
- 3Faculty of Civil Engineering and Architecture, Kaunas University of Technology, Kaunas, Lithuania
Sustainable mobility has been considered key in the pursuit of sustainable development in urban environments. During the last decades, a lot of innovative initiatives have been proposed and examined, most of them were site-specific and highly relevant to the local context. This case study review focuses on Nicosia, a car oriented, medium sized city, and attempts to define an intermodal walkability index for the city center. In a city like Nicosia where more than 90% of the daily trips are done completely by car, encouraging intermodal mobility with walking as part of the trip is an important first step to sustainable mobility. The aim of the paper is to present a model based upon the most impactful sustainability indicators when referring to pedestrian mobility, and therefore will create an intermodal walkability index for grading the walkability of an urban environment, in our case a particular, car-oriented one. The index was developed by using the latest version of pyQGIS, due to the fact that the algorithms that are being used in the calculation of this index are already part of the geospatial analysis toolbox contained within QGIS. The paper uses as a case study the municipality of Nicosia in Cyprus where it was proven that pedestrian transportation can be graded in terms of walkability from the private car drop point. The study has also discovered that the use of primary electricity generation and fossil fuels for transport can be reduced if problematic areas that have a low or negative sustainability score are managed in ways that will increase the score.
Introduction and literature review
Intermodal walkability is the combination of pedestrian movement with any other mean of transport in order to complete a full journey (Chidambara, 2019). This case study review focuses on Nicosia and attempts to define an intermodal walkability index for the city center. The center of the conurbation is approachable in more than 90% of the movements by private cars seeking a parking place near their destination. Intramodality means the use of different transportation means in one journey, in our case is car with walking. Our case study is innovative because it proposes a walkability index for a medium-sized car-oriented city like Nicosia. Our lab results derive through the proper selection of indicators and their assessment through QGIS, an Open Source Geographic Information System (GIS) that allows browsing and map creation in the way conventional GIS software does.
The aim of the literature review is to highlight different walkability index methodologies in order to provide a common ground for the current case study application. Walkability is one of the universal challenges, very crucial to making cities resilient, as briefly mentioned in the UN Sustainable Development Goal 11 (SDG11) in the 2030 Agenda. A number of cities try to develop plans based on walkability to overcome issues such as traffic congestion, air pollution, low level of physical activities among people, and high level of carbon emissions (Epicoco and Falagario, 2022). Friendly walking neighborhoods provide a high-level pedestrian environment (Ruiz-Padillo et al., 2018) shaped by different agents. Compact city and the city of 15 min is a very popular model for achieving walkability and sustainable mobility for the future cities. Already since Lin and Yang 2006 quote the high sustainability potential of compact city in a preliminary assessment which is again confirmed by Bibri et al. (2020) with detailed interviews and secondary data. Additionally, Yao et al. (2022) emphasizes on the efficiency and the economic growth stability achieved through these models.
Designing a walkable network that approaches every part of each conurbation creates a multi-modal, functional city with mobility choices making urban space inclusive. However, in a lot of cases design has proven inadequate if not accompanied by monitoring, and evaluation but also information tools channelizing the citizen’s mobility behaviors. Walkability indexes are a tool for providing a meaningful assessment of the fabric in total that could be utilized by authorities, urban and transportation planners but also citizens in order to improve the walkable capacity of specific parts of a city or the city as a sum.
Walkability index methodologies are based on grading either peoples’ perceptions, or measurable spatial attributes. It is also usual to plan the process in steps like 1) problem description; 2) evaluation walkability; 3) understanding of the available assessment methods; 4) proposing a new framework adjusted to the specific local attributes (Abastante, et al., 2021). There are different approaches to data collection including in-field inspections of pedestrian paths and crossings or retrieving spatial data like density, land use mix, and street connectivity in order to grade the network facility. Other approaches are more related to health and passive exercise than physical space attributes, there are studies that use at the beginning a conventional prospective study design and a novel space-syntax measurement but the aim is to identify relationships between neighborhood walkability with specific routes in the city (Giles-Cortie et al., 2014; Koohsari et al., 2018; Garau et al., 2020; Caseli et al., 2021; Frank et al., 2021). Densities and the relevant lifestyle routines are also determinants of mobility behaviors and especially where there is an urban/rural transition (Molina-García et al., 2020).
Various comments on the applicability of a walkability index suggest that it is more easily applied when it is comprehensive, simple, and flexible (Fan et al., 2018). Under this aspect, there are more simplified approaches where the indicators are standardized and transformed to a value between 0 and 1 before the assessment process. (Motieyan et al., 2022). Ruiz-Padillo et al. (2018) use a similar approach to quantifying urban environment characteristics. In these cases, as well as in Manzolli et al. (2021) there is a significant focus on multicriteria evaluation approaches. In all these cases the need of including more variables has damaged simplicity and comprehensiveness. There are even more detailed approaches as Chidambara (2019), which suggest a detailed approach of more than 30 indicators relevant to geometries, traffic, accessibility, crossings, safety, liveliness, etc. Such approaches could enable measuring the comparability between different areas or the impact of specific projects but are certainly hard to apply in large-scale and preliminary assessments.
In order to overcome this gap, some approaches provide sophisticated tools like grid cells, connected to a relevant database (Hino et al., 2022), connecting land uses to focal points or the geometries of walking space (Caseli et al., 2021), or grouping parameters according to the nature of the information (Abastante, et al., 2021). There are also other approaches that base their evaluations on extended questionnaires and individual judgments by different social groups, for example, tourists (Stockton et al., 2016; Bassiri et al., 2021). The issue of last mile performance evaluation has found in two papers (Chen et al., 2021; Garces et al., 2021) lie in the logic of the current case study review since in both the cases there is an attempt to provide planning interventions with measurable assessment in order to improve transit connectivity and eliminate mobility inequality across neighborhoods.
In our opinion, the approaches that retain simplicity and comprehensiveness suggest a blend of four environmental attributes example residential dwelling density, intersection density/street connectivity, land use mix, and retail floor area ratio, or focus exclusively on densities (Mayne et al., 2013; Giles-Cortie et al., 2014; Fan et al., 2018; Rundle et al., 2019; Frank et al., 2021; Motieyan et al., 2022). Indexes should have a common background in order to be comparable and valid, but at the same time, there is a flexibility in integrating particular local features. Proximity, distance from service points and areas as well as comfort and easiness of pedestrian movement are some universal and more used parameters through the literature review.
Method: Building a walkability index for Nicosia
Our approach examines the total area of the Municipality of Nicosia, which is composed of a number of distinct neighborhoods. For this case, we follow the simplified approaches from the literature, suitable for large-scale preliminary studies. Nicosia, the capital city, is the largest of the five conurbations of the southern part of the island controlled by the Republic of Cyprus. The total population is estimated more than 250,000 inhabitants (approximately 28% of the total population under the control of the Republic, according to CyStat) extremely dispersed covering a total area of around 200 km2. Nicosia is since 1974 a divided city with its northern part of approximately 90,000 inhabitants being out of the direct control of the Republic. Urban sprawl and low densities are the main reason that consolidates a car-oriented community where more than 90% of the daily movements is carried by private vehicles (Republic of Cyprus, 2020). The Municipality of Nicosia, which serves as the city center, has currently the 1/5 of the city’s population and due to the division lies at the north edge of the city past controlled by the formal state. As the city center has a more complete network of activities and functions as the main destination for the whole conurbation.
The basic hypothesis of the current walkability index that differentiates this approach from similar literature cases is that we assume that the origin of the pedestrian movement is the drop-off parking place. In the particular conditions of Nicosia, a car-oriented city, part of traffic and congestion are usually caused by each driver’s attempt to park as close to his destination as he or she can, minimizing his or her walking distance. Under these circumstances, increasing intermodal walkability is of high importance.
In order to create an intermodal walkability index for Nicosia, we created a sequence of steps, similar to most of the cases examined in the literature review (see Figure 1, Flow Chart). At first, a GIS database containing points of interest has been built. Secondly, physical attributes were extracted from the satellite images and added to the GIS database, including buildings, vegetation, and road network. Then specific case study areas have been selected in order to provide a functional network layer in order to maximize the scope of each movement. In the next step, spatial data for neighboring land uses were retrieved from open sources and added to the database. At the same time parking, lots and parking points are also added. The index derives from an algorithm calculating positive and negative grading and, in this way, measuring the intensity of the overlapping 3 min areas and also benefited by their physical attributes (Figure 2). Finally, the index indicates the attractiveness of specific locations as more accessible than others in terms of intermodal walkability. The GIS database has been built on a vector basis as a network data structure (link-node graph) in order to enable the analysis of the existing pedestrian network system. All the selected pedestrian paths available in the public space, sidewalks, and pedestrian crossings have been mapped in the database, associating each link with a series of qualitative and quantitative attributes. In order to derive the correct aspects of shading and for what area, there was the digitization of the existing buildings in the satellite imagery that was within these two tolerance zones. The buildings that have been digitized can be considered sustainable in terms of their close proximity to the points of interest and the parking points.

FIGURE 1. Case study flow chart.
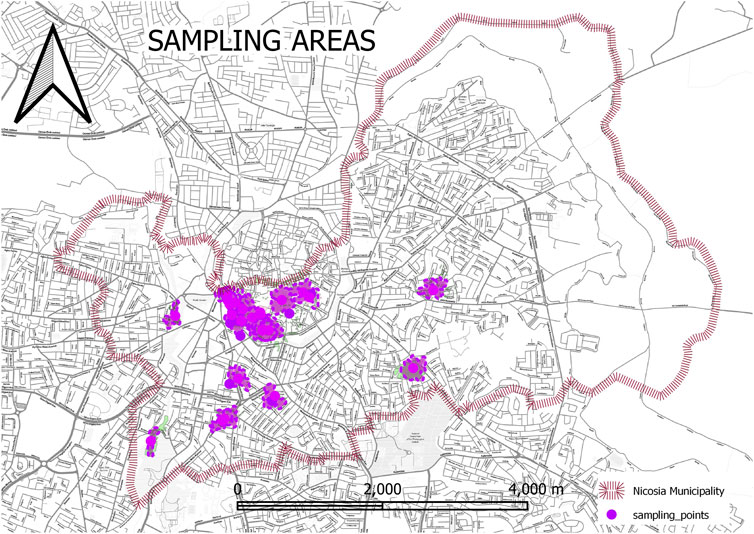
FIGURE 2. Sampling area.
Results
Figure 2 indicates the boundary of the sample area at the Municipality of Nicosia. Archived satellite imagery was analyzed and the highest quality satellite imagery of the Nicosia municipality was gathered and it was used for geospatial analysis. In terms of physical attributes from satellite images three variables were considered:
• shading (binary)—shaded areas +1, unshaded −1 (extracted from satellite imagery and also from existing buildings shade direction)
• mobility (binary)—areas within tolerance distance get +1, outside the zone is −1
• vegetation cover (binary)—segments with vegetation cover receive +1, no vegetation −1.
The processing of these data has resulted, firstly, in a series of thematic maps that identify the main critical issues related to the degree of the walkability of each link and crossing, secondly, in the calculation of a walkability index, detecting whether the pedestrian network is able to meet the needs of all users, even the most vulnerable ones, such as those with limited mobility.
The boundary of the specific study area was selected in order to have a functional network layer and the boundary to which the scope of the sustainability index will function. Along with these two layers, there must also be points of interest that pedestrians are willing to visit and would constitute a rational and declared target for the pedestrian destination. Data about leisure, amenity, office, shop, tourism, and sports destinations were collected from open sources and added to the GIS database. In addition to this, stopping points for parking points will act as an origin for the pedestrians to begin a theoretical journey. Gathering these aspects will allow for the walkability index to extract the sampling areas that will be most beneficial for public investment and public funds through maintenance, and also which have the highest levels of connectivity regarding modal transportation.
In the beginning, we gathered networks in the entire municipality. On the initial analysis of this network, there were aspects that were inaccurate for our purposes and had to be simplified, such example a cemetery sampling area, which has two parking lots adjacent to it and the footpaths within the cemetery have been identified by the algorithm as shaded paths due to a large amount of vegetation. Also, through this refinement network lines that were found to be incomplete were adjusted in order to reflect reality. There are points in the network that radiate out from the boundaries of the municipality and therefore these were considered also as origin points for motor vehicles for our purposes.
These data points were coupled with various interest points located in the municipality, as well as the various parking lots that visitors use for disembarking into the city. These three points created the foundation for our analysis, by using the serviceable area of both the parking lots and the interest points. The total serviceable areas around each interest and parking point, create a tolerance zone to which pedestrians are able to reach within 5 min at an average speed of 3 km/h (Bohannon and Andrews, 2011). This led to the perception that traffic that travels into the municipality uses these parking spaces to disembark from their vehicles in order to walk to various interest points that exist within the municipality. This also creates an overlapping area that we can consider more sustainable.
This is a view of the before mentioned overlapping areas in the algorithm, delineated by the red circular shape file, and as we can see there is an interesting point directly adjacent to two parking points and the areas that are in purple are the network areas that are within the serviceable distance of the parking lot and the lighter blue areas are the serviceable distance within a cemetery, in this case, our interest point.
These before-mentioned details have led to the conclusion that there is a sampling area of increased capacity to enable sustainable mobility in the municipality of Nicosia. This capacity is evident by the confluence of the networks that join interest points with facilities for private and public motor vehicle parking. The areas in the purple are the intersect of these two areas showing the exact size of the network with the adjacent buildings and vegetation cover can be seen in green. After the sampling area has been gathered using the methodology mentioned above, aspects of shading of the buildings were given an average value in order to reflect a 2 1/2 floor building, which is from our site observation the average height. Buildings that were quite tall were adjusted to reflect the taller building aspects and the shading that was cast upon the ground. Due to the fact that air quality is generally constant, and temperature although fluctuating is constant at any given time, and also given that the climate of Cyprus is generally hot rather than cold, areas of the network that were in full sunlight were given a negative score and areas of the network that were in the complete shade were given a positive score (Figures 2, 3).
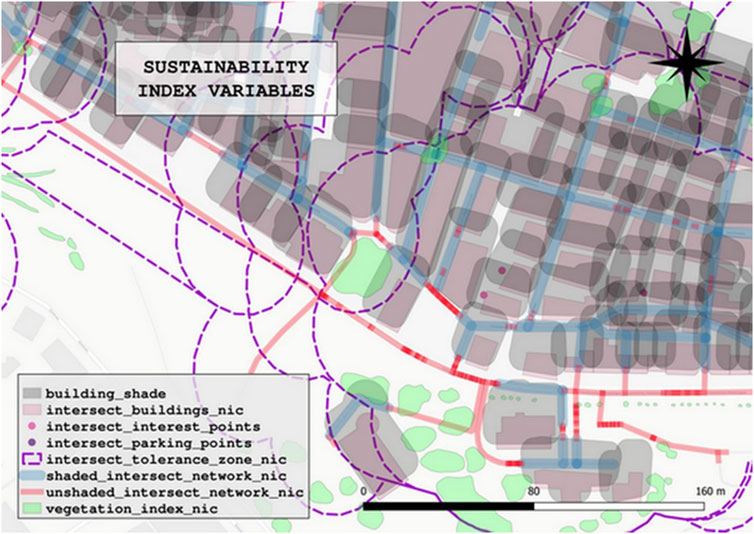
FIGURE 3. Intermodal walkability index variables.
The aspect of an obstacle coverage of the network was conceived and therefore set to random intervals in the network, resulting in a total of 10% of the network being obstructed. This 10% of obstruction includes cars that are parked on the pavement, for payment quality, inadequate paving, and lack of paving. The lines in red are very cautionary -2 on the score. This means that they are exposed and offered little to no walkability and therefore do not offer a sustainable method of pedestrian mobility, while the areas in blue and green have a higher score and in fact, a positive score means that it is a pleasant and short distance experience for pedestrians as well as being near the points of interest that the pedestrians desire to walk to. And therefore Figure 4 summarizes the intermodal walkability index of the Nicosia municipality.
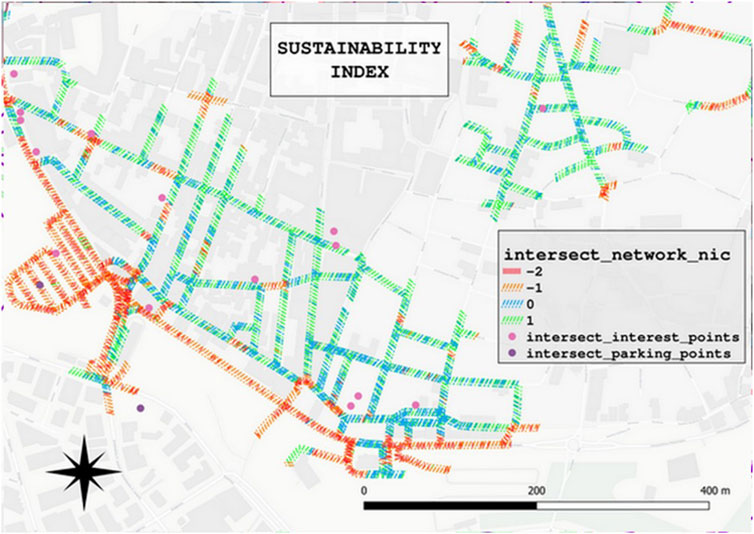
FIGURE 4. Intermodal walkability index final output.
Discussion
The use of this methodology for the quantification and establishment of a walkability index allows for an accurate evaluation of sustainable mobility within private vehicle-oriented cities, with lower public transportation access and usage. Our contribution adds to the last mile approach for intermodal mobility (Chen et al., 2021; Garces et al., 2021). This methodology will benefit from live weather and air quality data for more accurate, time-series data on walkability scores. Applications in other climate types, such as those with heavy rain or snow, would perceptibly have the same negative score as high-temperature climates. Although areas have been tagged as needing simplification or exclusion, we can see that areas that have a positive shade index, adequate vegetation cover, and the relative parking and interest points are in close proximity have positive walkability scores and are therefore more attractive for pedestrians using these forms of modal mobility.
Evaluating walkability from the private car drop point could provide a long-term benefit to the locational strategies of private investors as well as public planning processes, especially for cities with low densities and structural barriers to promoting conventional sustainable mobility strategies. In this context, the use of primary electricity generation and fossil fuels for transport can be reduced if problematic areas that have a low or negative walkability score are supported towards the increase of their score.
The main insight from the case study is that local problems need tailored approaches to be solved. Literature has revealed a huge number of parameters that shape walkability but this effort avoided just copying best practices in order to design a custom-made tool for Nicosia where servicing, as well as shaded and comfortable walking is significantly important. An important benefit of this approach is that it could be applied and function without any large-scale interventions in transportation and mobility planning. The tool can improve the walkability of the existing network and of course become more efficient if sustainable mobility measures are implemented. A minor barrier has to with the accuracy of the available data on the 3d model of the city which can be certainly improved in the following years. Another barrier has to do with monitoring and updating the database, especially concerning the fields relevant to green.
Future design and planning could benefit from our tool that could be more sophisticated, and updated frequently with temperature and air quality data, which would affect the score of the network walkability. Also, this index could integrate microscale data from crowdsourcing, for example, the detection of various different obstacles that can be found whilst navigating these areas as a pedestrian, which is also very well known to the pedestrians themselves. And finally, it could also include perceptions of the comfort, the aesthetics, and the social attributes of the users. In any case and as it was evident from the literature review, the density of destinations and the geometry of the network are the decisive elements, already integrated into the index. Under these options, sustainable mobility plans and urban renewal projects could base on a more accurate and detailed base of the city’s performance and thus increase the efficiency of their interventions.
Data availability statement
The raw data supporting the conclusions of this article will be made available by the authors, without undue reservation.
Author contributions
AJM has contributed this paper by designing the walkability index through his MSc thesis at the Open University of Cyprus, supervised by PF and BI. PF and BI guided the main author of the paper in terms of literature review, methodology design and the structure of the research.
Funding
The current publication was funded by Frederick University Research Fund.
Conflict of interest
The authors declare that the research was conducted in the absence of any commercial or financial relationships that could be construed as a potential conflict of interest.
Publisher’s note
All claims expressed in this article are solely those of the authors and do not necessarily represent those of their affiliated organizations, or those of the publisher, the editors and the reviewers. Any product that may be evaluated in this article, or claim that may be made by its manufacturer, is not guaranteed or endorsed by the publisher.
References
Abastante, F., Gaballo, M., and La Riccia, L. (2021). “Investigate walkability: An assessment model to support urban development processes,” in Smart and sustainable planning for cities and regions. SSPCR 2019. Green energy and technology. Editors A. Bisello, D. Vettorato, H. Haarstad, and J. Borsboom-van Beurden (Cham: Springer). doi:10.1007/978-3-030-57332-4_13
Bassiri, A., Allan, A., Pieters, J., and Davison, G. (2021). “Developing a GIS-based tourist walkability index based on the AURIN walkability toolkit—case study: Sydney CBD,” in Urban informatics and future cities. The urban book series. Editors S. C. M. Geertman, C. Pettit, R. Goodspeed, and A. Staffans (Cham: Springer). doi:10.1007/978-3-030-76059-5_13
Bibri, S., Krogstie, J., and Kärrholmd, M. (2020). Compact city planning and development: Emerging practices and strategies for achieving the goals of sustainability. Developments in the Built Environment Science Direct. doi:10.1016/j.dibe.2020.100021
Bohannon, R., and Andrews, W. (2011). Normal walking speed: A descriptive meta-analysis. Physiotherapy 97 (3), 182–189. doi:10.1016/j.physio.2010.12.004
Caselli, B., Rossetti, S., Ignaccolo, M., Zazzi, M., and Torrisi, V. (2021). “Towards the definition of a comprehensive walkability index for historical centres,” in Computational science and its applications - ICCSA 2021. Lecture notes in computer science. Editors O. Gervasiet al. (Cham: Springer), 12958. doi:10.1007/978-3-030-87016-4_36
Chen, S., Yan, X., Pan, H., and Deald, B. (2021). Using big data for last mile performance evaluation: An accessibility-based approach. Travel Behav. Soc. 25, 153–163. doi:10.1016/j.tbs.2021.06.003
Chidambara, (2019). “Walking the first/last mile to/from transit: Placemaking a key determinant,” in Public space in the new urban Agenda: Research into implementation urban planning. Editors M. Mehaffy, T. Haas, and P. Elmlund, 4, 183–195. doi:10.17645/up.v4i2.2017
Cyprus Statistical Service (2022). Population. Available at: https://www.cystat.gov.cy/en/SubthemeStatistics?s=46 (Accessed March 31, 2022).
Epicoco, N., and Falagario, M. (2022). Decision support tools for developing sustainable transportation systems in the eu: A review of research needs, barriers, and trends. Res. Transp. Bus. Manag. 43, 100819. doi:10.1016/j.rtbm.2022.100819
Fan, P., Wan, G., Xu, L., Park, H., Xie, Y., Liu, Y., et al. (2018). Walkability in urban landscapes: A comparative study of four large cities in China. Landsc. Ecol. 33, 323–340. doi:10.1007/s10980-017-0602-z
Frank, L., Appleyard, B., Ulmer, J., Chapman, J., and Fox, E. (2021). Comparing walkability methods: Creation of street-smart walk score and efficacy of a code-based 3D walkability index. J. Transp. Health 21, 101005101005. doi:10.1016/j.jth.2020.101005
Garau, C., Annunziata, A., and Yamu, C. (2020). A walkability assessment tool coupling multi-criteria analysis and space syntax: The case study of iglesias, Italy. Eur. Plan. Stud., 1–23. doi:10.1080/09654313.2020.1761947
Garces, E., Tomei, J., Franco, C., and Dynerc, I. (2021). Lessons from last mile electrification in Colombia: Examining the policy framework and outcomes for sustainability. Energy Res. Soc. Sci. 79, 102156. doi:10.1016/j.erss.2021.102156
Giles-Corti, B., Macaulay, G., Middleton, N., Boruff, B., Bull, F., Butterworth, J., et al. (2014). Developing a research and practice tool to measure walkability: A demonstration project. Health promot. J. austr. 25 (3), 160–166. doi:10.1071/HE14050
Hino, K., Baba, H., Kim, H., and Shimizu, H. (2022). Validation of a Japanese walkability index using large-scale step count data of Yokohama citizens. Cities 123, 103614. doi:10.1016/j.cities.2022.103614
Koohsari, M. J., Oka, K., Shibata, A., Liao, Y., Hanibuchi, T., Owen, N., et al. (2018). Associations of neighbourhood walkability indices with weight gain. Int. J. Behav. Nutr. Phys. Act. 15, 33. doi:10.1186/s12966-018-0668-2
Lin, J., and Yang, A. (2006). Does the compact-city paradigm foster sustainability? Environ. Plann. B. Plann. Des. 33 (3), 365–380. doi:10.1068/b31174
Manzolli, J., Oliveira, A., and Neto, M. (2021). Evaluating walkability through a multi-criteria decision analysis approach: A lisbon case study. Sustainability 13, 1450. doi:10.3390/su13031450
Mayne, D. J., Morgan, G. G., Willmore, A., Rose, N., Jalaludin, B., Bambrick, H., et al. (2013). An objective index of walkability for research and planning in the sydney metropolitan region of new south wales, Australia: An ecological study. Int. J. Health Geogr. 12, 61. doi:10.1186/1476-072X-12-61
Molina-García, J., Campos, S., García-Massó, X., Herrador-Colmenero, M., Galvez-Fernandez, P., Molina-Soberanes, D., et al. (2020). Different neighborhood walkability indexes for active commuting to school are necessary for urban and rural children and adolescents. Int. J. Behav. Nutr. Phys. Act. 17, 124. doi:10.1186/s12966-020-01028-0
Motieyan, H., Kaviari, F., and Mostofi, N. (2022). Quantifying walking capability: A novel aggregated index based on spatial perspective and analyses. Pap. Reg. Sci. 101, 483–503. doi:10.1111/pirs.12652
Republic of Cyprus (2020). Cyprus’ integrated National Energy and Climate Plan. Nicosia: Republic of Cyprus.
Ruiz-Padillo, A., Pasqual, F., Larranaga Uriarte, A., and Cybis, H. (2018). Application of multi-criteria decision analysis methods for assessing walkability: A case study in porto alegre, Brazil. Transp. Res. Part D Transp. Environ. 6, 855–871. doi:10.1016/j.trd.2018.07.016
Rundle, A. G., Chen, Y., Quinn, J. W., Rahai, N., Bartley, K., Mooney, S. J., et al. (2019). Development of a neighborhood walkability index for studying neighborhood physical activity contexts in communities across the U.S. Over the past three decades. J. Urban Health 96 (4), 583–590. doi:10.1007/s11524-019-00370-4
Stockton, J. C., Duke-Williams, O., Stamatakis, E., Mindell, J. S., Brunner, E. J., and Shelton, N. J. (2016). Development of a novel walkability index for london, United Kingdom: Cross-sectional application to the whitehall II study. BMC Public Health 16, 416. doi:10.1186/s12889-016-3012-2
Keywords: sustainable mobility, walkability index, QGIS, urban design, car-oriented
Citation: Mouzas AJ, Ioannou B and Fokaides P (2022) The establishment of an intermodal walkability index for use in car oriented urban environments: The case of Nicosia. Front. Environ. Sci. 10:934236. doi: 10.3389/fenvs.2022.934236
Received: 02 May 2022; Accepted: 08 July 2022;
Published: 26 July 2022.
Edited by:
Monica Salvia, Institute of Methodologies for Environmental Analysis (IMAA), ItalyReviewed by:
Nicola Epicoco, University of L’Aquila, ItalyHaozhi Pan, Shanghai Jiao Tong University, China
Copyright © 2022 Mouzas, Ioannou and Fokaides. This is an open-access article distributed under the terms of the Creative Commons Attribution License (CC BY). The use, distribution or reproduction in other forums is permitted, provided the original author(s) and the copyright owner(s) are credited and that the original publication in this journal is cited, in accordance with accepted academic practice. No use, distribution or reproduction is permitted which does not comply with these terms.
*Correspondence: Byron Ioannou, b.ioannou@frederick.ac.cy