Can ESG-Responsible Investing Attract Sovereign Wealth Funds’ Investments? Evidence From Chinese Listed Firms
 Guifu Chen
 Boyu Wei
 Liyan Dai
- 1Center for Macroeconomics Research, School of Economics, Xiamen University, Xiamen, China
- 2School of International Economics and International Relations, Liaoning University, Shenyang, China
Global sustainable development focuses on environmental, social, and corporate governance (ESG) responsible investment as a leading-edge topic in global asset management. Because of the long-term financial returns and positive social benefits of ESG-responsible investment, ESG factors have been introduced into the investment decision-making and risk management of Sovereign Wealth Funds (SWFs). Therefore, this study examines the effect of firms’ ESG-responsible investments on the investment scale of SWFs. We also examine the different influences of ESG factors in attracting SWFs’ investment, which is of some significance in discussing the investment preferences of SWFs. We find that ESG performance attracts SWFs’ investment by increasing ROA and reducing risk. The relationship between ESG and SWFs’ investments may help managers adopt appropriate strategies to attract SWFs investments and achieve coordinated development.
Introduction
After the international crude oil price increases in 2007 and the subprime mortgage crisis in 2008, several Sovereign Wealth Funds (SWFs) have gradually emerged in developing countries. According to the statistics of the SWF Institute (SWFI), Norway Government Pension Fund Global (Norway GPFG), the world’s largest SWF, controlled more than $1.4 trillion by 2021, whereas the total assets of the China Investment Corporation (CIC), the second-largest SWF, had exceeded $1.2 trillion (SWF Institute, 2022). The growth of SWFs is also noteworthy. In 2014, the assets under management (AUM) of SWFs had reached 5.5 trillion (Fotak et al., 2016), whereas this figure had exceeded 8 trillion US dollars in 2020 (Megginson et al., 2021).
Considering the scale of these investors, it is natural to focus on their investment strategies. Similar to other investment institutions, SWFs pursue short-term financial returns and strive to reduce risks. According to the 2020 annual report of the CIC, 17% of its assets are fixed-income products, whereas, for the Korea Investment Corporation (KIC), this proportion is as high as 35%. SWFs also consider sustainable corporate development in their investment decision-making. Norway’s GPFG emphasizes that its fund management aims to obtain the highest possible return with medium risk while protecting and creating wealth for future generations. CIC also systematically considers the environment, social responsibility, and corporate governance (ESG) factors in all aspects of investment. Mubarak, Chief Executive of the Mubadala Development Company in the United Arab Emirates, which takes oil revenue as the main source of its funds, said, “oil is not a resource for sustainable production. We need to make a strategic investment for the next generation after oil depletion” (Maeda, 2010). Therefore, in the large and rapidly growing Chinese market, we must question whether SWFs consider ESG factors when investing.
SWFs’ investment in mainland China began in 1995. Investment in China’s financial sector came from Singapore. In June 1995, the Singapore Government Investment Co., Ltd. (GIC) participated in establishing the China International Finance Co., Ltd. (CICC), with an investment of 7.5 million US dollars. Since 2009, the inflow of SWF investment into China has increased significantly, but there has been a significant difference in the value of SWFs. Before 2009, the SWF investment flowing into China was small, and the growth rate was slow. From 1995 to 2008, the cumulative investment attracted by SWFs reached US $8.9 billion. However, from 2009 to 2020, the average annual added value exceeded US $10 billion, and the cumulative investment reached US $264.6 billion. The main reason is the establishment of China’s SWF, which makes China have a stable source of SWF investment. After 2009, China became the main investor of SWFs, accounting for 56.53% of the total cumulative investment, reaching US $149.521 billion. In addition, Singapore is the country that likes to invest in China among the countries with SWFs, accounting for 19.3% of the total cumulative investment during the period, reaching US $51.047 billion. Canada and Norway have significantly increased their investment in China, Accounting for the third and fourth place in the proportion of cumulative investment from 2009 to 2020, accounting for 8.13 and 5.03%, respectively, with an investment of US $21.503 billion and US $13.313 billion, respectively. According to the INVESCO sovereign wealth fund report of 2021, 98% of SWFs will continue to invest in China. The primary driving force of investment is short-term, high returns. Insufficient ESG information disclosure hinders SWF investment, aligning with SWF’s trade-off between short-term returns and sustainable capital growth. With the transformation of China’s economic growth and the deepening of sustainable development strategies, Chinese firms’ social responsibility investment (SRI) has received increasing attention (Hofman et al., 2017). Improvements in ESG report disclosure also make it possible to evaluate Chinese firms’ ESG performance. However, because SWFs have no obligation to disclose information, their investment strategies and capital sources are often opaque (Alhashel, 2015). Therefore, the research on SWFs is challenging.
Based on this background, this study takes Chinese listed firms from 2008 to 2020 as the research object to explore whether their ESG performance positively affects SWF investments. First, we integrate the China Stock Market and Accounting Research Database (CSMAR), using principal component analysis to calculate the ESG performance scores of sample firms, and reduce the effect of sample selection errors through Heckman correction. The regression results show that overall ESG performance and ESG factors significantly help attract SWF investments. We then take the mean ESG score of the industry to which the firm belongs as an instrumental variable and use two-stage least squares to test the robustness of the results. We find that the SWF investment process may pay more attention to corporate governance factors. Finally, we introduce a mechanistic analysis to test the theoretical path through which ESG attracts SWF investment by improving ROA and beta.
Literature Review
What Is SWF?
Investment institutions owned and controlled by the government are considered SWFs. However, there are differences in the more specific definitions of SWFs because of the massive diversity of funding sources, governance structures, and investment objectives (Amar et al., 2018). According to the International Monetary Fund (IMF), SWFs should meet the following five conditions: (I) ease the volatility of commodities, (II) accumulate wealth for future generations, and (III) strives to reduce the opportunity cost of holding excess foreign exchange reserves and seek a higher rate of return, and (IV) support the development of the domestic economy (IMF, 2008). This shows the difference between SWFs and other investment institutions. Some studies have regarded SWFs as passive investors. For example, the Abu Dhabi Investment Company insists on not owning more than 5% of the same stock and does not pursue voting rights (Maeda, 2010). However, Dewenter et al. (2010) found the opposite. Most SWFs monitor or interfere with the target company, indicating that they may be active investors.
Although the term “Sovereign Wealth Fund” was first proposed by Rozanov (2005), the earliest SWF in the world can be traced back to the Kuwait Investment Corporation (KIA), established in 1953 (Boubakri et al., 2017). Since the 1950s, export-oriented strategies have achieved varying degrees of success (Bruton, 1998), and some countries have considered using public policy tools to manage foreign exchange reserves. However, the development of the SWF was slow during this period. With the rise in international oil and commodity prices in the early 21st century, SWFs established by countries that rely on natural resource income, such as Norway, Kuwait, and the United Arab Emirates, have developed rapidly (Eldredge, 2019). In addition, the funds for the China Investment Corporation come from the current account surplus caused by the sharp growth in exports, whereas the Government of Singapore Investment Corporation uses fiscal surplus directly (Maeda, 2010). The Australian Future Fund replenished its basic capital by selling 51% of Telstra, the largest telecommunications company in Australia (Eldredge, 2019). We list the top ten SWFs, according to the SWFI ranking, with their total assets and major funding sources in Supplementary Appendix S1, showing that SWF capital comes mainly from resource income and foreign exchange reserves (Curzio and Miceli, 2011). Governments may establish SWFs to pursue long-term returns and economic development (Lenihan, 2014) or treat macroeconomic policies with caution, especially in Asian countries and emerging economies (Castelli and Scacciavillani, 2012). Other motives for establishing SWFs, such as achieving geopolitical goals (Gilson and Milhaupt, 2009).
Investment Strategies of SWFs
The SWF investment strategy is similar to other private investment institutions. Although it is difficult to obtain financial indicators for target firms from the annual reports of major SWFs. There is still evidence that SWFs invest in companies with certain profitability (Fernandes, 2009; Bernstein et al., 2013), and investment behavior is related to a higher rate of return (Karolyi and Liao, 2017). Another portion of the literature shows that the principle of income maximization is not the only consideration for SWF investment. Chhaochharia and Laeve, 2009 found that SWF investment considers ethnic, religious, and cultural differences between the home country and the country where the target firm is located and political factors (Bernstein et al., 2013). For example, firms engaged in US campaign financing are more attractive to SWFs (Calluzzo et al., 2017). Gnabo et al. (2017) find that Temasek prefers to increase the scale of foreign investment when foreign exchange reserves grow rapidly. The factors considered in SWF decision-making are very complex.
SWF and Corporate ESG Performance
As large government-led investment institutions, SWFs are less constrained by short-term liabilities and liquidity; therefore, they are more capable of promoting sustainable investments and pursuing long-term returns (Wurster and Schlosser, 2021). As investors that accumulate wealth for future generations, SWFs have sufficient motivation for sustainable investments (Liang and Renneboog, 2020). From the perspective of financial performance, ESG can improve firms’ operating performance (Peiris and Evans, 2010; Brogi and Lagasio, 2019) and competitiveness (Frooman, 1997), thus helping attract SWF investments. However, the high cost of improving and maintaining ESG performance may damage a company’s financial performance (Garcia and Orsato, 2020). Some literature believes that there is no significant relationship between corporate SRI, returns, and corporate value (Atan et al., 2018). In addition, Nollet et al. (2016) believe a threshold effect on the impact of ESG performance on firm value. Positive returns can only be obtained when ESG performance reaches a certain level. There are differences between the effects of ESG factors on corporate financial performance in the existing literature. Thus, this study examines whether there is a theoretical mechanism through which ESG factors attract SWF investments by affecting firms’ financial performance.
As an emerging market, Chinese firms may have a large gap with developed economies in corporate governance and market norms (Tanjung, 2021). The disclosure quality of ESG information may also be lower (Patel et al., 2002), reducing SWF’s evaluation of Chinese firms’ ESG performance. We also focus on the change in the ESG performance of Chinese firms in recent years. According to the Bloomberg database, we describe the trend of ESG disclosure average scores of firms in China, Japan, Russia, India, the United Kingdom, and the United States; the results are shown in Figure 1. Figure 1 shows that the ESG disclosure score of Chinese firms has increased rapidly, but there is still a large gap with some developed economies (such as the United Kiingdom). The progress of Chinese firms’ ESG performance has benefitted from the implementation of a series of ESG-related laws. This study also considers whether the promulgation of the Environmental Protection Tax Law impacts the process of SWF evaluating the quality of ESG disclosure.
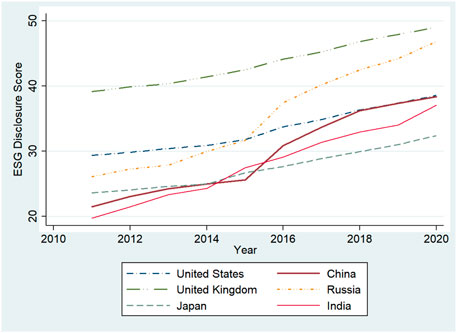
FIGURE 1. ESG disclosure score by countries.
Model, Data Source, and Descriptive Statistics
Model Setting
In line with some empirical analyses of the relationship between SWF investment and corporate financial performance (Gangi et al., 2019; Liang and Renneboog, 2020), this study introduces ordinary least squares models with fixed effects, including province, industry, and year, as shown in Eqs 1, 2. We lag all independent variables by 1 year to deal with endogenous problems.
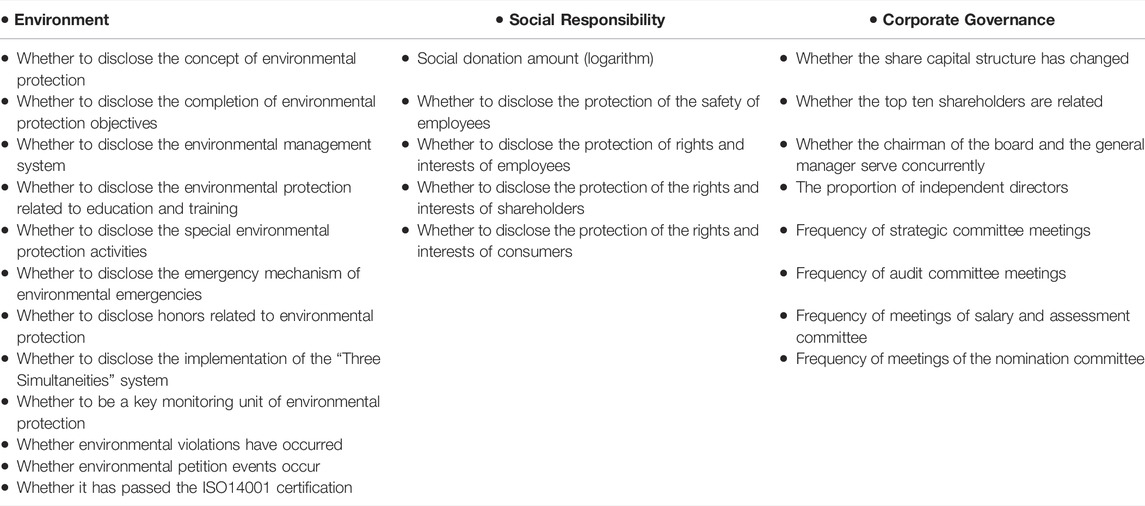
TABLE 1. First principal component of each component.
Data Source
This study’s sample comprises A-share listed companies in China from 2008 to 2020. Except for the dependent variable data from the SWFI, the data of the other variables are from the CSMAR database, and all nominal variables are converted to real ones based on 2008. In addition, we winsorize the continuous variables at the 1% level to reduce the influence of extreme values. We merged these two databases based on the company’s English names. Among the 4,844 enterprises in our sample, 474 had SWF investors. As key independent variables, we refer to Qiu and Yin’s (2019) method and calculate the ESG performance score of each firm using the PCA method. The first principal component of each component score is presented in Table 1. The total ESG score was calculated by summarizing the first principal component of each component. Table 2 provides the descriptive statistics. We use the data imputation method for the price-earnings ratio (PE), beta, and leverage ratio (Lev), including more missing values.

TABLE 2. Descriptive statistics.
Empirical Results
Basic Empirical Results
First, we conducted a panel OLS regression, which considered heteroscedasticity and controlled for the fixed effects of provinces, industries, and years. As shown in Table 3, the first two columns of the regression do not include the control variables. The results showed that improving the ESG total score and each component score significantly attracted sovereign fund investment. However, after adding the control variables, only the coefficient of corporate governance score remains significant. In Table 4, we introduce the method of the dynamic panel system GMM, that is,
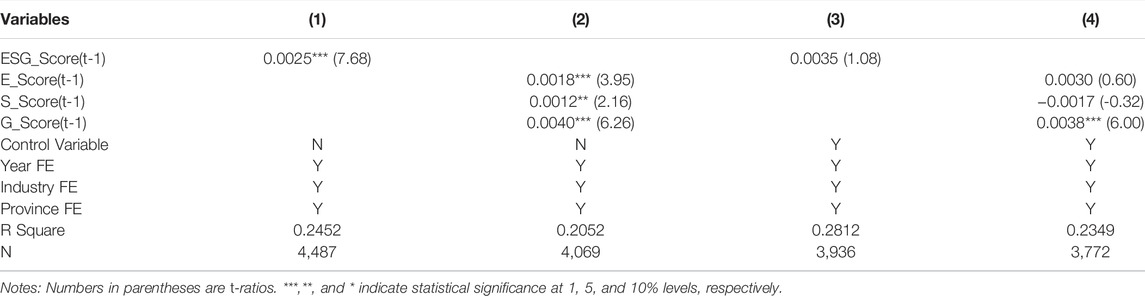
TABLE 3. Results of OLS regression (dependent variable: equity ownership held by SWFs).
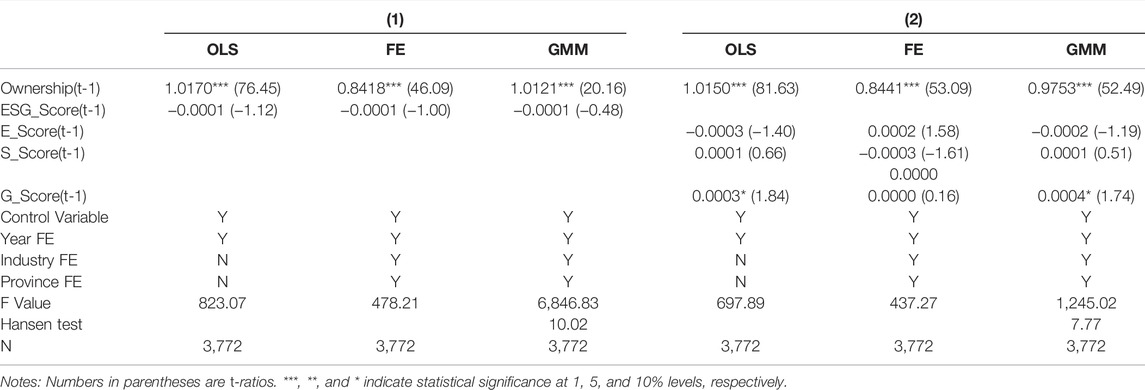
TABLE 4. Results of dynamic panel system GMM regression (dependent variable: equity ownership held by SWFs).
Table 5 shows the results of firms’ overall ESG and component scores under the Heckman two-stage regression. In this model, the probit model is used in the first stage. The dependent variable is a dummy variable that takes the value of 1 if it has an SWF investor; otherwise, it is 0. The difference from the general probit model is that the missing values are included in Heckman’s one-stage regression, and all missing values are regarded as indicating that the company does not have an SWF investor, taking a value of zero. After the one-stage regression, we calculate the inverse Mills ratio (IMR), a variable calculated based on the predicted value of the firms’ investment probability, and use it as the control variable of the two-stage regression to correct the sample selection error issue. The first two columns in Table 5 represent the regression results of the ESG total score, and the last two columns represent the regression results of the component score. We first note that the IMR regression coefficients in the two models are significant, at least at the 10% level, indicating that there is indeed a sample selection error. Thus, the Heckman correction was more efficient. Table 5 shows that ESG performance helps increase the probability of SWFs investment and has a positive relationship with the proportion of SWF investment shares. Similar to the results in Table 4, the effect of corporate governance is more significant than those of environmental and social responsibility. This result is similar to Liang and Rennebog (2020). They found that the ESG factor positively affected attracting SWF investment. However, we found that environmental, social responsibility and corporate governance factors had different effects on attracting SWF investment.
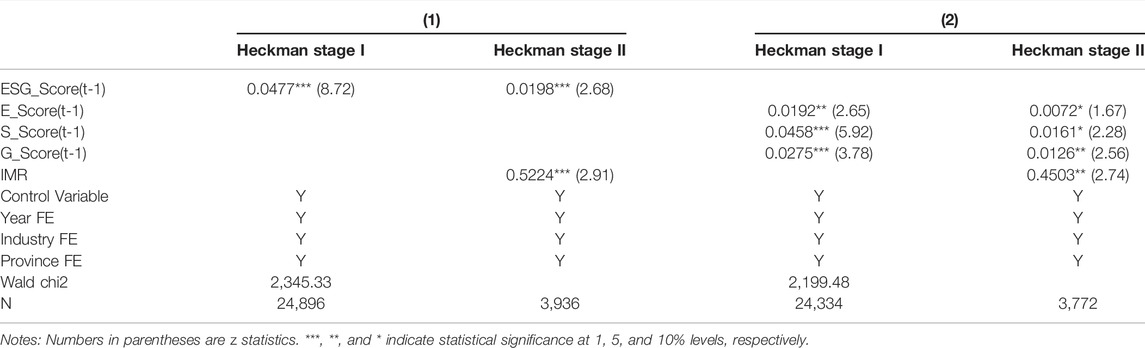
TABLE 5. Heckman two-step regression results.
We must consider whether our model may have endogeneity problems; in particular, some large SWFs may affect or even interfere with the corporate governance of invested firms or promote the target firms to increase investment in environmental and social responsibility to improve their ESG performance (Al Ayoubi and Enjolras, 2021). This indicates that we did not overcome the endogeneity problem caused by reverse causality in our previous study. Previous empirical studies on the factors affecting SWF investment at the micro-level rarely consider the endogeneity problem (Boubakri et al., 2016; Gangi et al., 2019). Liang and Rennebog (2020) chose the difference-in-difference method to overcome the endogeneity problem. One way to deal with endogeneity problems is to use the two-stage least squares of instrumental variables (IVs). We use the average ESG score of the industry to which the firm belongs as an IV. To use IVs in the Heckman two-step regression, we should replace endogenous variables with IVs for one-stage probit regression, calculate the IMR, and then introduce the IMR as a control variable for the IV two-stage regression. As we plan to use IVs to overcome the endogeneity problem, all variables are regressed with the current data during the regression to reduce the loss of sample size. The second column in Table 6 shows that the F-value of the one-stage regression is 50.61, indicating that IV is effective. In contrast, the third column shows that the Heckman two-step method effectively corrects the sample selection error. After overcoming the endogeneity problem through the IV and Heckman two-step methods, we found that the enterprise’s ESG performance attracted SWF investment, further verifying the robustness of our hypothesis. We also conducted an IV regression for each ESG component (Table 7). The first-stage regression results show that each IV has a strong correlation with its corresponding endogenous variables, and the F-values indicate the effectiveness of the IVs. After introducing IVs, we find that corporate governance and environmental factors attract significant SWF investments.
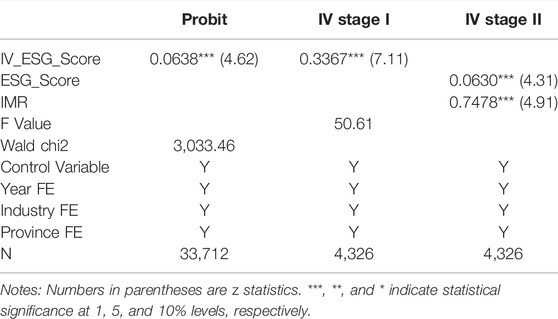
TABLE 6. IV Regression results (ESG overall score).
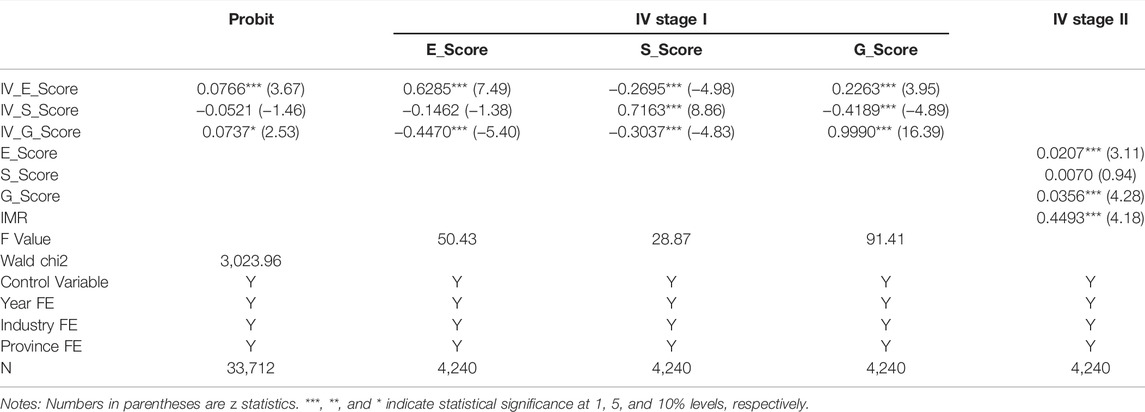
TABLE 7. IV Regression results (each component of ESG).
Mechanism Analysis
Many studies have discussed how ESG performance promotes corporate financial performance and market competitiveness (Frooman, 1997; Deng and Cheng, 2019). In the background, we consider whether ESG attracts SWF investment indirectly by improving firm performance. The method used to identify this theoretical mechanism was to test the mediating effect using the stepwise regression method, as shown in Table 8. We exclude the ROA lag term in columns (1) and (2) and the beta lag term in columns (3) and (4), and then add all variable regressions in columns (5) and (6). By comparing the results of the second stage of the Heckman regression, we find that the coefficient value of the ESG score in column (2) is larger than that in column (6), and the coefficient of ROA is significant at a 5% level, indicating partial mediation and no complete mediation. In addition, we used another return rate2 to replace ROA. This conclusion remains unchanged, thus proving its robustness. In contrast, comparing the ESG score coefficients in columns (4) and (6) shows that ESG performance has a partial mediation effect on risk.
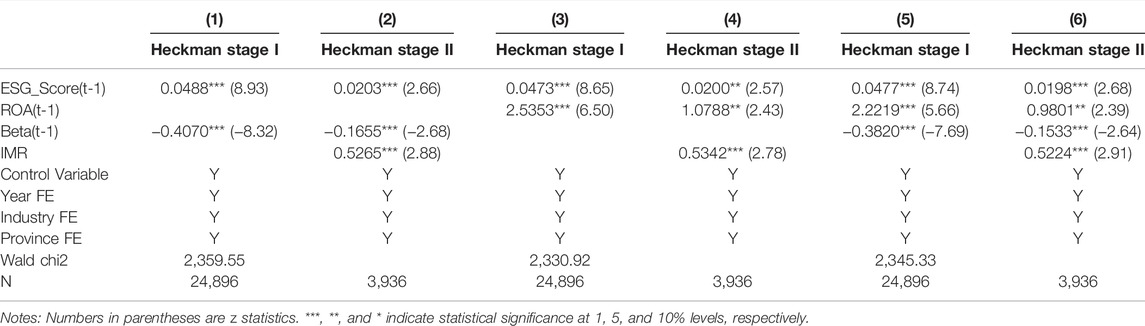
TABLE 8. Mechanism analysis.
On 25 December 2016, the Environmental Protection Tax Law of the People’s Republic of China was adopted by the 25th meeting of the Standing Committee of the 12th National People’s Congress of the People’s Republic of China. The law was first made public for comments in the second half of 2015, passed at the end of 2016, and came into effect on 1 January 2018. The promulgation of this law may help improve the performance of firms and the quality of ESG information disclosure, thus making it more attractive for SWF investing. We analyze this by setting up a dummy variable,
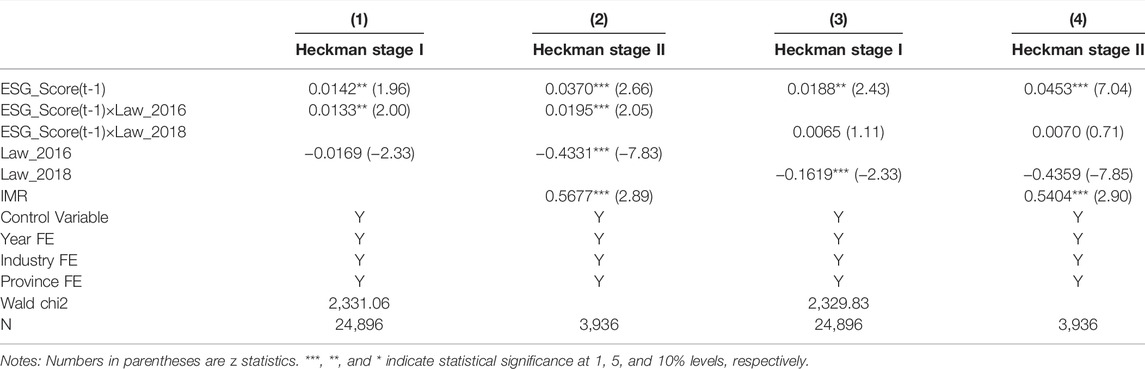
TABLE 9. Effect of the environmental protection tax law.
Conclusion and Discussion
To explore whether enterprises’ ESG performance positively affects SWF investment, we first constructed scoring rules to evaluate enterprises’ ESG performance. Using the samples of Chinese listed enterprises from 2008 to 2020 and the data on SWF investment, we conducted regression analysis through OLS, the Heckman two-step method, and IV-2sls. We find that better ESG performance can attract SWF investment. Specifically, the significance of corporate governance factors is less sensitive to our study’s variable selection and research methods, indicating that corporate governance factors may be more attractive than environmental and social responsibility factors. We overcome the endogeneity problem by consolidating the existing conclusions using the IV method. Finally, we also find that ESG can indirectly win the favor of SWF by improving the return on assets and risk level of enterprises to improve their financial performance and estimate the effect of the Environmental Protection Tax Law, which may improve the quality of ESG disclosure.
The contribution of this study is that, based on Boubakri et al. (2016) and Gangi et al. (2019), we studied how ESG performance attracts SWF investment, enriching micro-level research on the relationship between SWFs and ESG. We consider endogeneity and overcome this problem using instrumental variables. In addition, we attempt to explain the ESG factors that affect the financial performance of enterprises to attract SWF investment through a mechanism test. We explain the investment strategy and asset allocation concept of SWFs. This conclusion also highlights the need for enterprises to improve ESG performance. However, this study’s SWF data has some limitations. It is difficult to identify the stock changes in invested enterprises; therefore, our model has a certain estimation error. In addition, there is room for improvement in our rules when matching across the databases. Finally, it was difficult to analyze the heterogeneity because of the sample size. Specifically, it is of research value to distinguish between the industries of the target enterprises and conduct separate research on each large-scale SWF.
Data Availability Statement
The raw data supporting the conclusion of this article will be made available by the authors, without undue reservation.
Author Contributions
GC conceived and designed the research method; LD conceived and designed the research method with GC and supplied the data; BW analyzed the data, wrote, and finalized the manuscript. All the authors have read and agreed to the published version of the manuscript.
Funding
This work was supported by the Key Research Institutes of Humanities and Social Sciences of the Ministry of Education of China (Grant No. 17JJD790014) and the LiaoNing Revitalization Talents Program (Grant No. XLYC2007202), Asian Studies Problem of Liaoning University (Grant No. Y202111). The remaining errors are our own.
Conflict of Interest
The authors declare that the research was conducted in the absence of any commercial or financial relationships that could be construed as a potential conflict of interest.
Publisher’s Note
All claims expressed in this article are solely those of the authors and do not necessarily represent those of their affiliated organizations, or those of the publisher, the editors and the reviewers. Any product that may be evaluated in this article, or claim that may be made by its manufacturer, is not guaranteed or endorsed by the publisher.
Acknowledgments
The authors thank Jiajun Yuan for providing lab support.
Supplementary Material
The Supplementary Material for this article can be found online at: https://www.frontiersin.org/articles/10.3389/fenvs.2022.935466/full#supplementary-material
Footnotes
1SWFI only counts the specific amount and shares invested by each SWF in a certain year, but does not include the changes in equity held by SWF. Therefore, we add up the shares invested by SWF during the sample period and accumulate them year by year to avoid the impact of the decline in the number of SWF transactions included in SWFI (for example, the number of SWF investments recorded in the database decreased significantly in 2019 and 2020). If this treatment is not carried out, the econometric regression may produce serious errors. In addition, because the first-order difference of explanatory variables will lose a lot of information, we will not consider it.
2Return rate equals (total profit + financial expenses)/average total assets, where average total assets equals (total assets ending balance + total assets ending balance of last year)/2.
References
Al Ayoubi, K., and Enjolras, G. (2021). How Norway's Sovereign Wealth Fund Negative Screening Affects Firms' Value and Behaviour. Bus. Ethics, Environ. & Responsib. 30, 19–37. doi:10.1111/beer.12314
Alhashel, B. (2015). Sovereign Wealth Funds: a Literature Review. J. Econ. Bus. 78, 1–13. doi:10.1016/j.jeconbus.2014.10.001
Amar, J., Lecourt, C., and Kinon, V. (2018). Is the Emergence of New Sovereign Wealth Funds a Fashion Phenomenon? Rev. World Econ. 154, 835–873. doi:10.1007/s10290-018-0319-3
Atan, R., Alam, M. M., Said, J., and Zamri, M. (2018). The Impacts of Environmental, Social, and Governance Factors on Firm Performance. Meq 29, 182–194. doi:10.1108/meq-03-2017-0033
Bernstein, S., Lerner, J., and Schoar, A. (2013). The Investment Strategies of Sovereign Wealth Funds. J. Econ. Perspect. 27, 219–238. doi:10.1257/jep.27.2.219
Boubakri, N., Cosset, J.-C., and Grira, J. (2017). Sovereign Wealth Funds Investment Effects on Target Firms' Competitors. Emerg. Mark. Rev. 30, 96–112. doi:10.1016/j.ememar.2016.09.003
Boubakri, N., Cosset, J.-C., and Grira, J. (2016). Sovereign Wealth Funds Targets Selection: a Comparison with Pension Funds. J. Int. Financial Mark. Institutions Money 42, 60–76. doi:10.1016/j.intfin.2016.01.004
Brogi, M., and Lagasio, V. (2019). Environmental, Social, and Governance and Company Profitability: Are Financial Intermediaries Different? Corp. Soc. Resp. Env. Ma. 26, 576–587. doi:10.1002/csr.1704
Bruton, H. (1998). A Reconsideration of Import Substitution. J. Econ. Lit. 36, 903–936. doi:10.2307/2565125
Calluzzo, P., Nathan Dong, G., and Godsell, D. (2017). Sovereign Wealth Fund Investments and the US Political Process. J. Int. Bus. Stud. 48, 222–243. doi:10.1057/s41267-016-0057-5
Chhaochharia, V., and Laeven, L. (2009). Sovereign Wealth Funds: Their Investment Strategies and Performance [Working Paper]. London: CEPR Discussion Papers. No.DP6959.
Ciarlone, A., and Miceli, V. (2014). Are Sovereign Wealth Funds Contrarian Investors? SSRN J. doi:10.2139/ssrn.2550736
Curzio, A. Q., and Miceli, V. (2011). Sovereign Wealth Funds: A Complete Guide to State-Owned Investment Funds. Hampshire: Harriman: KCLF House.
Deng, X., and Cheng, X. (2019). Can ESG Indices Improve the Enterprises’ Stock Market Performance?—An Empirical Study from China. Sustainability 11, 47–65. doi:10.3390/su11174765
Dewenter, K. L., Han, X., and Malatesta, P. H. (2010). Firm Values and Sovereign Wealth Fund Investments. J. Financial Econ. 98, 256–278. doi:10.1016/j.jfineco.2010.05.006
Eldredge, C. D. (2019). Capability and Need: a Framework for Understanding Why States Create Sovereign Wealth Funds. World Econ. 42, 1495–1519. doi:10.1111/twec.12761
Fernandes, N. (2009). Sovereign Wealth Funds: Investment Choices and Implications Around the World (March 1, 2011). Available at: https://ssrn.com/abstract=1341692 or 10.2139/ssrn.1341692.
Fotak, V., Gao, X., and Megginson, W. L. (2016). A Financial Force to Be Reckoned with? an Overview of Sovereign Wealth Funds. SSRN J. Paper No. 476. doi:10.2139/ssrn.2825928
Frooman, J. (1997). Socially Irresponsible and Illegal Behavior and Shareholder Wealth. Bus. Soc. 36, 221–249. doi:10.1177/000765039703600302
Gangi, F., Meles, A., Mustilli, M., Graziano, D., and Varrone, N. (2019). Do investment Determinants and Effects Vary across Sovereign Wealth Fund Categories? A Firm-Level Analysis. Emerg. Mark. Rev. 38, 438–457. doi:10.1016/j.ememar.2018.12.004
Garcia, A. S., and Orsato, R. J. (2020). Testing the Institutional Difference Hypothesis: a Study about Environmental, Social, Governance, and Financial Performance. Bus. Strat. Env. 29, 3261–3272. doi:10.1002/bse.2570
Gilson, R. J., and Milhaupt, C. J. (2009). Sovereign Wealth Funds and Corporate Governance : a Minimalist Response to the New Mercantilism. ecofi 9, 345–362. doi:10.3406/ecofi.2009.5520
Gnabo, J. Y., Kerkour, M., Lecourt, C., and Raymond, H. (2017). Understanding the Decision-Making Process of Sovereign Wealth Funds: the Case of Temasek. Int. Econ. 152, 91–106. doi:10.1016/j.inteco.2017.06.003
Hofman, P. S., Moon, J., and Wu, B. (2017). Corporate Social Responsibility under Authoritarian Capitalism: Dynamics and Prospects of State-Led and Society-Driven CSR. Bus. Soc. 56, 651–671. doi:10.1177/0007650315623014
Karolyi, G. A., and Liao, R. C. (2017). State Capitalism's Global Reach: Evidence from Foreign Acquisitions by State-Owned Companies. J. Corp. Finance 42, 367–391. doi:10.1016/j.jcorpfin.2016.02.007
Lenihan, A. T. (2014). Sovereign Wealth Funds and the Acquisition of Power. New Polit. Econ. 19, 227–257. doi:10.1080/13563467.2013.779650Available at: http://www.tandfonline.com/loi/cnpe20
Liang, H., and Renneboog, L. (2020). The Global Sustainability Footprint of Sovereign Wealth Funds. Oxf. Rev. Econ. Pol. 36, 380–426. doi:10.1093/oxrep/graa010
Megginson, W. L., Lopez, D., and Malik, A. I. (2021). The Rise of State-Owned Investors: Sovereign Wealth Funds and Public Pension Funds. Annu. Rev. Financ. Econ. 13, 247–270. doi:10.1146/annurev-financial-110420-090352
Nollet, J., Filis, G., and Mitrokostas, E. (2016). Corporate Social Responsibility and Financial Performance: a Non-linear and Disaggregated Approach. Econ. Model. 52, 400–407. doi:10.1016/j.econmod.2015.09.019
Patel, S. A., Balic, A., and Bwakira, L. (2002). Measuring Transparency and Disclosure at Firm-Level in Emerging Markets. Emerg. Mark. Rev. 3 (4), 325–337. doi:10.1016/s1566-0141(02)00040-7
Peiris, D., and Evans, J. (2010). The Relationship between Environmental Social Governance Factors and U.S. Stock Performance. Joi 19, 104–112. doi:10.3905/joi.2010.19.3.104
Qiu, M., and Yin, H. (2019). An Analysis of Enterprises’ Financing Cost with ESG Performance under the Background of Ecological Civilization Construction. J. Quant. Tech. Econ. 3, 108–123. (in Chinese). doi:10.22606/fmr.2019.33002
SWF Institute (2022). Top 100 Largest Sovereign Wealth Fund Rankings by Total Assets. Available at: https://www.swfinstitute.org/fund-rankings/sovereign-wealth-fund (Accessed March 1, 2022).
Tanjung, M. (2021). Can We Expect Contribution from Environmental, Social, Governance Performance to Sustainable Development? Bus. Strat. Dev. 4, 386–398. doi:10.1002/bsd2.165
Keywords: ESG, sovereign wealth funds, corporate finance, panel data, IV-2SLS, China
Citation: Chen G, Wei B and Dai L (2022) Can ESG-Responsible Investing Attract Sovereign Wealth Funds’ Investments? Evidence From Chinese Listed Firms. Front. Environ. Sci. 10:935466. doi: 10.3389/fenvs.2022.935466
Received: 04 May 2022; Accepted: 19 May 2022;
Published: 01 June 2022.
Edited by:
Lu Yang, Shenzhen University, ChinaCopyright © 2022 Chen, Wei and Dai. This is an open-access article distributed under the terms of the Creative Commons Attribution License (CC BY). The use, distribution or reproduction in other forums is permitted, provided the original author(s) and the copyright owner(s) are credited and that the original publication in this journal is cited, in accordance with accepted academic practice. No use, distribution or reproduction is permitted which does not comply with these terms.
*Correspondence: Liyan Dai, dailiyan990@126.com