Aragonite saturation states in estuaries along a climate gradient in the northwestern Gulf of Mexico
- Harte Research Institute for Gulf of Mexico Studies, Texas A&M University-Corpus Christi, Corpus Christi, TX, United States
In the northwestern Gulf of Mexico (nwGOM), the coastal climate shifts abruptly from the humid northeast to the semiarid southwest within a narrow latitudinal range. The climate effect plays an important role in controlling freshwater discharge into the shallow estuaries in this region. In addition to diminishing freshwater runoff down the coast, evaporation also increases substantially. Hence, these estuaries show increasing salinity along the coastline due to the large difference in freshwater inflow balance (river runoff and precipitation minus evaporation and diversion). However, this spatial gradient can be disrupted by intense storm events as a copious amount of precipitation leads to river flooding, which can cause temporary freshening of these systems in extreme cases, in addition to freshwater-induced ephemeral stratification. We examined estuarine water aragonite saturation state (Ωarag) data collected between 2014 and 2018, covering a period of contrasting hydrological conditions, from the initial drought to multiple flooding events, including a brief period that was influenced by a category 4 hurricane. Based on freshwater availability, these estuaries exhibited a diminishing Ωarag fluctuation from the most freshwater enriched Guadalupe Estuary to the most freshwater-starved Nueces Estuary. While Ωarag values were usually much higher than the threshold level (Ωarag = 1), brief freshwater discharge events and subsequent low oxygen levels in the lower water column led to episodic corrosive conditions. Based on previously obtained Ωarag temporal trends and Ωarag values obtained in this study, we estimated the time of emergence (ToE) for Ωarag. Not only did estuaries show decreasing ToE with diminishing freshwater availability but the sub-embayments of individual estuaries that had a less freshwater influence also had shorter ToE. This spatial pattern suggests that planning coastal restoration efforts, especially for shellfish organisms, should emphasize areas with longer ToE.
Introduction
It is widely known that acidification of the aquatic environment caused by both oceanic CO2 uptake and respiration within the water column leads to changes in carbonate equilibria. In the marine system, the increase in total dissolved inorganic carbon (DIC) gives rise to elevated CO2 partial pressure (pCO2) and decreases both pH and carbonate saturation state (Ω) (Feely et al., 2010; Cai et al., 2011; Feely et al., 2018). All these changes could affect marine organisms on their metabolism, reproduction, and a host of other physiological functions (Andersson et al., 2015). Calcifying organisms, because of their need to synthesize calcium carbonate using the mineral base of natural waters, are especially susceptible to the changing carbonate chemistry (Orr et al., 2005; Doney et al., 2009; Spalding et al., 2017; Mcnicholl et al., 2020).
Based on thermodynamics, Ω in seawater is defined as the ratio of the ionic concentration product of Ca2+ and carbonate (CO32-) and the stochiometric solubility constant (Ksp’, Eq. 1):
Using this definition, if Ω < 1, the water is considered undersaturated (or corrosive), which hence favors carbonate dissolution, and if Ω > 1 or the water is supersaturated, carbonate precipitation could potentially occur. The two most common carbonate minerals in the marine environment, that is, aragonite and calcite, have different solubilities, with aragonite being slightly more soluble (Mucci, 1983). Because of the implications for the early life stages of important calcifying species (for example, larval stage oysters, Waldbusser et al., 2014; Waldbusser et al., 2016, food web species (e.g., pteropods, Manno et al., 2017), and shallow water calcifiers (such as corals, Eyre et al., 2018)), aragonite saturation state (Ωarag) is often used to describe the suitability of water carbonate chemistry (Feely et al., 2012; Jiang et al., 2015; Sasse et al., 2015; Davis et al., 2018; Negrete-García et al., 2019).
Ocean acidification has led to a multidecadal decrease in both pH and Ωarag and has caused “shoaling” of saturation horizons, that is, the depths at which Ωarag = 1 have migrated upward as ocean acidification progresses over time (Feely et al., 2012). These changes pose challenges to coral reefs in the tropics and planktonic calcifiers such as pteropods, coastal aquaculture communities, and benthic communities (Juranek et al., 2009; Feely et al., 2012; Hales et al., 2016; Mclaughlin et al., 2018; Ross et al., 2020). In addition to the CO2 level, both temperature and salinity play important roles in regulating Ωarag. First, Ksp’ is a function of temperature, and it increases with decreasing temperature. Along with the increases in CO2 solubility, Ωarag decreases toward higher latitudes in the open ocean (Jiang et al., 2015). In addition, because of the high Ca2+ background concentration in ocean water (∼10.3 mmol kg−1 at salinity 35), mixing caused by precipitation, river runoff, and glacial and sea ice melting also dilute seawater Ca2+. Hence, Ωarag in lower salinity waters is usually low. Therefore, salinity also affects Ωarag based on the definition (Eq. 1). In addition, carbonate chemistry variation in the freshwater endmember could also exert important controls on Ωarag in the low salinity range (Moore-Maley et al., 2018).
Numerous studies have examined both short-term variations and long-term trends of Ωarag in both the open ocean and coastal regions (Gledhill et al., 2008; Franco et al., 2021; Gomez et al., 2021; Siedlecki et al., 2021). In recent years, increasing numbers of investigations have been conducted to understand Ωarag dynamics in estuarine settings, using both field sampling (Feely et al., 2010; Wallace et al., 2014; Mccutcheon et al., 2019) and numerical methods (Da et al., 2021). Nevertheless, given the diversity of estuarine environments, knowledge of estuarine Ωarag remains limited. Ωarag in mixing-dominated estuaries can often be estimated using endmember mixing models (Moore-Maley et al., 2018; Simpson et al., 2022). However, there are also estuaries where freshwater discharge is smaller relative to the sizes of the receiving water bodies, and water residence time can be further prolonged by the sluggish exchange with the coastal ocean due to the presence of physical barriers. In this case, water chemistry can be modified further by evaporation and biogeochemical processes. Many of these estuaries are important habitats for ecologically and economically important species including shellfish. Hence, studying Ωarag in this type of environment is important given that the response of these estuaries to changes in hydrological conditions may be significantly longer than those that have more efficient exchange with the coastal ocean (Yáñez-Arancibia and Day, 2004; Kim et al., 2014; Bishop et al., 2017).
In the northwestern Gulf of Mexico (nwGOM), there are seven major estuaries that lie along a climate transition zone from northeast to southwest: Sabine-Neches Estuary (SNE), Trinity-San Jacinto Estuary (TSJE), Lavaca-Colorado Estuary (LCE), Guadalupe Estuary (GE), Mission-Aransas Estuary (MAE), Nueces Estuary (NE), and Laguna Madre (LM) (Montagna et al., 2011b). These microtidal estuaries have similar geomorphic structures and physiograph (Montagna et al., 2007) with depths ranging from 0.5 to 2.5 m (Montagna et al., 2013), and they are separated from the Gulf of Mexico by barrier islands and peninsulas. Water exchange with the coastal ocean usually takes place through narrow channels and passages. Along this narrow latitudinal gradient, freshwater inflow into these estuaries decreases by a factor of two, yet the freshwater inflow balance, that is, freshwater inputs minus outputs, decreases by two orders of magnitude (Montagna et al., 2011a). Hence, these estuaries exhibit a general increase in both residence time and average salinity from north to south from a few weeks to over a year (Solis and Powell, 1999). In addition, hydrological conditions in this region have varied substantially as a result of broader climate patterns (Tolan, 2007), and extreme events (flooding caused by tropical storms and hurricanes) can result in nearly complete, albeit episodic, freshening of these estuaries (Pollack et al., 2011; Du and Park, 2019; Walker et al., 2020).
Most of these estuaries, with the exception of NE and LM to the southern end, are important habitats for commercially important shellfish species, for example, blue crab, shrimps, and eastern oysters (Tunnell, 2017). However, large freshwater discharge events driven by hurricanes and storms have caused a significant decrease in the abundance of oysters (Pollack et al., 2011; Du et al., 2021). These systems experienced severe drought in the earlier portion of the study period and went through multiple large freshwater discharge events (Yao et al., 2022). To better understand these ecosystems that host this important species and the habitats that they create, we examined a previously poorly studied water chemistry parameter, Ωarag, and other water quality data collected in four mid-coast estuaries in recent years. Then, using multidecadal change rates of Ωarag from a prior study (Mccutcheon and Hu, 2022), we also explored timescales beyond which Ωarag change will exceed its natural variability.
Materials and methods
Water column sampling was conducted in four nwGOM estuaries (LCE, GE, MAE, and NE, Figure 1) during multiple field expeditions (Table 1) in 2014–2018. In 2017, category 4 Hurricane Harvey made landfall in this studied area, and the total rainfall was as much as 152 cm in some areas (Walker et al., 2020). River discharge data were obtained from USGS streamflow gages (#08162000 for Colorado, #08164000 for Lavaca, #08188810 for Guadalupe, #08189500 for Mission, #08189700 for Aransas, and #08211500 for Nueces, Figure 1).
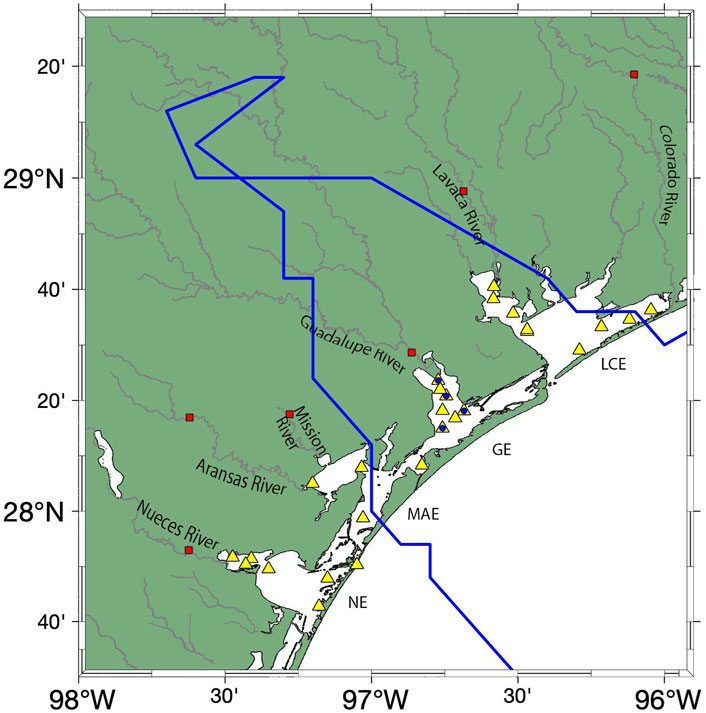
FIGURE 1. Estuarine sampling stations (yellow triangles). It is to be noted that the blue circles in the Guadalupe Estuary are the seasonal sampling stations. USGS streamflow gages are shown in red squares. The blue line presents the track of Hurricane Harvey in August 2017.
Water sampling and analytical methods were detailed in our previous studies (Yao and Hu, 2017; Mccutcheon et al., 2021). Briefly, water column salinity, temperature, and dissolved oxygen (DO) were measured using a calibrated multisonde. Both surface (within 0.5 m below surface) and bottom (within 0.5 m above sediment) water samples for carbonate chemistry analysis were taken using a van Dorn horizontal water sampler into 250 borosilicate bottles and preserved using 100 µL of saturated HgCl2. The bottles were sealed using Apiezon® grease, and the stoppers were secured using rubber bands and hose clamps, following the best practice in Dickson et al. (2007). Then, 20-ml scintillation vials were used for Ca2+ sample collection without preservation. All water samples were stored at 4°C in the dark until analysis, typically within 2 months of sample collection.
Total dissolved inorganic carbon (DIC) was analyzed using infrared detection (AS-C3, Apollo SciTech Inc.), and total alkalinity (TA) was analyzed using open-cell Gran titration (AS-ALK2, Apollo SciTech). Certified reference materials or CRMs (Dickson et al., 2003) were used throughout both TA and DIC analyses to ensure data quality. We used various approaches to measure pH. For samples prior to 28 September 2017 with salinity ≥20, we used a spectrophotometric method with purified m-cresol purple (mCP) (precision of ±0.0004, Liu et al., 2011); then, a calibrated Ross Orion high precision pH electrode was used to measure pH for samples with salinity less than 20 (precision ±0.01). From 28 September 2017, all pH samples were measured using the spectrophotometric method, and pH for samples with salinity <20 was calculated using the updated equation in Douglas and Byrne (2017), which covers a wider salinity range than that in Liu et al. (2011). Ca2+ concentration ([Ca2+]) was titrated using ethylene glycol-bis(β-aminoethyl ether)-N,N,N′,N′-tetraacetic acid (EGTA) (Kanamori and Ikegami, 1980) with a precision of 0.2%, and a Metrohm® calcium ion-selective electrode was used for endpoint detection on a Titrando 888 automatic titrator. Salinity was measured using a calibrated benchtop salinometer.
For chlorophyll-a (Chl-a) sampling, water samples were filtered using GF/F filters and Chl-a was extracted using either 95% methanol (LCE, GE, and NE, Montagna et al., 2018) or 90% acetone (MAE, Mooney and Mcclelland, 2012). Chl-a concentration was determined using a Turner Trilogy fluorometer. Nutrient concentration in these estuaries was also measured following the techniques in Montagna et al. (2018) (phosphate, nitrate + nitrite or NOx, and silicate for LCE, GE, and NE) and Mooney and Mcclelland (2012) for MAE (all macronutrients except silicate). All concentrations were reported in mass-based units, assuming the lab temperature was 22°C.
The Ωarag was calculated using pH and DIC as input variables because of the likely presence of non-carbonate species that may contribute to alkalinity (Yao and Hu, 2017). The calculation was carried out using the MATLAB version of the program CO2SYS (Van Heuven et al., 2011). The dissociation constants of carbonic acid were from Waters et al. (2014), bisulfate dissociation constant from Dickson et al. (1990), and borate and salinity relationship from Lee et al. (2010) were used in the speciation calculations. Measured [Ca2+] and the values obtained from the [Ca2+] vs. salinity regression (for samples without [Ca2+] data) from each estuary were used to correct Ωarag. Because the stoichiometric solubility constant of aragonite is only valid for salinity 5–44 (Mucci, 1983), calculated Ωarag values from samples that had a salinity lower than 5 were excluded from the data analysis. The uncertainty for the calculated Ωarag was ±0.18 using the error propagation approach in Orr et al. (2018), and the two different pH analytical approaches (potentiometric and spectrophotometric) yielded slightly different Ωarag uncertainties (∼0.01).
To better explore the correlation between the carbonate systems and environmental conditions, principal component analysis (PCA) was performed for all variables. Because of the different sampling frequencies (biweekly to monthly in MAE vs. seasonal in all other estuaries) and numbers of sampling stations in these estuaries, average data of sampled months for each estuary was used in this analysis. Then, all variables were log transformed using ln (X+1) after checking for normality and homoscedasticity, except the already logarithmically expressed parameter pH. Then, all variables were standardized with a normal distribution with a mean of 0 and a variance of 1 to ensure the same scale before PCA. The results were presented graphically as vector plots with the major dimensionalities and length representing the relationship and weight of the principal components. PCA was conducted in R studio based on package “factoextra” (Kassambara and Mundt, 2020). To further understand its spatiotemporal pattern, individual PCAs were performed for monthly data that was grouped by location, year, and season (e.g., March–May are used as spring), respectively.
In climate and ocean studies, the term “time of emergence” has been frequently used to describe the timescale for a secular trend to appear in time-series data (Hawkins and Sutton, 2012; Sutton et al., 2019; Turk et al., 2019). In a prior study, Mccutcheon and Hu (2022) calculated temporal trends of Ωarag in nwGOM estuaries using water chemistry data collected by the Texas Commission on Environmental Quality (TCEQ) that dated back to the 1970s. Based on Ωarag values obtained in this study, we explored the time scales for these trends to emerge for both secondary and primary bays of each estuary using Eq. 2.
Noise represents natural variability or standard deviation of the observations; N is an arbitrarily chosen integer and 2 is often used (Sutton et al., 2019).
Results
Hydrological conditions
The six rivers that discharge into the studied estuaries showed large spatial and temporal variations. The Colorado River had the largest annual discharge on average (2.83 × 10⁹ m3 yr−1) during the study period (2014–2018), more than 100 times higher than that of the Aransas River (2.12 × 10⁷ m3 yr−1). The three larger rivers (Colorado, Lavaca, and Guadalupe) experienced extremely low discharge during the height of a dry period (August–September of 2014). On the other hand, the three southernmost rivers (Aransas, Mission, and Nueces) had nearly zero discharge most of the time although episodic precipitation events often led to ephemeral pulses of freshwater (Figure 2). Regional flooding events have caused widespread increases in the discharge during the period of May–June 2015, when the three southern rivers exhibited substantial increases from the baseflow conditions, so did the northern rivers. In comparison, Hurricane Harvey caused discharge increases that were more conspicuous in the three northern rivers and, to a less extent, the Mission River, as it sits near the center of the storm path. Neither Aransas nor Nueces rivers experienced significant hurricane-induced flooding.
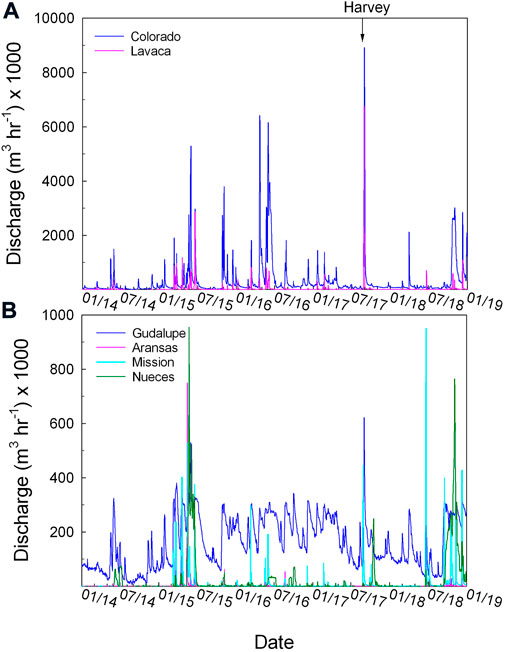
FIGURE 2. River discharge during the period of 2014–2018. The arrow points to the date of Hurricane Harvey landfall near San Jose Island, Texas, at the southern end of the Mission-Aransas Estuary. The Lavaca and Colorado rivers empty into LCE, the Guadalupe River empties into GE, the Mission and Aransas rivers empty into MAE, and the Nueces River empties into NE. Lavaca and Colorado rivers (A) and all four other rivers (B) are separately plotted to show the large differences in their discharge (note the vertical scales).
Salinity in all estuaries showed large swings during the study period with little stratification. Following the initial drought in 2014, salinity had multiple decreases across the entire coastal area (mid 2015 and 2016, post-Harvey in 2017, and late 2018). Overall salinity of these estuaries ranged from 16.4 ± 8.3 in GE to 30.6 ± 4.9 in NE (Table 2; Figure 3). Despite the smaller overall freshwater input into GE compared to LCE, its salinity values were the lowest. During most of the sampling times, little water column stratification was observed in these shallow estuaries (average depth 1–2 m other than the Aransas Ship Channel station, ∼6 m) except during the few flooding events including the short period (∼1 month) after Hurricane Harvey (Walker et al., 2020). Based on the proximity to freshwater sources, each estuary can be divided into a primary bay that is connected to coastal water and one or two secondary bays that directly receive freshwater. As a result, salinity in primary bays was often greater than that in secondary bays, except in MAE, during the initial drought period when the secondary bays (Copano and Mesquite bays) were saltier than the primary bay (Aransas Bay) (Hu et al., 2015).
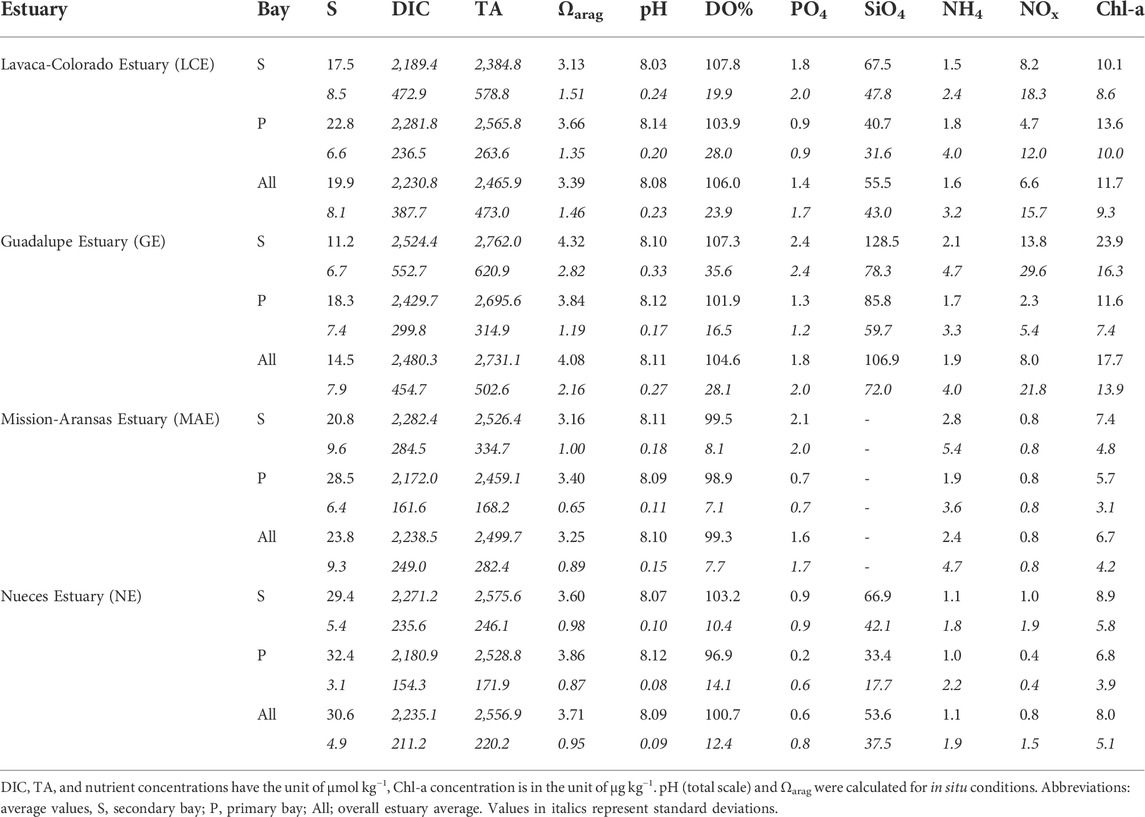
TABLE 2. Mean and standard deviations of measured water chemistry variables in the four studied nwGOM estuaries during 2014-2018.
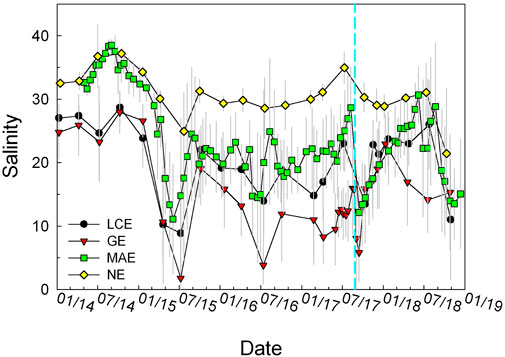
FIGURE 3. Salinity time series in the four studied estuaries during 2014–2018. These values are averages of all data from these stations as stratification occurred infrequently.
Nutrients and Chl-a
While phosphate, silicate (except MAE has no data), and ammonium had relatively small variations across these estuaries, average NOx (NO3 and NO2) concentrations were higher by 6–8 times in LCE and GE than in MAE and NE, with larger variations as well (Table 2). Chl-a concentrations were also 2 to 3 higher in LCE and GE than in MAE and NE, with higher temporal variations. In both LCE and GE, the secondary bays generally had higher nutrient levels than the primary bays although this was not necessarily true for Chl-a. In comparison, the concentration differences between secondary and primary bays were much less for MAE and NE (Table 2).
Carbonate chemistry
Average TA and DIC concentrations in these estuaries (2,466–2,731 and 2,231–2,480 μmol kg−1, respectively, Table 2) were higher than the Gulf of Mexico surface water (Hu et al., 2018). GE had the highest values of all four estuaries on average. The values in the two northern estuaries (LCE and GE) had larger variations than in the two southern estuaries (MAE and NE). LCE was the only estuary that had lower TA and DIC levels in its secondary bay than in the primary bay, and all others had higher TA and DIC levels in the secondary bays despite their lower salinity (Table 2). In addition, these estuaries also had different TA and DIC vs. salinity relationships (Figures 4, 5). LCE and GE had varying freshwater endmember concentrations with a range of ∼1,000 μmol kg−1. Although GE and NE both had higher freshwater endmember values than others, most NE data points were clustered at a salinity greater than 25. In the mid-salinity range, apparent TA and DIC enrichment appeared, especially in LCE and MAE. At high salinity conditions (>36), TA and DIC in MAE and NE both showed noticeable depletion (up to a few hundred μmol kg−1) compared to what would be expected from the evaporation of the ocean endmember (Figures 4, 5).
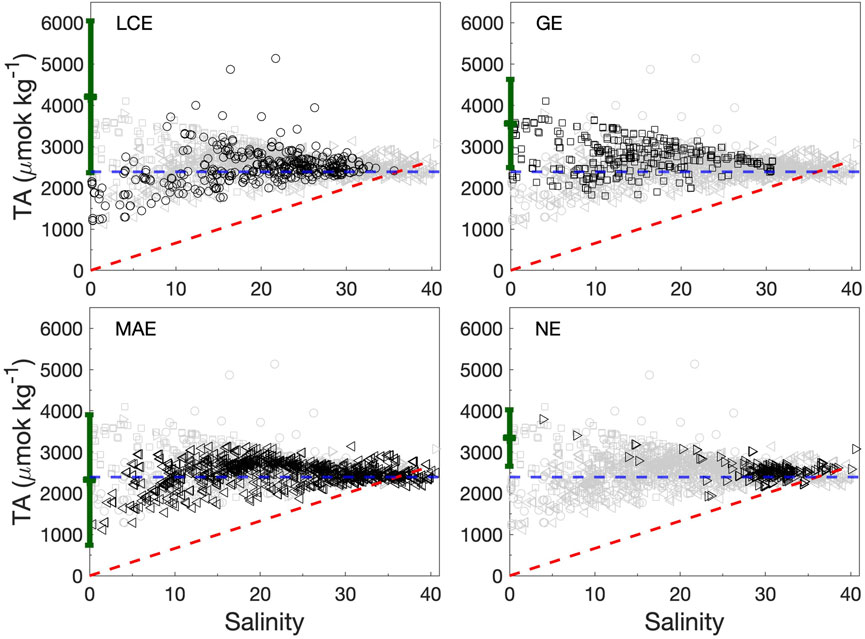
FIGURE 4. TA vs. salinity in the four studied estuaries during 2014–2018. Data from each estuary are shown in black symbols against the entire dataset (gray). The green error bar in each panel represents the river endmember value (±1 standard deviation) for the corresponding estuary (Yao et al., 2022). The horizontal dashed line (blue) represents the open ocean TA value (2,390 μmol kg−1 at salinity 36) (Hu et al., 2018). The red dashed line represents the precipitation-evaporation line based on the ocean endmember value.
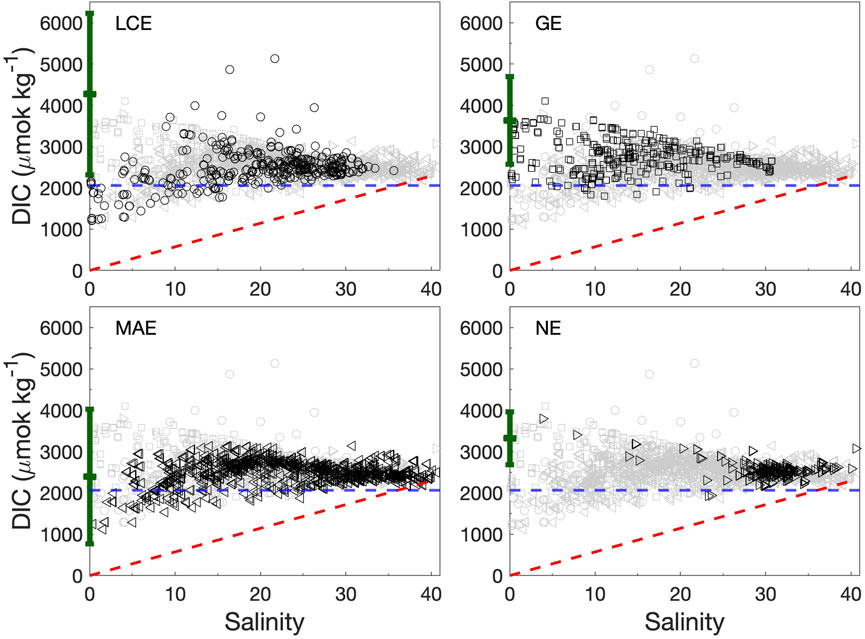
FIGURE 5. DIC vs. salinity in the four studied estuaries during 2014–2018. Data from each panel are shown in black symbols against the entire dataset (gray). The green error bar in each panel represents the river endmember value (±1 standard deviation) for the corresponding estuary (Yao et al., 2022). The horizontal dashed line (blue) represents the open ocean TA value (2060 μmol kg−1 at salinity 36) (Hu et al., 2018). The red dashed line represents the precipitation-evaporation line based on the ocean endmember value.
[Ca2+] exhibited excellent linear relationships with salinity in all estuaries. The intercepts of the linear regression between [Ca2+] and salinity in these four estuaries were 0.67 (LCE), 0.99 (GE), 0.55 (MAE), and 1.16 mmol kg−1 (NE) (Figure 6).
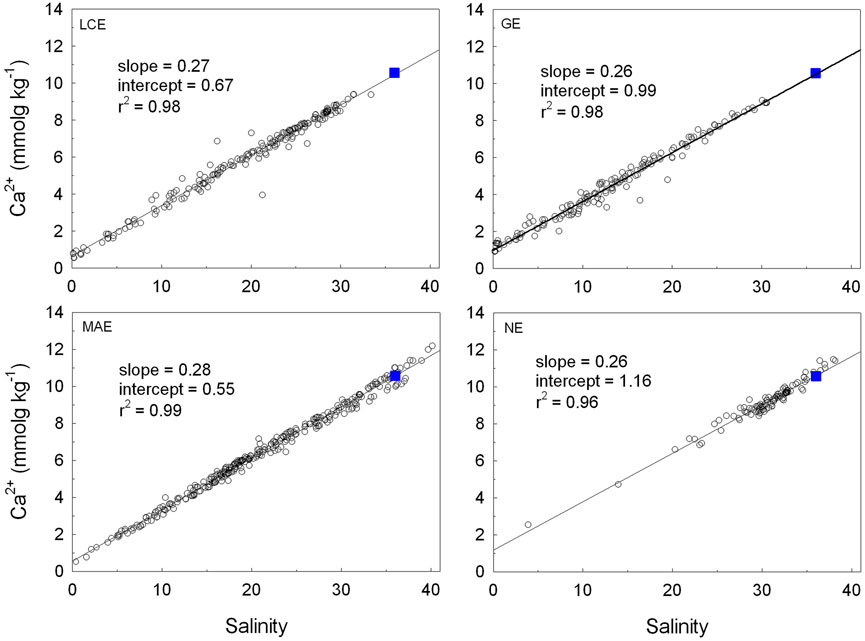
FIGURE 6. Linear regression between estuarine [Ca2+] and salinity in the four studied nwGOM estuaries between 2014 and 2018. The blue square in each panel represents seawater condition (10.57 mmol kg−1 at salinity 36).
Similar to TA and DIC, both pH and Ωarag were also the highest in GE (average 8.11 and 4.08, respectively), and both LCE and GE had greater variations than MAE and NE as well (Figure 7). Large freshwater discharge events were usually accompanied by significant reductions in both pH and Ωarag (Figure 7). However, reductions of pH/Ωarag and salinity were not always synchronized. For example, during the end of the extremely dry period in mid-2015, both pH and Ωarag reached their minimum values before the maximum freshening of these estuaries when the lowest salinity was reached (Figure 7).
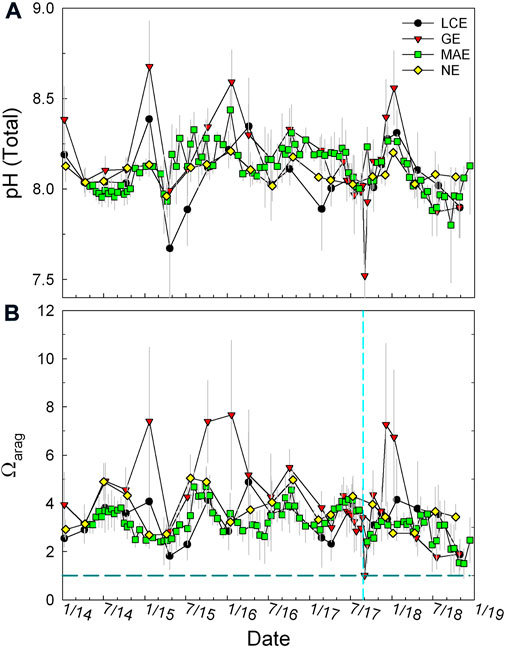
FIGURE 7. pH on a total scale (A) and Ωarag (B) in the four studied estuaries during 2014–2018. Note in calculating Ωarag, samples with S < 5 were not included as the solubility constant of aragonite (Mucci, 1983) is valid for salinity 5–44. These values are averages of all data from these stations as stratification occurred infrequently.
The first two principal components PC1 and PC2 explained 34.2 and 26.3% of the data variability, respectively, and together explained 60.54% of the variance (Figure 8A). PC1 is correlated with salinity, pH, pCO2, ΩAr, ΩCa, and
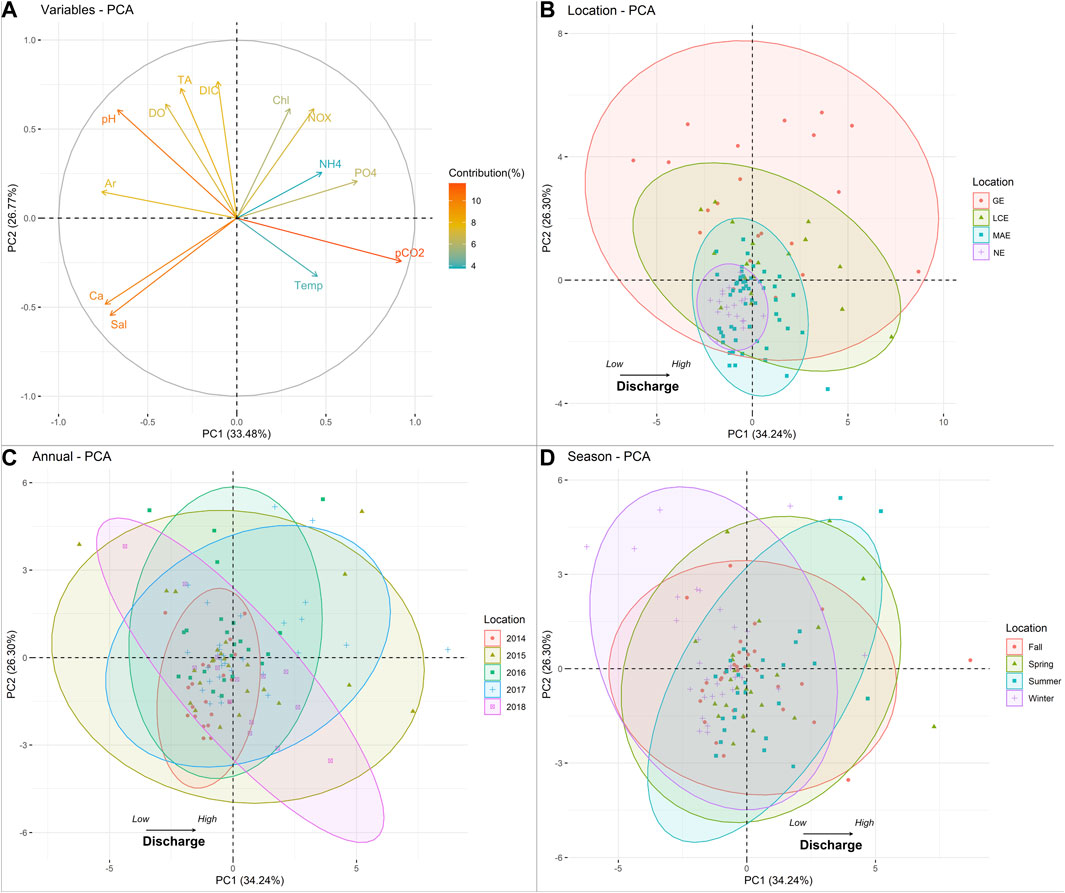
FIGURE 8. PCA analysis of water chemistry in nwGOM estuaries. (A) Variables loads for PC1 and PC2; (B) principal component of monthly variance between estuaries; (C) principal component of monthly variance between sampling years; (D) principal component of monthly variance between seasons. Abbreviations: water temperature (Temp), salinity (Sal), chlorophyll a (Chl), dissolved oxygen percentage (pDO), Ar (ΩArag), Ca ([Ca2+]), ammonium (NH4), nitrate and nitrite (NOX), and orthophosphate (PO4).
According to individual PCAs, there is a clear spatial pattern of water chemistry in nwGOM estuaries. That is the decreasing data variance from GE to NE (Figure 8B), which coincides with their corresponding water discharge levels (Figure 2). For example, the high discharge level is reflected by the lowest salinity (Figure 3), causing the largest salinity range in GE. In contrast, the carbonate system in NE had the least variation because of its lowest river discharge and hence highest salinity level. Similarly, at the end of a 4-year drought, all variables in 2014 were found to have changed the least (Figure 8C), while the largest hydrological conditions shift occurred in 2015 when the first major storm came after the extreme drought. This change was even greater than in 2017 (the hurricane year), but the hydrological condition change mostly occurred in GE and LCE (Patrick et al., 2020; Walker et al., 2020). Nevertheless, the metabolic effect on water chemistry is similar between 2015 and 2018, as their scores are comparable in PC2. On the other hand, seasonal water variance is not distinct as their data ranges were mostly overlapping (Figure 8D), which can be attributed to the mild weather in this subtropical region, and temperature contributes less significantly to both PC1 and PC2 scores.
Time of emergence
All secondary bays, except that in the most freshwater-starved NE, had longer ToEs than their respective primary bays (Table 3). For the primary bays of MAE and LCE as well as the entire NE, the years that have elapsed (i.e., the period of datasets that were examined previously till 2015) have taken nearly 1/3–1/2 of the ToEs, indicating that the trends may merge from the variability during 2060–2080 if these trends were maintained the same. The secondary bay of LCE, the entire GE, and the secondary bays of MAE all had ToE on the order of more than 100 years.
Discussion
This study period (2014–2018) covered an initial extreme drought (before mid-2015), followed by several regional flooding events and subsequent flood relaxation periods that affected the entire nwGOM coast. In particular, LCE and GE were significantly affected by Hurricane Harvey due to hydrological condition changes (Yao et al., 2022). The large changes in salinity, from hypersaline to brief, yet nearly complete freshening of the estuarine waters, along with flood-induced productivity change as well as ephemeral hypoxia (%DO saturation decreases to less than 20%) in limited areas within some of the estuaries, provided an opportunity to examine the “baseline” and temporal changes in Ωarag. Understanding Ωarag dynamics under these contrasting conditions in the context of multidecadal Ωarag trends found in these estuaries (Mccutcheon and Hu, 2022) is potentially important for managing and restoring economically valuable and ecologically important calcifying species such as the eastern oysters.
Non-mixing controlled estuarine total alkalinity and dissolved inorganic carbon
In mixing-dominated estuaries, TA and DIC often exhibit linear relationships with salinity (Wong, 1979; Cooley et al., 2007; Jiang et al., 2008). Given such linear relationships, Ωarag dynamics and its long-term changes can be calculated using endmember concentrations along with known biogeochemical reactions (Moore-Maley et al., 2018; Simpson et al., 2022). However, TA and DIC in nwGOM estuaries are influenced by more factors than simple water column processes. These factors include evaporation, carbonate precipitation and dissolution, and perhaps more importantly, sedimentary processes, in addition to mixing, primary production, and respiration which are commonly encountered in typical water column studies. For example, evaporation-induced hypersalinity is often associated with TA depletion compared with the ocean endmember (Hu et al., 2015). Observations in both MAE and NE also revealed similar patterns at high salinity (Figure 4), indicating TA loss through reactions during prolonged water residence (both carbonate precipitation and sediment redox reactions, Hu, unpublished data). Because pCO2 varies within a narrower range (∼100 µatm) during high salinity periods (Yao and Hu, 2017), this relative depletion of TA also corresponded with DIC deficiency relative to ocean water as well (Figure 5). In the mid-salinity range, however, apparent enrichment of both TA and DIC also appeared (Figures 4, 5), which may be a combination of both evaporation and benthic contribution (Hu et al., 2015). Varying river endmember values at different hydrological conditions is another important factor that controls TA and DIC distribution along the salinity gradient (Cifuentes et al., 1990).
Nevertheless, the non-conservative behavior of TA and DIC can be attributed to the shallow water depths and long water residence time in these estuaries, conditions suitable for water-sediment interactions, especially during periods of low river discharge (Figure 2). Moreover, the poorly constrained groundwater input adds additional complexity to unraveling estuarine TA and DIC dynamics in these estuaries (Murgulet et al., 2018). Non-conservative TA and DIC behaviors are also observed in other small river estuaries (Oliveira et al., 2017; Stokowski et al., 2020).
Controls on estuarine Ωarag
According to the definition, Ωarag is, to a large extent, controlled by carbonate system speciation in the oceanic environment. In river estuaries and areas influenced by melting ice where freshwater is prevalent (Reisdorph and Mathis, 2014; Beckwith et al., 2019), [Ca2+] vs. salinity often have a linear relationship. The calculated intercepts from the [Ca2+] vs. salinity regressions (Figure 6) corresponded to different drainage basin characteristics (for example, karst feature for the Guadalupe and Nueces river basins; increasing evaporation to the south) and also temporal variations that reflect either direct river input (high freshwater [Ca2+]) or dilution by localized precipitation (low freshwater [Ca2+], Hu et al., 2020). Nevertheless, [Ca2+] decreases by a factor of 4 (GE and NE) to 5 (LCE and MAE) when salinity changes from 35 to 5. At the same time, the solubility constant of aragonite (Ksp) at salinity 35 is ∼7.7 times the value when salinity is 5 when we chose the average temperature of 23.6°C across all sampling times and locations. Hence, the dilution effect (due to [Ca2+] decrease with salinity) can be canceled out by the decrease in solubility from the perspective of Ωarag change. As a result, the large Ωarag variations in these estuaries can be primarily attributed to changing [CO32-]. In fact, the TA/DIC ratio was the single most important factor that explained [CO32-] variations across the salinity gradient (≥5 as the carbonic acid dissociation constants are valid for salinity 5–45, Waters et al., 2014) in all four estuaries (Figure 9), explaining ∼80% of [CO32-] variations in LCE and GE and ∼70% in MAE and NE. In addition, low salinity waters usually had a low TA/DIC ratio, especially in LCE, GE, and MAE (Figure 9), indicating high freshwater pCO2 (Jiang et al., 2008). However, the highest [CO32-] appeared in the mid-salinity range (LCE and GE), corresponding to the highest TA/DIC ratios, indicating high primary productivity (see below). In comparison, temperature showed no relationship with [CO32-] in LCE but explained 16, 6, and 31% of [CO32-] changes in GE, MAE, and NE, respectively (data not shown). The slopes for both MAE and NE that had less freshwater input were positive, consistent with the open ocean (Jiang et al., 2015). However, the slope for GE was negative. Clearly, hydrological condition changes and biogeochemical processes outweighed the temperature effect on [CO32-] in these estuaries.
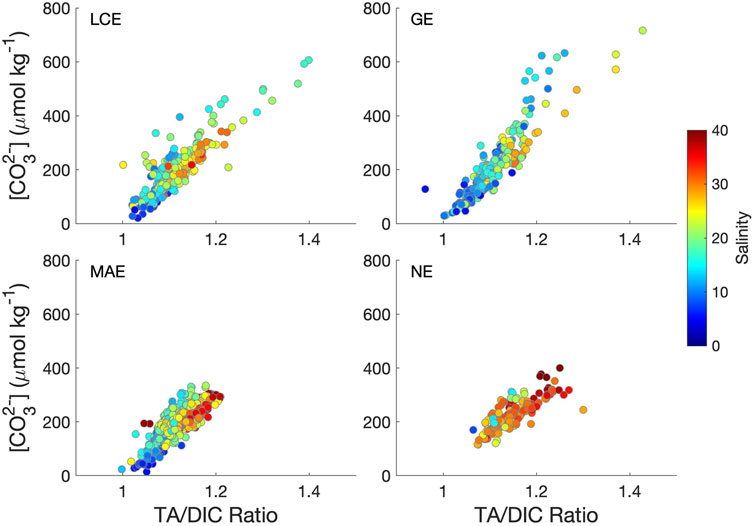
FIGURE 9. Carbonate ion concentration vs. TA/DIC ratio in the four studied nwGOM estuaries during 2014–2018. Samples with S < 5 were not included as the carbonate dissociation constants are valid for salinity 5–45 (Waters et al., 2014). The r2 values for these regressions are 0.76 (LCE), 0.82 (GE), 0.68 (MAE), and 0.69 (NE).
Along the salinity gradients, most estuarine waters with salinity greater than 30 had relatively confined Ωarag values (2–5) compared to the entire dataset, although the values in both polyhaline (salinity 16–30) and mesohaline (5–16) waters had the largest variations (Figure 10A). High Ωarag values often coincided with high pH values as the extreme pH value reached near 9 (Figure 10A). In many estuarine and coastal waters, high pH values are often observed along with high primary productivity sustained by abundant nutrients (Guo et al., 2012; Nixon et al., 2015). High pH levels are also observed in seagrass bed-influenced estuarine waters in Corpus Christi Bay (Mccutcheon et al., 2019) and Chesapeake Bay (Su et al., 2020), where the coupling between CO2 consumption and pH increase is present. Both LCE and GE exhibited greater variance in pH (Table 2) and Ωarag (Table 2; Figure 10A) compared with MAE and NE. While primary production driven by river nutrient input was certainly responsible for some of the high Ωarag values because they did correspond to greater concentrations of Chl-a, although high Chl-a was not an a priori factor for high Ωarag waters, especially in low salinity waters (Figure 10B, also see Figure 8A for the PCA results).
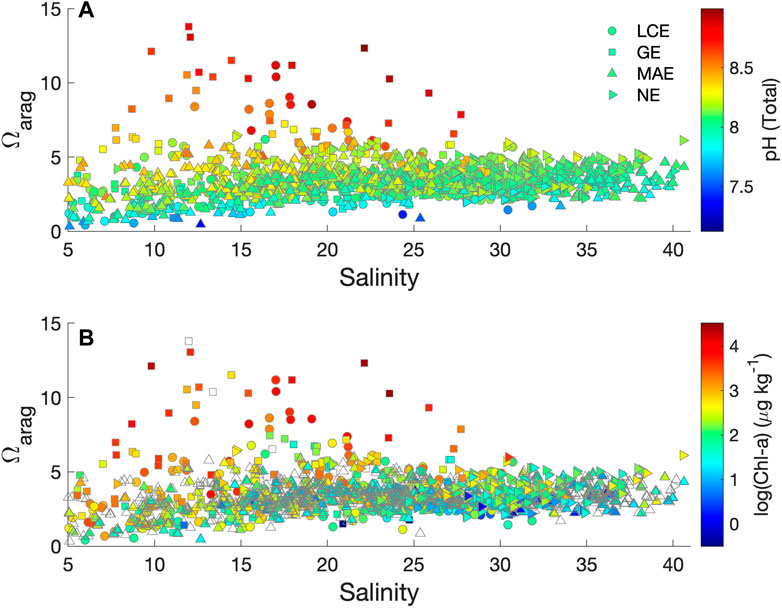
FIGURE 10. Ωarag vs. salinity and pH or chlorophyll-a in the four studied nwGOM estuaries. Color infill represents pH. (A) and Chlorophyll-a concentration in log scale (B). Open symbols represent no chlorophyll data.
Another important reason for the high Ωarag values in mid-salinity waters (<30) was high river TA levels, especially in the Guadalupe River that empties into GE. In fact, both the high intercept of [Ca2+] vs. salinity regression (0.99 mmol kg−1, Figure 6) and the overall highest estuarine TA levels in GE yet the lowest average salinity among all studied estuaries (Table 2) point to the mineral-rich freshwater source, that is, the Guadalupe River, which is joined by the San Antonio River at its upper stream (cf. Edward Aquifer, Woodruff and Abbott, 1979). It is to be noted that even though the intercept of the [Ca2+] vs. salinity regression in NE was slightly higher (1.16 mmol kg−1, Figure 6), the high average salinity in NE suggests that freshwater discharge itself did not have strong control on estuarine Ωarag (Figures 4–6). The largest freshwater influence in GE is expected given its highest freshwater discharge to volume ratio among all studied estuaries (Evans et al., 2012; Montagna et al., 2018).
A decrease in DO concentration is linked with respiration-produced DIC, which is known to cause reductions in estuarine water pH and carbonate saturation (Feely et al., 2010; Wallace et al., 2014; Ianson et al., 2016). Except in estuaries with persistent hypoxia (Mucci et al., 2011), the DO influence is usually relatively short-lived, that is, from diurnal to seasonal. Low oxygen conditions in the studied estuaries have been linked to two hydrological extremes that both contributed to water column stratification. In NE, where freshwater discharge is the lowest, hypoxia has been long observed in the southeast corner of Corpus Christi Bay (Ritter and Montagna, 1999; Applebaum et al., 2005). Mccutcheon et al. (2019) observed hypoxic conditions associated with the density flow of hypersaline water to southeastern Corpus Christi Bay from the highly evaporative Laguna Madre, inhabited by abundant seagrasses. On the other hand, due to the abrupt increase in freshwater discharge after Hurricane Harvey, hypoxia was also observed to last for nearly a week in the upper GE (Hu et al., 2020; Walker et al., 2020). No hypoxia was observed in either MAE or LCE although brief stratification did occur during the episodic high freshwater discharge period (Bruesewitz et al., 2013). Overall, DO saturation had a significant correlation (p < 0.001) with Ωarag, but the relationship was dominated by the few low DO data points (not shown). However, low and high DO conditions occurred infrequently because the water column was not far from saturation (%DO = 101.5 ± 16.4), and only a small fraction of DO data (∼2% of a total of 1870 measurements) had less than 75% saturation.
State of estuarine Ωarag in the context of long-term change
Using historical data collected by TCEQ, Hu et al. (2015) and Mccutcheon and Hu (2022) explored multidecadal changes in estuarine carbonate chemistry in the nwGOM estuaries. These studies found decreases in pH, alkalinity, and Ωarag in most estuaries. Most of the long-term stations (with >20 years of record) in these estuaries have Ωarag trends of ∼ -0.01 – -0.07 years−1 (Mccutcheon and Hu, 2022) amid the general warming trend of ∼0.04°C yr−1 (Montagna et al., 2011). The latter would have led to a slight increase in Ωarag (10–3 yr−1) but far from countering the calculated decreasing trends. Nevertheless, the ToE calculations reveal interesting patterns on the timescale of “state” change for Ωarag in these estuaries. Longer ToE can be primarily attributed to larger standard deviations (Table 3), or variabilities, in areas that have greater freshwater discharge as the trends are not significantly different between each pair of primary and secondary bays (Mccutcheon and Hu, 2022). Clearly, this ToE calculation did not consider other factors that may control Ωarag evolution in these estuaries, including projected increasing drought in the southwestern United States that may decrease freshwater discharge in the long run (Cook et al., 2015), sea level rise, and coastal erosion that may create a more open environment that could facilitate more efficient estuarine-coastal water exchange. Either way, these changes could reduce the variability in estuarine biogeochemical parameters, including Ωarag, and make the actual ToE shorter than estimated here. In fact, both the coastal ocean and the open ocean have much shorter ToE, ranging from 1 to 4 decades (Sutton et al., 2019; Turk et al., 2019). Hence, if the projected drought were held true, the distinctions between ToE values estimated for these estuarine and coastal/oceanic waters may diminish.
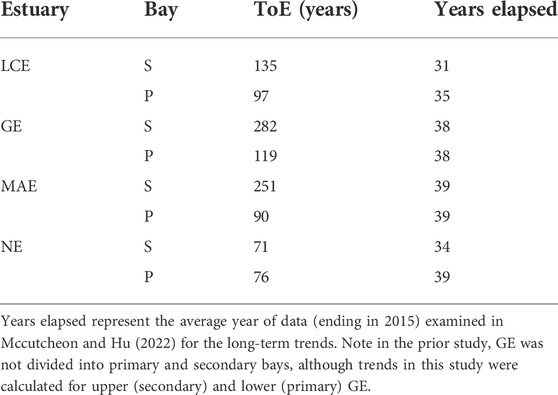
TABLE 3. Time of emergence for Ωarag for primary (P) and secondary (S) bays of the four studied nwGOM estuaries.
Nevertheless, despite the potential overestimation of ToE based on historical trends, these ToE values for Ωarag may be used as a semi-quantitative indicator for planning restoration efforts of calcifying species (oysters). Based on the current Ωarag level and the ToE (Tables 2, 3), it appears that restoration activities may emphasize estuaries with greater freshwater input (in particular GE), and for estuaries with less freshwater, areas closer to the freshwater source rather than downstream may be considered. This consideration actually coincides with previous studies that suggested a positive correlation between freshwater input and secondary productivity (Kim and Montagna, 2012), including oysters (Buzan et al., 2009), even though these studies examined the issue from the perspective of nutrient-driven production.
Conclusion
Using data collected in 2014–2018 that covered a period of varying hydrological conditions, from drought to flood, we examined Ωarag in four estuaries in a climate transition zone. Our results indicate that river discharge exerted dominant control on Ωarag variations in all estuaries, through both nutrient export and subsequent surface production (high Ωarag) and stratification-caused hypoxia (low Ωarag), all of which were responsible for carbonate equilibrium changes. Larger Ωarag variations occurred in estuaries with greater freshwater discharge and in bays within an estuary that had greater freshwater influence. Even though episodic flood events can depress Ωarag to extreme levels (<1), the frequency of such occurrences was relatively low in these shallow, well-mixed environments. Using Ωarag temporal trends in a previous study and the current Ωarag levels, time of emergence calculations indicate that the estuaries with less freshwater input (primary bay of MAE and the entire NE) may start seeing a change of Ωarag that exceeds the current background variations within the next few decades, while the estuaries with more abundant freshwater input at present (secondary bay of MAE, LCE, and GE) have substantially longer ToE (i.e., century scale). Future changes in the hydrological cycle, climate change, and related changes in ocean conditions may all alter the ToE. We suggest that ToE may be a useful tool for planning coastal resource restoration activities.
Data availability statement
Data used in this study can be downloaded from Biological and Chemical Oceanography Data Management Office (BCO-DMO) (DOI:10.26008/1912/bco-dmo.835227.1 and DOI:10.1575/1912/bco-dmo.784673.1).
Author contributions
XH conceived the research idea, carried out the data analysis, and led the manuscript writing. HY, MM, LD, and CS participated in the fieldwork, analyzed the carbonate system parameters, and reported data. MW and PM were both in charge of analyzing nutrient and chlorophyll-a samples as well as data reporting. HY conducted the PA analysis. XH, MW, and PM all secured funding at various stages of the sampling period. All authors contributed to the writing of this manuscript.
Funding
This study was funded by the NSF Chemical Oceanography Program (OCE#1654232). Field sampling was supported by both the NSF Chemical Oceanography Program (OCE#1654232 and OCE#1760006) and NOAA’s NOS National Center for Coastal Ocean Science (Contract No. NA15NOS4780185). This research was also supported in part by operations grants to the Mission-Aransas National Estuarine Research Reserve from NOAA’s Office of Coastal Management.
Acknowledgments
We are grateful for the fieldwork assistance provided by the staff and students at both the Mission Aransas National Estuarine Research Reserve and Harte Research Institute at Texas A&M University-Corpus Christi.
Conflict of interest
The authors declare that the research was conducted in the absence of any commercial or financial relationships that could be construed as a potential conflict of interest.
Publisher’s note
All claims expressed in this article are solely those of the authors and do not necessarily represent those of their affiliated organizations, or those of the publisher, the editors, and the reviewers. Any product that may be evaluated in this article, or claim that may be made by its manufacturer, is not guaranteed or endorsed by the publisher.
References
Andersson, A. J., Kline, D. I., Edmunds, P. J., Archer, S. D., Bednaršek, N., Carpenter, R. C., et al. (2015). Understanding ocean acidification impacts on organismal to ecological scales. Oceanogr. Wash. D. C). 28, 16–27. doi:10.5670/oceanog.2015.27
Applebaum, S., Montagna, P. A., and Ritter, C. (2005). Status and trends of dissolved oxygen in Corpus Christi Bay, Texas, U.S.A. Environ. Monit. Assess. 107, 297–311. doi:10.1007/s10661-005-3111-5
Beckwith, S. T., Byrne, R. H., and Hallock, P. (2019). Riverine calcium end-members improve coastal saturation state calculations and reveal regionally variable calcification potential. Front. Mar. Sci. 6, 169. doi:10.3389/fmars.2019.00169
Bishop, K. A., Mcclelland, J. W., and Dunton, K. H. (2017). Freshwater contributions and nitrogen sources in a South Texas estuarine ecosystem: a time-integrated perspective from stable isotopic ratios in the eastern oyster (Crassostrea virginica). Estuaries Coasts 40, 1314–1324. doi:10.1007/s12237-017-0227-0
Bruesewitz, D. A., Gardner, W. S., Mooney, R. F., Pollard, L., and Buskey, E. J. (2013). Estuarine ecosystem function response to flood and drought in a shallow, semiarid estuary: Nitrogen cycling and ecosystem metabolism. Limnol. Oceanogr. 58, 2293–2309. doi:10.4319/lo.2013.58.6.2293
Buzan, D., Lee, W., Culbertson, J., Kuhn, N., and Robinson, L. (2009). Positive relationship between freshwater inflow and oyster abundance in Galveston Bay, Texas. Estuaries Coasts 32, 206–212. doi:10.1007/s12237-008-9078-z
Cai, W.-J., Hu, X., Huang, W.-J., Murrell, M. C., Lehrter, J. C., Lohrenz, S. E., et al. (2011). Acidification of subsurface coastal waters enhanced by eutrophication. Nat. Geosci. 4, 766–770. doi:10.1038/ngeo1297
Cifuentes, L. A., Schemel, L. E., and Sharp, J. H. (1990). Qualitative and numerical analyses of the effects of river inflow variations on mixing diagrams in estuaries. Estuar. Coast. Shelf Sci. 30, 411–427. doi:10.1016/0272-7714(90)90006-d
Cook, B. I., Ault, T. R., and Smerdon, J. E. (2015). Unprecedented 21st century drought risk in the American Southwest and Central Plains. Sci. Adv. 1, e1400082. doi:10.1126/sciadv.1400082
Cooley, S. R., Coles, V. J., Subramaniam, A., and Yager, P. L. (2007). Seasonal variations in the Amazon plume-related atmospheric carbon sink. Glob. Biogeochem. Cycles 21, GB3014. doi:10.1029/2006gb002831
Da, F., Friedrichs, M. a. M., St-Laurent, P., Shadwick, E. H., Najjar, R. G., and Hinson, K. E. (2021). Mechanisms driving decadal changes in the carbonate system of a coastal plain estuary. JGR. Oceans 126, e2021JC017239. doi:10.1029/2021jc017239
Davis, C. V., Hewett, K., Hill, T. M., Largier, J. L., Gaylord, B., and Jahncke, J. (2018). Reconstructing aragonite saturation state based on an empirical relationship for Northern California. Estuaries Coasts 41, 2056–2069. doi:10.1007/s12237-018-0372-0
Dickson, A. G., Afghan, J. D., and Anderson, G. C. (2003). Reference materials for oceanic CO2 analysis: a method for the certification of total alkalinity. Mar. Chem. 80, 185–197. doi:10.1016/s0304-4203(02)00133-0
Dickson, A. G., Sabine, C. L., and Christian, J. R. (2007). Guide to best practices for ocean CO2 measurements, PICES Special Publication.
Dickson, A. G., Wesolowski, D. J., Palmer, D. A., and Mesmer, R. E. (1990). Dissociation constant of bisulfate ion in aqueous sodium chloride solutions to 250.degree.C. J. Phys. Chem. 94, 7978–7985. doi:10.1021/j100383a042
Doney, S. C., Fabry, V. J., Feely, R. A., and Kleypas, J. A. (2009). Ocean acidification: the other CO2 problem. Ann. Rev. Mar. Sci. 1, 169–192. doi:10.1146/annurev.marine.010908.163834
Douglas, N. K., and Byrne, R. H. (2017). Spectrophotometric pH measurements from river to sea: Calibration of mCP for 0≤S≤40 and 278.15≤T≤308.15K. Mar. Chem. 197, 64–69. doi:10.1016/j.marchem.2017.10.001
Du, J., and Park, K. (2019). Estuarine salinity recovery from an extreme precipitation event: Hurricane Harvey in Galveston Bay. Sci. Total Environ. 670, 1049–1059. doi:10.1016/j.scitotenv.2019.03.265
Du, J., Park, K., Jensen, C., Dellapenna, T. M., Zhang, W. G., and Shi, Y. (2021). Massive oyster kill in Galveston Bay caused by prolonged low-salinity exposure after Hurricane Harvey. Sci. Total Environ. 774, 145132. doi:10.1016/j.scitotenv.2021.145132
Evans, A., Madden, K., and Palmer, S. M. (Editors) (2012). The ecology and sociology of the mission-aransas estuary - an estuarine and watershed profile (Texas University of Texas Marine Science Institute).
Eyre, B. D., Cyronak, T., Drupp, P., Carlo, E. H. D., Sachs, J. P., and Andersson, A. J. (2018). Coral reefs will transition to net dissolving before end of century. Science 359, 908–911. doi:10.1126/science.aao1118
Feely, R. A., Alin, S. R., Newton, J., Sabine, C. L., Warner, M., Devol, A., et al. (2010). The combined effects of ocean acidification, mixing, and respiration on pH and carbonate saturation in an urbanized estuary. Estuar. Coast. Shelf Sci. 88, 442–449. doi:10.1016/j.ecss.2010.05.004
Feely, R. A., Okazaki, R. R., Cai, W.-J., Bednaršek, N., Alin, S. R., Byrne, R. H., et al. (2018). The combined effects of acidification and hypoxia on pH and aragonite saturation in the coastal waters of the California current ecosystem and the northern Gulf of Mexico. Cont. Shelf Res. 152, 50–60. doi:10.1016/j.csr.2017.11.002
Feely, R. A., Sabine, C. L., Byrne, R. H., Millero, F. J., Dickson, A. G., Wanninkhof, R., et al. (2012). Decadal changes in the aragonite and calcite saturation state of the Pacific Ocean. Glob. Biogeochem. Cycles 26, 2011GB004157. doi:10.1029/2011gb004157
Franco, A. C., Ianson, D., Ross, T., Hamme, R. C., Monahan, A. H., Christian, J. R., et al. (2021). Anthropogenic and climatic contributions to observed carbon system trends in the northeast Pacific. Glob. Biogeochem. Cycles 35, e2020GB006829. doi:10.1029/2020gb006829
Gledhill, D. K., Wanninkhof, R., Millero, F. J., and Eakin, M. (2008). Ocean acidification of the Greater Caribbean Region 1996-2006. J. Geophys. Res. 113, C10031. doi:10.1029/2007jc004629
Gomez, F. A., Wanninkhof, R., Barbero, L., and Lee, S.-K. (2021). Increasing river alkalinity slows ocean acidification in the northern Gulf of Mexico. Geophys. Res. Lett. 48, e2021GL096521. doi:10.1029/2021gl096521
Guo, X., Cai, W.-J., Huang, W.-J., Wang, Y., Chen, F., Murrell, M. C., et al. (2012). CO2 dynamics and community metabolism in the Mississippi River plume. Limnol. Oceanogr. 57, 1–17. doi:10.4319/lo.2012.57.1.0001
Hales, B., Suhrbier, A., Waldbusser, G. G., Feely, R. A., and Newton, J. A. (2016). The Carbonate Chemistry of the “Fattening Line” Willapa Bay, 2011–2014. Estuaries Coasts 40, 173–186. doi:10.1007/s12237-016-0136-7
Hawkins, E., and Sutton, R. (2012). Time of emergence of climate signals. Geophys. Res. Lett. 39, L01702. doi:10.1029/2011gl050087
Hu, X., Beseres Pollack, J., Mccutcheon, M. R., Montagna, P. A., and Ouyang, Z. (2015). Long-term alkalinity decrease and acidification of estuaries in Northwestern Gulf of Mexico. Environ. Sci. Technol. 49, 3401–3409. doi:10.1021/es505945p
Hu, X., Nuttall, M. F., Wang, H., Yao, H., Staryk, C. J., Mccutcheon, M. R., et al. (2018). Seasonal variability of carbonate chemistry and decadal changes in waters of a marine sanctuary in the Northwestern Gulf of Mexico. Mar. Chem. 205, 16–28. doi:10.1016/j.marchem.2018.07.006
Hu, X., Yao, H., Staryk, C. J., Mccutcheon, M. R., Wetz, M. S., and Walker, L. (2020). Disparate responses of carbonate system in two adjacent subtropical estuaries to the influence of Hurricane Harvey – A case study. Front. Mar. Sci. 7, 26. doi:10.3389/fmars.2020.00026
Ianson, D., Allen, S. E., Moore-Maley, B. L., Johannessen, S. C., Macdonald, D., and Robie, W. (2016). Vulnerability of a semienclosed estuarine sea to ocean acidification in contrast with hypoxia. Geophys. Res. Lett. 43, 5793–5801. doi:10.1002/2016gl068996
Jiang, L.-Q., Cai, W.-J., and Wang, Y. (2008). A comparative study of carbon dioxide degassing in river- and marine-dominated estuaries. Limnol. Oceanogr. 53, 2603–2615. doi:10.4319/lo.2008.53.6.2603
Jiang, L.-Q., Feely, R.A., Carter, B. R., Greeley, D. J., Gledhill, D. K., and Arzayus, K. M. (2015). Climatological distribution of aragonite saturation state in the global oceans. Glob. Biogeochem. Cycles 29, 1656–1673. doi:10.1002/2015gb005198
Juranek, L. W., Feely, R. A., Peterson, W. T., Alin, S. R., Hales, B., Lee, K., et al. (2009). A novel method for determination of aragonite saturation state on the continental shelf of central Oregon using multi-parameter relationships with hydrographic data. Geophys. Res. Lett. 36, L24601. doi:10.1029/2009gl040778
Kanamori, S., and Ikegami, H. (1980). Computer-processed potentiometric titration for the determination of calcium and magnesium in sea water. J. Oceanogr. Soc. Jpn. 36, 177–184. doi:10.1007/bf02070330
Kassambara, A., and Mundt, F. (2020). Factoextra: Extract and Visualize the Results of Multivariate Data Analyses. 7 ed.
Kim, H.-C., and Montagna, P. A. (2012). Effects of climate-driven freshwater inflow variability on macrobenthic secondary production in Texas lagoonal estuaries: A modeling study. Ecol. Model. 235–236, 67–80. doi:10.1016/j.ecolmodel.2012.03.022
Kim, H.-C., Son, S., Montagna, P., Spiering, B., and Nam, J. (2014). Linkage between freshwater inflow and primary productivity in Texas estuaries: downscaling effects of climate variability. J. Coast. Res. 68, 65–73. doi:10.2112/si68-009.1
Lee, K., Kim, T.-W., Byrne, R. H., Millero, F. J., Feely, R. A., and Liu, Y.-M. (2010). The universal ratio of boron to chlorinity for the North Pacific and North Atlantic oceans. Geochimica Cosmochimica Acta 74, 1801–1811. doi:10.1016/j.gca.2009.12.027
Liu, X., Patsavas, M. C., and Byrne, R. H. (2011). Purification and characterization of meta-cresol purple for spectrophotometric seawater pH measurements. Environ. Sci. Technol. 45, 4862–4868. doi:10.1021/es200665d
Manno, C., Bednaršek, N., Tarling, G. A., Peck, V. L., Comeau, S., Adhikari, D., et al. (2017). Shelled pteropods in peril: Assessing vulnerability in a high CO2 ocean. Earth-Science Rev. 169, 132–145. doi:10.1016/j.earscirev.2017.04.005
Mccutcheon, M. R., and Hu, X. (2022). Long-term trends in estuarine carbonate chemistry in the northwestern Gulf of Mexico. Front. Mar. Sci. 9, 793065. doi:10.3389/fmars.2022.793065
Mccutcheon, M. R., Staryk, C. J., and Hu, X. (2019). Characteristics of the carbonate system in a semiarid estuary that experiences summertime hypoxia. Estuaries Coasts 42, 1509–1523. doi:10.1007/s12237-019-00588-0
Mccutcheon, M. R., Yao, H., Staryk, C. J., and Hu, X. (2021). Temporal variability and driving factors of the carbonate system in the Aransas Ship Channel, TX, USA: a time series study. Biogeosciences 18, 4571–4586. doi:10.5194/bg-18-4571-2021
Mclaughlin, K., Nezlin, N. P., Weisberg, S. B., Dickson, A. G., Booth, J. a. T., Cash, C. L., et al. (2018). Seasonal patterns in aragonite saturation state on the southern California continental shelf. Cont. Shelf Res. 167, 77–86. doi:10.1016/j.csr.2018.07.009
Mcnicholl, C., Koch, M. S., Swarzenski, P. W., Oberhaensli, F. R., Taylor, A., Batista, M. G., et al. (2020). Ocean acidification effects on calcification and dissolution in tropical reef macroalgae. Coral Reefs 39, 1635–1647. doi:10.1007/s00338-020-01991-x
Montagna, P. A., Brenner, J., Gibeaut, J., and Morehead, S. (2011b). “Coastal impacts,” in The impact of global warming on Texas. Editors J. Schmandt, J. Clarkson, and G. R. North. Second ed (Austin: University of Texas Press), 96–123.
Montagna, P. A., Gibeaut, J. C., and Tunnell, J. W. (2007). “South Texas Climate 2100: Coastal Impacts,” in The changing climate of south Texas 1900-2100: Problems and prospects, impacts and implications. Editors J. Norwine, and K. John (Texas A&M University – Kingsville), 57–77.
Montagna, P. A., Hu, X., Palmer, T. A., and Wetz, M. S. (2018). Effect of hydrological variability on the biogeochemistry of estuaries across a regional climatic gradient. Limnol. Oceanogr. 63, 2465–2478. doi:10.1002/lno.10953
Montagna, P., Palmer, T. A., and Beseres Pollack, J. (2013). Hydrological changes and estuarine dynamics. New York: Springer.
Montagna, P., Vaughan, B., and Ward, G. (2011a). “The importance of freshwater inflows to Texas estuaries,” in Water policy in Texas: Responding to the rise of scarcity. Editor R. C. Griffin (Washington D.C. The RFF Press), 107–127.
Mooney, R. F., and Mcclelland, J. W. (2012). Watershed export events and ecosystem responses in the Mission–Aransas National Estuarine Research Reserve, South Texas. Estuaries Coasts 35, 1468–1485. doi:10.1007/s12237-012-9537-4
Moore-Maley, B. L., Ianson, D., and Allen, S. E. (2018). The sensitivity of estuarine aragonite saturation state and pH to the carbonate chemistry of a freshet-dominated river. Biogeosciences, 15, 3743–3760.
Mucci, A., Starr, M., Gilbert, D., and Sundby, B. (2011). Acidification of lower St. Lawrence Estuary bottom waters. Atmosphere-Ocean 49, 206–218. doi:10.1080/07055900.2011.599265
Mucci, A. (1983). The solubility of calcite and aragonite in seawater at various salinities, temperatures, and one atmosphere total pressure. Am. J. Sci. 283, 780–799. doi:10.2475/ajs.283.7.780
Murgulet, D., Trevino, M., Douglas, A., Spalt, N., Hu, X., and Murgulet, V. (2018). Temporal and spatial fluctuations of groundwater-derived alkalinity fluxes to a semiarid coastal embayment. Sci. Total Environ. 630, 1343–1359. doi:10.1016/j.scitotenv.2018.02.333
Negrete-García, G., Lovenduski, N. S., Hauri, C., Krumhardt, K. M., and Lauvset, S. K. (2019). Sudden emergence of a shallow aragonite saturation horizon in the Southern Ocean. Nat. Clim. Chang. 9, 313–317. doi:10.1038/s41558-019-0418-8
Nixon, S., Oczkowski, A., Pilson, M. Q., Fields, L., Oviatt, C., and Hunt, C. (2015). On the response of pH to inorganic nutrient enrichment in well-mixed coastal marine waters. Estuaries Coasts 38, 232–241. doi:10.1007/s12237-014-9805-6
Oliveira, A. P., Cabeçadas, G., and Mateus, M. D. (2017). Inorganic carbon distribution and CO2 fluxes in a large European estuary (Tagus, Portugal). Sci. Rep. 7, 7376. doi:10.1038/s41598-017-06758-z
Orr, J. C., Epitalon, J.-M., Dickson, A. G., and Gattuso, J.-P. (2018). Routine uncertainty propagation for the marine carbon dioxide system. Mar. Chem. 207, 84–107. doi:10.1016/j.marchem.2018.10.006
Orr, J. C., Fabry, V. J., Aumont, O., Bopp, L., Doney, S. C., Feely, R. A., et al. (2005). Anthropogenic ocean acidification over the twenty-first century and its impact on calcifying organisms. Nature 437, 681–686. doi:10.1038/nature04095
Patrick, C. J., Yeager, L., Armitage, A. R., Carvallo, F., Congdon, V. M., Dunton, K. H., et al. (2020). A system level analysis of coastal ecosystem responses to hurricane impacts. Estuaries Coasts 43, 943–959. doi:10.1007/s12237-019-00690-3
Pollack, J., Kim, H.-C., Morgan, E., and Montagna, P. (2011). Role of flood disturbance in natural oyster (Crassostrea virginica) population maintenance in an estuary in South Texas, USA. Estuaries Coasts 34, 187–197. doi:10.1007/s12237-010-9338-6
Reisdorph, S. C., and Mathis, J. T. (2014). The dynamic controls on carbonate mineral saturation states and ocean acidification in a glacially dominated estuary. Estuar. Coast. Shelf Sci. 144, 8–18. doi:10.1016/j.ecss.2014.03.018
Ritter, C., and Montagna, P. (1999). Seasonal hypoxia and models of benthic response in a Texas Bay. Estuaries 22, 7–20. doi:10.2307/1352922
Ross, T., Du Preez, C., and Ianson, D. (2020). Rapid deep ocean deoxygenation and acidification threaten life on Northeast Pacific seamounts. Glob. Change Biol. 26, 6424–6444. doi:10.1111/gcb.15307
Sasse, T. P., Mcneil, B. I., Matear, R. J., and Lenton, A. (2015). Quantifying the influence of CO2 seasonality on future aragonite undersaturation onset. Biogeosciences 12, 6017–6031. doi:10.5194/bg-12-6017-2015
Siedlecki, S., Salisbury, J., Gledhill, D., Bastidas, C., Meseck, S., Mcgarry, K., et al. (2021). Projecting ocean acidification impacts for the Gulf of Maine to 2050: New tools and expectations. Elem. Sci. Anthropocene 9, 00062. doi:10.1525/elementa.2020.00062
Simpson, E., Ianson, D., and Kohfeld, K. E. (2022). Using end-member models to estimate seasonal carbonate chemistry and acidification sensitivity in temperate estuaries. Geophys. Res. Lett. 49, e2021GL095579. doi:10.1029/2021gl095579
Solis, R. S., and Powell, G. L. (1999). “Hydrography, mixing characteristics, and residence times of Gulf of Mexico Estuaries,” in Biogeochemistry of Gulf of Mexico estuaries. Editors T. S. Bianchi, J. R. Pennock, and R. R. Twilley (John Willey & Sons, Inc), 29–61.
Spalding, C., Finnegan, S., and Fischer, W. W. (2017). Energetic costs of calcification under ocean acidification. Glob. Biogeochem. Cycles 31, 866–877. doi:10.1002/2016gb005597
Stokowski, M., Schneider, B., Rehder, G., and Kuliński, K. (2020). The characteristics of the CO2 system of the Oder River estuary (Baltic Sea). J. Mar. Syst. 211, 103418. doi:10.1016/j.jmarsys.2020.103418
Su, J., Cai, W.-J., Brodeur, J., Chen, B., Hussain, N., Yao, Y., et al. (2020). Chesapeake Bay acidification buffered by spatially decoupled carbonate mineral cycling. Nat. Geosci. 13, 441–447. doi:10.1038/s41561-020-0584-3
Sutton, A. J., Feely, R. A., Maenner-Jones, S., Musielwicz, S., Osborne, J., Dietrich, C., et al. (2019). Autonomous seawater pCO2 and pH time series from 40 surface buoys and the emergence of anthropogenic trends. Earth Syst. Sci. Data 11, 421–439. doi:10.5194/essd-11-421-2019
Tolan, J. M. (2007). El Niño-Southern Oscillation impacts translated to the watershed scale: Estuarine salinity patterns along the Texas Gulf Coast, 1982 to 2004. Estuar. Coast. Shelf Sci. 72, 247–260. doi:10.1016/j.ecss.2006.10.018
Tunnell, J. W. (2017). “Shellfish of the Gulf of Mexico,” in Habitats and biota of the Gulf of Mexico: Before the deepwater horizon oil spill: Volume 1: Water quality, sediments, sediment contaminants, oil and gas seeps, coastal habitats, offshore plankton and benthos, and shellfish. Editor C. H. Ward (New York, NY: Springer), 769–839.
Turk, D., Wang, H., Hu, X., Gledhill, D. K., Wang, Z. A., Jiang, L., et al. (2019). Time of emergence of surface ocean carbon dioxide trends in the North American coastal margins in support of ocean acidification observing system design. Front. Mar. Sci. 6. doi:10.3389/fmars.2019.00091
Van Heuven, S., Pierrot, S. D., Rae, J. W. B., Lewis, E., and Wallace, D. W. R. (2011). Carbon dioxide information analysis center. Oak Ridge, TN: Oak Ridge National Laboratory, US DoE.MATLAB Program Developed for CO2 System Calculations
Waldbusser, G. G., Hales, B., and Haley, B. A. (2016). Calcium carbonate saturation state: on myths and this or that stories. ICES J. Mar. Sci. 73, 563–568. doi:10.1093/icesjms/fsv174
Waldbusser, G. G., Hales, B., Langdon, C. J., Haley, B. A., Schrader, P., Brunner, E. L., et al. (2014). Saturation-state sensitivity of marine bivalve larvae to ocean acidification. Nat. Clim. Change 5, 273–280. doi:10.1038/nclimate2479
Walker, L. M., Montagna, P. A., Hu, X., and Wetz, M. S. (2020). Timescales and magnitude of water quality change in three Texas estuaries induced by passage of Hurricane Harvey. Estuaries Coasts 44, 960–971. doi:10.1007/s12237-020-00846-6
Wallace, R. B., Baumann, H., Grear, J. S., Aller, R. C., and Gobler, C. J. (2014). Coastal ocean acidification: The other eutrophication problem. Estuar. Coast. Shelf Sci. 148, 1–13. doi:10.1016/j.ecss.2014.05.027
Waters, J., Millero, F. J., and Woosley, R. J. (2014). Corrigendum to “The free proton concentration scale for seawater pH”, [MARCHE: 149 (2013) 8–22]. Mar. Chem. 165, 66–67. doi:10.1016/j.marchem.2014.07.004
Wong, G. T. F. (1979). Alkalinity and pH in the southern Chesapeake Bay and the James River estuary1. Limnol. Oceanogr. 24, 970–977. doi:10.4319/lo.1979.24.5.0970
Woodruff, C. M., and Abbott, P. L. (1979). Drainage-basin evolution and aquifer development in a karstic limestone terrain South-Central Texas, U.S.A. Earth Surf. Process. 4, 319–334. doi:10.1002/esp.3290040403
Yáñez-Arancibia, A., and Day, J. W. (2004). The Gulf of Mexico: towards an integration of coastal management with large marine ecosystem management. Ocean Coast. Manag. 47, 537–563. doi:10.1016/j.ocecoaman.2004.12.001
Yao, H., and Hu, X. (2017). Responses of carbonate system and CO2 flux to extended drought and intense flooding in a semiarid subtropical estuary. Limnol. Oceanogr. 62, S112–S130. doi:10.1002/lno.10646
Keywords: aragonite saturation state, freshwater inflow, subtropical estuaries, ocean acidification (OA), time of emergence
Citation: Hu X, Yao H, McCutcheon MR, Dias L, Staryk CJ, Wetz MS and Montagna PA (2022) Aragonite saturation states in estuaries along a climate gradient in the northwestern Gulf of Mexico. Front. Environ. Sci. 10:951256. doi: 10.3389/fenvs.2022.951256
Received: 23 May 2022; Accepted: 16 September 2022;
Published: 10 October 2022.
Edited by:
Jill A. Olin, Michigan Technological University, United StatesReviewed by:
Debby Ianson, Department of Fisheries and Oceans, CanadaMauricio Molisani, Federal University of Rio de Janeiro, Brazil
Copyright © 2022 Hu, Yao, McCutcheon, Dias, Staryk, Wetz and Montagna. This is an open-access article distributed under the terms of the Creative Commons Attribution License (CC BY). The use, distribution or reproduction in other forums is permitted, provided the original author(s) and the copyright owner(s) are credited and that the original publication in this journal is cited, in accordance with accepted academic practice. No use, distribution or reproduction is permitted which does not comply with these terms.
*Correspondence: Xinping Hu, xinping.hu@tamucc.edu
†Present Address: Hongming Yao, Shenzhen Engineering Laboratory of Ocean Environmental Big Data Analysis and Application, Shenzhen Institute of Advanced Technology, Chinese Academy of Sciences, Shenzhen, China; Melissa R. McCutcheon, State of Texas, Austin, TX, United States
 Xinping Hu
 Hongming Yao
 Melissa R. McCutcheon†
  Larissa Dias
 Cory J. Staryk
 Michael S. Wetz
 Paul A. Montagna