Nutrient stocks, flows and balances for the Bolivian agri-food system: Can recycling human excreta close the nutrient circularity gap?
 Luis Fernando Perez-Mercado
 Cesar Ariel Perez-Mercado
 Björn Vinnerås
 Prithvi Simha
- 1Swedish University of Agricultural Sciences, Department of Energy and Technology, Uppsala, Sweden
- 2Centro de Aguas y Saneamiento Ambiental (CASA), Universidad Mayor de San Simon, Calle Sucre y Parque Latorre, Cochabamba, Bolivia
- 3Independent Researcher, Cochabamba, Bolivia
Analysis of the current state of nutrient stocks, flows, and balances of a territory is necessary to inform strategies that can transition the agri-food sector to a circular economy model. In this study, we quantified the nitrogen and phosphorus budgets for the Bolivian agri-food system at national and regional scales by way of agro-ecological zoning. We performed nutrient balances to calculate indicators for sufficiency (extent of nutrient deficit/surplus) and circularity (proportion of nutrients recirculated). We also evaluated the potential of renewable stocks (human excreta and livestock manure) to meet nutrient deficits in the system. Our results showed that there are apparent deficits of 32 kt N and 8 kt P in the system that cannot be accounted for using available data. We estimate the real deficits required to bring yields of 45 crops grown in Bolivia to parity with those of neighbouring countries to be 110 kt N and 33 kt P. About 44% of nitrogen and 74% of phosphorus is currently recirculated in the system, with the major nutrient inputs being biological nitrogen fixation, livestock manure, and crop residues. However, nutrient recycling is likely to decrease in the future because the national strategy to address nutrient deficits is to increase domestic production of synthetic fertilisers. Our analysis also shows that there is a sufficient stock of nutrients already available in human excreta (39 kt N and 5 kt P) to cover 100% of the nitrogen deficit and 64% of the phosphorus deficit. The low-altitude zone of Chiquitania-Pantanal alone accounts for 65% of cultivation and 80% of the nutrient demand in the country. Here, export-oriented crops like soybean and sorghum are grown, but less than 25% of the nitrogen is recirculated. In contrast, there are nutrient surpluses of 41 kt N and 34 kt P in agro-ecological zones like the Valleys and Altiplano where traditional agriculture is practiced, and the majority of food is grown for local consumption. Overall, we find that recycling of human excreta, combined with transfer of regional nutrient surpluses, could be an effective strategy to reduce the overall nutrient deficit in the system.
1 Introduction
Nitrogen (N) and phosphorus (P) are the plant-essential macronutrients that most limit crop yields in agriculture. Therefore, an evaluation of food security at any geographical scale must consider whether there are sufficient stocks of these nutrients to support the production of food. Such evaluations are highly relevant today, as the global population is growing rapidly and the nutritional needs of an additional 2 billion people will need to be met by 2050 (UN, 2019). However, the agri-food system is already the largest contributor to anthropogenic transgression of several of the planetary boundaries, including the boundary for the biogeochemical flows of N and P (Steffen et al., 2015). To improve agricultural productivity, the application of synthetic fertilisers like urea and diammonium phosphate has increased over the years (Randive et al., 2021); however, so has eutrophication due to the linear flow of nutrients from soils to recipient watercourses (Farmer, 2018).
To reduce the environmental impact of agriculture and keep earth systems within their safe operating space, it is essential that we improve both nutrient use efficiency during cultivation and overall nutrient circularity in the food system (Elser and Bennett, 2011), for example, by changing to better fertiliser application methods or by recycling nutrients present in livestock manure (Mayer et al., 2016). However, to inform such circular economy initiatives, a good understanding and analysis of the current state of nutrient stocks, flows, and balances is necessary. While such analyses can be performed at various scales, analysis at the national and regional scales is most appropriate if the goal is to inform policymakers (Chowdhury et al., 2014). The literature on nutrient budgets at various scales is extensive (Senthilkumar et al., 2012; Chowdhury et al., 2014; Klinglmair et al., 2015; van der Wiel et al., 2019; Zhang et al., 2020), and there is a growing body of research (Mihelcic et al., 2011; Morée et al., 2013; Smit et al., 2015; Hanserud et al., 2016; Akram et al., 2019; van Puijenbroek et al., 2019) focusing on quantifying the potential of alternative sources to meet the nutrient demand in agriculture. We are, however, unaware of any such analysis performed at any scale for the Bolivian agri-food system.
The population of Bolivia has grown rapidly from 8.4 million in 2000 to 11.7 million in 2020 and is expected to peak at 17.7 million by 2083 (UN, 2019). About 70% of the population in the land-locked country lives in urban areas, where an estimated 72% of people have access to basic sanitation (MMAyA, 2020) but only 58% of the wastewater is treated (UN-WATER, 2021). The city of La Paz (the largest of Bolivia) has no wastewater treatment facility, and raw wastewater is directly discharged to rivers. As human excreta contain plant-essential macro- and micro-nutrients (Vinnerås et al., 2006), many initiatives have attempted to promote alternatives to conventional wastewater treatment in Bolivia, such as wastewater irrigation (Verbyla et al., 2016; Perez-Mercado et al., 2022) and ecological sanitation (Silveti and Andersson, 2019).
However, little is known about the nutrient stocks in excreta available for recycling. To address this gap, this study attempted to answer the following questions. Can human excreta-derived nutrients fill the nutrient gap in the Bolivian agri-food system? What proportion of fertiliser imports to the country can be substituted by excreta-derived nutrients? How close or far is the agri-food system in Bolivia from achieving nutrient circularity?
We conducted an evaluation of the current nutrient stocks, flows, and budgets for the Bolivian agri-food system at two geographical scales, national and regional. We quantified the current nutrient demand in terms of indicators for sufficiency (Guareschi et al., 2019) and circularity (Papangelou and Mathijs, 2021) and assessed the potential of renewable stocks (human excreta and livestock manure) to meet the nutrient deficit in the system. Our findings have implications for food and nutrition security policy in low- and middle-income countries.
2 Methodology
A mass balance for nitrogen and phosphorus was performed for the Bolivian agri-food system (i.e., crop cultivation and human consumption). Based on the results of the mass balance, indicators of nutrient sufficiency (Guareschi et al., 2019) and circularity (Papangelou and Mathijs, 2021) for crop cultivation were calculated. Subsequently, the potential of nutrients contained in human excreta to supply the nutrients required for crop cultivation was estimated. All analyses (mass balance and calculation of indicators and potential substitution of crop nutrients by excreta) were done at both national and regional levels.
2.1 The agri-food system
2.1.1 System components
The agri-food system comprises all of the processes required to provide food to the population living within the national boundary of Bolivia and the nutrient flows in and out of this system (Papangelou and Mathijs, 2021). The system includes the following eight processes: urea industry, cropland, crop residues, livestock production, grassland, forest, food industry, and human consumption (Figure 1A). However, we simplified the agri-food system (Figure 1B and Table 1) to include only the processes linked to crop cultivation (cropland and crop residues) and human consumption for the following reasons. First, data are not available for all the processes in Bolivia. For example, there is no literature on the composition of organic wastes or on the amount of phosphorus added to the system via cleaning agents. Second, for some processes, there is evidence of significant influence by “grey market” activities that make nutrient flow estimations unreliable even though data for the processes exist, e.g., smuggling of produce from abroad (Tito-Velarde and Wanderley, 2021) and unplanned change of land use, including conversion of forest land to pastures and cropland (Müller et al., 2012).
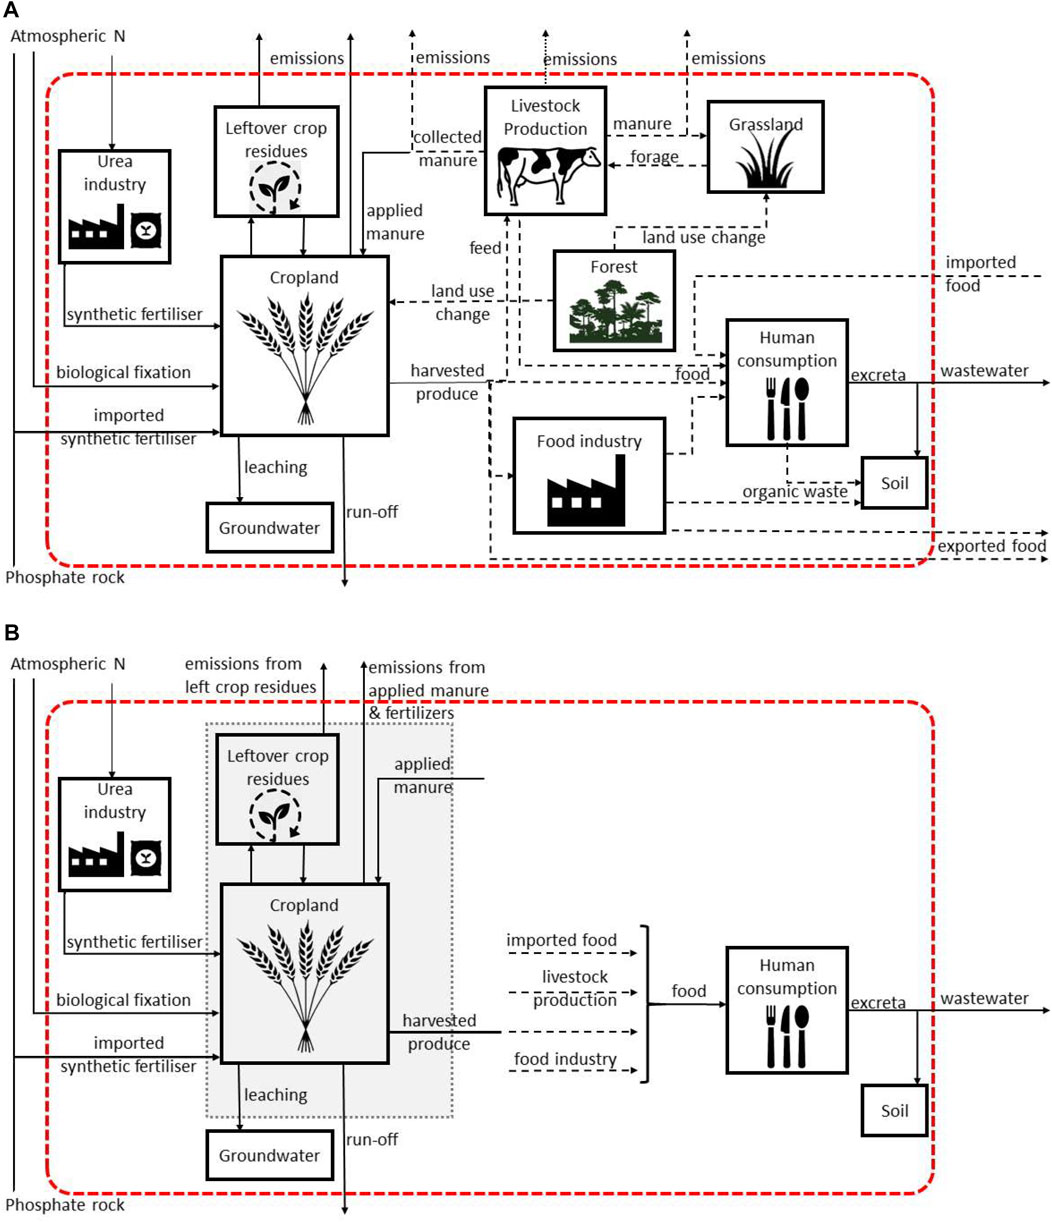
FIGURE 1. Processes (solid-line boxes), flows (arrows) and boundaries (dashed-line boxes) for (A) the complete Bolivian agri-food system and (B) the simplified system considered for the mass balance calculations for nitrogen and phosphorus. The national boundary is represented by a red dashed box and grey dashed boxes indicate processes linked to crop cultivation. The dashed arrows represent flows that were not included in the mass balance due to insufficient data.
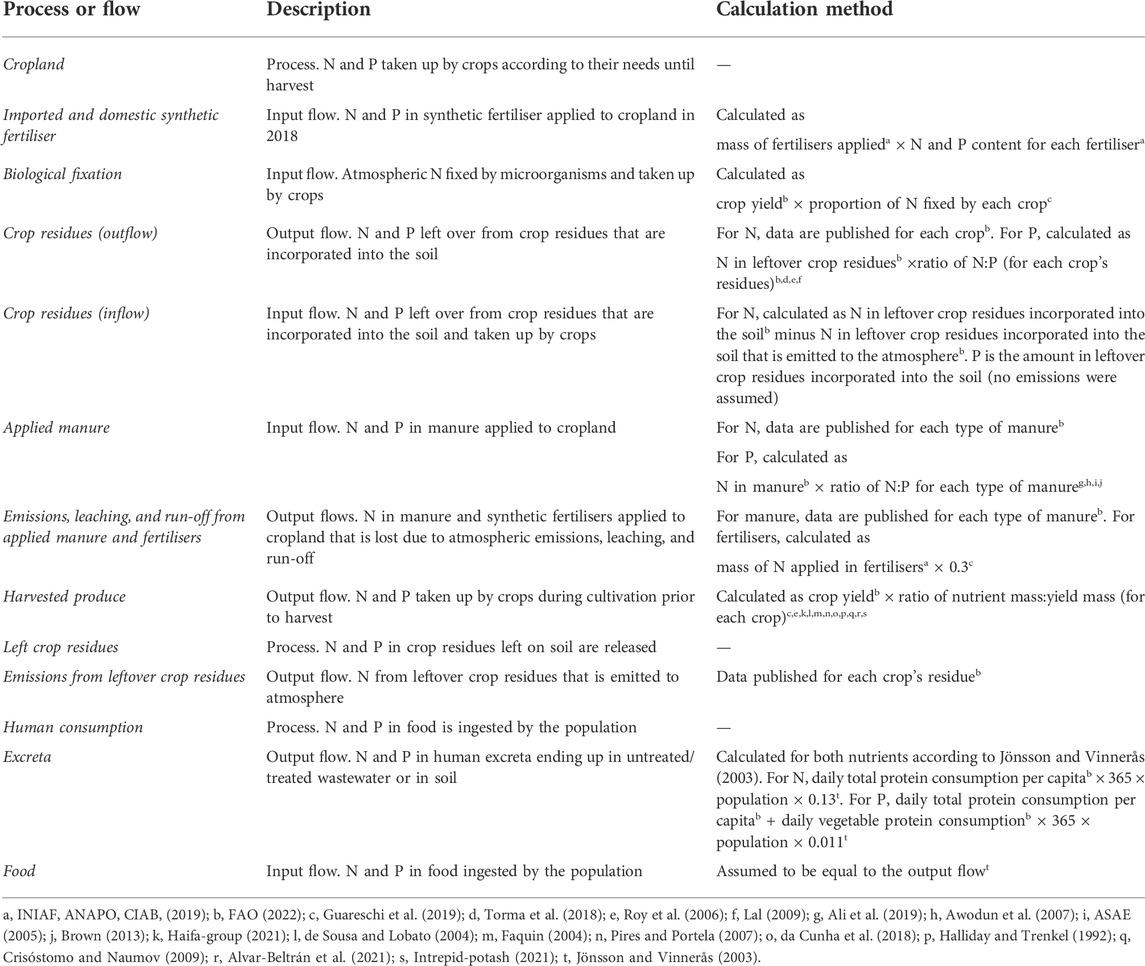
TABLE 1. Processes and flows included in the nutrient mass balance, including how they were estimated or calculated. Data sources are indicated with superscript letters.
2.1.2 Flows
We studied the flows of nitrogen and phosphorus in and out of the crop cultivation (i.e., cropland and crop residues) and human consumption processes. Detailed information on the data used for estimating the mass flow of the elements, including data sources, is summarized in Table 1, and further information is available in the supplementary material (Supplementary Tables S1–S4).
2.1.3 National and regional level
We studied the Bolivian agri-food system at the national and regional levels. At the regional level, instead of the nine Bolivian administrative regions (or departments), we considered the seven agro-ecological zones. Agro-ecological zoning groups a territory based on landscape, climatic and soil characteristics, focusing on the requirements and management systems of crops (FAO, 1996). Such zoning is based on three inputs (i.e., land resource inventory, inventory of land utilization and crop requirements, and evaluation of land suitability), and its purpose is to inform decisions on development by identifying areas with similar potentials and constraints. In Bolivia, by law, agro-ecological zones are part of territorial planning at the departmental and municipal scales (Ministry for Planning of Development, 2016) and are often used as criteria to establish associations of municipalities (“mancomunidades”).
Agro-ecological zones are especially appropriate for estimating the potential for nutrient recycling in Bolivia because, besides grouping similar crop systems, they also express differences in altitude (agricultural production in Bolivia takes place between ∼100 and ∼4,000 m above sea level and slopes across the territory), which significantly increases the cost of transporting crops (Klein et al., 2017), biomass (Morato et al., 2019) and nutrients (Trimmer and Guest, 2018). The seven agro-ecological regions are briefly characterized in Table 2.
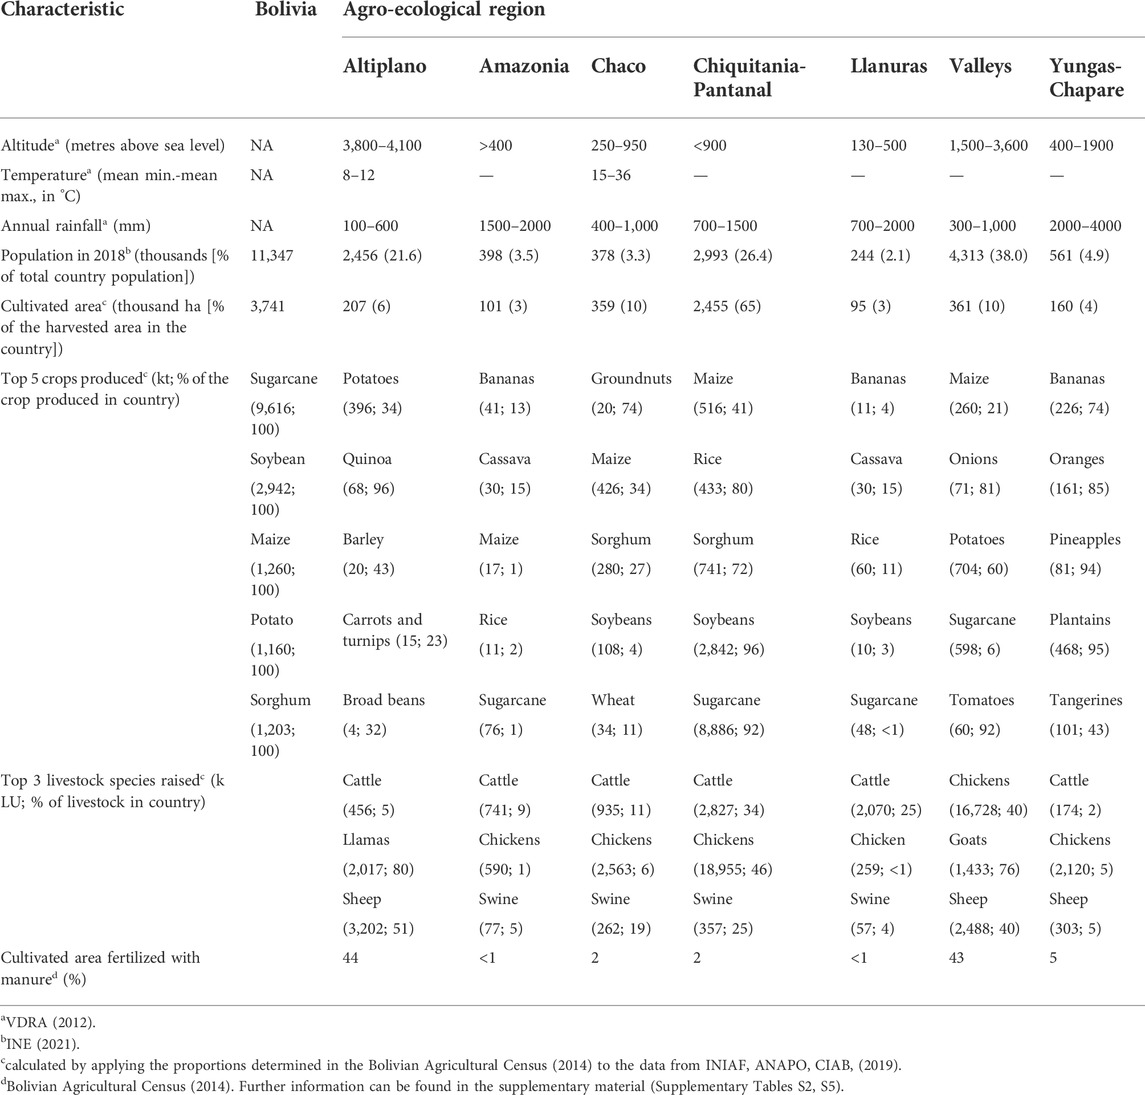
TABLE 2. Main biophysical and productive characteristics of the Bolivian agri-food system and its seven agro-ecological zones.
2.2 Mass balance
Mass balance calculations were done for the simplified agri-food system (Figure 1) at the national scale using data sourced from the literature and the FAOSTAT database for the year 2018 (Table 1). For the regional scale, we aggregated data sourced from the Bolivian Agricultural Census (2014) to calculate the nutrient flows for each agro-ecological, region as the census is performed at the municipality level. We assumed that the contribution of each region to the national nutrient budget remained constant until 2018. Detailed calculations can be found in the supplementary information.
2.2.1 Sufficiency
We calculated the nutrient sufficiency indicator to express the results of the mass and nutrient balance so that it can be related to the nutrient requirements of crops. As mass balance calculations compare nutrient inputs and outputs in the crop production system (Eq. 1), a negative value for the indicator implies that the amount of nutrient input to the system is not sufficient to meet the demand of the crops. In other words, there would be a nutrient deficit. Conversely, we interpreted a positive value for the indicator as nutrient inputs greater than the amount required by crops, or in other words, a nutrient surplus.
Input is the amount of nutrient (nitrogen or phosphorus) applied to soil by the following input flows i: synthetic fertilizer, crop residues, animal manure, and (in the case of nitrogen only) biological fixation. Efficiency is the proportion of nutrient applied to soil by means of the input i that is available for and taken up by the crops. The efficiencies for each input were calculated by subtracting the amount of nutrients lost to emissions, leaching, and run-off according to the coefficients and data from Guareschi et al. (2019) for synthetic fertilizer and nitrogen biological fixation and from the FAO (FAO, 2022) for crop resides and animal manure (Table 1).
Harvested.produce (crop requirements) is the mass of nutrient taken up by the crop j (where j is one of the 45 highest-yield crops in Bolivia according to FAOSTAT). It was calculated by means of published ratios that link crop yield with the amount of nutrient taken up by crops for a given yield (Table 1). Since the current yields for most crops in Bolivian agriculture are considered low, especially in comparison with yields for the same crops in neighbouring countries (Guareschi et al., 2019; INIAF, ANAPO, CIAB, 2019), we calculated the sufficiency indicators using the following two approaches derived from Eq. 1. In the first approach (Eq. 2), crop nutrient requirements were calculated based on data for the latest crop yields available to us, i.e., for the year 2018 (current sufficiency). If the calculated value of the current sufficiency indicator was negative, we interpreted it as an apparent nutrient deficit since the value should be zero if all inputs and outputs have been considered in the mass balance. In the second approach (Eq. 3), crop nutrient requirements were calculated based on data for yields obtained in neighbouring countries for the same crops (optimum sufficiency) taken from FAOSTAT (FAO, 2022) and available in the supplementary material (Supplementary Table S2). If the calculated value of the optimum sufficiency indicator was negative, we interpreted it as a real nutrient deficit, since it represents the deficit in nutrient inputs necessary to obtain optimal crop yields.
2.2.2 Circularity
Circularity can be defined as the extent to which a system reduces (or even eliminates) waste by recirculating it as a product or raw material for other processes (Antikainen et al., 2018). Therefore, we evaluated the circularity of the nutrients in the studied system by calculating the share of nutrient inputs that are recirculated (i.e., that originated from secondary resources) (Eq. 4), following the work of Papangelou and Mathijs (2021).
recirculated.Input is the amount of nutrients in the recirculated inputs that are applied to soil for crop cultivation. In this study, the inputs deemed recirculated were leftover crop residues and collected manure, while synthetic fertilizers and biological fixation of nitrogen were not considered circular inputs (Table 1).
2.2.3 Replacement potential of excreta
The potential of human excreta to replace current nutrient demand for crop cultivation (R.potential) was calculated by dividing the amount of nutrients available in excreta by the amount of nutrients required for crop cultivation. In the case of nitrogen (N.R.potential), the proportion of nitrogen biologically fixed (B.Fixation) from atmosphere by microorganisms associated with some of the crops was subtracted from the amount of nitrogen taken up by the crops (Harvested.produceN) (Eq. 5).
ExcretaN is the amount of nitrogen in human excreta and B. Fixation is the amount of atmospheric nitrogen fixed by microorganisms and taken up by crops. For phosphorus, the replacement potential of excreta (P.R.potential) was calculated as for nitrogen except for biological fixation, which does not take place for phosphorus (Eq. 6).
In this case, ExcretaP is the amount of phosphorus in human excreta and Harvested. produceP is the amount of phosphorus taken up by crops. The results of the replacement potential of excreta are expressed as percentages for both nutrients. We assumed that there were no losses during treatment, storage, transportation, and application.
2.3 GIS mapping
Data calculated in the mass balance were processed with the PostGIS extension for PostgreSQL and then plotted as choropleth maps with QGIS.
3 Results
3.1 Nutrient sufficiency
At the national level, the total nutrient requirements in relation to crop yields obtained in the year 2018 (i.e., current crop yield; see Section 2.2.1) were 395 and 63 kt for N and P, respectively. The total nutrient inputs to the agri-food systems after accounting for nutrient losses during application amounted to 363 kt for N and 55 kt for P. This suggests that there are apparent deficits of 32 kt of N (8% of total crop requirement after accounting for biological fixation) and 7.7 kt of P (12% of total crop requirement) (Table 3). However, if all crops received optimal nutrient inputs so that their yields were maximised (i.e., optimum crop yield; see Section 2.2.1), then 605 kt of N and 97 kt of P would be required (Table 4). This means that the real nutrient deficit was much larger, 110 kt of N and 33 kt of P (Figure 2, Figure 3).
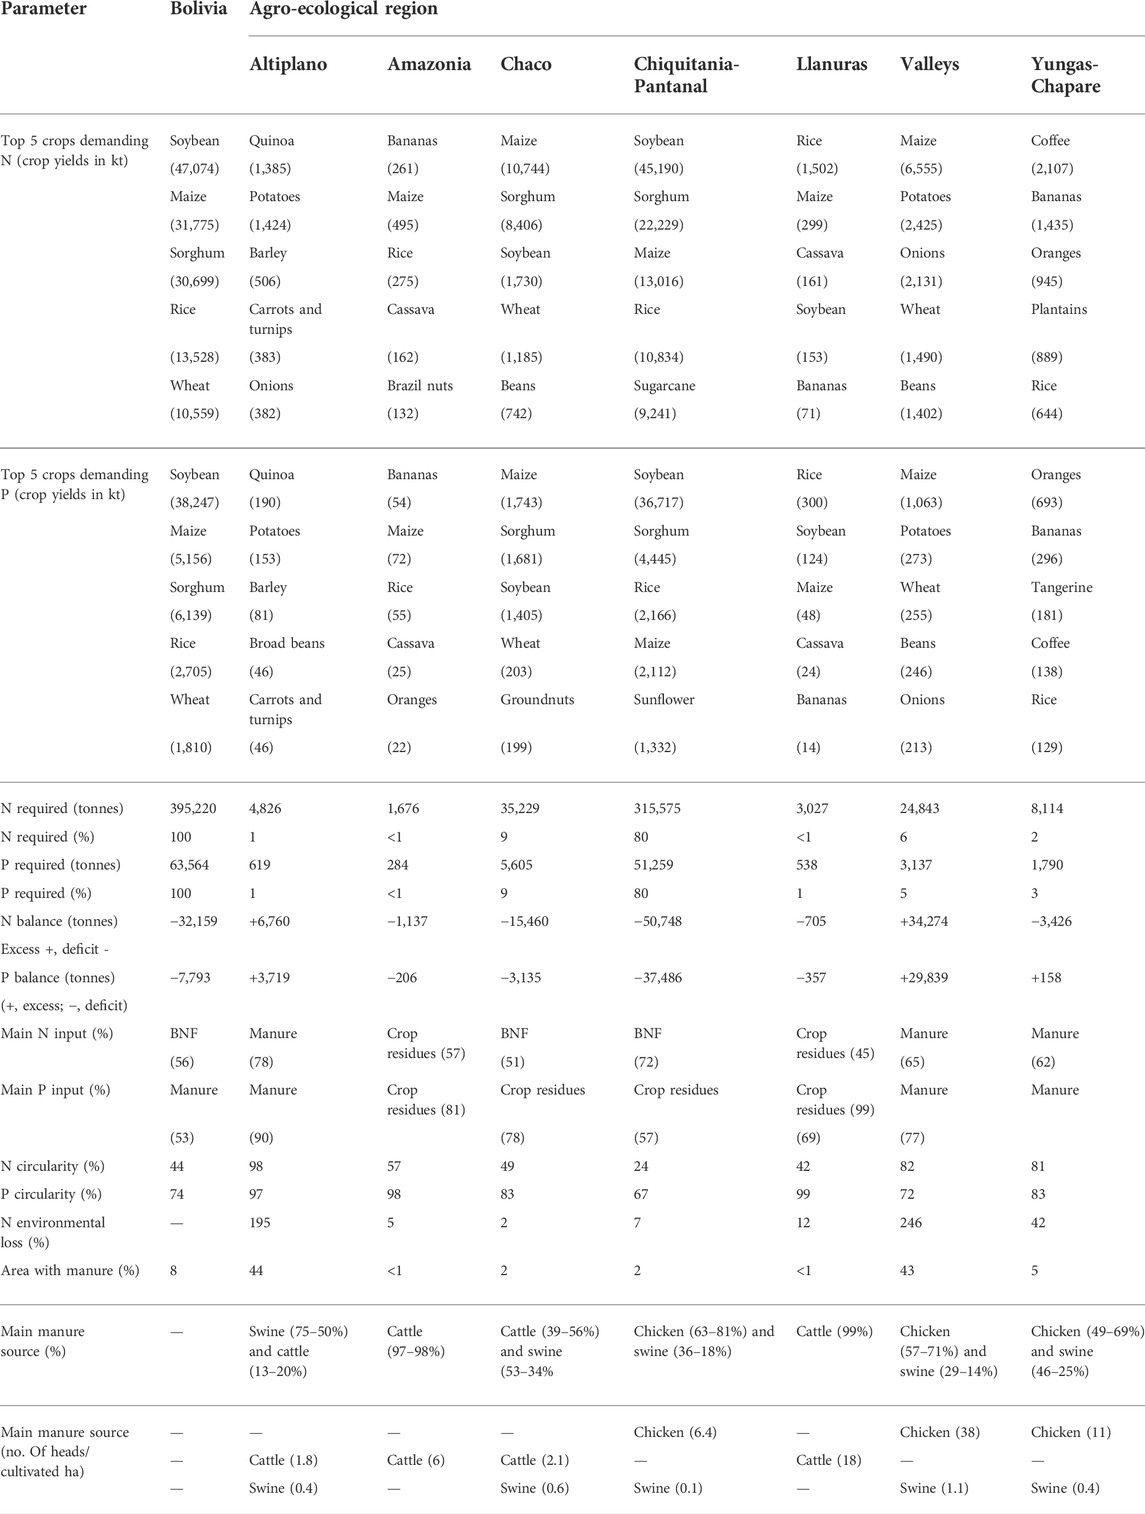
TABLE 3. Summary of parameters resulting from the mass balance for nitrogen and phosphorus in the agri-food system of Bolivia and its seven agro-ecological regions, with crop yields for 2018.
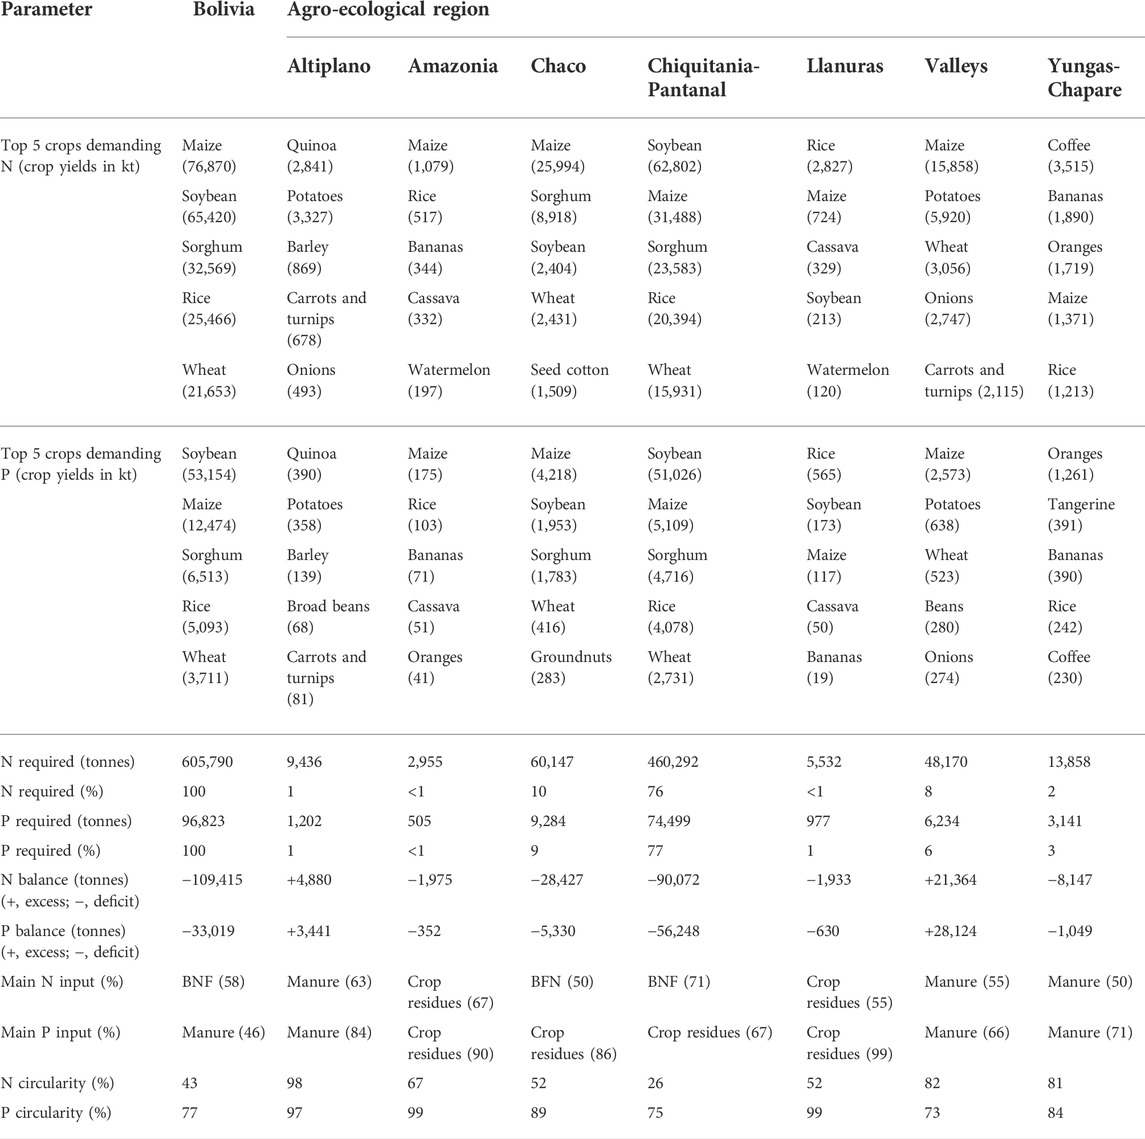
TABLE 4. Summary of parameters resulting from the mass balance for nitrogen and phosphorus in the agri-food system of Bolivia and its seven agro-ecological regions, with optimised crop yields (average yields in neighbouring countries) for 2018.
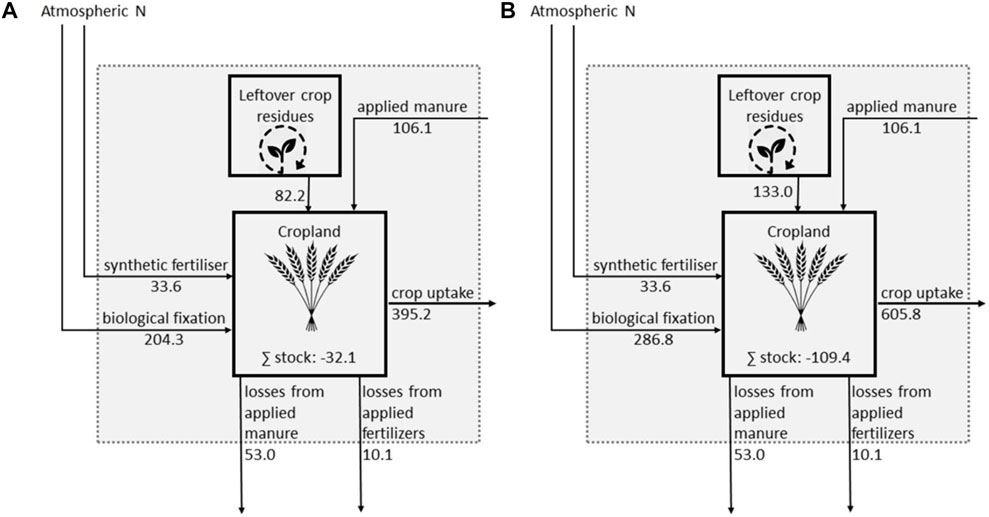
FIGURE 2. Mass balance for nitrogen in the agri-food system of Bolivia calculated using (A) crop yield data sourced from FAOSTAT database for the year 2018 (harvest.produce.actual) and (B) yield for the same crops in neighbouring countries (harvest.produce.optimum). The calculations show an apparent nitrogen deficit of 32 kt and a real nitrogen deficit of 110 kt in the agri-food system.
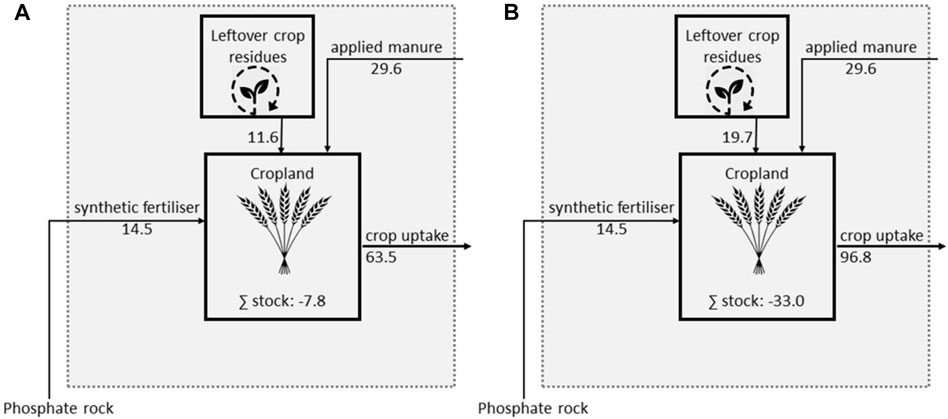
FIGURE 3. Mass balance for phosphorus in the agri-food system of Bolivia calculated using (A) crop yield data sourced from FAOSTAT database for the year 2018 (harvest.produce.actual) and (B) yield for the same crops in neighbouring countries (harvest.produce.optimum). The calculations show an apparent phosphorus deficit of 7.8 kt and a real phosphorus deficit of 33 kt in the agri-food system.
Although the top five crops in total yield (i.e., in tonnes) were sugarcane, soybean, maize, potato, and sorghum (Table 2), the five crops that demanded the largest N and P inputs were soybean, maize, sorghum, rice, and wheat (47, 31, 30, 13, and 10 kt for N, and 38, 5, 6, 2.7, and 1.8 kt for P, after accounting for biological nitrogen fixation and losses during application; see Table 3). The differences between the nutrient input required for maximising crop yields (Table 4) and the nutrient input received by crops in year 2018 (Table 3) were smallest for sorghum (6%) and soybean (28%), both of which are processed mainly to produce animal feed, but much larger (52% on average) for the staple crops wheat, rice, and maize.
Three agro-ecological regions (Chiquitania-Pantanal, Chaco, and the Valleys) accounted for nearly 90% of the nutrient demand (Table 3). About 65% of the cultivated area in Bolivia is found in the Chiquitania-Pantanal region (Table 2), which alone accounts for 80% of the nitrogen and phosphorus demand of the country (Table 3). This is because soybean, sorghum, and rice (three out of the five most cultivated and most nutrient-demanding crops grown) can only be cultivated in low-altitude agro-ecological regions (Figure 4). In contrast to Chiquitania-Pantanal, the Valleys region accounts for 10% of cultivated area but only 6 and 5% of the N and P demands of the country, respectively.
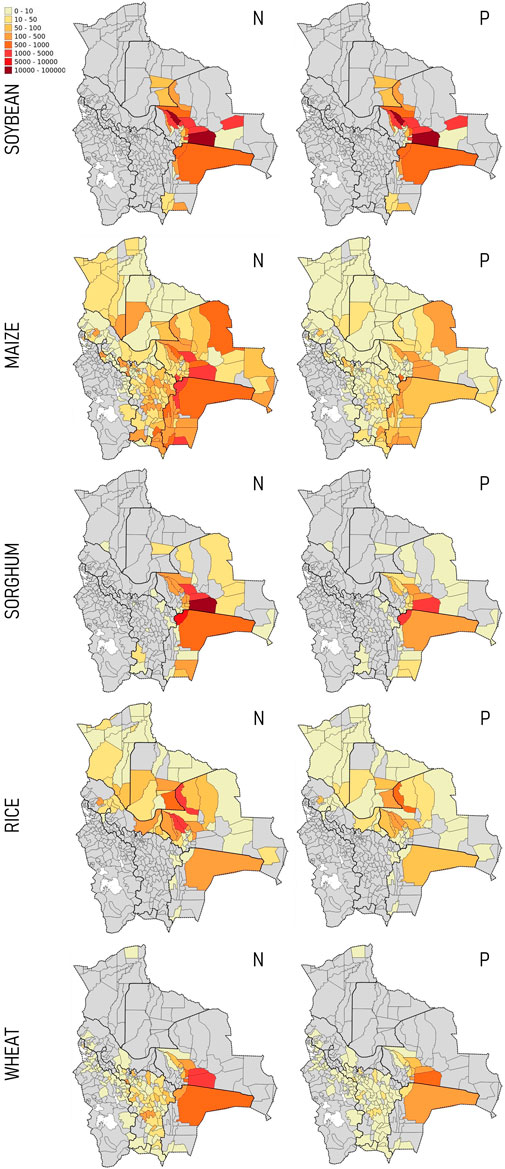
FIGURE 4. Nutrient requirements (kg) from the top five crops with highest nutrient demands produced in Bolivia in 2018, determined by mass balance. For nitrogen, the requirements shown resulted from subtracting the biologically fixed amount from the total demand. Requirements are shown at the municipality level. The seven agro-ecological regions are delimited with thicker lines.
In five out of the seven regions (excluding Altiplano and the Valleys), there are deficits of both the nutrients. The deficit is largest in Chiquitania-Pantanal, where there is a shortfall of 50 kt N and 37 kt P, followed by Chaco (15 kt N and 3.1 kt P) and Yungas-Chapare (deficit of 3.4 kt N but surplus of 0.1 kt P). In both the Valleys and the Altiplano, there are nutrient surpluses of approximately 41 kt of N and 33.5 kt of P.
According to the mass balance at the regional scale, there is discrepancy between the demand for nutrients and the nutrients harvested for some crops. For example, sugarcane is one of the five most cultivated crops in Amazonia, Chiquitania-Pantanal, and Llanuras, but is not among the top five nutrient-demanding crops, and it is the fifth largest crop in terms of nitrogen demand in Chiquitania-Pantanal (Table 3). This is also the case for tomato cultivation in the Valleys and for pineapple cultivation in Yungas-Chapare. Soybeans accounted for about 17% of the total nitrogen applied in Chiquitania-Pantanal, where almost all the country’s soybean crop is cultivated. Although it is a common approach when calculating nutrient demand (INIAF, ANAPO, CIAB, 2019) to focus on crops with the highest harvests, our findings suggest that this can be inaccurate in countries and regions where crops with high water content and low nutrient demand are produced at large scale.
3.2 Circularity
The main nitrogen input at national level was biological nitrogen fixation (204 kt, accounting for 47% of the total input) followed by manure (25%), crop residues (19%), and synthetic fertilizer (8%). For phosphorus, the main input was manure (29 kt, accounting for 53% of total input), followed by synthetic fertilizers (26%) and crop residues (21%). Therefore, the nutrient circularity of the Bolivian agri-food system (i.e., the proportion of nutrients recirculated to the nutrient inputs added during crop cultivation; see Eq. 4) was estimated to be 44% for nitrogen and 74% for phosphorus (Table 3).
In the two regions where there is surplus of both nutrients, the main nutrient input was animal manure (swine in the Altiplano and chicken in the Valleys), accounting for >65% of the total input (Table 3). In the two regions with the largest nutrient deficits (Chiquitania-Pantanal and Chaco), soybean was the most nutrient-demanding crop but also the main source of nitrogen input to the soil because of biological fixation (72 and 51% of the nitrogen inputs for Chiquitania-Pantanal and Chaco, respectively), while the crop residues left over after harvest were the main source of phosphorus (57 and 78% for Chiquitania-Pantanal and Chaco, respectively) (Table 3).
In regions with nutrient surpluses, the proportion of nutrients recirculated back to the food system was high, >95% in the Altiplano and >71% in the Valleys, respectively. This is likely because of the wider availability of manure across both these agro-ecological regions in comparison to that in the other five regions (Figure 5). In contrast, the estimated nutrient circularity in the two regions with the largest nutrient deficits was low, 24–67% for Chiquitania-Pantanal and 49–83% for Chaco.
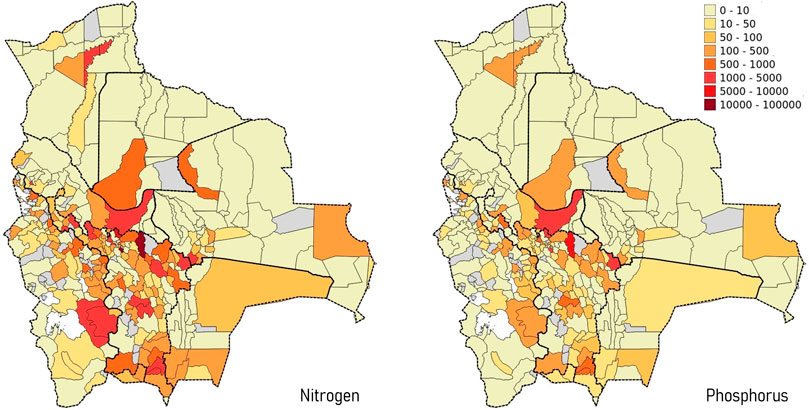
FIGURE 5. Availability of nutrients (kg) from manure in Bolivia in 2018, determined by mass balance. The seven agro-ecological zones are delimited with thicker lines.
3.3 Replacement potential of human excreta
In Bolivia, about 39 kt of nitrogen and 5 kt of phosphorus are available in human excreta (Figure 6). If all of the excreta were to be collected and recycled back to cropland, 100% of the nitrogen deficit and 64% of the phosphorus deficit of the current system (Table 3) could be met. Overall, the nutrients in excreta are equivalent to 20% of the nitrogen demand and 8% of the phosphorus demand of the agri-food system (Table 5). At the regional level, the replacement potential of excreta is higher in regions with large populations and low crop production. For example, 60% of the country’s population lives in the Altiplano and the Valleys, where only 16% of crop production occurs, so recycling either animal manure alone (the current practice; see Table 3) or human excreta alone in these regions can meet the majority of the nutrient demand (Table 5). Outside the Altiplano region, excreta would not be enough to meet nitrogen or phosphorus requirements. In Chiquitania-Pantanal, less than 10% of nutrient requirements could be met by recycling excreta.
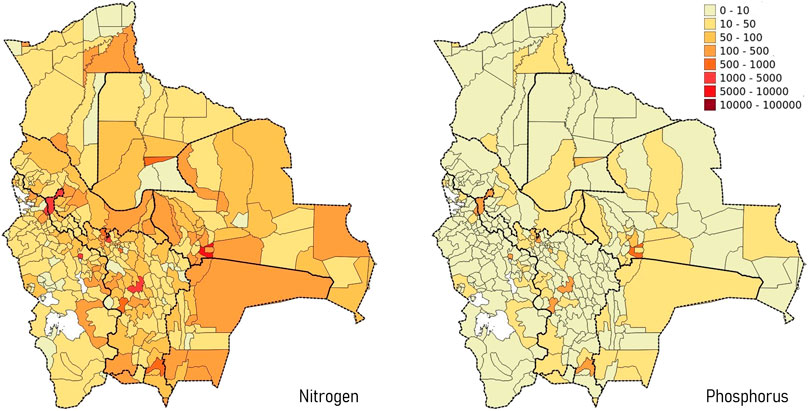
FIGURE 6. Availability of nutrients from human excreta in Bolivia in 2018, determined by mass balance. The seven agro-ecological zones are delimited with thicker lines.
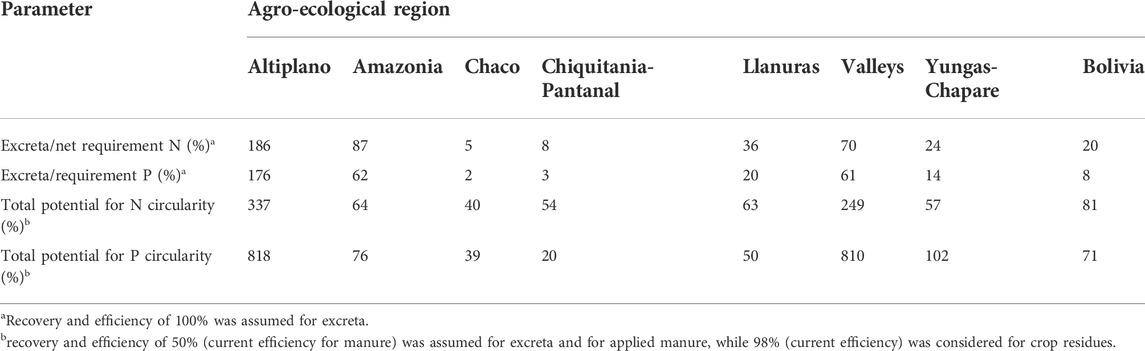
TABLE 5. Replacement potential of human excreta for nutrient requirements for agriculture in Bolivia in 2018. Net requirement of nitrogen refers to the requirement after subtracting the biologically fixed nitrogen.
4 Discussion
4.1 Nutrient demand and sufficiency in the bolivian agri-food system
The findings of this study suggest that 395 kt N and 65 kt P were required to support crop production in Bolivia for the year 2018. According to our mass balance calculations, there was an apparent deficit of 32 kt N and 8 kt P in crop production, which we cannot account for from the available data. The starting point of our calculations was the FAOSTAT (FAO, 2022) database where Bolivia reports the total yields of 45 different crops grown in the country. Thus, the total amounts of N and P in agricultural harvests are known, as are the total nutrient inputs to the food system in the form of biological fixation, manure, and synthetic fertiliser application. Therefore, it is unclear why the mass balance shows a nutrient deficit and/or how that deficit is being met.
There are several possible reasons for this deficit. First, the deficit may have been met with nutrient stocks in soil that become available during land use change (planned or unplanned conversion of forest land to agricultural land). There is evidence of deforestation in Bolivia linked to large-scale farming of industrial crops in agro-ecological zones where agriculture is practiced in close proximity to forest land (i.e., Amazonia, Chaco, and Chiquitania-Pantanal) (Müller et al., 2012; Ormachea, 2018). Second, the deficit could have been met through traditional agricultural practices (e.g., crop rotation, fallowing, etc.) for which there are no data, and which thus could not be accounted for. If these explanations hold, it would mean that the agri-food system is operating at a deficit that will ultimately result in depletion of soil nutrient stocks.
We also estimated that the true deficit in the Bolivian agri-food system is much higher than what the mass balance suggests, given the following two aspects. Firstly, if all crops received optimal nutrient application rates that maximised their yields, an additional 220 kt N and 32 kt P would be required. Secondly, the mass balance at the national level assumes that in regions that have nutrients in excess of the local demand, the surplus is collected and applied in regions that have a net deficit. If this is not the case, then there is an additional deficit of 53 kt N and 40 kt P. In the Chiquitania-Pantanal and Chaco regions alone, where 75% of the crop production occurs, the local deficit is approximately 15% for nitrogen but 70% for phosphorus. Addressing this deficit is vital because according to projections by Rivero Lobo and Aliaga Lordermann (2014), the production of proteins, fruits, and vegetables in Bolivia for 2018 could only meet 60–70% of the nutritional requirements of its population.
4.2 Nutrient recycling and circularity in the bolivian agri-food system
We found that less than half of the nitrogen applied or fixed in the cropland was recirculated in the food system, whereas three-quarters of the phosphorus was recirculated. However, there is great variation in nutrient circularity between the different agro-ecological zones. In zones where animal manure is the main nutrient input and livestock density is high, the circularity is also high (>0.9). This does not mean that all of the available nutrients are recycled, as there are surpluses of 41 kt N and 34 kt P in these zones, primarily in the Valleys (Table 3). Even if the surplus nutrients were to be recycled locally to optimise crop yields, there would still be excesses of 21 kt N and 28 kt P (Table 4). The surplus nutrients are equivalent to 40% of the N deficit and 75% of the P deficit in Chiquitania-Pantanal. Therefore, recycling nutrients from regions with a net surplus to regions with a net deficit could be one way to reduce the overall deficit, as well as to improve nutrient circularity and crop yields.
As in other developing countries that aim to increase food production, the agricultural strategy in Bolivia has focused on improving the access of farmers to synthetic fertilisers (INIAF, ANAPO, CIAB, (2019); Mnthambala et al., 2021). In 2017, a state-owned petrochemical plant was inaugurated in Bolivia to produce urea and ammonia. In 2022, the plant is expected to produce 600 kt of urea, of which about 7% will be sold locally and the rest exported to other Latin American countries (McNelly, 2020; BNAmericas, 2021). However, considering the true national N deficit (110 kt; see Table 4), urea fertiliser at the current application rate can only meet 20% of the N required to obtain optimal crop yields. About 40% of the industrial urea production would need to be sold domestically to have zero nitrogen deficit in the agri-food system. As of today, there is no domestic production of synthetic phosphate fertiliser in Bolivia, but the petrochemical plant intends to also produce monoammonium phosphate and diammonium phosphate.
4.3 Potential of human excreta-derived nutrients
Despite the domestic sale of urea, there are still total N and P deficits of 109 kt and 33 kt, respectively, in the agri-food system. If all the human excreta in Bolivia were to be collected and returned to cropland, the deficits can be reduced to 70 kt N and 28 kt P. This would significantly increase circularity, as excreta is a renewable source of nutrients. It would also improve the resilience in the food system against global events, e.g., disruptions in fertiliser supply chains seen during the COVID-19 pandemic (Amjath-Babu et al., 2020) and rise of fertiliser prices against a backdrop of rising natural gas prices (Hebebrand and Laborde, 2022).
Since >70% of the population in Bolivia lives in cities and urban areas, it could be possible to collect the majority of the nutrients available in excreta. For example, the population density in La Paz and El Alto is > 9,000 inhabitants/km2 (Parés-Ramos et al., 2013). However, much of the economic feasibility of transporting these nutrients to croplands surrounding the cities will depend on how excreta are collected, treated, stored, and applied (Simha et al., 2020). The feasibility of this increases if water is removed from excreta to concentrate the nutrients (Trimmer and Guest, 2018). A wide range of technologies are available to convert human excreta (Harder et al., 2019) or source-separated fractions like human urine (Vasiljev et al., 2022) and faeces (Musazura and Odindo, 2022) to concentrated fertilisers.
In this study, we assumed that 100% of the human excreta-derived nutrients can be recovered and returned to cropland. In practice, the recovery efficiency would be likely lower, especially depending on the choice of technology used to treat excreta or source-separated excreta fractions (Harder et al., 2019). Many technologies like alkaline dehydration are currently being optimised to recover >98% of the nitrogen and phosphorus contained within human urine (Vasiljev et al., 2022). However, our findings showed that even if excreta-derived nutrients are applied at current manure-like efficiencies (i.e. 50%), they would significantly improve the nutrient circularity of the agri-food system (Table 5).
5 Conclusions
Our calculations suggest that the Bolivian agri-food system is currently running on a nutrient deficit. It is likely that the nutrient stocks in soil (e.g., conversion of forests to cropland) are being used to cover the nutrient deficit in crop production, which is not sustainable long term. The real nutrient deficit is at least three-fold greater if we consider the nutrient demand required to optimize crop yields to be in line with those of neighbouring countries.
Around 44% of N and 74% of P are currently recirculated in the agri-food system, with livestock manure and crop residues being the major sources of the recirculated nutrients. As the national strategy to address the nutrient deficit is to increase the domestic production and application of synthetic fertilizers, nutrient circularity in the food system will likely decrease in the future.
We also found that both nutrient deficits and circularity differed considerably between the different agro-ecological zones. Recycling nutrients from regions with nutrient surpluses to regions with nutrient deficits could be a way to reduce overall deficits and increase overall circularity.
Based on the current crop yields, nutrients available in human excreta could meet 100 and 70% of the N and P apparent deficits, respectively. This suggests that excreta recycling could be one of the strategies to prevent deforestation and depletion of nutrient stocks in forests. Recycling excreta-derived nutrients would also contribute to increasing nutrient circularity and crop yields.
Data availability statement
The original contributions presented in the study are included in the article/Supplementary Material, further inquiries can be directed to the corresponding author.
Author contributions
LP-M and PS conceptualized the study. LP-M did the mass balance calculations with inputs from PS. CP-M developed the GIS maps. BV provided resources and acquired funding. LP-M and PS wrote the first draft of the manuscript. All authors contributed to manuscript revision, read and approved the submitted version.
Funding
This study was supported by grants from the Swedish Research Council for the projects “Urintorkning processoptimering och underliggande processer” (Grant number 2019–00986) and “UDT 2.0—Urine Dehydration Technology for Sanitation 2.0” (Grant Number 2018–05023).
Acknowledgments
The authors acknowledge the cooperation of Gabriel Barea Vargas, whose field knowledge on agricultural systems of the Chiquitania-Pantanal agroecological zone was essential for this study.
Conflict of interest
The authors declare that the research was conducted in the absence of any commercial or financial relationships that could be construed as a potential conflict of interest.
Publisher’s note
All claims expressed in this article are solely those of the authors and do not necessarily represent those of their affiliated organizations, or those of the publisher, the editors and the reviewers. Any product that may be evaluated in this article, or claim that may be made by its manufacturer, is not guaranteed or endorsed by the publisher.
Supplementary material
The Supplementary Material for this article can be found online at: https://www.frontiersin.org/articles/10.3389/fenvs.2022.956325/full#supplementary-material
References
Akram, U., Quttineh, N.-H., Wennergren, U., Tonderski, K., and Metson, G. S. (2019). Enhancing nutrient recycling from excreta to meet crop nutrient needs in Sweden–a spatial analysis. Sci. Rep. 9, 10264. doi:10.1038/s41598-019-46706-7
Ali, Q., Ashraf, S., Kamran, M., Ijaz, M., Rehman, A., Tahir, M., et al. (2019). “Organic manuring for agronomic crops,” in Agronomic crops (Springer), 163
Alvar-Beltrán, J., Napoli, M., Dao, A., Ouattara, A., Verdi, L., Orlandini, S., et al. (2021). Nitrogen, phosphorus and potassium mass balances in an irrigated quinoa field. Italian Journal of Agronomy.
Amjath-Babu, T. S., Krupnik, T. J., Thilsted, S. H., and McDonald, A. J. (2020). Key indicators for monitoring food system disruptions caused by the COVID-19 pandemic: insights from Bangladesh towards effective response. Food Secur. 12, 761–768. doi:10.1007/s12571-020-01083-2
Antikainen, R., Lazarevic, D., and Seppälä, J. (2018). “Circular economy: origins and future orientations,” in Factor X (Springer), 115–129.
ASAE (2005). Manure production and characteristics. St. Joseph, Michigan, USA: American Society of Agricultural Engineers ASAE.
Awodun, M. A., Omonijo, L. I., and Ojeniyi, S. O. (2007). Effect of goat dung and NPK fertilizer on soil and leaf nutrient content, growth and yield of pepper. Int. J. Soil Sci. 2, 142–147. doi:10.3923/ijss.2007.142.147
BNAmericas, (2021). Restart of PAU operations in Bolivia projects income of up to $ 22 million per month from the sale of urea. [WWW Document]. BNAmericas. URL https://www.bnamericas.com/en/news/restart-of-pau-operations-in-bolivia-projects-income-of-up-to--22-million-per-month-from-the-sale-of-urea (accessed 23 2, 22).
Brown, C. (2013). Available nutrients and value for manure from various livestock types. Ontario Ministry of Agriculture, Food and Rural Affairs, Ontario, Canada. https://fieldcropnews.com/wp-content/uploads/2015/03/Nutrient-Value-of-Manure.pdf.
Chowdhury, R. B., Moore, G. A., Weatherley, A. J., and Arora, M. (2014). A review of recent substance flow analyses of phosphorus to identify priority management areas at different geographical scales. Resour. Conservation Recycl. 83, 213–228. doi:10.1016/j.resconrec.2013.10.014
Crisóstomo, L. A., and Naumov, A. (2009). Adubando para alta produtividade e qualidade: Fruteiras tropicais do brasil. Fortaleza, Brazil: Embrapa Agroindústria Tropical-Livro científico ALICE. Available at: https://www.alice.cnptia.embrapa.br/bitstream/doc/658334/1/LV09002.pdf.
da Cunha, J. F., Bohac, E. A., and Prochnow, L. I. (2018). Balanco de nutrientes na agricultura brasileira no periodo de 2013 a 2016. Inf. Agron., 3.
de Sousa, D. M. G., and Lobato, E. (2004). Cerrado: correção do solo e adubaçãoEmbrapa Informação Tecnológica; Embrapa Cerrados, Brasilia DF, Brazil. 2nd ed.
Elser, J., and Bennett, E. (2011). A broken biogeochemical cycle. Nature 478, 29–31. doi:10.1038/478029a
FAO (1996). Agro-ecological zoning: Guidelines. Rome, Italy: Food & Agriculture Organization of the United Nations FAO.
FAO (2022). Faostat. Food and Agriculture Organization. License: CC BY-NC-SA 3.0 IGO [WWW Document]. Available at: https://www.fao.org/faostat/en/#data (accessed 21 2, 22).
Faquin, V. (2004). Nutrição mineral e diagnose do estado nutricional das hortaliças. Universidade Federal de Lavras (UFLA) - FAEPE (Fundacao de apoio ao ensino, pesquisa e extensao), Lavras, Minas Gerais. Brazil Available at: https://dcs.ufla.br/images/imagens_dcs/pdf/Prof_Faquin/Nutricao_mineral_diagnose_hortalicas2_ed.pdf.
Farmer, A. M. (2018). Phosphate pollution: A global overview of the problem. Phosphorus: Polluter and Resource of The Future—Removal and Recovery From WastewaterSchaum, C., 35–55.
Guareschi, R. F., Boddey, R. M., Alves, B. J. R., Sarkis, L. F., Martins, M., dos, R., et al. (2019). Balanço de nitrogênio, fósforo e potássio na agricultura da américa latina e o caribe. Terra 37, 105. doi:10.28940/terra.v37i2.423
Haifa-group (2021). Crop guide. [WWW Document]. Available at: https://haifa-group.com/ (accessed 20 4, 21).
Halliday, D. J., and Trenkel, M. E. (1992). IFA world fertilizer use manual. International fertilizer industry association Paris.
Hanserud, O. S., Brod, E., Øgaard, A. F., Müller, D. B., and Brattebø, H. (2016). A multi-regional soil phosphorus balance for exploring secondary fertilizer potential: The case of Norway. Nutr. Cycl. Agroecosyst. 104, 307–320. doi:10.1007/s10705-015-9721-6
Harder, R., Wielemaker, R., Larsen, T. A., Zeeman, G., and Öberg, G. (2019). Recycling nutrients contained in human excreta to agriculture: Pathways, processes, and products. Crit. Rev. Environ. Sci. Technol. 49, 695–743. doi:10.1080/10643389.2018.1558889
Hebebrand, C., and Laborde, D. (2022). High fertilizer prices contribute to rising global food security concerns [WWW Document]. URL https://www.ifpri.org/blog/high-fertilizer-prices-contribute-rising-global-food-security-concerns#:∼:text=High%20prices%20of%20both%20ammonia,in%202021%20and%20into%202022 (accessed 27 4, 21).
INIAF, ANAPO, CIAB (2019). Plan nacional de fertilización y nutrición vegetal 2019-2025. La Paz, Bolivia: Instituto nacional de innovación agrícola y forestal INIAF.
Intrepid-potash, (2021). Naturally balanced nutrition for tobacco. [WWW Document]. Availabel at: www.intrepidpotash.com/tobacco/ (accessed 20 4, 21).
Jönsson, H., and Vinnerås, B. (2003). “Adapting the nutrient content of urine and faeces in different countries using FAO and Swedish data,” in Proceedings from the 2nd international symposium on ecological sanitation (Luebeck, Germany.
Klein, K., Torrico Albino, J. C., and Schlueter, S. (2017). Insights into the potato value chain of Bolivia-Market potentials for integrating native varieties in the context of Food Security. CienciAgro 7 , 69–76.
Klinglmair, M., Lemming, C., Jensen, L. S., Rechberger, H., Astrup, T. F., Scheutz, C., et al. (2015). Phosphorus in Denmark: National and regional anthropogenic flows. Resour. Conservation Recycl. 105, 311–324. doi:10.1016/j.resconrec.2015.09.019
Lal, R. (2009). “Use of crop residues in the production of biofuel,” in Handbook of waste management and Co-product recovery in food processing (Elsevier), 455.
Mayer, B. K., Baker, L. A., Boyer, T. H., Drechsel, P., Gifford, M., Hanjra, M. A., et al. (2016). total value of phosphorus recovery. Environ. Sci. Technol. 50, 6606–6620. doi:10.1021/acs.est.6b01239
McNelly, A. (2020). Neostructuralism and its class character in the political economy of bolivia under evo morales. New Polit. Econ. 25, 419–438. doi:10.1080/13563467.2019.1598962
Mihelcic, J. R., Fry, L. M., and Shaw, R. (2011). Global potential of phosphorus recovery from human urine and feces. Chemosphere 84, 832–839. doi:10.1016/j.chemosphere.2011.02.046
Ministry for planning of development, B. (2016). Lineamientos metodológicos para la formulación de planes de gestión territorial comunitaria. La Paz, Bolivia: Ministry for Planning of Development.
MMAyA, (2020). Estrategia nacional de tratamiento de aguas residuales. La Paz, Bolivia: Ministerio de medio ambiente y agua.
Mnthambala, F., Tilley, E., Tyrrel, S., and Sakrabani, R. (2021). Phosphorus flow analysis for Malawi: Identifying potential sources of renewable phosphorus recovery. Resour. Conservation Recycl. 173, 105744. doi:10.1016/j.resconrec.2021.105744
Morato, T., Vaezi, M., and Kumar, A. (2019). Developing a framework to optimally locate biomass collection points to improve the biomass-based energy facilities locating procedure–a case study for Bolivia. Renew. Sustain. Energy Rev. 107, 183–199. doi:10.1016/j.rser.2019.03.004
Morée, A. L., Beusen, A. H. W., Bouwman, A. F., and Willems, W. J. (2013). Exploring global nitrogen and phosphorus flows in urban wastes during the twentieth century. Glob. Biogeochem. Cycles 27, 836–846. doi:10.1002/gbc.20072
Müller, R., Müller, D., Schierhorn, F., Gerold, G., and Pacheco, P. (2012). Proximate causes of deforestation in the Bolivian lowlands: an analysis of spatial dynamics. Reg. Environ. Change 12, 445–459. doi:10.1007/s10113-011-0259-0
Musazura, W., and Odindo, A. O. (2022). Characterisation of selected human excreta-derived fertilisers for agricultural use: a scoping review. J. Clean. Prod. 339, 130516. doi:10.1016/j.jclepro.2022.130516
Ormachea, E. (2018). Tierras y producción agrícola: A 13 años del gobierno del mas. La Paz, Bolivia: CEDLA.
Papangelou, A., and Mathijs, E. (2021). Assessing agro-food system circularity using nutrient flows and budgets. J. Environ. Manag. 288, 112383. doi:10.1016/j.jenvman.2021.112383
Parés-Ramos, I. K., Álvarez-Berríos, N. L., and Aide, T. M. (2013). Mapping urbanization dynamics in major cities of colombia, ecuador, perú, and bolivia using night-time satellite imagery. Land (Basel) 2, 37–59. doi:10.3390/land2010037
Perez-Mercado, L. F., Lalander, C., Joel, A., Ottoson, J., Iriarte, M., Vinnerås, B., et al. (2022). Managing microbial risks in informal wastewater-irrigated agriculture through irrigation water substitution. Agric. Water Manag. 269, 107733. doi:10.1016/j.agwat.2022.107733
Pires, A. L., and Portela, E. (2007). Assessment of nutrient outputs in chestnut groves: fruit and pruned biomass. Acta Hortic. 815, 75–82. doi:10.17660/actahortic.2009.815.10
Randive, K., Raut, T., and Jawadand, S. (2021). An overview of the global fertilizer trends and India’s position in 2020. Min. Econ. 34, 371–384. doi:10.1007/s13563-020-00246-z
Rivero Lobo, B., and Aliaga Lordermann, J. (2014).Disponibilidad, consumo y utilización biológica de alimentos en Bolivia: análisis y perspectivas (1990-2030). Revista Latinoamericana de Desarrollo Económico 161–198.
Roy, R. N., Finck, A., Blair, G. J., and Tandon, H. L. S. (2006). Plant nutrition for food security. a guide for integrated nutrient management. FAO Fertilizer Plant Nutr. Bull. 16, 368.
Senthilkumar, K., Nesme, T., Mollier, A., and Pellerin, S. (2012). Regional-scale phosphorus flows and budgets within France: the importance of agricultural production systems. Nutr. Cycl. Agroecosyst. 92, 145–159. doi:10.1007/s10705-011-9478-5
Silveti, D., and Andersson, K. (2019). Challenges of governing off-grid “Productive” sanitation in peri-urban areas: Comparison of case studies in Bolivia and south africa. Sustainability 11, 3468. doi:10.3390/su11123468
Simha, P., Senecal, J., Gustavsson, D. J. I., and Vinnerås, B. (2020). “Resource recovery from wastewater: A new approach with alkaline dehydration of urine at source,” in Current developments in biotechnology and bioengineering (Elsevier), 205–221.
Smit, A. L., Van Middelkoop, J. C., Van Dijk, W., and Van Reuler, H. (2015). A substance flow analysis of phosphorus in the food production, processing and consumption system of the Netherlands. Nutr. Cycl. Agroecosyst. 103 (1), 1–13. doi:10.1007/s10705-015-9709-2
Steffen, W., Richardson, K., Rockström, J., Cornell, E., Fetzer, I., Bennett, E., et al. (2015). Sustainability. Planetary boundaries: guiding human development on a changing planet. Science 347, 1259855. doi:10.1126/science.1259855
Tito-Velarde, C., and Wanderley, F. (2021). Contribución de la agricultura familiar campesina e indígena a la producción y consumo de alimentos en Bolivia. La Paz, Bolivia: Cuadernos de Investigación. CIPCA; IISEC-UCB.
Torma, S., Vilček, J., Lošák, T., Kužel, S., and Martensson, A. (2018). Residual plant nutrients in crop residues–an important resource. Acta Agric. Scand. Sect. B —. Soil & Plant Sci. 68, 358–366. doi:10.1080/09064710.2017.1406134
Trimmer, J. T., and Guest, J. S. (2018). Recirculation of human-derived nutrients from cities to agriculture across six continents. Nat. Sustain. 1, 427–435. doi:10.1038/s41893-018-0118-9
UN (2019). World population prospects [WWW Document]. United Nations Department of Economics and Population Affairs–Population Dynamics. URLAvailable at: https://population.un.org/wpp/ (accessed 27 2, 22).
Un-Water, (2021). Summary Progress Update 2021 – SDG 6 – water and sanitation for all. Geneva, Switzerland: United Nations Water.
van der Wiel, B. Z., Weijma, J., van Middelaar, C. E., Kleinke, M., Buisman, C. J. N., Wichern, F., et al. (2019). Restoring nutrient circularity: a review of nutrient stock and flow analyses of local agro-food-waste systems. Resour. Conservation Recycl. X 3, 100014. doi:10.1016/j.rcrx.2019.100014
van Puijenbroek, P., Beusen, A. H. W., and Bouwman, A. F. (2019). Global nitrogen and phosphorus in urban waste water based on the Shared Socio-economic pathways. J. Environ. Manag. 231, 446–456. doi:10.1016/j.jenvman.2018.10.048
Vasiljev, A., Simha, P., Demisse, N., Karlsson, C., Randall, D. G., Vinnerås, B., et al. (2022). Drying fresh human urine in magnesium-doped alkaline substrates: Capture of free ammonia, inhibition of enzymatic urea hydrolysis & minimisation of chemical urea hydrolysis. Chem. Eng. J. 428, 131026. doi:10.1016/j.cej.2021.131026
Verbyla, M. E., Symonds, E. M., Kafle, R. C., Cairns, M. R., Iriarte, M., Mercado Guzmán, A., et al. (2016). Managing microbial risks from indirect wastewater reuse for irrigation in urbanizing watersheds. Environ. Sci. Technol. 50, 6803–6813. doi:10.1021/acs.est.5b05398
Vinnerås, B., Palmquist, H., Balmér, P., and Jönsson, H. (2006). The characteristics of household wastewater and biodegradable solid waste—a proposal for new swedish design values. Urban Water J. 3, 3–11. doi:10.1080/15730620600578629
Keywords: circular economy, fertilizer, manure, nitrogen budget, phosphorus, soybean, sustainable food production, wastewater
Citation: Perez-Mercado LF, Perez-Mercado CA, Vinnerås B and Simha P (2022) Nutrient stocks, flows and balances for the Bolivian agri-food system: Can recycling human excreta close the nutrient circularity gap?. Front. Environ. Sci. 10:956325. doi: 10.3389/fenvs.2022.956325
Received: 30 May 2022; Accepted: 04 July 2022;
Published: 25 July 2022.
Edited by:
Kangning Xu, Beijing Forestry University, ChinaReviewed by:
Yan Xu, Agro-Environmental Protection Institute (CAAS), ChinaFroggi R. M. VanRiper, Oregon State University, United States
Cissy Lavadenz, University of Science and Technology Beijing, China
Copyright © 2022 Perez-Mercado, Perez-Mercado, Vinnerås and Simha. This is an open-access article distributed under the terms of the Creative Commons Attribution License (CC BY). The use, distribution or reproduction in other forums is permitted, provided the original author(s) and the copyright owner(s) are credited and that the original publication in this journal is cited, in accordance with accepted academic practice. No use, distribution or reproduction is permitted which does not comply with these terms.
*Correspondence: Prithvi Simha, Prithvi.Simha@slu.se