Multi-variable assessment of green stormwater infrastructure planning across a city landscape: Incorporating social, environmental, built-environment, and maintenance vulnerabilities
 Kate Homet
 Peleg Kremer
 Virginia Smith
 Stephen Strader1†
- 1Department of Geography and the Environment, Villanova University, Villanova, PA, United States
- 2Department of Civil and Environmental Engineering, Villanova University, Villanova, PA, United States
Green stormwater infrastructure (GSI) is an increasingly popular tool to meet federal water regulations for stormwater quality and quantity, while assuaging urban flooding. While cities across the United States implement GSI into their planning processes, they are also potentially affecting the local communities that are receiving these GSI through social, ecological, physical, and economic impacts. Flooding is impacting urban communities by damaging homes and infrastructure, degrading ecosystems, and exacerbating social inequities. In the planning process, there is an acute need for the consideration of the equitable distribution of GSI in addition to technical and engineering needs. This study examines multiple aspects of vulnerability to local flooding impacts—social, environmental, and infrastructural—across a city landscape to identify those communities that have a greater need for GSI. Given the city of Philadelphia is a leader in GSI implementation in the United States, we use it as our research setting where we create citywide, multifaceted vulnerability indices that account for the spatial distribution of social, built environment, and maintenance vulnerabilities to flooding events. In addition to these indices, a GSI type decision table was created to suggest more equitable placements of different GSI types based on their maintenance needs and expected co-benefits. The results of this study reveal unequal distribution of social and built-environment vulnerabilities in the city at the Census block group scale, with high social vulnerability consistently spread across the central, southwest, and northwest neighborhoods of Philadelphia. Potential areas of severe GSI maintenance impacts appear to be concentrated in the downtown neighborhoods, while overall vulnerability appears elevated throughout the downtown and northwest neighborhoods. These results indicate that some communities in Philadelphia are highly vulnerable and should be prioritized for GSI implementation. In addition, the type of GSI implemented should be optimized to address the specific vulnerability impacts in different areas. A multifaceted vulnerability approach to planning can be applied in multiple areas of climate adaptation equity, with future studies continuing to update and add more dimensions of vulnerability where and when applicable.
Introduction
Planning for adaptation and resilience to climate change impacts has been growing across the United States in recent years as a response to increased environmental disasters and intensifying climate events (Priemus and Rietveld, 2009). In fact, the impacts from flooding events can cause a rise in planning and mitigation efforts (Steis Thorsby et al., 2020; Meerow, 2021). In urban areas, where the local environment is largely impervious, and local watersheds have experienced significant changes, these increasing climate events are becoming significantly more dangerous. These events often cause physical damage as well as further exacerbate social, environmental, and economic issues (Lavell et al., 2012). Flooding disaster events in the United States alone has cost an average total of $3.9 billion USD per year (Consumer Price Index-adjusted) since 1980. While large flood events can cause great harm, localized flooding and heavy precipitation can also cause significant damage to smaller communities (Chen et al., 2020). Research suggests that increases in heavy rainfall events will become more common due to increased heat (i.e., atmospheric instability) and water vapor in the atmosphere. Increased heavy rainfall, combined with increased surface runoff contribute to a greater risk of flooding events (Trenberth, 1999). The impacts from climate-related flooding can be devastating and can often be found even outside our projected floodplains (Dottori et al., 2018; Yang et al., 2020), but these impacts could also be mitigated and decreased through more robust and fine-scale hazard planning (Armal et al., 2020). Not only does flood mitigation and stormwater control need to be considered in adaptation planning, but also the numerous effects on equity and environmental justice that come with structures such as GSI.
Flooding vulnerabilities
Impacts from flooding can vary widely including damage to property, infrastructure, ecosystem loss, and human health. This study defines “impact(s)” as any effect, benefit, or contribution to the functionality of GSI or any effect, benefit, or contribution that GSI has on a community. As rainfall frequency and intensity increases due to climate change, the risk of flooding increases (van der Wiel et al., 2017). For example, urban flooding has increased in recent years due to more intense precipitation events combined with the highly complex and dynamic urban landscapes (Cao et al., 2022). Flooding is exacerbated by impervious landcover among many other landscape changes in large cities (Jarden et al., 2016). Urban areas will continue to change with increasing urban populations and amplifying rainfall rates or intensities which could impact community health along with overwhelming urban drainage systems (Mailhot and Duchesne, 2010; United Nations Population Fund, 2014).
Recently, the United States Atlantic tropical storm season has illustrated the devastating consequences of landfalling hurricanes and tropical cyclones within a warming world, especially as it relates to inland precipitation (Maxwell et al., 2021). As rainfall rates are expected to climb, tropical storms are expected to increase in intensity (Trenberth, 2011; Walsh et al., 2016). Simultaneously, research has shown that the translational speed of landfalling tropical storms has slowed since 1949 due to the effects of climate change (Kossin, 2018). In other words, hurricanes are becoming wetter while slowing down. Hurricane Harvey is a prime example of this effect given it made landfall near Houston, TX, subsequently stalled, and produced record-breaking precipitation totals (150 + cm (60 + inches) in 4 days) and disastrous urban flooding (Blake & Zelinsky, 2017). While many GSI are not designed to mitigate major flooding events like those caused by tropical storms and hurricanes, the lack of stormwater infrastructure to deal with these events and the damage they can cause to existing GSI needs to be addressed at the planning level. Another increasingly-evident flood risk is a cloudburst event—a storm that produces intense rainfall over a short time period (Rosenzweig et al., 2019). The city of Copenhagen, Denmark developed a Cloudburst Management Plan in 2012 to keep extreme rainfall events in mind when adapting the city for changing climates (Baykal, 2012). After an extreme cloudburst hit the city on 2 July 2011, causing more than 15 cm of rain to fall in just 2 hours, the need to update stormwater infrastructure had become critical (American Society of Landscape Architects, 2016).
Cities such as Philadelphia and New York, which were both heavily impacted by storm events like Hurricane Ida (Diaz & Chappell, 2021), have growing GSI programs that are rendered useless in terms of flood control during these types of events (McPhillips et al., 2021). This is largely due to the choice to design GSI solely for the control of the first few centimeters of rainfall during a precipitation event along with improving water quality to meet municipal storm sewer system (MS4) regulations. The MS4 programs in Pennsylvania, for example, are managed by the Pennsylvania Department of Environmental Protection which requires municipal stormwater systems to meet state and federal stormwater requirements. The focus of the MS4 program being the management of discharge into public waterways through educational programming and the implementation of best management practices (Southwestern Pennsylvania Commission Water Resource Center, 2016). This program targets minimizing runoff and pollution but may lean more towards the control of nuisance flooding rather than targeting the increasingly damaging larger rainfall events (plaNYC, 2008; City of Philadelphia, 2011). These heavy precipitation storms, combined with the distribution of populations and the built environment, can be what drive the vulnerabilities of certain areas according to the expanding bull’s-eye effect, a concept that points to the risks of expanding urban development into suburban and rural areas which can increase the potential for disaster during a storm event (Ashley and Strader, 2016; Ferguson and Ashley, 2017).
Built-environment vulnerabilities
The Environmental Protection Agency defines the built environment as ‘the man-made or modified structures that provide people with living, working, and recreational spaces’ (Environmental Protection Agency, 2020). Urban communities are increasingly vulnerable to flood risk when areas lack access to basic technical infrastructure and have poor housing conditions. Poor housing conditions often refer to inadequate housing which is occupied housing structures that have moderate or severe physical problems such as plumbing, heating, or electricity issues (Raymond et al., 2011). Also, there is often an intersection between social and physical vulnerabilities (Krellenberg et al., 2016). Built-environment entities impacted by flood events could include infrastructure such as buildings, railroads, bridges, transportation networks, water treatment plants, and wastewater plants (Nofal and van de Lindt, 2020). This can also include areas of impervious surface such as roadways, sidewalks, rooftops, and buildings, all of which create a greater area of surface runoff. This increased area can contribute to more frequent and severe flooding (Brody et al., 2008). The built environment and resulting impervious surfaces also result in floods that peak more quickly due to the compressed time between the peak of precipitation and peak of runoff volume (Hirsch et al., 1990).
Physical and structural impacts from flooding could include infrastructure damage, loss of business, loss of public services, public health concerns, environmental risks, and potential human harm. In previous literature, flooding hazards for buildings have been characterized and modeled as water depth, water flow velocity, and flood rise rate (Custer and Nishijima, 2015) which can impact building components such as walls, windows, doors, roofs, basements, and appliances in different ways. In some cases, flood prevention measures for buildings are never even put into place if there is not enough education around floodplains or if residents are unable to properly prepare (Koks et al., 2015). While these impacts may be immediate and visible, they are not the only results from damage to the built environment. If infrastructure is affected, that could result in continuing ramifications like economic losses and social issues such as long-term health impacts, resident migration, and even loss in trust of local governments (Nofal and van de Lindt, 2020).
During a flooding event, many factors relating to the natural, built, and socioeconomic environment can contribute to increased rates of deaths and injuries, especially for those in low income or minority populations (Zahran et al., 2008). While physical infrastructure can pose a significant risk for damage during an urban flooding event, the stability and safety of the built environment also goes hand in hand with the people and neighborhoods that surround this infrastructure (Nofal and van de Lindt, 2020). To address these potential issues, urban areas need to continue placing GSI in neighborhoods that could benefit from flood control as well as the co-benefits offered by this infrastructure.
Social vulnerabilities
When discussing potential GSI benefits for cities, the demographics, ecological, and socioeconomic impacts are often not at the forefront of planning nor are they well understood within the politics of planning (Meerow, 2020). Urban areas can have very diverse demographics and environmental vulnerabilities (Cutter, 2002). In addition, there also tends to be an unequal distribution of factors that can compound existing vulnerabilities in communities during severe environmental or weather-related events (Shade et al., 2020). For instance, elderly populations have been shown to have health risks from extreme heat and humidity, especially with increased urban heat islands in cities with many impervious surfaces (Kovats et al., 2010; Romero-lankao et al., 2012). Groups with similar heat risks include sick and impoverished populations, with larger risks of dehydration that are often unable to afford cooling systems (McMichael, 2000). The basic social demographics often utilized by urban planners such as age, income, and race can overshadow other equally important areas of socioeconomic vulnerability such as proximity to schools, transit stops, or other critical infrastructure (Christman et al., 2018).
Romero-lankao et al. (2012) conceptualized six different functions that guided residents in urban areas to be impacted by climate change, with two of those functions being sensitivity and adaptive capacity. They defined sensitivity as ‘the degree to which subsets of urban populations are susceptible to hazards with patterns of susceptibility often based on demographic characteristics or medical conditions and adaptive capacity as “the ability to avoid or lessen the negative consequences of climate changed based on access to resources … ” (Romero-lankao et al., 2012, pp 671) both of which can be characterized as areas of social vulnerability. These functions are often defined by obvious social demographics such as age, income, health or preexisting conditions. But they are also heavily influenced by factors such as access to social networks and health services, home types and quality of housing (Romero-lankao et al., 2012).
The vulnerabilities associated with climate-related risks tend to amplify existing structural and social inequalities (Krellenberg et al., 2016), which can be societal, physical, infrastructural, and even political in nature (Bull-Kamanga et al., 2003; Heinrichs et al., 2013; Krellenberg et al., 2016). Tackling the issues of equity when it comes to GSI implementation is a big hurdle that requires a greater understanding of how planners can avoid exacerbating these areas of urban vulnerability.
Green stormwater infrastructure vulnerabilities (maintenance)
The importance of GSI maintenance impacts has only recently begun to be addressed within literature (Wadzuk et al., 2021a; Wadzuk et al., 2021b; Homet et al., 2022). The efficiency and longevity of GSI can be directly linked to GSI maintenance and care, which increases the need for greater maintenance research and planning. Without regular upkeep, many GSI sites develop issues, such as clogging and sedimentation, which could prevent proper stormwater capture (Holt, 2021; Smith et al., 2021). Previously, studies have started to show the importance of maintenance by observing these common clogging mechanisms like litter, sediment, and vegetative debris (Hunt, Lord, and Smith 2005; Seattle Public Utilities 2009; Homet et al., 2022). In addition, GSI installations have been shown to fail due to designs focused on GSI aesthetics rather than stormwater processing, often leading to an underestimation of maintenance impacts (Backhaus and Fryd, 2013). The ability to account for local maintenance needs is a critical component for successful GSI implementation (Herrera et al., 2017).
Understanding the maintenance needs for GSI is a critical step in the planning stage of any implementation. These can influence cost, effectiveness, durability, and the local communities that host GSI. To avoid settling into a rhythm of reactive maintenance, municipalities need to commit to routine maintenance for these types of infrastructure. Additionally, there needs to be a better understanding of the maintenance variables that align with each type of GSI to effectively treat and maintain a system. Prior to any installation of GSI, it is critical to have a thorough understanding of the potential location of any GSI site and the surrounding community. This allows for a more accurate assessment of potential maintenance needs and both financial, environmental, and social costs. Research is starting to indicate that focusing on the placement of GSI can be one of the greatest factors contributing to an infrastructure’s overall success and longevity (Golden and Hoghooghi, 2018). Impacts such as sediment, clogging, vegetation, trash, erosion, invasive species, wildlife, and even vandalism are among the many different factors that can affect how GSI function during a precipitation event (Philadelphia Water Department, 2012). While research on the impacts to GSI maintenance and longevity is ongoing, there is still much to be studied in terms of specific vulnerabilities and how GSI can be planned with those impacts in mind.
GSI type and vulnerability
One area of GSI planning that is not well researched is that of GSI types and how multifaceted benefits associated with different GSI are not often prioritized in planning (Christman et al., 2018). While there can be a variety of different GSI types used by cities across the world, many of them have different functions that can range from filtration to flood control driven by local design regulations (Bell et al., 2018; Matsler et al., 2021). Through implementation of GSI type by functional need, planning departments may be missing out on gaining extra benefits through considering a wider range of GSI types. For example, an area that needs stormwater flow control may be more likely to lean towards the use of a retention structure compared to filters such as vegetated swales as they will be better at controlling stormwater compared to a swale’s purpose of filtering stormwater (McPhillips and Matsler, 2018). In addition, if such a neighborhood also suffers from poor air quality or excessive heat, the implementation of the type of GSI could be very important in mitigating multiple neighborhood issues with one infrastructure. The siting of GSI could be more equitable if it included the consideration of co-benefits for the immediate community. In this case, if a basin is what could alleviate stormwater control issues, consideration should also be given to basin types that have a considerable amount of vegetation and greenspace which could impact community health and ecosystem health such as bioretention basins that could reduce excessive heat and contribute to better air quality (Liu et al., 2014; Bell et al., 2018). While many municipalities are prioritizing meeting stormwater control guidelines through implementing GSI, there is not enough consideration given to emphasizing co-benefits through choosing GSI type.
In this study we explore the social, environmental, and infrastructural impacts of urban stormwater management on neighborhoods in an urban environment. The overarching research question that this work addresses is how can cities implement GSI in an equitable manner that prioritizes communities vulnerable to flooding? This brings climate adaptation researchers closer to answering the spatial question of which neighborhoods need climate adaptation infrastructure such as GSI to buffer them from negative impacts of urban flooding. In turn, this study addresses the question of which GSI type is best matched with local need by looking at the common hindrances to GSI longevity and efficiency, the maintenance impacts. The spatial analysis of both GSI need and GSI maintenance can point to places of high priority, while the coupling of these vulnerabilities is used to suggest appropriate GSI type for implementation that supports equitable distribution of GSI resources. This work aims to begin to bridge the gap in current GSI literature on equitable implementation of GSI in impacted communities while introducing an in-depth method of planning for equity and sustainability impacts. Specifically, this study contributes to the urban planning and stormwater fields that could benefit from using this type of multi-variable methodology with their own local data to develop similar assessments and mapping tools. In particular, the evolving nature of urban areas requires that planners develop robust and adaptive systems for mapping and spatially analyzing communities across the urban landscape. This proposed methodology for GSI planning helps to set up a framework that works towards equity, sustainability, and replicable steps that can be updated with new data.
Study area
The City of Philadelphia is situated in the southeastern corner of Pennsylvania in between the Delaware and Schuylkill Rivers and the region’s elevation varies from east to west (Supplementary Figure S1). The geographic area of the city consists of approximately 347 km2 with a population of about 1.6 million residents, leading to a high population density of over 4,600 residents per square kilometer (U.S. Census Bureau, 2021), Like many cities across the world, Philadelphia is experiencing severe effects from flooding and stormwater runoff. As urban development increases in areas like Philadelphia, the results end up meaning greater impervious area, increased rainfall intensity and impacts to stormwater flow (Salerno et al., 2018).
Philadelphia stormwater planning
Urban flooding events in Philadelphia, PA have been more consequential due to the city’s outdated sewer systems and increased pavement, as well as smaller issues such as lack of property maintenance, broken pipes, poor lot grading, and blocked inlets (City of Philadelphia, 2011). A recent study examining runoff flooding and increased surface temperatures in Philadelphia found that the Downtown and South Philadelphia communities were most vulnerable to runoff impacts where areas of high impervious surface cover existed. In addition to flooding areas, this study also found that vulnerability to both flooding and excessive heat is unevenly distributed throughout the city. Areas within the northern portion of the city were found to have lower levels of inundation which corresponded with higher amounts of green stormwater infrastructure installations in that area (Hosseiny et al., 2020).
The City of Philadelphia Water Department (PWD) oversees the stormwater infrastructure program, Green City, Clean Waters, which first began in 2011. This program stemmed from needing to meet state and federal regulations which included the Clean Waters Act, The Safe Drinking Water Act, and the Pennsylvania Stormwater Act, prioritized the reduction of at least 85% of the stormwater pollution that overflows from the older infrastructure (City of Philadelphia, 2011). To comply with their city-wide implementation of the program, the main goal for planning and siting GSI revolves around controlling the first inch of stormwater during an event for an acre of drainage area. This is also what they refer to as a “Greened Acre” which is approximately 103 m³ or the first 123,463 L of stormwater (Philadelphia Water Department, 2016). Some common GSI types being implemented by the PWD include tree trenches, subsurface trenches, bump outs, rain gardens, swales, planters and GSI sewers (Philadelphia Water Department, 2012).
After more than 10 years of installing GSI, this program, along with other urban GSI projects in the Northeast, have goals for this adaptive infrastructure that remains rooted in stormwater retention and water quality control. The program released their last Greened Acre achievement at the 5-year mark in 2016 with over 837 Greened Acres already established which exceeded their 5-year goal and created 441 GSI sites (Philadelphia Water Department, 2016). These benchmarks, though impressive, are not addressing the increasing storm events that are exceeding these GSI thresholds and they are not prioritizing equity impacts within this 25-year plan. This is wasting massive opportunities to bring co-benefits and influence environmental equity in neighborhoods receiving GSI (Meerow, 2020; Shade et al., 2020). In fact, inequities across Philadelphia were found by studying the distribution of public and private GSI investments across the city, which revealed an inequitable allotment of GSI projects largely due to market forces (Mandarano and Meenar, 2017). If the economic resources of an area can drive up the construction of GSI projects, then greater resources need to be diverted towards socioeconomically vulnerable communities to best ensure equitable distribution of GSI.
Research conducted in Philadelphia has started to tackle better understanding the spatial distribution of socioeconomic and environmental factors that need to be addressed in equitable GSI planning. Past research has specifically looked at socioeconomic factors near current GSI of percent minority and low-income populations, the percent of adults without a high school degree, percent of children under the age of five, percent of adults over age 64, and the percent of owner-occupancy for housing units. With environmental and infrastructural factors such as proximity to traffic, ozone levels, tree canopy cover, playground access, etc. (Heckert and Rosan, 2016). By analyzing the interdisciplinary factors of urban vulnerability, municipalities could be better equipped in understanding the spatial distribution of risk due to climate-related events within urban environments.
But the equitable placement of GSI is not currently prioritized within Philadelphia’s program (Philadelphia Water Department, 2011). While the planning process for GSI utilizes an equity screener of sorts, it is not available to the public and is by no means a rigorous part of the prioritization process (personal communication)1. The ultimate end goal in the highly complicated siting of GSI in the densely packed city of Philadelphia is to create more Greened Acres, not to control stormwater while maintaining equitable impacts (Philadelphia Water Department, 2011). This study attempts to make the case for why cities should weigh spatial variables such as flood inundation, social, built-environment, and GSI maintenance vulnerabilities more heavily in their siting process to take a step closer towards equitable climate adaptation planning. Along with prioritizing vulnerabilities, more needs to be done to emphasize the importance of co-benefits associated with GSI types to maximize not just the first inch of stormwater control, but also the local environmental and social benefits for the neighborhoods that need them.
Another aspect of GSI that ties into the local community is the long-term maintenance of these structures. Across the city, the highest maintenance impacts to GSI are projected to be within the center of the city with higher impacts in surrounding neighborhoods (Homet et al., 2022). This could indicate that greater budgeting would have to occur for projects in these neighborhoods for the PWD to sustain a long-term maintenance plan which would allow for efficient and long-lasting GSI (Wadzuk et al., 2021a; Wadzuk et al., 2021b). This issue can relate back to the favorability of GSI projects occurring in economically favorable neighborhoods (Mandarano and Meenar, 2017), if the water department cannot find the project economically feasible, especially with heightened maintenance costs, then any potential co-benefits from a project end there. In this chapter, we start to fill the knowledge gap of local GSI maintenance impacts by connecting these vulnerabilities of GSI to the vulnerabilities that could be mitigated by GSI through co-benefits.
Past research has revealed many benefits that coincide with different types of GSI that are commonly used in municipal planning. While many grey infrastructures have benefits mainly in the realm of stormwater control and flood retention, many green technologies now serve many benefits such as improved air and water quality, greenhouse gas reduction, increased food access, enhanced environmental education, and increased property values (Gallet, 2012; McGarity et al., 2015; Bell et al., 2018). One area of GSI that is not well researched is how to equitably implement different GSI types based on the expected co-benefits and community needs (McGarity et al., 2015; McPhillips and Matsler 2018; Homet et al., 2022). While this research attempts to address the spatial distribution of community need for GSI across Philadelphia, this approach can be transferred to other cities through the utilization of community need to drive decision makers and planners towards the implementation of specific GSI types to best accommodate address the need of the community.
Methods
To understand the distribution of GSI need the vulnerabilities assessed in this study include flood inundation (IVI), built environment (BEVI), social (SVI), and the GSI maintenance needs index (GSI MNI) from Homet et al., 2022. By looking at a multitude of equity variables, this study examines the environmental, built-environment, and social parameters of the communities in Philadelphia that drive vulnerability to local flooding and need for mitigation measures like GSI and compares that to areas of GSI maintenance impacts that could impact GSI function and longevity (Figure 1).
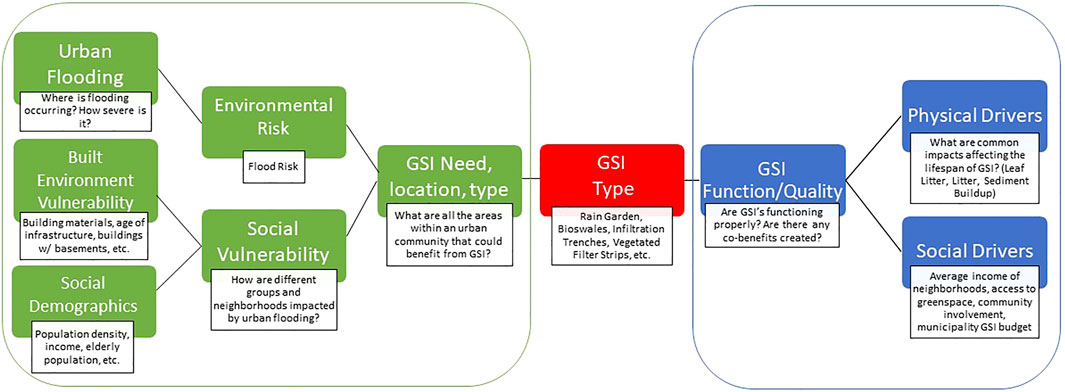
FIGURE 1. A workflow for getting to the question of ‘How can cities implement GSI in an equitable manner that considers not just neighborhood vulnerabilities and need for GSI, but also the potential limitations and benefits associated with the GSI that are implemented?’.
Each vulnerability index is made of multiple variables (Supplementary Table S1) that are spatially analyzed, scored, and then combined into an overall vulnerability index (OVI). Each vulnerability index was spatially modeled with data from 2012 to 2021 for the extent of the City of Philadelphia. Any Census block groups with no population total (such as industrial sectors like airports and parks) were excluded from this study. Once each variable was cleaned and scored, they were brought into mapping software and joined or aggregated to the block group scale. All mapping throughout this study was performed using ESRI’s ArcGIS Pro Version 2.9.
Previous vulnerability studies have used standardized scoring methods, often due to the already standardized Census data (Clark et al., 1998; Cutter et al., 2003), and some have tweaked standard scores to portray relative levels of vulnerability (Heckert and Rosan, 2016). More recent research has utilized z-score standardization for normalization of vulnerability variables (Tate, 2013). In addition to spatially analyzing vulnerabilities to climate-related impacts across Philadelphia, this study also sought to compare these commonly utilized scoring methods to determine just how much measured vulnerabilities changed based on the score type. All indices were created using these three different scoring methods:
1) Regionalized score
Regional scores were calculated by scoring a block group from 0 to 4 based on how many standard deviations the block group had from the mean of the vulnerability variable for the whole city (Delaware Valley Regional Planning Commission, 2019). Low and high scores represented low and high vulnerability, respectively. Scores were given as follows:
- Score of 0: Greater than 2 standard deviations below the city mean
- Score of 1: Between one and 2 standard deviations less than the city mean
- Score of 2: Within one standard deviation of the city mean
- Score of 3: Between one and 2 standard deviations above the city mean
- Score of 4: Greater than 2 standard deviations above the city mean
To calculate the overall regional score, all the individual regional scores were added for the highest vulnerability score (36 for the SVI, 32 for BEVI, and four for the GSI MNI and IVI). The lowest possible vulnerability score is zero.
2) Standardized score (from 0 to 1)
Standardized scores were calculated for each index by using the already standardized percentages (ACS) and by calculating the percent of vulnerability variable per block group.
To calculate the overall vulnerability index’s standardized score, all the standardized variable scores were averaged together for a maximum vulnerability of one and a minimum of zero.
3) Z-score
The z-scores were calculated based on the mean standardized scores of each index (Eq. 1).
To calculate the overall vulnerability index’s z-score, the standardized scores for the overall vulnerability index were employed.
Scoring agreement analysis
To understand how the different scoring methods compared, a scoring agreement analysis was performed. To compare, each of the three scoring methods for the OVI were converted to rank percentiles for each block group and were statistically analyzed through a one-way, non-parametric Kruskal Wallis Analysis of Variance (ANOVA) test and then compared through a Tukey’s Honestly Significant Difference (HSD) test. Additionally, a percentile rank was applied to the three different sets of scores. These ranged from 0 to 1 and were separated into 10 classes, from percentile ranks of 0–0.1, 0.1–0.2, etc. Each class was labeled from 1 to 10, with one being percentile ranks up to the 10th percentile, and 10 being from greater than the 90th percentile all the way up to 100th percentile. We then compared how many block groups had scores within the same percentile class. A value of two was applied to any block groups in which all three scoring methods agreed in the percentile rank class. A value of one was applied to all block groups in which 2 scores showed agreement, and a value of 0 was applied where no agreement was found (although no block groups were in this category).
Inundation vulnerability index
The flood extent model used in this study comes from recent research that predicted the peak runoff discharge from a 10-year, 24-h design storm simulated for the city of Philadelphia (Hosseiny et al., 2020). Runoff estimates were found using the Rational method (Hosseiny et al., 2020). These values were averaged per block group and were then standardized from 0 to 1 for the purpose of this study. The regional scoring method was applied by using the mean of the standardized scores as a basis for the regional mean flood extent for a 10-year, 24-h storm event. The z-scores were calculated based on the standardized scores.
Built environment vulnerability index
To identify areas of built-environment vulnerability, parcel data (Supplementary Table S1) was utilized from the City of Philadelphia Department of Records database for the year of 2017 (OpenDataPhilly, 2017) along with public infrastructure variables (locations of schools, fire departments, transit stops, and hospitals) from the city’s open-source data collection and the Southeastern Pennsylvania Transportation Authority (SEPTA) GIS Data Portal for the years ranging from 2012 to 2021 (Supplementary Table S1; OpenDataPhilly, 2021; Southeastern Pennsylvania Transportation Authority, 2021).
These data points referenced parcels throughout the city and were spatially aggregated to the block group level within GIS software, to match the SVI. For both the BEVI and the SVI, twenty Census block groups were removed from the built environment and the social vulnerability data as they existed solely within industrial sites that had no relevant parcel or social information available. Specifically, for the BEVI, this only affected the southern tier of the city. For the SVI, many of the block groups either did not have a complete American Community Survey (ACS) dataset available for the years studied or were in strictly industrial or commercial block groups that had no social information available. The combination of these block groups was not used in this study within any index. The number of vulnerable parcels per tract was counted for each variable along with a percentage of vulnerability. Each built-environment vulnerability metric was standardized from 0 to 1 with vulnerability to flooding being a 1. This served as a standardized score from which the regional and z-score methods were calculated as well. To reduce variable correlations, some variables were averaged together to represent one variable. This resulted in three averaged variables, a “dangerous building” variable which consisted of the Imminently Dangerous Buildings and the Unsafe Buildings, a “Southeastern Pennsylvania Transportation Authority (SEPTA) transit stop” variable which consisted of the SEPTA bus, trolley and high-speed rail stops, and finally the “public infrastructure” variable which consisted of the public schools, hospitals, and fire department locations across the city.
Social vulnerability index
This study reviewed many previous social indices, including their purpose, applications, makeup, location, and success in planning circles (Cutter et al., 2003; Tate, 2013; Heckert & Rosan, 2016; DVRPC, 2019; Meerow, 2020). Based on these previous indices, common social variables were chosen for this study as well as more localized variables used in recent studies on Philadelphia (DVRPC, 2019). The spatial resolution or scales used by these studies ranged from Census block groups to Census tracts, with tracts being the most common measurement. The scale of block groups is the result of annual data acquisition at a smaller scale than the decennial tract data (U.S. Census Bureau, 2021) and was chosen for this study due to community variabilities that may not be detected at the tract level. These studies also used a variety of scoring methods for creating a social vulnerability index. The three scoring methods picked in this study were applied to all four individual vulnerability indices, including the SVI.
A total of nine variables (Supplementary Table S1) were used that were specific to Philadelphia vulnerability and were available in a high spatial resolution format of block groups from the ACS 2015–2019 5-year estimates (U.S. Census Bureau, 2021). These variables were standardized from 0 to 1, were scored regionally based on the average standardized score, and were also scored as z-scores based on the means of the standardized scores.
GSI maintenance needs index
A previous study that predicted the maintenance impacts on Philadelphia GSI utilized three common maintenance variables that included leaf litter, litter, and sediment buildup that were then combined together to create a mean value that gave a sense of the spatial distribution of potential maintenance inhibitors (Homet et al., 2022). The data used in this study was directly applied as a vulnerability layer within this research. The GSI MNI layer was converted from its raster form to be aggregated to block groups using zonal statistics. The index values were already in a standardized score format and were additionally scored using the regional and z-score methods.
Overall vulnerability index
A final index was created through the combination of the five individual indices (SVI/BEVI/GSI MNI/IVI). For a standardized score, this index was created by equally weighting each index and averaging the four standard scores across the indices. The regional score was calculated by adding the regional scores of each index together. The maximum possible score was 76 (SVI max = 36, BEVI max = 32, GSI MNI max = 4, IVI max = 4). The third method of z-scores averaged together each individual index’s z-score. These scores were calculated for the block group scale and were spatially mapped to consider spatial distribution.
Statistical analyses
Correlation matrices were created in RStudio Version 1.4.1103–4 to ensure that a reasonable amount of individual index variables were not correlated, this included 22 individual variables, one from the IVI, eight from the BEVI, nine from the SVI, and three from the GSI MNI. It is important to note that the three GSI MNI variables (litter, leaf litter, and sediment) were not utilized in the scoring methods of this study, just for this correlation procedure. Another matrix was created for ensuring that none of the overall indices were correlated. This was performed using the ggcorrplot package in RStudio Version 1.4.1103–4 and p-value indicators were added for identifying statistical significance.
The distribution of scores for each of the three scoring methods was calculated in RStudio Version 1.4.1103–4 using the ggplot2 package to create histograms for each index’s scoring method. This included the IVI, BEVI, SVI, GSI MNI, and the OVI scores.
To assess the relationship between flood inundation vulnerability and the social and built-environment vulnerabilities in Philadelphia, the z-score of the IVI was plotted against the averaged z-score of the SVI and BEVI to reveal how many block groups were in categories of low, medium, and high vulnerability. The same plot was used to analyze the relationship between the z-scores of the GSI MNI and the OVI, also performed in RStudio Version 1.4.1103–4 using the ggplot2 package.
GSI type by GSI need and maintenance vulnerability
To relate the types of GSI with different maintenance impact levels and different overall community vulnerabilities, a GSI suggestion table was created through a literature review of the PWD’s maintenance manual (Philadelphia Water Department, 2012) and of previous studies looking at the co-benefits provided from the GSI types used by PWD (Charles River Watershed Association, 2008; Gallet, 2012; Bell et al., 2018). Twelve of the most common GSI types used by the PWD were explored in this table. Each GSI type was scored based on the number of co-benefits it provided out of the sixteen possible benefits found by Bell et al., 2018. These were calculated as percentages and then ranked as low, medium, and high in terms of ability to mitigate overall neighborhood vulnerability (OVI). The range for low vulnerability was between 0 and 0.25, medium was between 0.26 and 0.74, and high was between 0.75 and 1 (Supplementary Table S2). In this scenario, a high-ranking score indicates a GSI type that provides many benefits and should be placed in an area with high need or high overall vulnerability.
The twelve GSI types were also scored and ranked based on their anticipated maintenance needs. This directly involved the three common impacts used by Homet et al., 2022, litter, leaf litter, and sediment. The total number of maintenance tasks that had to do with sediment, litter, or vegetative debris/leaf litter were counted for each GSI type and divided by the total number of maintenance tasks listed in the maintenance manual for that GSI. This percentage was then weighted by the frequency of needed maintenance for “As Needed”, “Monthly”, “Quarterly”, “Semi-Annually”, and “Annually” which meant multiplying the scores by 5, 4, 3, 2, and 1, respectively. This resulted in a range of scores between 0.75 and 1.53 which was split evenly to rank low, medium, and high maintenance needs. With a low ranking between 0.75 and 1.01, a medium ranking between 1.02 and 1.27, and a high ranking between 1.28 and 1.53 (Supplementary Table S3).
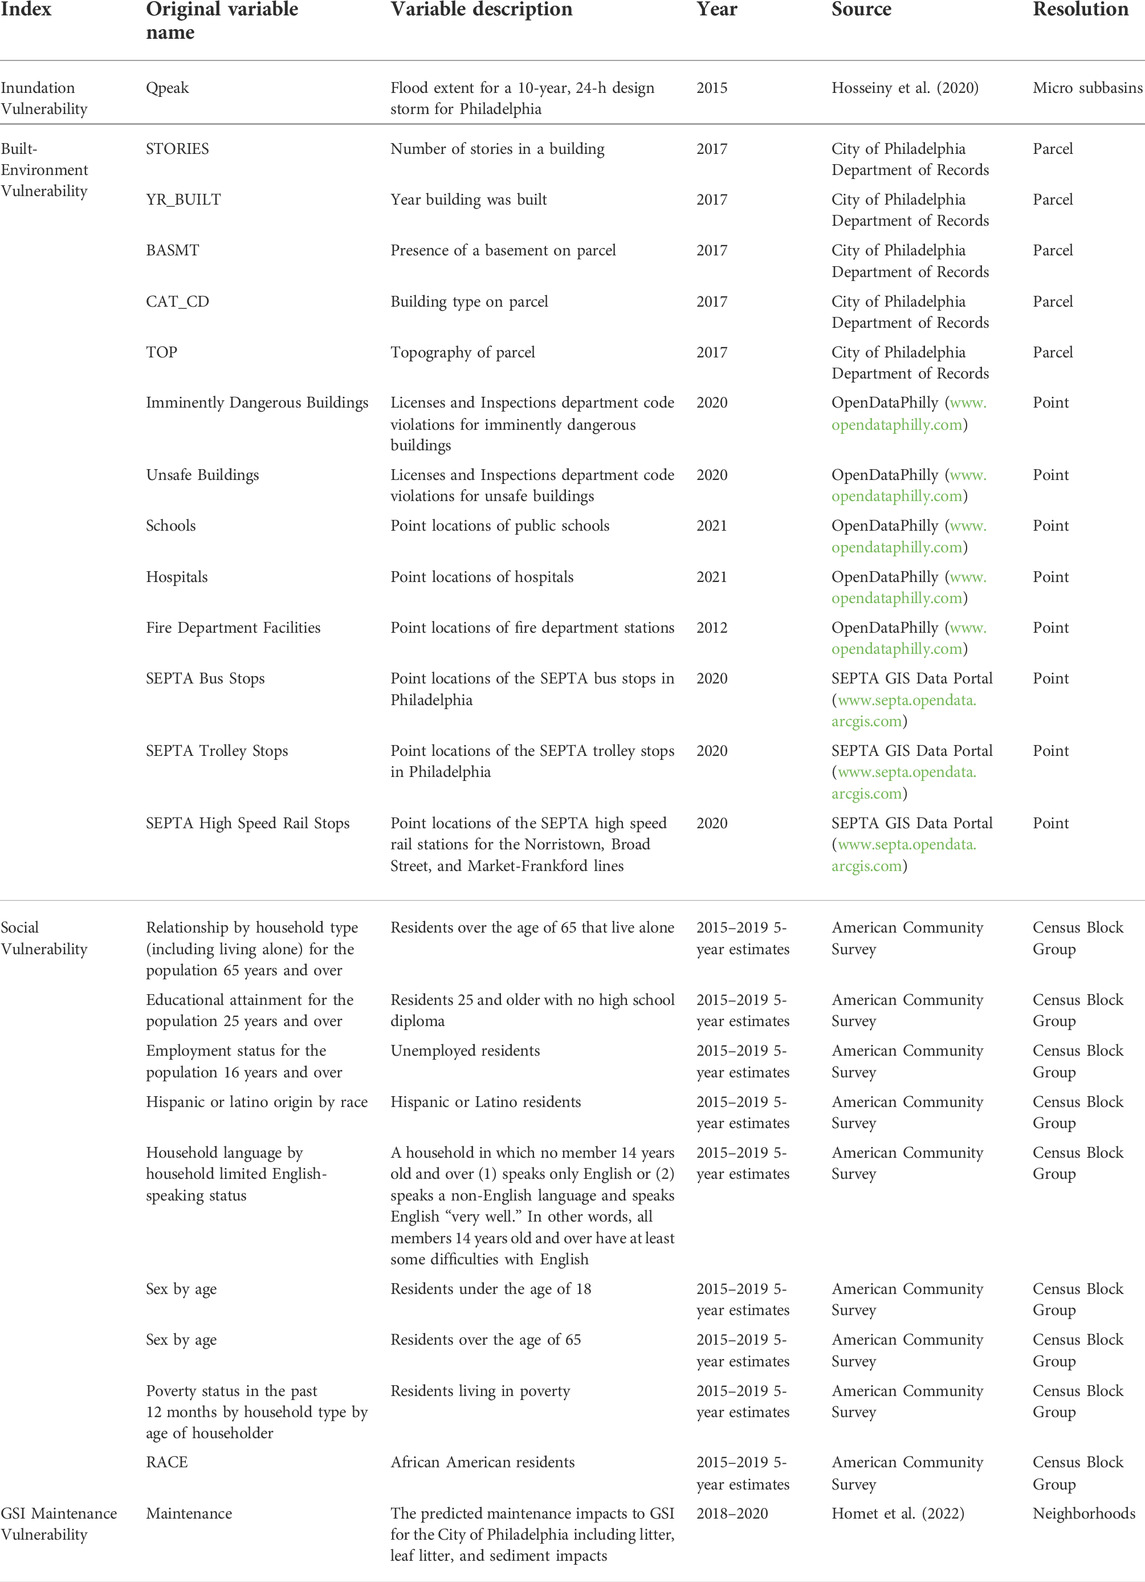
TABLE 1. The variables chosen for each individual vulnerability index within this study.
The GSI types were then organized into a table by their vulnerability (need) and maintenance requirement rankings to serve as a suggestion for choosing GSI in different neighborhoods across Philadelphia.
Results
Vulnerability indices
The analysis of each index’s scoring results revealed distinct trends and differences. The IVI scores (Figure 2) appeared to have very similar spatial distributions across all three scoring methods. Looking at the distribution results of the IVI (Figure 2), the standardized scores and the z-scores both reveal slightly right skewed histograms while the regional scores are slightly more bell-shaped and without any major skew. This could indicate that the regional scoring method was able to bring attention to areas of higher flood vulnerability in block groups compared to the standardized and z-scores.
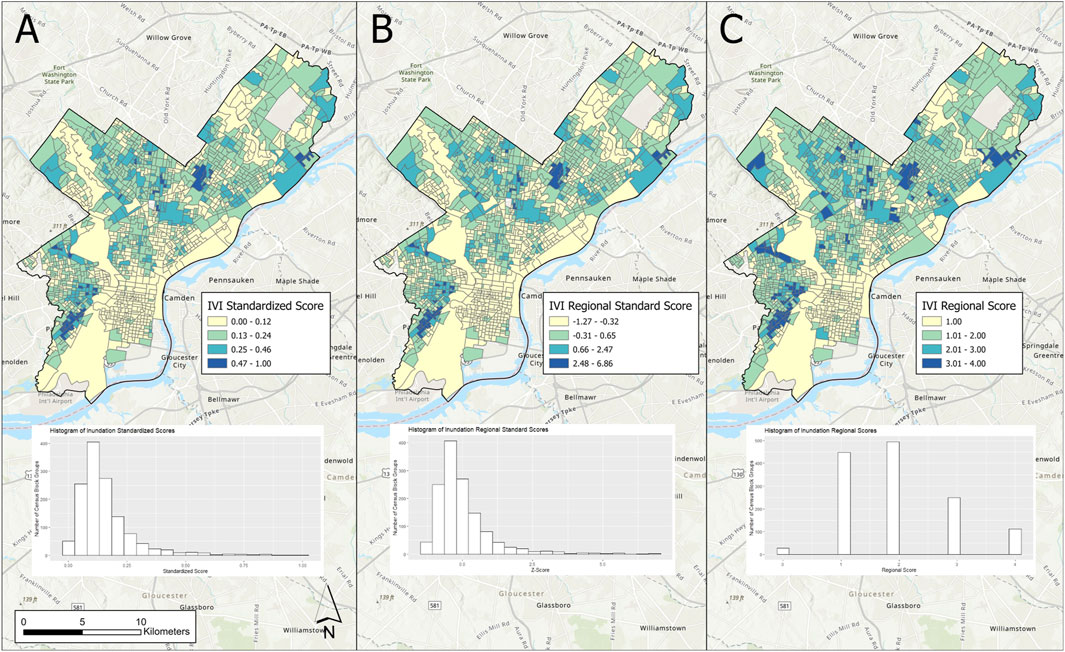
FIGURE 2. The analysis of the Inundation Vulnerability Index results. (A) The spatial distribution of the IVI based on the standardized scoring method. (B) The spatial distribution of the IVI based on the z-scores. (C) The spatial distribution of the IVI based on the regional scoring method. Base Map Source: Esri, DeLorme, HERE, TomTom, Intermap, increment P Corp., GEBCO, USGS, FAO, NPS, NRCAN, GeoBase, IGN, Kadaster NL, Ordnance Survey, Esri Japan, METI, Esri China (Hong Kong), swisstopo, MapmyIndia, and the GIS User Community.
The spatial spread of the BEVI scores reveal a greater number of block groups with high vulnerability in the standardized scoring method (Figure 3A) when compared to the z-score (Figure 3B) and the regional score (Figure 3C). The BEVI reveals a narrow range of standardized and z-scores across the city (Figure 3), with the standardized result maximum vulnerability at just 0.63, more than the maximum for the SVI but less than that of the standardized scores for the GSI MNI, and the IVI. Similar to the IVI distributions, in all three scores for the SVI (Figure 4) the spatial distribution of a majority of highly vulnerable block groups are similar, with various changes as block groups become farther away from the center of the city. In Figure 4B, the z-scores provide the most normal distribution of scores compared to 4A and 4C, but this is not the case for the other individual index’s regional standard (z-score) results.
FIGURE 3. The analysis of the Built-Environment Vulnerability Index results. (A) The spatial distribution of the BEVI based on the standardized scoring method. (B) The spatial distribution of the BEVI based on the z-scores. (C) The spatial distribution of the BEVI based on the regional scoring method. Base Map Source: Esri, DeLorme, HERE, TomTom, Intermap, increment P Corp., GEBCO, USGS, FAO, NPS, NRCAN, GeoBase, IGN, Kadaster NL, Ordnance Survey, Esri Japan, METI, Esri China (Hong Kong), swisstopo, MapmyIndia, and the GIS User Community.
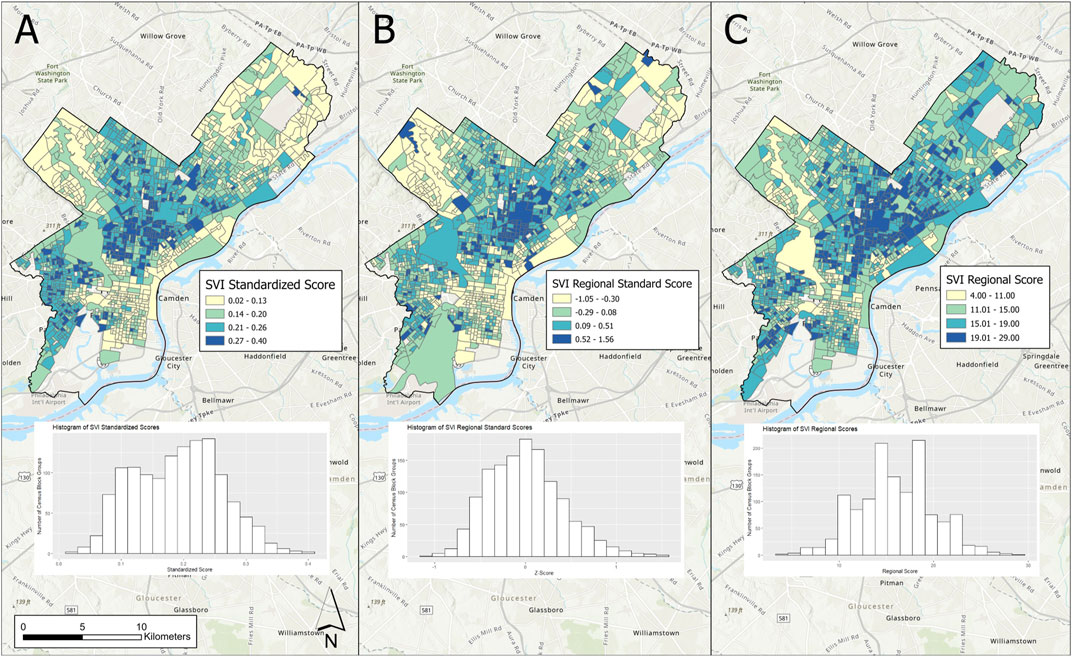
FIGURE 4. The analysis of the Social Vulnerability Index results. (A) The spatial distribution of the SVI based on the standardized scoring method. (B) The spatial distribution of the SVI based on the z-scores. (C) The spatial distribution of the SVI based on the regional scoring method. Base Map Source: Esri, DeLorme, HERE, TomTom, Intermap, increment P Corp., GEBCO, USGS, FAO, NPS, NRCAN, GeoBase, IGN, Kadaster NL, Ordnance Survey, Esri Japan, METI, Esri China (Hong Kong), swisstopo, MapmyIndia, and the GIS User Community.
The GSI MNI (Figure 5) scores show very similar distributions within the histogram and spatially across the city. Finally, examining the different scores of the OVI (Figure 6) show noticeably lower vulnerability scores in the standardized scores, compared to that of the z and regional scores. The variability of scores across the three different methods reveals a wide spatial distribution of vulnerabilities. For example, two neighborhoods in Philadelphia that are noticeably different from one another, but both feel impacts from heavy precipitation are Manayunk, a gentrified neighborhood in the northwest region of Philadelphia along the Schuylkill River, and Eastwick, a low-income neighborhood in the southwest region also along the Schuylkill River and adjacent to both Darby and Cobbs Creek (Flanagan, 2010; Bagwe, 2017). These two neighborhoods show a wide variety of vulnerability levels from each of the five indices (Figures 7A–E). Manayunk has less inundation and social vulnerability but has block groups with high infrastructural and GSI maintenance vulnerabilities. In Eastwick, block groups show a consistent level of medium vulnerability in each index measurement. These two neighborhoods exemplify how diverse the city is in terms of these multifaceted vulnerabilities.
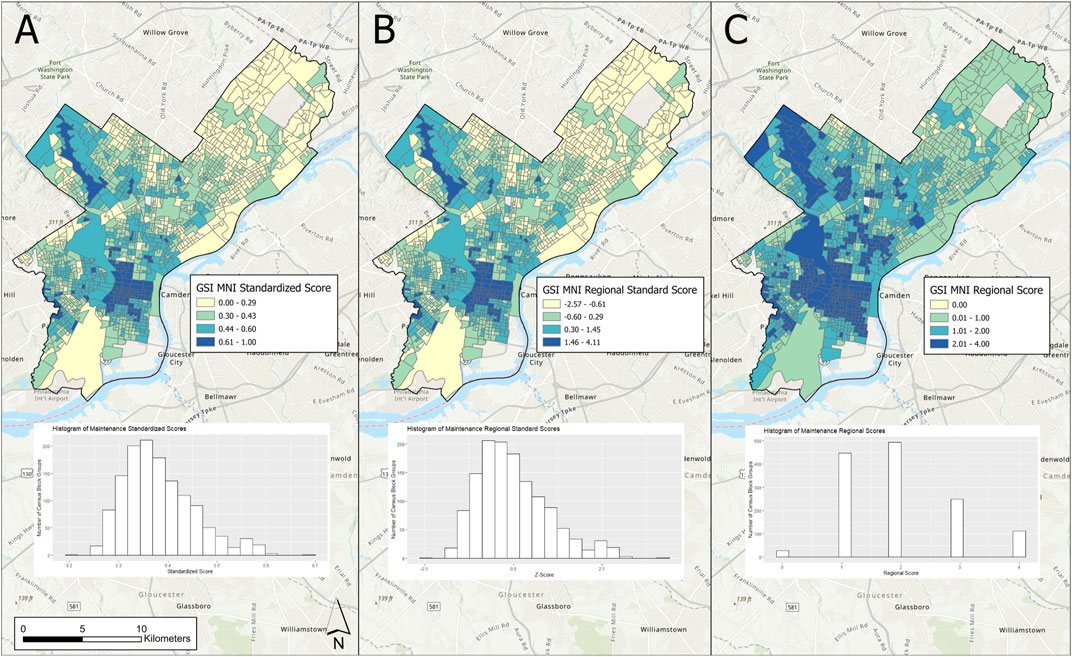
FIGURE 5. The analysis of the GSI Maintenance Needs Index results. (A) The spatial distribution of the GSI MNII based on the standardized scoring method. (B) The spatial distribution of the GSI MNI based on the z-scores. (C) The spatial distribution of the GSI MNI based on the regional scoring method. Base Map Source: Esri, DeLorme, HERE, TomTom, Intermap, increment P Corp., GEBCO, USGS, FAO, NPS, NRCAN, GeoBase, IGN, Kadaster NL, Ordnance Survey, Esri Japan, METI, Esri China (Hong Kong), swisstopo, MapmyIndia, and the GIS User Community.
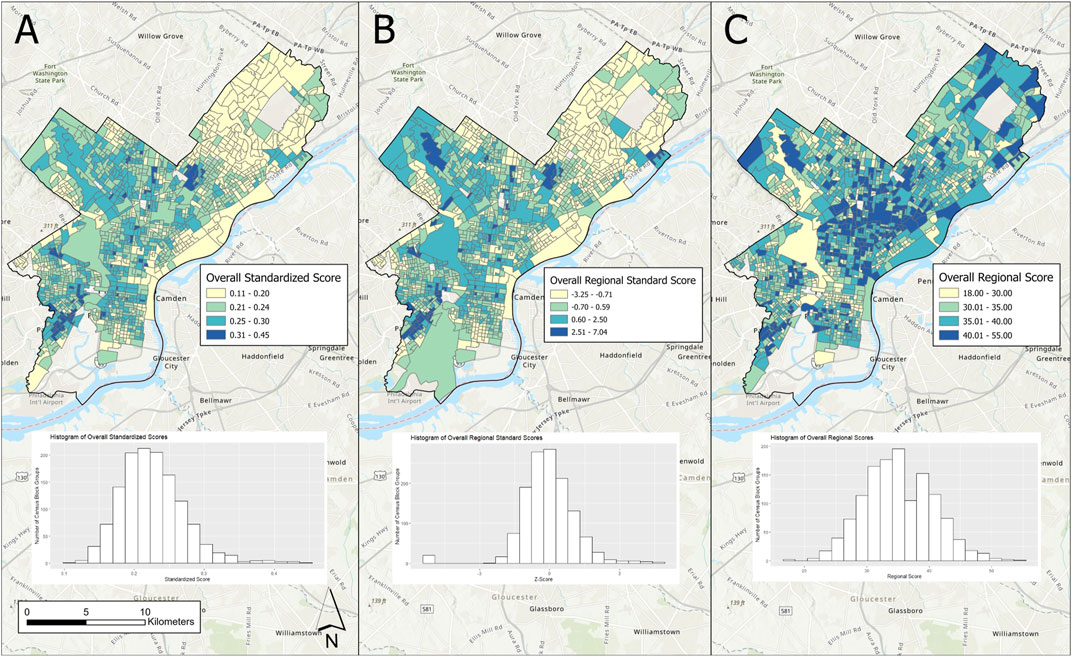
FIGURE 6. The analysis of the Overall Vulnerability Index results. (A) The spatial distribution of the OVI based on the standardized scoring method. (B) The spatial distribution of the OVI based on the z-scores. (C) The spatial distribution of the OVI based on the regional scoring method. Base Map Source: Esri, DeLorme, HERE, TomTom, Intermap, increment P Corp., GEBCO, USGS, FAO, NPS, NRCAN, GeoBase, IGN, Kadaster NL, Ordnance Survey, Esri Japan, METI, Esri China (Hong Kong), swisstopo, MapmyIndia, and the GIS User Community.
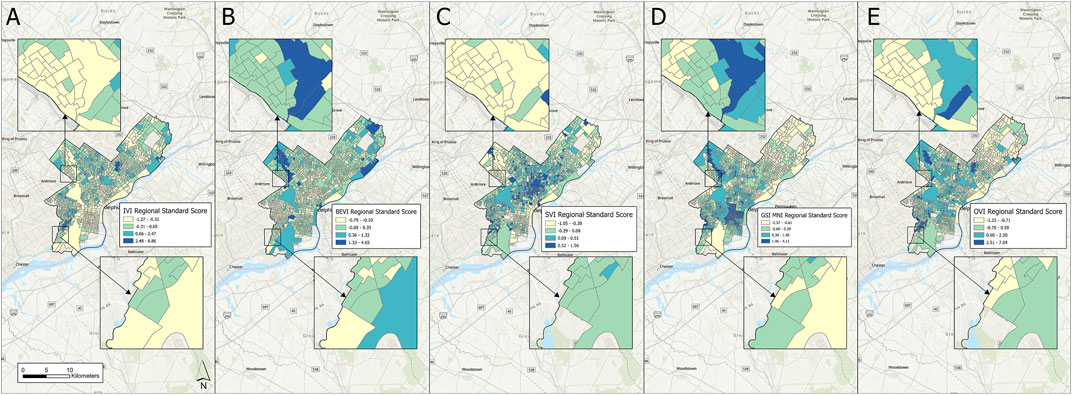
FIGURE 7. The z-scores of each index, including the overall index. The top inset in each panel is Manayunk, a gentrified neighborhood sitting within a floodplain in northwest Philadelphia (Flanagan, 2010). The bottom inset in each panel is Eastwick, a low-income neighborhood also experiencing impacts from flooding in southwest Philadelphia (Bagwe, 2017). (A) Results of the Inundation Vulnerability Index as z-scores. (B) Results of the Built-Environment Vulnerability Index as z-scores. (C) Results of the Social Vulnerability Index as z-scores. (D) Results of the GSI Maintenance Needs Index as z-scores. (E) Results of the Overall Vulnerability Index as z-scores. Base Map Source: Esri, DeLorme, HERE, TomTom, Intermap, increment P Corp., GEBCO, USGS, FAO, NPS, NRCAN, GeoBase, IGN, Kadaster NL, Ordnance Survey, Esri Japan, METI, Esri China (Hong Kong), swisstopo, MapmyIndia, and the GIS User Community.
To examine the relationships between all the variables used in each index, as well as the correlation between the indices, we developed two simple correlation matrices using the standardized scores. Results of correlation between all 22 individual variables used in each index (Figure 8A), indicates that some of the variables used, either social, built-environment, inundation, or maintenance show low, but statistically significant correlation. For example we found an expected significant correlation between dangerous and unsafe buildings and the predicted amount of litter in an area. These are both variables that can signify neighborhood neglect on a community’s behalf or inability to perform upkeep due to financial strains. We also found significant correlation between residents living in poverty and areas of predicted litter buildup. A different type of significant correlation was between two social variables, the percent of Hispanic or Latin population and the percent of limited English speakers per household, something that may be expected in the ethnically diverse city and suburbs of Philadelphia. Still, because correlation coefficients were low in most cases, all variables were used in the analysis. Results of the correlation analysis between the four indices indicates no significant correlation and that they are independent of overall bias (Figure 8B).
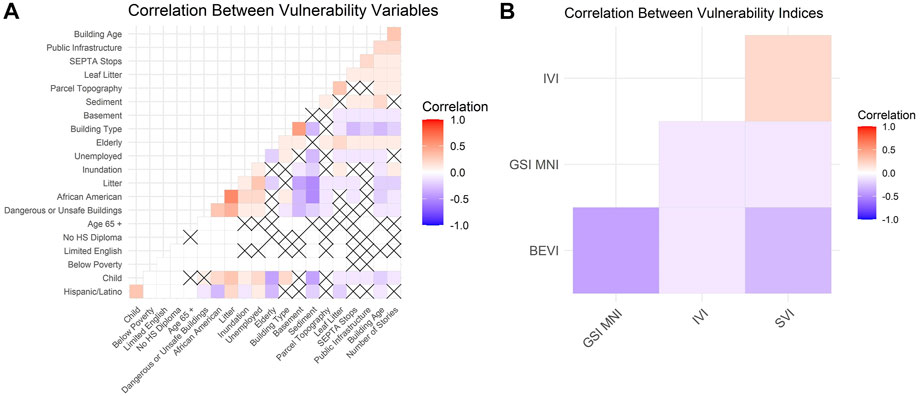
FIGURE 8. (A) A correlation analysis of each individual variable used in the indices. Correlations considered statistically significant (p < 0.05) are shown with an x. (B) A correlation analysis of each individual index. Correlations considered statistically significant (p < 0.05) are shown with an x.
Levels of vulnerability: Comparing maintenance needs with community vulnerability to flooding
Comparisons between the overall vulnerability and predicted GSI maintenance impacts were conducted using z-scores (Figure 9A). Each index is divided into “high”, “medium”, or “low” categories of vulnerability. The z-scores for the OVI without the GSI MNI and the GSI MNI scores were separated into three quantiles, with the lowest z-scores indicating a “low” ranking of vulnerability, while the largest z-score was considered “high” vulnerability. Their combination results in a designation of level of risk on the 2-axes. For example, “High-High” indicates high vulnerability on both the OVI and MNI indices, of which approximately 9.32% of block groups were ranked. This means that they show high overall vulnerability, hence high need for GSI implementation, but also high vulnerability to maintenance impact. This suggests that these areas should be prioritized for GIS implementation that may require high maintenance investment. In such areas, specific GSI types, that require less intense maintenance may be considered, or alternatively plans and budgets for long-term maintenance should be considered. The results show that approximately 9.24% of the block groups are within the “Low-Low” designation which indicates that these neighborhoods are not in urgent need of GSI but could benefit from low-impact GSI if necessary. There is also a substantial amount of block groups that are considered low overall vulnerability but vary from low, medium, and high in terms of maintenance impacts such as “Low-Medium” at 13.45% of block groups. The vulnerability ranking with the majority of block groups assigned to it is the “High-Low” vulnerability, with nearly 15% of all the block groups, these are areas with predicted high maintenance impacts to GSI but lower overall vulnerability to urban flooding-related events. This comparison of indices is useful in determining the need for GSI across Philadelphia.
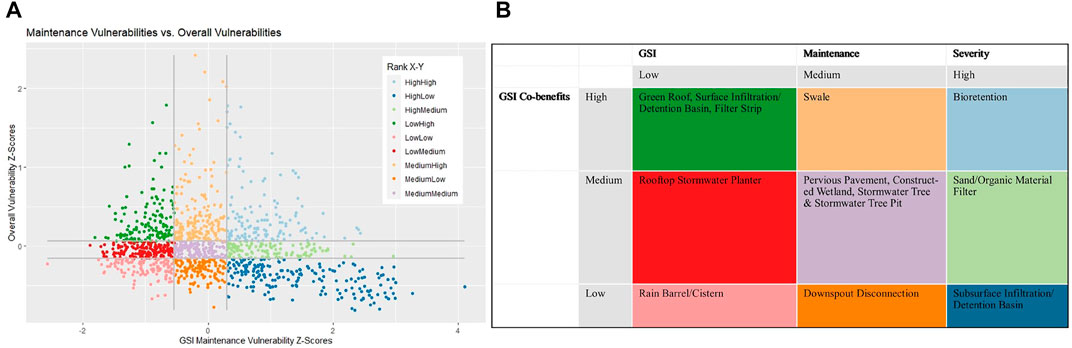
FIGURE 9. (A) Scatterplot of the GSI MNI rankings based on z-scores (X) against the Overall Vulnerability Index rankings (Y). The grey lines represent the separation between Low, Medium, and High vulnerability ranks, where GSI MNI Low is ≤ -0.54, Medium≤0.30, High ≤ 4.11. For the OVI without the GSI MNI included, vulnerability is ranked where Low ≤ -0.16, Medium≤0.06, and High≤2.42. These values were taken by seperating the data spread of both the GSI MNI z-scores and the OVI (without GSI MNI) z-scores and seperating them into three quantiles to represent levels of vulnerability. (B) A decision table to suggest which GSI types are best suited for neighborhoods with different levels of maintenance severity and different co-benefit needs. The colors of each box correlate directly with the same color census block group points in Figure 9A.
The combination of GSI need and anticipated GSI maintenance impacts is the first step in planning more equitably for GSI placement across urban areas. The study of need and maintenance allows planners to see where those overlap to be able to best fit the GSI type that will perform efficiently while also providing the co-benefits necessary based on community need. The ranking of co-benefits per GSI type (Supplementary Table S2) allows for a better understanding of how impactful this infrastructure can be outside of just stormwater control and filtration. In addition, understanding and ranking the anticipated lifelong maintenance a GSI will need (Supplementary Table S3) is critical when it comes to placing this infrastructure in a manner that will ensure its longevity and efficiency in controlling the impacts of stormwater. An example of combining GSI need with GSI function comes from siting a detention basin in an area of high overall GSI need and high anticipated maintenance impacts (Figure 9B). An area of this High/High ranking would not be equitably served if a subsurface infiltration basin was installed because it would create less co-benefits and greater maintenance requirements that would not be well suited for a High/High neighborhood. Results suggest that areas across Philadelphia that may experience high maintenance impacts as well as high overall vulnerability, such as Center City and northwest Philadelphia (Figures 5, 6), could benefit greatly from green roofs, surface infiltration, and filter strip systems compared to a bioretention system because while they are able to provide a higher amount of co-benefits to address GSI need, bioretention systems require greater maintenance overall, making them better suited for neighborhoods that do not anticipate common maintenance impacts such as litter, leaf litter, or sediment to be high.
Scoring agreement analysis
An ANOVA analysis was performed on the percentile ranks of the OVI scoring methods in order to determine how the different scoring methods compared. This statistical analysis compares the means of the scoring types to determine if at least one group is significantly different from one another. This resulted in a p-value of less than 0.05, indicating that at least one scoring method was significantly different than the other two. A Tukey’s Honestly Significant Difference Test (HSD) revealed that the regional scoring method was different than the standardized and z-score methods. These results are denoted in Supplementary Figure S2 as Regional (A), Standardized (B), and z-Score (B).
The results of the index agreement analysis reveal which block groups are similarly scored in percentile ranks, with blocks with a value of two indicating that all three scoring methods produced similar scores, while a one indicates only two out of three scoring methods were similar, and block groups that had no similar percentile ranks among the three scoring types did not exist in this data. The spatial analysis of these results are illustrated in Supplementary Figure S3, revealing a small amount of block groups where all three scoring types can agree upon in terms of vulnerability. Most block groups across Philadelphia only have scores that are agreeable based on two out of three scoring methods. In nearly all these instances of two out of three agreements in percentile ranks, the methods that agreed were the standardized and z-score methods, revealing that scoring based on local or regional means of vulnerability produces different results on a widespread scale.
Discussion
Like many municipalities, there are multiple types of GSI that are currently utilized across the city by the PWD, but they all differ in terms of functionality, cost, lifespan, and benefits. The current planning process is limited by the ability to quantify these elements. The analyses presented here take an initial step at identifying areas of GSI need and matching that with GSI types. This is accomplished through defining areas of low, medium, and high overall vulnerability and the importance of co-benefits and stormwater control that might be needed for different levels of GSI need. In turn, these are compared with the predicted level of maintenance impact that aligns with that area and how well certain GSI types are known to deal with the common maintenance impacts, litter, leaf litter, and sediments.
For example, in areas predicted to be of high overall social, infrastructural, and flood vulnerability but low GSI maintenance impact, a potential, more equitable solution could be placing a GSI type that is good at flood control and provides an abundance of other benefits but requires minimal maintenance, as it can handle minimal or no clogging in between annual site maintenance. The ideal GSI for such a neighborhood could be a bioretention system (Figure 9B). In areas with predicted high maintenance impacts to GSI and high overall need for GSI, the community could benefit from green roofs or detention basins which are known to need less maintenance due to things like clogging and buildup from litter, leaf litter, and sediment. The designations within Figure 9B are not meant to be a definitive method for planning the siting of a GSI. Instead, this innovative decision table was created to act as a loose guide for planners to keep in mind the different co-benefits offered by GSI as well as the expected maintenance needs for different types of GSI to site infrastructure in neighborhoods that need GSI and their benefits and can ensure longevity and sustainability of GSI systems.
Currently, there is little research that connects issues of GSI longevity and sustainability with an interdisciplinary analysis of community need for green infrastructure. Here we offer a new approach for better understanding the best-fit placement for this type of stormwater infrastructure in a highly urbanized and evolving setting such as Philadelphia. Estimating maintenance impacts to GSI will help planners better understand potential issues, benefits, and costs of GSI installation in the future, allowing for more efficient and more sustainable planning practices.
This study aimed to better understand the multifaceted vulnerabilities associated with the city of Philadelphia and its response to increased urban flooding events. More specifically, this research aims to open a pathway to better understanding the relationships between vulnerabilities and GSI planning and how GSI implementation can be performed in a more equitable manner. The results of the OVI reveal a diverse range of vulnerabilities spread across the city, with some areas showing extremely high overall vulnerability and some quite low. This observation was repeated in the other indices such as the SVI and the IVI which reveal some spatial clusters of high and low vulnerabilities. This method of combining many different vulnerability variables allows researchers to start to understand the equity issue surrounding communities today. While some neighborhoods may have strong socioeconomic opportunities, perhaps their infrastructure faces vulnerability to flooding and the physical location is in danger of flooding. On the opposite spectrum, a neighborhood could be severely vulnerable in terms of social and economic variables but perhaps not face direct flooding threats, there is still vulnerability there that indicates they will still face some impacts during a climate change-related event. To best prepare for this, it is critical that urban vulnerability studies such as this one keep track of how cities and urban areas are constantly growing and changing. With updated and integrated geographically referenced social, infrastructural, environmental and maintenance data, planning departments can utilize this information allowing for more inclusive and equitable decision-making.
A drawback to this methodology of combining multiple variables lies in the weighting that was chosen. In this study, each vulnerability index was weighted equally when combined into the OVI. For this study, further research into weighting the variables and indices differently would have consisted of a much more extensive project than anticipated. Such a study would be very beneficial to future research on multifaceted vulnerability planning to have a better idea of what is impacting different vulnerability variables, whether it is weather, seasonality, regional differences, local laws or policies, etc. For example, the variables making up the GSI MNI may have created a much different output if they were weighted more heavily based on seasonality of leaf litter or sediment, or if frost and de-icing measures were considered in sediment buildup during the winter months. Additionally, a validation of the GSI MNI was attempted with data from the Philadelphia Water Department’s maintenance records but was inconclusive as it was determined that more data on routine inspections were needed to perform a verification of the GSI MNI (Homet et al., 2022).
This study also considers in depth the impact of the scoring methodology used in the analysis. Often, the scale and number of variables becomes a heavier focus in this type of research, yet it is equally as important to be confident in how vulnerability is being measured. This study exemplifies that there can be a significant difference in results when using different scoring methods and future research is needed to explore more types of scoring and the benefits and drawbacks of each method.
Connecting GSI need to GSI type is critical for the development of equitable stormwater runoff mitigation services. This study proposed an initial method of relating GSI need and GSI type. Further, this research introduces a mechanism for accounting for co-benefits of GSI within the planning process. Limitations of this study relate to data and methodological approach. Vulnerability variables were selected based on previous literature and common vulnerability measures but are not exhaustive and do not cover all areas of impact in urban settings. In addition, our approach to connect GSI need and type is based on limited available data of GSI co-benefits and requires further study including better measurements of GSI co-benefits and GSI performance. Physical data collection of maintenance needs and actual co-benefits, as well as surveys of neighborhood interests and interactions with GSI. Future work into equitable infrastructure planning needs to incorporate models set up for evolving data and should consider the impacts of weighting vulnerabilities within indices.
It is well known that cities and urban areas are constantly growing and changing, Philadelphia is no exception. There is no one solution to implementing climate adaptation infrastructure in an equitable manner. The specific needs and impacts of every community are different which makes it critical that the most updated data is utilized, and when not available, collected, for this type of vulnerability research. This can help to keep track of changes in inequity across urban areas, especially as it coincides with changes in climate events and their intensity.
Data availability statement
The original contributions presented in the study are included in the article/Supplementary Material, further inquiries can be directed to the corresponding author.
Author contributions
Conceptualization: PK, KH, VS, and SS. Data Collection: KH, PK, VS. Formal Data Analysis: KH and PK. Writing: KH, PK, VS, and SS. Supervision and Funding Acquisition: PK, VS, and SS.
Funding
The Department of Geography and the Environment at Villanova University supported this study by providing KH with Graduate Assistantship and a Graduate Summer Research Grant. In addition, this work received funding from Villanova University’s Falvey Memorial Library Scholarship Open Access Reserve (SOAR) Fund.
Conflict of interest
The authors declare that the research was conducted in the absence of any commercial or financial relationships that could be construed as a potential conflict of interest.
Publisher’s note
All claims expressed in this article are solely those of the authors and do not necessarily represent those of their affiliated organizations, or those of the publisher, the editors and the reviewers. Any product that may be evaluated in this article, or claim that may be made by its manufacturer, is not guaranteed or endorsed by the publisher.
Supplementary material
The Supplementary Material for this article can be found online at: https://www.frontiersin.org/articles/10.3389/fenvs.2022.958704/full#supplementary-material
Footnotes
1Personal communication with Elizabeth Svekla, a planning manager at the PWD, 24 February 2022.
References
American Society of Landscape Architects, (2016). The copenhagen cloudburst formula: A strategic process for planning and designing blue-green interventions. Copenhagen: ASLA Professional Awards. https://www.asla.org/2016awards/171784.html.
Armal, S., Porter, J. R., Lingle, B., Chu, Z., Marston, M. L., and Wing, O. E. J. (2020). Assessing property level economic impacts of climate in the US, new insights and evidence from a comprehensive flood risk assessment tool. Climate 202088 (10), 116. Page 116. doi:10.3390/CLI8100116
Ashley, W. S., and Strader, S. M. (2016). Recipe for disaster: How the dynamic ingredients of risk and exposure are changing the tornado disaster landscape. Bull. Am. Meteorological Soc. 97 (5), 767–786. doi:10.1175/bams-d-15-00150.1
Backhaus, A., and Fryd, O. (2013). The aesthetic performance of urban landscape-based stormwater management systems: A review of twenty projects in northern europe. J. Landsc. Archit. 8 (2), 52–63. doi:10.1080/18626033.2013.864130
Bagwe, M. D. (2017). Climate change and resulting floods: Using social capital to strengthen community resilience in Eastwick. A Known Floodplan.
Baykal, A. (2012). The city of copenhagen cloudburst management plan 2012, 1–28. Atlanta. Available at: http://en.klimatilpasning.dk/media/665626/cph_-_cloudburst_management_plan.pdf.
Bell, C. D., Spahr, K., Asce, S. M., Grubert, E., Asce, A. M., Stokes-Draut, J., et al. (2018). Decision making on the gray-green stormwater infrastructure continuum. J. Sustain. Water Built Environ. 5 (1), 04018016. doi:10.1061/JSWBAY.0000871
Brody, S. D., Zahran, S., Highfield, W. E., Grover, H., and Vedlitz, A. (2008). Identifying the impact of the built environment on flood damage in Texas. Disasters 32 (1), 1–18. doi:10.1111/j.1467-7717.2007.01024.x
Bull-Kamanga, L., Diagne, K., Lavell, A., Leon, E., Lerise, F., MacGregor, H., et al. (2003). From everyday hazards to disasters: The accumulation of risk in urban areas. Environ. Urban. 15 (1), 193–204. doi:10.1177/09562478030150010910.1177/095624780301500109
Cao, W., Zhou, Y., Güneralp, B., Li, X., Zhao, K., and Zhang, H. (2022). Increasing global urban exposure to flooding: An analysis of long-term annual dynamics. Sci. Total Environ. 817, 153012. doi:10.1016/j.scitotenv.2022.153012
Charles River Watershed Association (2008). Stormwater planter alternative information sheet. September. https://nacto.org/docs/usdg/stormwater_planter_crwa.pdf.
Chen, Y., Liu, T., Chen, R., and Zhao, M. (2020). Influence of the built environment on community flood resilience: Evidence from Nanjing City, China. Sustainability 12 (6), 2401. doi:10.3390/su12062401
Chini, C. M., Canning, J. F., Schreiber, K. L., Peschel, J. M., and Stillwell, A. S. (2017). The green experiment: Cities, green stormwater infrastructure, and sustainability. Sustainability 9 (1), 105. doi:10.3390/su9010105
Christman, Z., Meenar, M., Mandarano, L., and Hearing, K. (2018). Prioritizing suitable locations for green stormwater infrastructure based on social factors in Philadelphia. Land 7 (4), 145. doi:10.3390/land7040145
Clark, G. E., Moser, S. C., Ratick, S. J., Dow, K., Meyer, W. B., Emani, S., et al. (1998). Assessing the vulnerability of coastal communities to extreme storms. MA., USA: THE CASE OF REVERE.
Custer, R., and Nishijima, K. (2015). Flood vulnerability assessment of residential buildings by explicit damage process modelling. Nat. Hazards (Dordr). 78 (1), 461–496. doi:10.1007/s11069-015-1725-7
Cutter, S. L. (Editor) (2002). American hazardscapes: The regionalization of hazards and disasters (Washington, DC: Joseph Henry Press).
Cutter, S. L., Boruff, B. J., and Shirley, W. L. (2003). Social vulnerability to environmental hazards. Soc. Sci. Q. 84 (2), 242–261. doi:10.1111/1540-6237.8402002
Delware Valley Regional Planning Commission (2019). Equity analyses within the greater Philadelphia. Version 2.0. Available at: https://www.dvrpc.org/webmaps/ipd/#home.
Dottori, F., Szewczyk, W., Ciscar, J. C., Zhao, F., Alfieri, L., Hirabayashi, Y., et al. (2018). Increased human and economic losses from river flooding with anthropogenic warming. Nat. Clim. Chang. (989), 781–786. doi:10.1038/s41558-018-0257-z
Environmental Protection Agency, (2020). Basic information about the built environment. Available at: https://www.epa.gov/smm/basic-information-about-built-environment#:∼:text=Built%20Environment%20important%3F-,What%20is%20the%20Built%20Environment%3F,get%20from%20place%20to%20place.
Ferguson, A. P., and Ashley, W. S. (2017). Spatiotemporal analysis of residential flood exposure in the Atlanta, Georgia metropolitan area. Nat. Hazards (Dordr). 87 (2), 989–1016. doi:10.1007/s11069-017-2806-6
Flanagan, R. M. (2010). Manayunk development corporation: The search for sustainable gentrification and a parking spot. Drexel L. Rev. 3, 139.
Gallet, D. (2012). The value of green infrastructure: A guide to recognizing its economic, environmental and social benefits. Proc. water Environ. Fed. (17), 924–928. doi:10.2175/193864711802639741
Golden, H. E., and Hoghooghi, N. (2018). Green infrastructure and its catchment-scale effects: An emerging science. WIREs. Water 5 (1), e1254. doi:10.1002/wat2.1254
Heckert, M., and Rosan, C. D. (2016). Developing a green infrastructure equity index to promote equity planning. Urban For. Urban Green. 19, 263–270. doi:10.1016/j.ufug.2015.12.011
Heinrichs, D., Krellenberg, K., and Fragkias, M. (2013). SYMPOSIUM urban responses to climate change: Theories and governance practice in cities of the global South. doi:10.1111/1468-2427.12031
Herrera, J., Bonilla, C. A., Castro, L., Vera, S., Reyes, R., and Gironás, J. (2017). A model for simulating the performance and irrigation of green stormwater facilities at residential scales in semiarid and Mediterranean regions. Environ. Model. Softw. 95, 246–257. doi:10.1016/j.envsoft.2017.06.020
Hirsch, R. M., Walker, J. F., Day, J. C., and Kallio, R. (1990). “The influence of man on hydrologic systems,” in Surfa ce water hydrology: The geology of America. Editors W. G. Wolman,, and H. C. Riggs (Boulder, CO, USA: Geological Society of America), O-1.
Holt, D. E. (2021). The sediment trap: Collecting sediment from urban stormwater runoff to inform an urban sediment budget. Villanova: Villanova University.
Homet, K., Kremer, P., Smith, V., Ampomah, R., and Strader, S. M. (2022). Mapping predicted areas of common maintenance impacts to green stormwater infrastructure in Philadelphia, Pennsylvania. J. Sustain. Water Built Environ. 8 (3), 05022003. doi:10.1061/jswbay.0000986
Hosseiny, H., Nicole, K., and Marks, V. P. B. (2022). Social vulnerability to local flooding and heat in a city landscape. Villanova. Draft - Not yet. (In Review).
Hosseiny, H., Crimmins, M., Smith, V., and Kremer, P. (2020). A generalized automated framework for urban runoff modeling and its application at a citywide landscape, 1–20.
Hunt, W. F., Lord, W. G., and Smith, J. T. (2005). “Determining BMP inspection and maintenance costs for structural BMPs in North Carolina,” in Impacts of global climate change, 1–6.
Jarden, K. M., Jefferson, A. J., and Grieser, J. M. (2016). Assessing the effects of catchment-scale urban green infrastructure retrofits on hydrograph characteristics. Hydrol. Process. 30 (10), 1536–1550. doi:10.1002/hyp.10736
Koks, E. E., Jongman, B., Husby, T. G., and Botzen, W. J. (2015). Combining hazard, exposure and social vulnerability to provide lessons for flood risk management. Environ. Sci. policy 47, 42–52. doi:10.1016/j.envsci.2014.10.013
Kossin, J. P. (2018). A global slowdown of tropical-cyclone translation speed. Nature 558 (7708), 104–107. doi:10.1038/s41586-018-0158-3
Kovats, S., Wilkinson, P., and Menne, B. (2010). Social inequalities in environmental risks associated with global climate change. Environment and health risks: A review of the influence and effects of social inequalities.
Krellenberg, K., Welz, J., Link, F., and Barth, K. (2016). Urban vulnerability and the contribution of socio-environmental fragmentation : Theoretical and methodological pathways. doi:10.1177/0309132516645959
Lavell, A., Oppenheimer, M., Diop, C., Hess, J., Lempert, R., Li, J., and Weber, E. (2012). “Climate change: New dimensions in disaster risk, exposure, vulnerability, and resilience,” in Managing the risks of extreme events and disasters to advance climate change adaptation: Special report of the intergovernmental panel on climate change (Cambridge University Press), 25–64.
Liu, J., Sample, D. J., Bell, C., and Guan, Y. (2014). Review and research needs of bioretention used for the treatment of urban stormwater. WaterSwitzerl. 6 (4), 1069–1099. doi:10.3390/w6041069
Mailhot, A., and Duchesne, S. (2010). Design criteria of urban drainage infrastructures under climate change. J. Water Resour. Plan. Manag. 136 (2), 201–208. doi:10.1061/(asce)wr.1943-5452.0000023
Mandarano, L., and Meenar, M. (2017). Equitable distribution of green stormwater infrastructure: A capacity-based framework for implementation in disadvantaged communities. Local Environ. 22 (11), 1338–1357. doi:10.1080/13549839.2017.1345878
Matsler, A. M., Meerow, S., Mell, I. C., and Pavao-Zuckerman, M. A. (2021). A ‘green’chameleon: Exploring the many disciplinary definitions, goals, and forms of “green infrastructure”. Landsc. Urban Plan. 214, 104145. doi:10.1016/j.landurbplan.2021.104145
Maxwell, J. T., Bregy, J. C., Robeson, S. M., Knapp, P. A., Soulé, P. T., and Trouet, V. (2021). Recent increases in tropical cyclone precipitation extremes over the US east coast. Proc. Natl. Acad. Sci. U. S. A. 118 (41), e2105636118. doi:10.1073/pnas.2105636118
McGarity, A., Hung, F., Rosan, C., Hobbs, B., Heckert, M., and Szalay, S. (2015). Quantifying benefits of green stormwater infrastructure in Philadelphia. In World environmental and water resources congress 2015: Floods, droughts, and ecosystems - proceedings of the 2015 world environmental and water resources congress, 409–420. doi:10.1061/9780784479162.037
McMichael, A. J. (2000). The urban environment and health in a world of increasing globalization: Issues for developing countries. Bull. World Health Organ. 78 (9), 1117–1126. doi:10.1590/S0042-96862000000900007
McPhillips, L. E., and Matsler, A. M. (2018). Temporal evolution of green stormwater infrastructure strategies in three us cities. Front. Built Environ. 4, 26. doi:10.3389/fbuil.2018.00026
McPhillips, L. E., Matsler, M., Rosenzweig, B. R., and Kim, Y. (2021). What is the role of green stormwater infrastructure in managing extreme precipitation events? Sustain. resilient infrastructure 6 (3-4), 133–142. doi:10.1080/23789689.2020.1754625
Meenar, M., Howell, J. P., Moulton, D., and Walsh, S. (2020). Green stormwater infrastructure planning in urban landscapes: Understanding context, appearance, meaning, and perception. Land 9 (12), 534. doi:10.3390/land9120534
Meerow, S. (2020). The politics of multifunctional green infrastructure planning in New York City. Cities 100, 102621. doi:10.1016/j.cities.2020.102621
Nofal, O. M., and Van De Lindt, J. W. (2020). Understanding flood risk in the context of community resilience modeling for the built environment: Research needs and trends, 1–17.Sustain. Resilient Infrastructure
OpenDataPhilly, (2017). Department of records property parcels dataset. Philadelphia’s Department of Records. Available at: https://www.opendataphilly.org/dataset/property-parcels.
OpenDataPhilly, (2021). Fire department facilities. Philadelphia: Fire Department. Available at: https://www.opendataphilly.org/dataset/philadelphia-fire-department-facilities.
OpenDataPhilly, (2021). Philadelphia hospitals. Philadelphia. Available at: https://www.opendataphilly.org/dataset/philadelphia-hospitals.
OpenDataPhilly, (2021). Schools. Philadelphia: Department of Planning and Development. Available at: https://www.opendataphilly.org/dataset/schools.
Philadelphia Water Department (2016). 5 down, 20 to go: Celebrating 5 years of cleaner water and greener neighborhoods. Available at: https://water.phila.gov/drops/5down/.
Philadelphia Water Department (2011). Green city clean waters. The city of Philadelphia’s program for combined sewer overflow control program summary.
Philadelphia Water Department (2012). Green city, clean waters green infrastructure maintenance manual development process plan. Available at: https://nacto.org/docs/usdg/green_city_clean_waters_philadelphia.pdf.
Philadelphia Water Department (2016). Green stormwater infrastructure public and private projects. Available at: https://www.opendataphilly.org/.
plaNYC, (2008). Sustainable stormwater management plan. Mayor’s office of long-term planning and sustainability. Available at: http://www.nyc.gov/html/planyc/downloads/pdf/publications/nyc_sustainable_ stormwater_management_plan_final.pdf.
Priemus, H., and Rietveld, P. (2009). Climate change, flood risk and spatial planning. built Environ. 35 (4), 425–431. doi:10.2148/BENV.35.4.425
Raymond, J., Wheeler, W., and Brown, M. J. (2011). National center for environmental health, CDC.inadequate and unhealthy housing, 2007 and 2009Morbidity and mortality weekly report (MMWR). Philadelphia: Centers for Diesease Control and Prevention. Available at: https://www.cdc.gov/mmwr/preview/mmwrhtml/su6001a4.htm.
Romero-lankao, P., Qin, H., and Dickinson, K. (2012). Urban vulnerability to temperature-related hazards : A meta-analysis and meta-knowledge approach. Glob. Environ. Change 22 (3), 670–683. doi:10.1016/j.gloenvcha.2012.04.002
Rosenzweig, B., Ruddell, B. L., McPhillips, L., Hobbins, R., McPhearson, T., Cheng, Z., et al. (2019). Developing knowledge systems for urban resilience to cloudburst rain events. Environ. Sci. Policy 99 (2018), 150–159. doi:10.1016/j.envsci.2019.05.020
Salerno, F., Gaetano, V., and Gianni, T. (2018). Urbanization and climate change impacts on surface water quality: Enhancing the resilience by reducing impervious surfaces. Water Res. 144, 491–502. doi:10.1016/j.watres.2018.07.058
Seattle Public Utilities (2009). Seattle public Utilities green stormwater operations and maintenance manual. https://www.seattle.gov/util/cs/groups/public/@spu/@usm/documents/webcontent/spu02_020023.pdf.
Shade, C., Kremer, P., et al. Shade, C., Kremer, P., Rockwell, J. S., and Henderson, K. G. (2020). The effects of urban development and current green infrastructure policy on future climate change resilience. Ecol. Soc. 25(4), 1–10. doi:10.5751/ES-12076-250437
Smith, C., Connolly, R., Ampomah, R., Hess, A., Sample-Lord, K., and Smith, V. (2021). Temporal soil dynamics in bioinfiltration systems. J. Irrig. Drain. Eng. 147 (11), 04021053. doi:10.1061/(asce)ir.1943-4774.0001617
Southeastern Pennsylvania Transportation Authority (2021). GIS Data PortalAvailable at: https://septaopendata-septa.opendata.arcgis.com/.
Southwestern Pennsylvania Commission Water Resource Center (2016). Quick resource guide to the MS4 program. Available at: https://files.dep.state.pa.us/EnvironmentalEd/Environmental%20Education/ EnvEdPortalFiles/MS4%20Resource%20Guide.pdf.
Steis Thorsby, J., Miller, C. J., and Treemore-Spears, L. (2020). The role of green stormwater infrastructure in flood mitigation (Detroit, MI USA) – case study. Urban Water J. 17 (9), 838–846. doi:10.1080/1573062X.2020.1823429
Taguchi, V. J., Weiss, P. T., Gulliver, J. S., Klein, M. R., Hozalski, R. M., Baker, L. A., et al. (2020). It is not easy being green: Recognizing unintended consequences of green stormwater infrastructure. Water 12 (2), 522. doi:10.3390/w12020522
Tate, E. (2013). Uncertainty analysis for a social vulnerability index. Ann. Assoc. Am. Geogr. 103 (3), 526–543. doi:10.1080/00045608.2012.700616
Trenberth, K. E. (2011). Changes in precipitation with climate change. Clim. Res. 47 (1-2), 123–138. doi:10.3354/cr00953
Trenberth, K. E. (1999). “Conceptual framework for changes of extremes of the hydrological cycle with climate change,” in Weather and climate extremes (Dordrecht: Springer), 327–339.
United Nations Population Fund (2014). Population and sustainable development in the post-2015 agenda: Report of the global thematic consultation on population dynamics.
United States Census Bureau, (2022). American community survey (ACS). https://www.census.gov/programs-surveys/acs.
U.S. Census Bureau (2021). QuickFacts: Philadelphia city, Pennsylvania. Retrieved March 1, 2022 from Available at: https://www.census.gov/quickfacts/fact/table/philadelphiacitypennsylvania/POP060210#POP060210.
van der Wiel, K., Kapnick, S. B., van Oldenborgh, G. J., Whan, K., Philip, S., Vecchi, G. A., et al. (2017). Rapid attribution of the August 2016 flood-inducing extreme precipitation in south Louisiana to climate change. Hydrol. Earth Syst. Sci. 21 (2), 897–921. doi:10.5194/hess-21-897-2017
Wadzuk, B., Gile, B., Smith, V., Ebrahimian, A., Strauss, M., and Traver, R. (2021). Moving toward dynamic and data-driven GSI maintenance. J. Sustain. Water Built Environ. 7 (4), 02521003. doi:10.1061/jswbay.0000958
Wadzuk, B., Gile, B., Smith, V., Ebrahimian, A., and Traver, R. (2021). Call for a dynamic approach to GSI maintenance. J. Sustain. Water Built Environ. 7 (2), 02521001. doi:10.1061/jswbay.0000945
Walsh, K. J., McBride, J. L., Klotzbach, P. J., Balachandran, S., Camargo, S. J., Holland, G., et al. (2016). Tropical cyclones and climate change. WIREs Clim. Change 7 (1), 65–89. doi:10.1002/wcc.371
Yang, Q., Scanlon, B. R., Zhu, L., Emanuel, K., Quiring, S. M., and Smiley, K. T. (2020). Social inequalities in flooding inside and outside of floodplains during Hurricane Harvey. Environ. Res. Lett. 15 (9), 0940b3. doi:10.1088/1748-9326/ABA0FE
Keywords: green stormwater infrastructure, GSI planning, GSI maintenance, Philadelphia, urban planning
Citation: Homet K, Kremer P, Smith V and Strader S (2022) Multi-variable assessment of green stormwater infrastructure planning across a city landscape: Incorporating social, environmental, built-environment, and maintenance vulnerabilities. Front. Environ. Sci. 10:958704. doi: 10.3389/fenvs.2022.958704
Received: 31 May 2022; Accepted: 10 August 2022;
Published: 01 September 2022.
Edited by:
Francesco Orsi, Wageningen University and Research, NetherlandsReviewed by:
Viviana Pappalardo, University of Catania, ItalyDaniel Balsalobre-Lorente, University of Castilla-La Mancha, Spain
Copyright © 2022 Homet, Kremer, Smith and Strader. This is an open-access article distributed under the terms of the Creative Commons Attribution License (CC BY). The use, distribution or reproduction in other forums is permitted, provided the original author(s) and the copyright owner(s) are credited and that the original publication in this journal is cited, in accordance with accepted academic practice. No use, distribution or reproduction is permitted which does not comply with these terms.
*Correspondence: Peleg Kremer, peleg.kremer@villanova.edu
†ORCID: Peleg Kremer, orcid.org/0000-0001-6844-5557; Virginia Smith, orcid.org/0000-0002-5640-8692; Stephen Strader, orcid.org/0000-0002-6472-3182