Process-based modeling of soil nitrous oxide emissions from United States corn fields under different management and climate scenarios coupled with evaluation using regional estimates
 Yushu Xia
 Michelle M. Wander
 Steven M. Quiring
 Shanshui Yuan
 Hoyoung Kwon
- 1Department of Natural Resources and Environmental Sciences, University of Illinois, Urbana, IL, United States
- 2Department of Geography, The Ohio State University, Columbus, OH, United States
- 3Yangtze Institute for Conservation and Development, Hohai University, Nanjing, China
- 4Energy Systems and Infrastructure Analysis Division, Argonne National Laboratory, Lemont, IL, United States
Direct emissions of soil nitrous oxide during a growing season (N2Ogs) can be quantified with process-based models considering interactions between management, climate, and soil moisture when key data are available. We used an adapted “parameterized CENTURY/DAYCENT-model” (pCENTURY) calibrated with crop growth and soil organic matter decay coefficients at the county-level for the estimation of N2Ogs in the United States Corn Belt. Model estimated N2O-emissions from corn-based biofuels scenarios considering crop rotation, fertilizer inputs, tillage, and weather were compared against meta-summary of field observations from 55 studies. Both model and meta-summary ranked N2Ogs-emissions to be corn > wheat > soybean phase while model likely underestimated cover crop N2Ogs-emissions. The N2Ogs-emissions and the associated emission factors (EFs) were modeled and summarized to be greater after anhydrous ammonia than urea application and from conventional tilled than non-tilled fields. Modeled and observed N2Ogs-emissions after organic and inorganic fertilizer amendment did not differ due to high variability associated with the treatments. However, the organic fertilizer associated EFs were greater according to meta-summary data because of N input rates. Regionalized weather scenarios indicate hotspots for N2Ogs-emissions can occur where crop N uptake is limited during dry years and in eastern states also during normal or wet seasons. The pCENTURY-derived N2Ogs EFs (0.91
1 Introduction
Many studies attempt to quantify broad-scale agriculturally-related greenhouse gas (GHG) emissions (Mosier et al., 1998; Lokupitiya and Paustian, 2006; Yao et al., 2006; Li, 2007; Olander et al., 2013) and soil organic carbon (SOC) sequestration (Sleutel et al., 2003; Stockmann et al., 2013; Nayak et al., 2019; Paustian et al., 2019) to support policymaking and GHG accounting. Efforts have intensified in the United States with a recommitment to GHG reductions and the Paris Agreement (Rumpel et al., 2018; Guenet et al., 2021). In particular, nitrous oxide (N2O) which has a global warming potential (GWP) that is 298 times greater than carbon dioxide (CO2) (IPCC, 2006) has gained enormous attention that leads to research on mitigating N2O emissions through adaptive management practices (Mosier et al., 1996; Ogle et al., 2014; Maaz et al., 2021) and quantifying environmental impacts of N2O emissions in a future climate (Butterbach-Bahl and Dannenmann, 2011; He et al., 2018; Ma et al., 2018).
Improving the capacity to quantify agricultural N2O emissions at the regional or national scales under various management and climate scenarios is a priority for agriculture which accounts for approximately two-thirds of the total N2O emissions (IPCC, 2019). Broad-scale GHG inventories (Zheng et al., 2004; Rochette et al., 2008; Mazzetto et al., 2020) and life cycle analyses (LCA) have estimated soil N2O emissions using IPCC emission factors (EFs), which is defined as the ratio between N2O emissions and N input rates, at Tier-1 (global values) (Bouwman, 1996) or Tier-2 (regionally-specific values adjusted with covariates or classes) scales (IPCC, 2006; Hergoualc’h et al., 2019). Model-based estimates that better account for soil organic matter (SOM) dynamics and site-specific environmental and management factors (Li et al., 1992; Hansen, 2002; Gilhespy et al., 2014; Berardi et al., 2020; Del Grosso et al., 2020) are increasingly being used for valorization and GHG accounting (Crossman et al., 2013; Banger et al., 2017; Sela et al., 2017; Osmond et al., 2018). Spatially-gridded models coupled with scenario analysis provide an important opportunity to improve GHG inventories by revealing regional differences in N2O loss resulting from site and management-specific interactions (Laville et al., 2011; Iqbal et al., 2018).
Several broad (Tesfaye et al., 2021) and national-scale studies have used process-based models (Table 1) to estimate spatial variability of soil-based N2O emissions at fine (e.g., county) spatial resolutions in order to inform management at a meaningful spatial unit. Unfortunately, many of these studies only carried out model validation by comparison with field observations collected over a narrow range or individual site or using Tier-1 estimates, which yielded little spatial or temporal information. Considering that the high variability of growing season N2O (N2Ogs) contributes to the main challenge of N2O quantification (Werner et al., 2007; Leip et al., 2011; Smith, 2017), Tier-2 estimates derived from strategically compiled covariates or class-based datasets are needed to generate EFs to evaluate regionalized estimates generated with process models (de Klein et al., 2020).
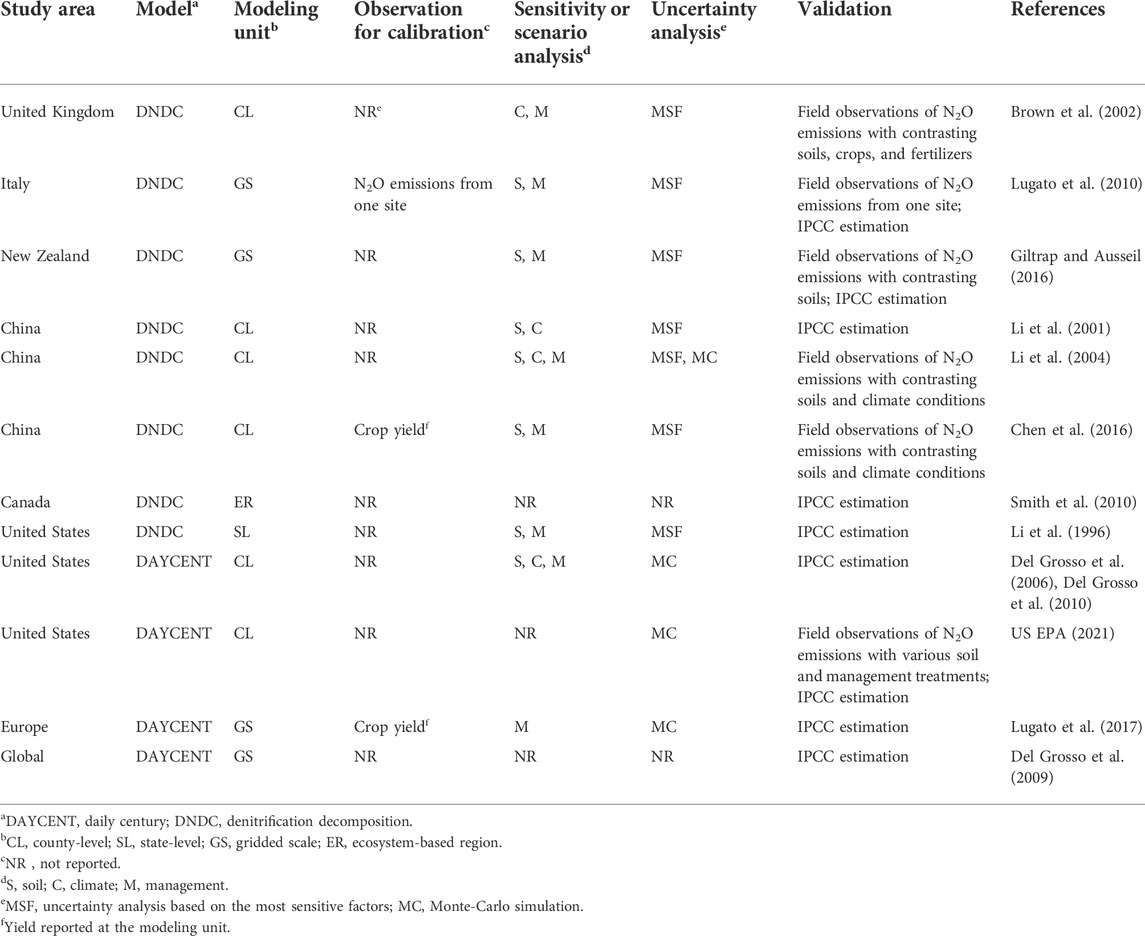
TABLE 1. Process-based models applied to estimate soil N2O emissions at the national or broader scale.
To effectively model N2O emissions and the associated EFs, it is necessary to calibrate and evaluate crop growth, soil moisture and SOC (Del Grosso et al., 2011). At present, very few studies (Table 1) have calibrated key parameters or validated N-submodel outputs other than N2O emissions. The performance of SOC-submodels has been improved by adjustment of crop growth and soil decay factors using field observations of crop yield and SOC (Meersmans et al., 2013; Kwon et al., 2017; Gautam et al., 2020). Few broad-scale studies of soil N2O flux have evaluated soil moisture estimates or the influence of temporal weather variability on emissions even though these are key drivers of N2O across scales (Weitz et al., 2001; Wagner et al., 2003; Butterbach-Bahl et al., 2013). Models typically rely on surrogates such as soil texture and SOM coupled with simple water budget-based method to simulate moisture patterns (Saxton and Rawls, 2006). Datasets like North American Soil Moisture Dataset (NASMD) (Quiring et al., 2016; Yuan et al., 2021) that report uniform moisture present an opportunity to evaluate regional and temporal estimates needed for Tier-2 modeling of N2O.
Model performance is greatly influenced by data quality, and this is particularly problematic for N fertilizer input types and rates, which are one of the most influential management factors determining N2O (Akiyama et al., 2006; Kros et al., 2012; Eagle et al., 2017). Unfortunately, most efforts use N data reported at the state or regional level (Li et al., 1996; Del Grosso et al., 2006; Del Grosso et al., 2010). Inadequacies in the data describing N fertilizer additions to croplands that account for as much as half of direct N2O emissions from agricultural soils, has resulted in large uncertainty in Tier-1 and 2-based estimates of soil N2O EFs (Tian et al., 2020). A newly available United States county-level dataset for corn fertilizer N application rates (Xia et al., 2021) significantly improves N input data resolution. In addition, estimates of N2Ogs must also account for the form of N fertilizers applied because chemical structure and organic and inorganic materials differ in their influence on N2O emissions (Petersen et al., 1996; Shcherbak et al., 2014; Liu S. et al., 2017) and such differences need to be quantified to inform decision-making regarding agricultural N management. Default fertilizer coefficients commonly used in N2O models can also be verified using compilations of field observations. The same is true for model coefficients used by N2O models to adjust rates based on agricultural management practices. Ideally models can account for spatial interactions that can produce variable effects of practices such as reduced tillage (Chatskikh and Olesen, 2007; Mei et al., 2018), residue incorporation (Vinther et al., 2004; Li et al., 2010), fertilization and irrigation (Grant et al., 2006; Del Grosso et al., 2008; Katayanagi et al., 2012), cover crops (Farahbakhshazad et al., 2008; Abdalla et al., 2019; Muhammad et al., 2019), and crop diversification on N2O emissions (Petersen et al., 2006; Parihar et al., 2018). Model-derived and Tier-2 summary-based estimates of management-associated N2Ogs emissions at the broad scale are critical to promoting the adoption or implementation of practices that can contribute to GHG mitigations.
Challenges for broad-scale modeling of N2Ogs remain as we continue to strive to translate modeling concepts into practical tools using reproducible and transparent methods. These kinds of tools are needed to support policies like the United States. Renewable Fuel Standards (RFS) which was first launched in 2005 (Malmedal et al., 2007) and spurred development of environmental assessment and LCA of corn ethanol production (Wang et al., 2007; Hsu et al., 2010; Hong et al., 2015; Lewandrowski et al., 2020), which accounts for about two-thirds of the United States biofuel production (Birol, 2018) and has accounted for the majority of the biofuel volume required by the RFS (Bracmort, 2022). Moreover, the complexity of management impacts, as well as their interactions with weather conditions, suggest the need for broad-scale modeling to better account for scenario-based soil N2O emissions that are representative of future climate conditions (Abdalla et al., 2010; Karimi et al., 2021; Miller et al., 2022). This work takes advantage of a ‘surrogate or parameterized’ version of the process-based CENTURY SOM model (PCENTURY) developed by Kwon and Hudson (2010) to estimate N2O emissions from corn-based management systems in the United States Corn Belt. The model capacity of PCENTURY was expanded here to estimate county-level N2O emissions by drawing on N and hydrology submodels from the daily version of CENTURY (DAYCENT) and improved N input datasets. The objectives of this study were to evaluate regional and temporal soil moisture estimates and compare management scenario-based estimates of N2Ogs-emissions against Tier-2 meta-datasets representing dominant management practices (crop rotation, N input type, tillage) used by corn-based systems in major corn-producing states. The model was then used to simulate N2Ogs-emissions under regionalized estimates of wet, dry, and average weather conditions because future climate scenarios are usually associated with pronounced changes in precipitation (Sillmann et al., 2013; Liu C. et al., 2017).
2 Materials and methods
2.1 Model expansion and simulation
This study expanded the PCENTURY model (Kwon and Hudson., 2010; Kwon et al., 2013; Kwon et al., 2017) (SI: Supplementary Figure D1) by adopting the main structures and algorithms of the plant growth, water budget, soil temperature, nitrification and denitrification modules of DAYCENT (Parton et al., 1998) for N2O modeling (SI: Supplementary Appendix SA). The resulting model simulates SOC stocks, crop biomass, soil moisture, plant available N, and soil N loss on a monthly time step. Land use and land management change scenarios were developed using a gridded SOC modeling framework developed by Kwon et al. (2020) to assess GHG emissions from corn biofuel production. The framework employs four phases of land use history described in SI: Supplementary Appendix SA. The model baseline for comparison consists of a corn-soybean rotation (CS), averaged tillage (USDA, 2019), and synthetic N fertilizer additions (USDA, 2018) under normal weather conditions defined by a 30-year average (1986–2015). Model inputs including soil, climate, crop, and management data (Table 2) and the model calibration process are described more fully in SI: Supplementary Appendix SB. Alternative rotation scenarios begin with the baseline conditions and consider continuous corn (CC) and diversified cropping systems that included a 2-year corn/rye-soybean/vetch rotation (CCvSCv) and a 3-year corn-soybean/winter wheat-ryegrass rotation (CSWCv) (Figure 1). Conventional and no-tillage scenarios were run within the baseline CS rotation. Several N input scenarios (anhydrous ammonia (AA), urea, animal manure) were run within diversified rotations. Finally, weather scenarios were run within the conventionally-tilled CS rotation substituted dry and wet average monthly weather conditions from the driest and wettest year observed between 1986 and 2015 at the county level. This created unique weather stress patterns for each county. The scenario-based simulation was carried out for a 6-year time period (2016–2021) in major United States corn-producing states with model inputs (Table 2) and calibration process described in SI: Supplementary Appendix SB.

TABLE 2. Data sources for key pCENTURY model input variables.
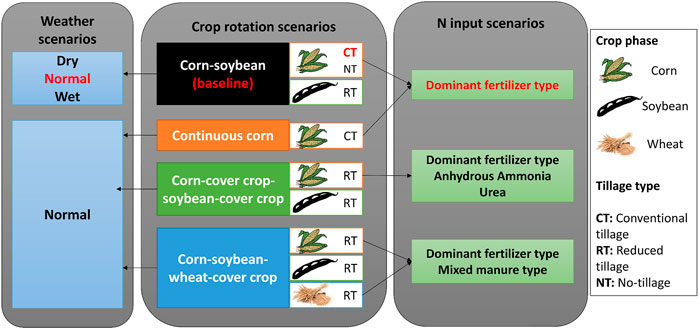
FIGURE 1. Management and weather scenarios used for pCENTURY-based simulation of soil N2O emissions for 2016-2021 from corn fields. The baseline rotation and tillage scenario marked in red is considered the most common practice within major corn growing states in the United States The normal weather condition is defined with a 30-year average (1986–2015) before the simulation period. Dry and wet weather conditions were simulated by replacing monthly weather data inputs with the driest and wettest months between 1986 and 2015.
2.2 Model evaluation
2.2.1 Preliminary evaluation of simulated soil moisture using NASMD observations
Model simulated soil moisture estimated within the CS scenario was compared to the NASMD dataset that includes observed volumetric water content in the 0-10 and 0–100 cm soil depths. Since PCENTURY simulates soil moisture at 0-30 and 30–100 cm soil depths, a weighted average was used for 0–100 cm comparisons. The NASMD data were reported at the gridded scale (0.25°) by harmonizing soil moisture observations from 16 regional and national soil moisture monitoring networks (Xia et al., 2015a). The data were interpolated to the county-level for croplands identified by the National Land Use Dataset (Homer et al., 2007; Homer et al., 2015) to match with county-level simulations. To match with PCENTURY time-step, monthly NASMD soil moisture was calculated by averaging daily values for each month during the 10-year period (2003–2012) for which records were available. The comparisons were carried within agroecological zones (AEZ) that group counties with similar climate conditions (Batjes et al., 1997). Model simulated monthly soil moisture during this time period were also compared directly against NASMD observations as an evaluation of model simulated temporal pattern. Correlation between PCENTURY anomalies (PCENTURY minus NASMD) and key modeling factors including corn and soybean yields, soil properties, and weather were used to explore differences between modeled and measured results.
2.2.2 Comparison between model simulated soil N2Ogs and a meta-analytical summary
Modeled N2Ogs-emissions under the normal weather condition were evaluated with the Tier-2 meta-analytical summary of 705 observations (treatment-year combinations) of field emissions made during the growing season within major corn-producing states. Data extraction, quality control, distribution of study sites, and detailed management information of the studies are presented in SI: Supplementary Appendix SC. Soil N2Ogs-emissions were simulated in PCENTURY based on the planting and harvest dates specified by USDA (2010) and assumed to be representative for annual N2O emissions. Then, we compared the modeled emissions with the meta-dataset to evaluate PCENTURY’s capacity to estimate changes in flux associated with management scenarios considered. The cropping comparisons include CC versus CS or CS-based rotations where the 2-year corn/rye-soybean/vetch simulation was compared with observations from CCvSCv systems, and corn-soybean/winter wheat-ryegrass simulation was compared with CSWCv systems. Input comparisons included synthetic versus organic (manure, effluent, composts, residues) and anhydrous ammonia versus urea. Finally, meta-data summaries of conventional versus reduced or no-tillage, were compared against model simulated results.
2.3 Estimating regional differences in soil N2O emissions from corn production
Considering future climate scenarios, growing season N2Ogs-emissions were simulated for dry, normal, and wet weather scenarios at the county-level before linear regression was carried out in R (R Core Team, 2020) to describe regional differences in simulated N2Ogs-emissions by AEZ and their relationships to key model inputs (N rate, precipitation, and yield) and outputs (soil moisture and plant available N).
Soil N2O EF was calculated with Eq. 1 for different modeling scenarios and the simulation results of the baseline scenario were compared against IPCC Tier-1 estimates (both the 2006 and the revised 2019 versions) and Tier-2 meta-analytical summary. We considered the contribution of crop residue inputs for the calculation of N2O EFs using both the modeling and the meta-analysis approach in order to align with the definition of the IPCC method.
3 Results and discussion
3.1 Preliminary evaluation on model simulated temporal and regional soil moisture
Our attempt to evaluate soil moisture estimates of PCENTURY is only preliminary considering that the model currently generated results at a monthly time-step which is much coarser than the actual soil moisture changes in time. However, since the evaluation of model simulated soil moisture has been largely ignored by previous broad-scale N2O modeling work (Table 1), we hope that our preliminary efforts can lead to a more standardized, rigorous model calibration and validation scheme for future work aiming to provide spatial and temporal insights into soil N2O modeling at the regional or national scale.
Monthly soil moisture patterns for NASMD and PCENTURY estimates were similar during the growing season (R2 = 0.68) when monthly averages were calculated based on a 10-year time period (SI: Supplementary Figure D2). This is consistent with Xia et al. (2015b), who found agreement between warm-season soil moisture estimates (NASMD) and land-surface model simulations. Our temporal match was slightly better for whole profile (0–100 cm) comparisons than those made for the near-surface. The tendency for NASMD estimates to be drier and less variable in surface depths during winter was observed for all AEZs. This differs from Abdalla et al. (2020) where DeNitrification-DeComposition (DNDC) significantly underestimated field-scale soil moisture. The observed difference is likely due in part to the fact that NASMD data represent the 0–10 cm and not the 0–30 cm depth simulated by PCENTURY. In our study, model overestimation of soil moisture was observed during the cool season in soils with higher clay contents when a crop was not present (SI: Supplementary Table D1). Overestimation also increased with precipitation and temperature, although such trends would have been better reflected by finer simulation resolution (e.g., daily or hourly) than the current monthly time-step of the model. Greater ability to model evaporation, snow cover, and frozen status is likely to improve non-season moisture estimates (Chantigny et al., 2016).
The temporal variation in monthly soil moisture during the 10 years was moderately captured by PCENTURY (Figure 2), with Pearson correlation between NASMD and PCENTURY calculated to be 0.67 and 0.80 for the top and whole soil layers, respectively. Unfortunately, the correlation was very weak for the winter-spring non-growing season for the top soil layer (R = 0.3). It might be the case that our monthly PCENTURY model was not able to fully capture the impact of precipitation or snow events in terms of their timing and duration on soil moisture dynamics. Soil moisture can be influential on inter-annual variations in soil N2O emissions (Skiba and Smith, 2000; Smith et al., 2004; Oorts et al., 2007) so further improvement of model structure and calibration on parameters for calculating soil hydraulic properties (e.g., hydraulic conductivity, wilting point, field capacity) is needed to better simulate soil moisture dynamics. Our work did not directly compare the influence of soil moisture estimates on the accuracy of N2O simulation. Ideally future work will investigate the influence of calibrating soil hydraulic parameters on simulated soil N2O emissions against field measurements. Our preliminary results showed the need to focus on the evaluation using measures from non-growing season N2O emissions because of the poor model performance on soil moisture estimates during this time period.
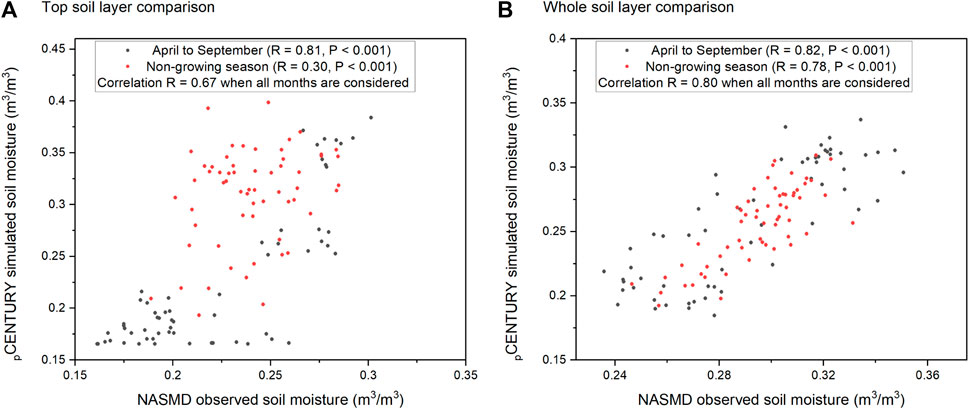
FIGURE 2. Comparison of monthly volumetric soil moisture from 2003 to 2012 estimated with pCENTURY simulation and reported by the North American Soil Moisture Dataset (NASMD) for the (A) top and (B) whole soil layer. The moisture contents were calculated as corn planting area weighted-averages for the United States Corn Belt counties investigated in this study. Surface depth soil moisture was calculated at 0–30 cm for pCENTURY and 0–10 cm for NASMD) observations and whole soil layer comparison was carried out at 0–100 cm depth. Pearson correlations between pCENTURY and NASMD were calculated for the whole dataset and for the datasets containing corn growing season (April to September) and non-growing season observations, respectively.
Spatially, while PCENTURY estimates are driven by characteristics of the dominant soil type within a county, the NASMD estimates capture field-to-field variability and likely provide a better representation of average conditions. Because county-level NASMD estimates are based on extrapolations of station-based observations that may have smoothed out spatial differences, the variances of monthly soil moisture vary less than PCENTURY-based estimates. Moreover, the variance of interpolated datasets can be affected by the number of samples (Beguería et al., 2016) and by the number of counties within an AEZ (Hofstra et al., 2010). Soil moisture estimates in AEZs with fewer counties and/or measuring sites are expected to be less variable.
3.2 Evaluating simulated soil N2O emissions influenced by management factors
3.2.1 Soil N2Ogs-emissions influenced by crops and rotation
Both modeled and database-derived Tier-2 estimates of N2Ogs-emissions were greatest in the corn phase (2.7
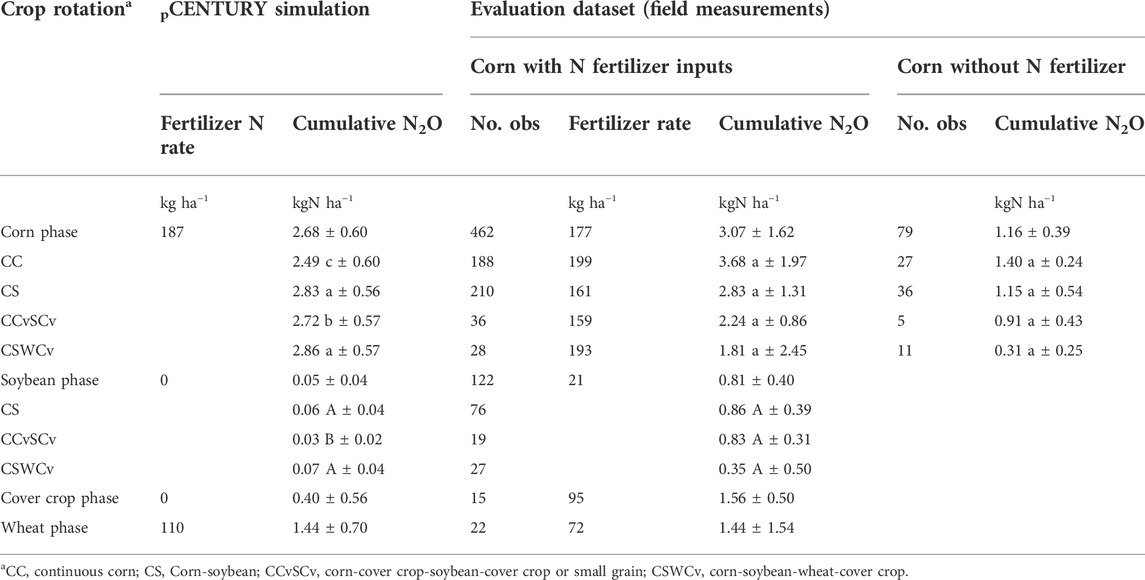
TABLE 3. Fertilizer N input rates and cumulative growing season soil N2O emissions from pCENTURY simulation and field measurements used for validation. The results are reported as model simulated county or field measured averages followed by standard deviations Different lower- and upper-case letters represent significant differences at p < 0.05 for corn and soybean phases, respectively.
Reported average N input rates were about 20% lower for corn within CS (161 kg N ha−1) than CC (199 kg N ha−1) rotations (Table 3). While data-derived estimates suggest N2Ogs-emissions during the corn phase were reduced by 24, 41, and 51% within CS, CCvSCv, or CSWCv rotations compared to CC (3.7 kg N2O ha−1), differences among rotations were not statistically significant due to high variability in field observations (Table 3). This variability resulted from edaphic factors and variability in both the quantity and quality of residues returned by cover crops and organic amendments applied before corn. Lower corn phase N2O emissions observed following soybean likely reflect adjustment of N inputs based on rotation and N credits (Sawyer et al., 2006; Castellano et al., 2018; Morris et al., 2018) that can reduce N2O flux. The PCENTURY-based corn N2O EF for the CS baseline scenario was 0.91
Non-corn phase N2O flux was generally tied to N input rates. The magnitude of modeled and estimated N2Ogs-emissions was almost identical for the wheat phase, but the variance was again greater for database-derived estimates (Table 3). While the relatively low estimates of flux from the soybean phase (<0.1 kg N2O ha−1) resulted from simulations that add no N fertilizer to that crop phase, field observations reporting use of N fertilizers or manures in 28% of observations produced estimates that were least ten-fold higher. Both direct fertilizer additions and N applied to the previous crop might contribute to enhanced N2O emissions following corn (Iqbal et al., 2015).
The pCENTURY simulated N2Ogs-emissions for the cover crop phase were much lower (74%) than estimates derived from field observations (Table 3). Similarly, Jiang et al. (2020) also showed that soil N2O emissions during the cover crop phases were modeled with much lower accuracy than those from the corn years. Our assumption that cover crops were unfertilized likely reduced model estimates. Additionally, the model may have overestimated cover crop N uptake and diminished associated N2O loss. Alternatively, our simulations may have overestimated soil moisture during winter (Figure 2) and so created redox conditions that promoted full reduction to N2 (Chapuis-lardy et al., 2007; Wu et al., 2013). Foltz et al. (2021) also found that the DNDC model failed to capture field-observed decreases in N2Ogs-emissions caused by winter cover crops. Improvements to soil moisture estimates and temporal interactions are needed to successfully capture ‘hot’ moments registered in the field. Improvement in PCENTURY modeling for non-corn crop phases will require more detailed data inputs and model calibration. Ideally, such data can be acquired from long-term cover crop experiments that measured yield, SOC changes, and the associated GHG emissions.
3.2.2 Soil N2O emissions influenced by N fertilizer type
The simulated N2Ogs-emissions from corn plots amended with inorganic and or organic fertilizers did not differ (p > 0.05) and were slightly lower than field observations. Means derived from the field observations were 16% greater after organic amendments were used (Figure 3A), but the difference between organic and inorganic sources was non-significant (p > 0.05). Elevated N2Ogs- emissions are rate sensitive and expected where manure additions deplete oxygen by stimulating heterotrophic activity (Petersen et al., 1996; Decock, 2014). While our simulations used the same rates for fertilizer and manure treatments to compare the effects of N forms, the average N input rates used for field trials were 58% greater for organic (261 kg N ha−1) than inorganic N (165 kg N ha−1) applications. More information about farming systems might be needed to justify assumptions about manure application rates to ensure that the database-derived EFs for organic (1.16%) and synthetic fertilizers (0.92%) (Table 4) are meaningful for making management recommendations. Only 16% of field observations were measured from soils treated with organic fertilizers so more data must be collected from diversified cropping systems. For example, a meta-analysis by Skinner et al. (2014) found lower N rates were applied in certified organic farming systems than in their conventional counterparts and that could be translated into reduced N2O emissions. Nevertheless, a different comparison result might be expected for concentrated feeding operations. N rate assumptions are also complicated by organic fertilizer availability that can significantly influence soil N2O emissions over time (Pang and Letey, 2000; Eghball et al., 2002; Shakoor et al., 2021). Accurate manure activity data is needed to effectively model GHG emissions for specific sites (Walling and Vaneeckhaute, 2020). For broad-scale modeling and policy-making, we must be aware of the influence that rate assumptions may exert on outcomes.
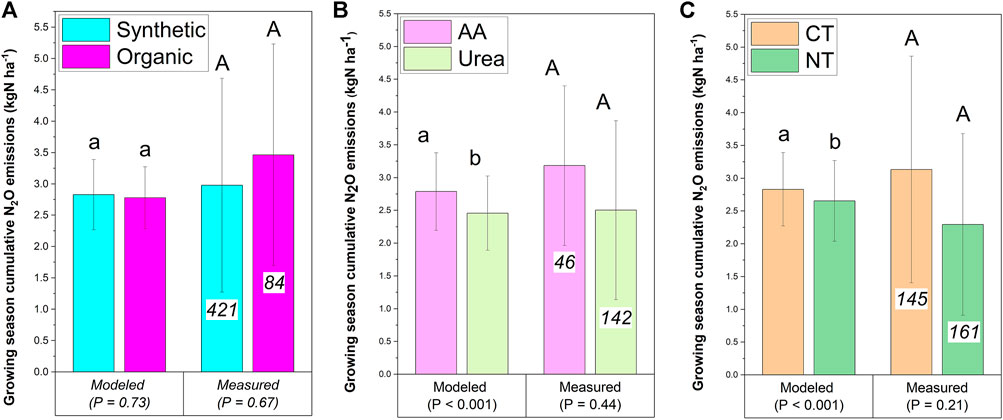
FIGURE 3. Comparison of means and standard deviations of growing season cumulative soil N2O emissions from corn phase under different (A) N input types (synthetic versus organic), (B) N fertilizer types (anhydrous ammonia (AA) versus urea), and (C) tillage practices (conventional (CT) versus no-till (NT)). The results are reported for pCENTURY-based model simulation and summarized from the meta-dataset of field observations. Number of observations within each category of the field dataset used for validation are shown within the columns. Paired and unpaired t-tests were used to compare treatment differences with p values shown with labels on the X-axis. Different letters represent significant difference at p < 0.05 identified with the t tests.
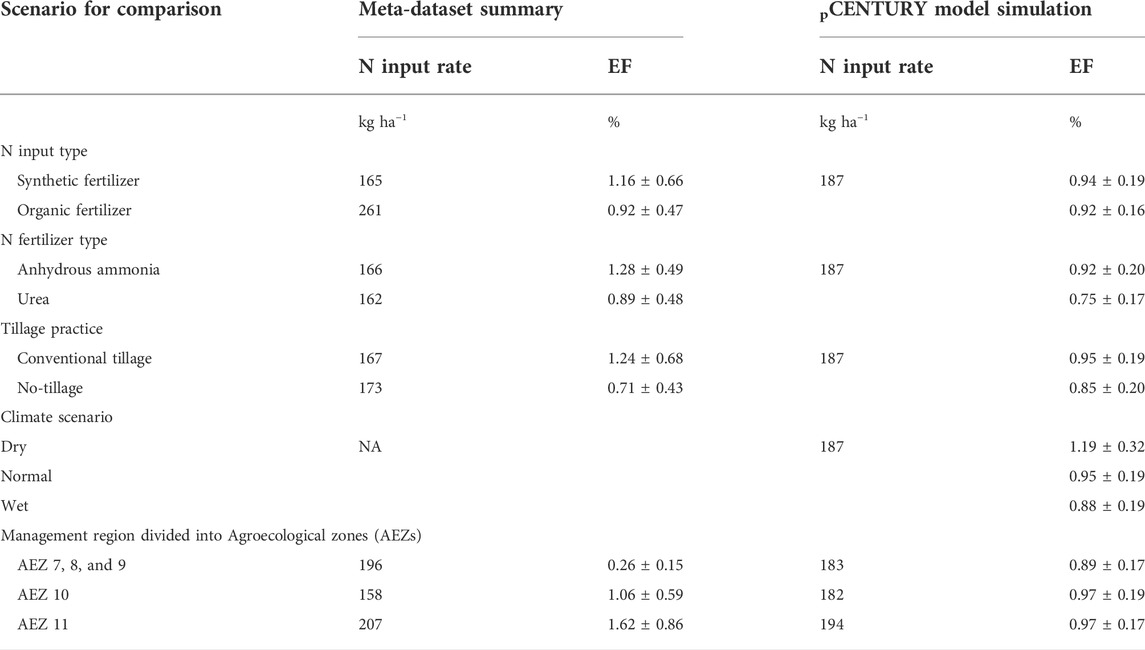
TABLE 4. Management and climate associated emission factors (EFs) of cumulative growing season soil N2O emissions (N2Ogs) calculated from pCENTURY simulation and field measurements used for evaluation. The EF results are reported as model simulated county or field measured averages followed by standard deviations.
Both PCENTURY and database-derived estimates showed N2Ogs-emissions were greater after use of AA than urea used at similar rates (Figure 3B), but differences were only statistically significant for modeled results. The meta-analyses of Bouwman (1996) and Eagle et al. (2017) concur. This indicates that fertilizer-based scalers used by models like CENTURY effectively represent the mechanistic influences inorganic N forms exert on N2O production rates as suggested by Breitenbeck and Bremner (1986) that AA is more commonly applied through the injection method which induces highly alkaline soil zones that can accumulate a large amount of NH4+ as substrates for N2O production. Another explanation is that the enhanced NO2− level under AA treatment could promote subsequent soil N loss (Venterea et al., 2010). Because N rates are similar between the AA and urea treatments according to the meta-database, both PCENTURY and meta-analytical summary found higher EFs for AA (1.28 and 0.92%) than urea treatment (0.89 and 0.75%; Table 4). Since AA and urea are the two major sources of synthetic N inputs in the United States Corn Belt (Snyder et al., 2014), their different impacts on N2O should be evaluated with other environmental consequences (e.g., CO2 emissions, N leaching) in order to inform better management practices at the broad scale.
3.2.3 Soil N2O emissions influenced by tillage
Model simulation suggested soil N2Ogs-emissions are significantly greater from fields using conventional than no-tillage (p < 0.001, Figure 3C). This agreed with database-derived estimates showing average N2Ogs-emissions were increased 37% by tillage. The metadata-derived EFs were also, on average, higher under conventional (1.24%) than no-tillage (0.71%) because N rates were shown to be similar between the treatments (Table 4). Again, differences in field-based comparisons were non-significant due to inter-field variability (Figure 3C). Increased N2O flux has been shown to result from better aeration that permits more N2O to escape the soil rather than being converted to N2 (Chatskikh and Olesen, 2007). Use of no-till has variable effects on bulk density (Blanco-Canqui and Ruis, 2018) but can commonly increase N2Ogs-emissions when used in poorly drained soils (Rochette et al., 2008). On the other hand, use of no-tillage or conservation tillage most often reduces N2O emissions when practiced long-term where soil structure is improved to decrease anaerobic soil microsites conductive to N2O production (Six et al., 2004; van Kessel et al., 2013). Because tillage can have mixed impacts on soil N2O emissions depending upon how practices influence substrate availability, aeration, yield, and soil water status (Linn and Doran, 1984; Smith et al., 2001; Mei et al., 2018), development or use of a tillage-based N2O scaler or coefficient could be unwise. Therefore, there is a need to highlight effective modeling of soil moisture and the soil redox environment to better predict tillage associated N2O emissions.
3.3 Spatial N2O emissions influenced by weather scenarios
Our regional assessment of N2Ogs-emissions revealed variability within and across regions in the United States Corn Belt (Figure 4). While the PCENTURY simulations for the normal weather scenario (Figure 4B) are similar to state-level N2O emissions patterns reported by McNunn et al. (2020), we identify potential for notable variability within states using county-level weather records. Spatial differences considered using normal weather data found the highest N2O emissions occurred in Iowa and Indiana (Figure 4), which is driven by the relatively high N input rates reported in Xia et al. (2021). Weather scenarios exploring dry and wet conditions suggested cumulative N2Ogs-emissions from the corn phase of the CS baseline would be greater under dry (3.3 kg N2O ha−1) and similar under wet (2.7 kg N2O ha−1) weather conditions when compared to results from normal (2.8 kg N2O ha−1) weather scenarios (SI: Supplementary Table D2). The ranking for EFs remains dry (1.19%) > normal (0.95%) > wet (0.88%) for model simulation because we assumed the same N input rates (Table 4). In reality, N input rates can vary because corn yield would change according to climate change scenarios, in which case yield-scaled EF that considers both N inputs and crop productivity (Aguilera et al., 2013; Iqbal et al., 2018) may better reflect the interaction between climate change and human activities.
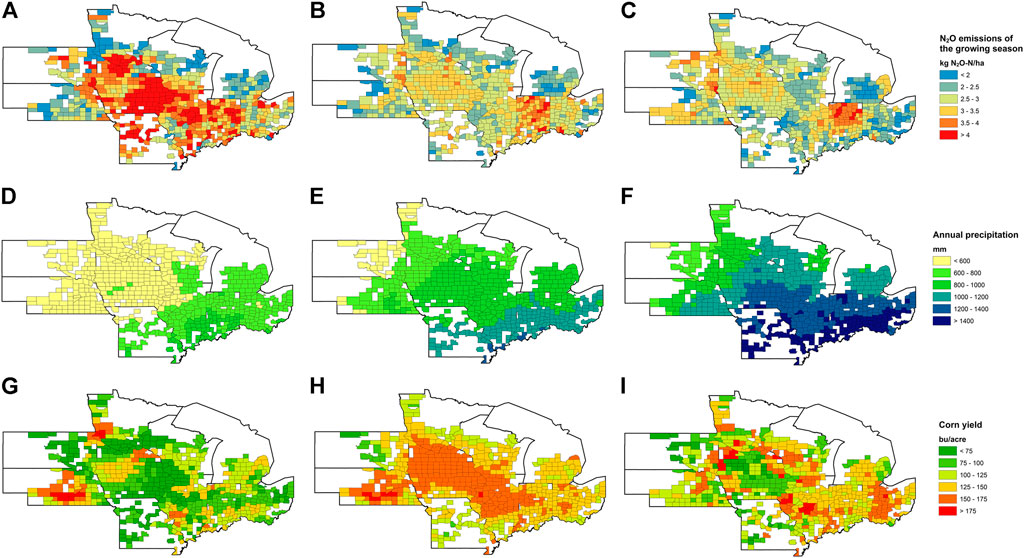
FIGURE 4. pCENTURY-based county-level estimates for: corn growing season N2O emissions under (A) dry, (B) normal, and (C) wet weather scenarios; annual precipitation under (D) dry, (E) normal, and (F) wet weather scenarios; corn yield under (G) dry, (H) normal, and (I) wet weather scenarios. The model estimates are based on baseline scenario (corn-soybean rotation, conventional tillage) for a 6-year (2016–2021) simulation period for the major United States corn states.
Regression-based exploration of the spatial distribution of N2Ogs-emissions suggested increased flux with soil moisture, fertility, and plant available N and decreased emissions with precipitation, water filled pore space, and corn yield (p < 0.05) (Table 5). Precipitation, plant available N, and corn yields were found lowest in the dry years, and plant available N and crop yields were greatest in the normal weather years (SI: Supplementary Table D2). Lower yields that resulted in reduced N uptake by crops created hotspots for N2O emissions. Average crop yield was also reduced by 13% in wet years compared to the normal weather but did not cause increased N2Ogs-emissions. Loss of N2O occurring outside of the growing season, the conversion of N2O to N2 under prolonged wet conditions, or increased leaching losses could all account for reduced level of available N in wet weather scenarios (Hernandez-Ramirez et al., 2009). In addition, the reduction in N2Ogs caused by wet conditions could also be attributed to pCENTURY using a monthly time-step, which could not capture rapid changes in water filled pore space and N2O emissions following rainfall events (Schmidt et al., 2000; Beheydt et al., 2007; Xia and Wander, 2022). Soil N2O changes can occur at a sub-daily time step so studies have attempted to capture high temporal resolution N2O dynamics (Laville et al., 2011; Lognoul et al., 2017; Su et al., 2021) using data collected with advanced techniques such as automated chamber and micrometeorological measurements (Hensen et al., 2013; Bréchet et al., 2021). However, such calibration data would be too expansive to collect at the broad scale for N2O modeling. In the future, the evolving networks such as GRACEnet (Del Grosso et al., 2013) and COntinuous SOil REspiration network COSORE (Bond-Lamberty et al., 2020) could be used for more detailed calibration of model nitrification and denitrification parameters (e.g., a maximum fraction of N2O to nitrified N at field capacity, adjustment coefficient on effect of moisture on denitrification, maximum fraction of ammonia nitrified during nitrification) at a finer temporal resolution if data collection and reporting can be further standardized.
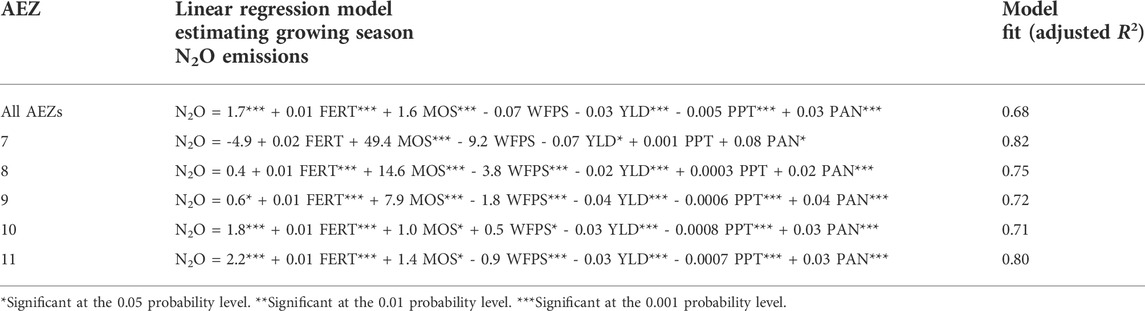
TABLE 5. Linear regression model built on estimating pCENTURY simulated growing season corn N2O emissions using fertilizer N rate (FERT), growing season moisture (MOS) and water filled pore space (WFPS), corn-year average plant available N (PAN), annual precipitation (PPT), and corn yield (YLD). The N2O emissions were estimated for normal, dry, and wet weather scenarios for corn-soybean baseline scenario during the simulation period of 2016–2021. The results are summarized by agroecological zone (AEZ).
The pCENTURY derived N2O EF for the CS scenario under normal weather conditions was approximately 60% lower than the revised IPCC (2019) Tier-1 estimate (1.6
The average EFs derived from our study (0.9% from model and 1.1% from meta-database) under normal weather conditions were lower than that (1.7% for well-drained soils and 3.9% for poorly drained soils) estimated by Lawrence et al. (2021) for the United States Corn Belt. This difference might be partially explained by the fact that Lawrence et al. (2021) investigated annual cumulative N2O while ours focused on N2Ogs-emissions. The difference in data coverage concerning both N2O emissions and N input rates can also cause varied estimates of N2O EFs. In addition, the method of estimating background emissions and organic N inputs based on rates and/or availability can result in uncertainty associated with reported EFs, which emphasizes the cautions needed to interpret direct soil N2O EFs. Ideally comparison of EFs can be carried out at finer time-step.
3.4 Implications on future agricultural management and climate adaptations
The increased atmospheric N2O concentration has been closely associated with food production system and fertilizer use (Kroeze et al., 1999; Mosier and Kroeze, 2000) and is projected to continue rising if no mitigation strategies are adopted to improve agricultural nitrogen use efficiency (Montzka et al., 2011; Kanter et al., 2016). Studies have shown significant differences in estimated atmospheric N2O concentration based on IPCC’s representative concentration pathways (RCPs) representing scenarios from little mitigation efforts to aggressive goals (Davidson, 2012). Accurate estimation of N2O emissions from different management practices is therefore critical for selecting and promoting practices that can alleviate climate change risks for the future. Our study showed an example of comparing management associated N2O emissions and EFs at the broad scale through both process-based modeling and meta-analytical summary. Future work is needed to compare more management scenarios that are not included in this study but are known to influence soil N2O emissions including irrigation (Scheer et al., 2013; Maharjan et al., 2014), drainage (Datta et al., 2013; Fernández et al., 2016; Grossel et al., 2016), and the timing and method for fertilizer incorporation (Smith et al., 1997; Yan et al., 2001; Ma et al., 2010).
The study of Tesfaye et al. (2021) showed that soil N2O mitigation potential can be mostly fulfilled with the reduction of excessive N inputs. This is in line with our finding that N2Ogs-emissions were mostly observed and simulated to be higher under crop rotations incorporating a large amount of N inputs. According to Xia et al. (2021), excessive corn N inputs were calculated to be prevalent in the United States Corn Belt, meaning that there is great potential for management associated N2O mitigation within the region. Although our model assumed zero or only a small amount of N inputs in non-corn phases and therefore generated lower estimates of N2Ogs-emissions, our meta-dataset demonstrated studies with excessive N inputs during the cover crop phases which can lead to greater N losses through N2O and N leaching. However, if cover crops were managed properly, meta-analysis found that soil N2O emissions would be reduced or not affected compared to non-cover crop treatments considering the balance between increased SOC and reduced nitrate contents (Basche et al., 2014; Kaye and Quemada, 2017). The key to N2O mitigation in a diversified cropping system is, therefore, to avoid the overapplication of fertilizers by better estimating N balance that takes into account N credits from cover crops, which can be achieved through the use of remote sensing (Xia et al., 2020) and N calculators (Gaskin et al., 2019).
We investigated the impacts of N input, fertilizer type, and tillage on N2Ogs-emissions but none of the comparisons were identified to be significant according to the meta-database due to high variability. This cautions the interpretation of management associated N2O mitigation potential by considering only a single management factor. Likely the interaction of management practices can lead to various N2O responses among different sites. Our model simulation illustrated significant differences in N2Ogs-emissions caused by N input and fertilizer types, but such results are heavily influenced by the model coefficients derived based on previous studies. Ideally, the coefficients should be updated to reflect findings from meta-databases and developed to reflect interactions with site-specific management (fertilizer incorporation method) and soil factors (e.g., texture and soil drainage class).
Our modeling of N2Ogs-emissions under various climate scenarios showed a potential of increased N2O emissions under future drought conditions. We did not investigate the impacts of raised temperature and CO2 concentration on N2O emissions, but studies have reported increased N2O emissions under such scenarios because of enhanced microbial activity and denitrification (Butterbach-Bahl and Dannenmann, 2011; Li et al., 2020; Wang et al., 2021). Increased N2O emissions under projected future climate conditions, especially those with higher levels of RCP (Riahi et al., 2011), can then contribute to a feedback loop that aggravates climate change. The regional differences in pCENTURY-modeled soil N2O emissions under dry and wet weather scenarios could be tied to soil pH and drainage class, which were identified as key factors explaining the spatial variability of observed annual N2O emissions (Lawrence et al., 2021). Likewise, the modeling study of Zhang et al. (2020) also emphasized regional differences in SOC changing trend under future climate scenarios that is influenced by soil properties and management in the United States Corn Belt. These findings suggest that management adaptations to a changing climate should consider regional differences, in which case it would be critical to use modeling tools to simulate site-based management and climate interactions.
4 Conclusion
A parameterized CENTURY model (pCENTURY) was used to estimate direct soil N2O emissions under various management and climate scenarios from United States corn fields. The pCENTURY model adequately predicted the magnitude of growing season N2O (N2Ogs) emissions from corn (N2Ogs = 2.68 kg/ha) and wheat (N2Ogs = 1.44 kg/ha) crop phases based on comparison with a Tier-2 meta-analytical summary. Model estimated N2Ogs emissions and emission factors (EFs) differed by N fertilizer type (AA > urea) and tillage practice (conventional > no-tillage), which matched with the comparison of average values under these treatments from the meta-database. Differences between modeled and measured results for scenarios including soybean or cover crops were tied to model assumptions of N inputs and the greater variety of inputs and practices summarized within categories contained in the meta-database. Comparison with Tier-1 values for corn suggests that broad-scale process-based modeling can successfully generate regionalized EFs that are representative of generalized management scenarios. Discrepancies between Tier-2 and pCENTURY-derived EFs on synthetic versus organic N inputs revealed not only the importance of N input data but also data describing the quantity and quality of organic inputs for estimating N2O emissions from non-corn phases and complex rotations. Weather scenarios determined that decreases in corn yields in dry years reduced crop N uptake and created N2O hotspots. Yield reductions occurring in wet years did not increase N2O flux. Regional differences in weather and soil N2O flux justify need for model-based (Tier-3) EFs that consider interactions between management and climate; however, we find improvements in the model’s ability to accurately simulate soil moisture during the winter and capture crop N uptake are needed to successfully estimate soil N2O emissions and develop regional EFs that can better inform management decisions in a future climate.
Data availability statement
The raw data supporting the conclusion of this article will be made available by the authors, without undue reservation.
Author contributions
YX, MW, and HK contributed to conception and design of the study. SQ and SY provided soil moisture database and critical information behind the database. YX and MW performed statistical analysis. HK performed process-based modeling of N2O emissions from soils. YX and MW prepared several drafts of manuscript and all authors contributed to the final manuscript revision.
Funding
This research was supported by the National Institute of Food and Agriculture (NIFA) of the US Department of Agriculture under contracts No. 015-51106-24198 (Project No. ILLU-875-626) and Hatch 600122-875000-875986 and the Bioenergy Technologies Office (BETO) of Energy Efficiency and Renewable Energy of the US Department of Energy under contract DE-AC02-06CH11357.
Conflict of interest
The authors declare that the research was conducted in the absence of any commercial or financial relationships that could be construed as a potential conflict of interest.
Publisher’s note
All claims expressed in this article are solely those of the authors and do not necessarily represent those of their affiliated organizations, or those of the publisher, the editors and the reviewers. Any product that may be evaluated in this article, or claim that may be made by its manufacturer, is not guaranteed or endorsed by the publisher.
Author disclaimer
The views and opinions of the authors expressed herein do not necessarily state or reflect those of the U.S. Government or any agency thereof. Neither the U.S. Government nor anyagency thereof, nor any of their employees, makes any warranty, expressed or implied, or assumes any legal liability or responsibility for the accuracy, completeness, or usefulness of any information, apparatus, product, or process disclosed, or represents that its use would not infringe privately owned rights.
Supplementary material
The Supplementary Material for this article can be found online at: https://www.frontiersin.org/articles/10.3389/fenvs.2022.971261/full#supplementary-material
Abbreviations
AA, anhydrous ammonia; AEZ, agroecological zone; CC, Continuous corn; CS, Corn-soybean rotation; CCvSCv, 2-year corn/cover crop-soybean/cover crop rotation; CSWCv, 3-year corn-soybean/winter wheat-cover crop rotation; EF, Emission factor; GHG, Greenhouse gases; GWP, Global Warming Potential; LCA, Life Cycle Analysis; N2Ogs, growing season nitrous oxide; NASMD, North American Soil Moisture Dataset; PCENTURY, Parameterized CENTURY/DAYCENT model; RFS, Renewable Fuel Standards; SOC, Soil organic carbon; SOM, Soil organic matter.
References
Abdalla, M., Hastings, A., Cheng, K., Yue, Q., Chadwick, D., Espenberg, M., et al. (2019). A critical review of the impacts of cover crops on nitrogen leaching, net greenhouse gas balance and crop productivity. Glob. Chang. Biol. 25, 2530–2543. doi:10.1111/gcb.14644
Abdalla, M., Jones, M., and Williams, M. (2010). Simulation of N2O fluxes from Irish arable soils: Effect of climate change and management. Biol. Fertil. Soils 46, 247–260. doi:10.1007/s00374-009-0424-5
Abdalla, M., Song, X., Ju, X., Topp, C. F. E., and Smith, P. (2020). Calibration and validation of the DNDC model to estimate nitrous oxide emissions and crop productivity for a summer maize-winter wheat double cropping system in Hebei, China. Environ. Pollut. 262, 114199. doi:10.1016/j.envpol.2020.114199
Aguilera, E., Lassaletta, L., Sanz-Cobena, A., Garnier, J., and Vallejo, A. (2013). The potential of organic fertilizers and water management to reduce N2O emissions in Mediterranean climate cropping systems. A Rev. Agric. Ecosyst. Environ. 164, 32–52. doi:10.1016/j.agee.2012.09.006
Akiyama, H., Yan, X., and Yagi, K. (2006). Estimations of emission factors for fertilizer induced direct N2O emissions from agricultural soils in Japan: Summary of available data. Soil Sci. Plant Nutr. 52, 774–787. doi:10.1111/j.1747-0765.2006.00097.x
Banger, K., Yuan, M., Wang, J., Nafziger, E. D., and Pittelkow, C. M. (2017). A vision for incorporating environmental effects into nitrogen management decision support tools for U.S. maize production. Front. Plant Sci. 8, 1270. doi:10.3389/fpls.2017.01270
Basche, A. D., Miguez, F. E., Kaspar, T. C., and Castellano, M. J. (2014). Do cover crops increase or decrease nitrous oxide emissions? A meta-analysis. J. Soil Water Conserv. 69, 471–482. doi:10.2489/jswc.69.6.471
Batjes, N. H., Fischer, G., Nachtergaele, F. O., Stolbovoy, V. S., and van Velthuizen, H. T. (1997). Soil data derived from WISE for use in global and regional AEZ studies. Laxenburg, Austria: IIASA, 1–27. IIASA Interim Report.
Beguería, S., Vicente-Serrano, S. M., Tomás-Burguera, M., and Maneta, M. (2016). Bias in the variance of gridded data sets leads to misleading conclusions about changes in climate variability. Int. J. Climatol. 36, 3413–3422. doi:10.1002/joc.4561
Beheydt, D., Boeckx, P., Sleutel, S., Li, C., and Van Cleemput, O. (2007). Validation of DNDC for 22 long-term N2O field emission measurements. Atmos. Environ. X. 41, 6196–6211. doi:10.1016/j.atmosenv.2007.04.003
Berardi, D., Brzostek, E., Blanc-Betes, E., Davison, B., DeLucia, E. H., Hartman, M. D., et al. (2020). 21st-century biogeochemical modeling: Challenges for Century-based models and where do we go from here? GCB Bioenergy 12, 774–788. doi:10.1111/gcbb.12730
Birol, F. (2018). Renewables 2018 - market analysis and forecast from 2018 to 2023. Available at: https://www.iea.org/renewables2018/transport/(Accessed July 25, 2022).
Blanco-Canqui, H., and Ruis, S. J. (2018). No-tillage and soil physical environment. Geoderma 326, 164–200. doi:10.1016/j.geoderma.2018.03.011
Bond-Lamberty, B., Christianson, D. S., Malhotra, A., Pennington, S. C., Sihi, D., AghaKouchak, A., et al. (2020). Cosore: A community database for continuous soil respiration and other soil-atmosphere greenhouse gas flux data. Glob. Chang. Biol. 26, 7268–7283. doi:10.1111/gcb.15353
Bouwman, A. F., Boumans, L. J. M., and Batjes, N. H. (2002). Emissions of N2O and NO from fertilized fields: Summary of available measurement data. Glob. Biogeochem. Cycles 16, 6-1–6-13. doi:10.1029/2001GB001811
Bouwman, A. F. (1996). Direct emission of nitrous oxide from agricultural soils. Nutr. Cycl. Agroecosyst. 46, 53–70. doi:10.1007/BF00210224
Bracmort, K. (2022). The renewable fuel standard (RFS): An overview. Congressional Research Service. Available at: https://sgp.fas.org/crs/misc/R43325.pdf (Accessed July 25, 2022).
Bréchet, L. M., Daniel, W., Stahl, C., Burban, B., Goret, J. Y., Salomόn, R. L., et al. (2021). Simultaneous tree stem and soil greenhouse gas (CO2, CH4, N2O) flux measurements: A novel design for continuous monitoring towards improving flux estimates and temporal resolution. New Phytol. 230, 2487–2500. doi:10.1111/nph.17352
Breitenbeck, G. A., and Bremner, J. M. (1986). Effects of various nitrogen fertilizers on emission of nitrous oxide from soils. Biol. Fertil. Soils 2, 195–199. doi:10.1007/BF00260843
Brown, L., Syed, B., Jarvis, S. C., Sneath, R. W., Phillips, V. R., Goulding, K. W. T., et al. (2002). Development and application of a mechanistic model to estimate emission of nitrous oxide from UK agriculture. Atmos. Environ. 36, 917–928. doi:10.1016/S1352-2310(01)00512-X
Butterbach-Bahl, K., Baggs, E. M., Dannenmann, M., Kiese, R., and Zechmeister-Boltenstern, S. (2013). Nitrous oxide emissions from soils: How well do we understand the processes and their controls? Phil. Trans. R. Soc. B 368, 20130122. doi:10.1098/rstb.2013.0122
Butterbach-Bahl, K., and Dannenmann, M. (2011). Denitrification and associated soil N2O emissions due to agricultural activities in a changing climate. Curr. Opin. Environ. Sustain. 3, 389–395. doi:10.1016/j.cosust.2011.08.004
Castellano, M. J., Helmers, M. J., Sawyer, J. E., Barker, D. W., and Christianson, L. (2018). “Nitrogen, carbon, and phosphorus balances in Iowa cropping systems: Sustaining the soil resource,” in 2012 Integrated Crop Management Conference (Ames, IA: Iowa State University), 1–12. doi:10.31274/icm-180809-272
Chantigny, M. H., Rochette, P., Angers, D. A., Goyer, C., Brin, L. D., and Bertrand, N. (2016). Nongrowing season N2O and CO2 emissions — Temporal dynamics and influence of soil texture and fall-applied manure. Can. J. Soil Sci. 97, 452–464. doi:10.1139/cjss-2016-0110
Chapuis-lardy, L., Wrage, N., Metay, A., Chotte, J. L., and Bernoux, M. (2007). Soils, a sink for N2O? A review. Glob. Chang. Biol. 13, 1–17. doi:10.1111/j.1365-2486.2006.01280.x
Chatskikh, D., and Olesen, J. E. (2007). Soil tillage enhanced CO2 and N2O emissions from loamy sand soil under spring barley. Soil Tillage Res. 97, 5–18. doi:10.1016/j.still.2007.08.004
Chen, H., Li, X., Hu, F., and Shi, W. (2013). Soil nitrous oxide emissions following crop residue addition: A meta-analysis. Glob. Chang. Biol. 19, 2956–2964. doi:10.1111/gcb.12274
Chen, H., Yu, C., Li, C., Xin, Q., Huang, X., Zhang, J., et al. (2016). Modeling the impacts of water and fertilizer management on the ecosystem service of rice rotated cropping systems in China. Agric. Ecosyst. Environ. 219, 49–57. doi:10.1016/j.agee.2015.11.023
Crossman, N. D., Burkhard, B., Nedkov, S., Willemen, L., Petz, K., Palomo, I., et al. (2013). A blueprint for mapping and modelling ecosystem services. Ecosyst. Serv. 4, 4–14. doi:10.1016/j.ecoser.2013.02.001
Datta, A., Smith, P., and Lal, R. (2013). Effects of long-term tillage and drainage treatments on greenhouse gas fluxes from a corn field during the fallow period. Agric. Ecosyst. Environ. 171, 112–123. doi:10.1016/j.agee.2013.03.014
Davidson, E. A. (2012). Representative concentration pathways and mitigation scenarios for nitrous oxide. Environ. Res. Lett. 7, 024005. doi:10.1088/1748-9326/7/2/024005
Davidsson, T. E., and Leonardson, L. (1997). Production of nitrous oxide in artificially flooded and drained soils. Wetl. Ecol. Manag. 5, 111–119. doi:10.1023/A:1008297609079
de Klein, C. A. M., Alfaro, M. A., Giltrap, D., Topp, C. F. E., Simon, P. L., Noble, A. D. L., et al. (2020). Global Research Alliance N2O chamber methodology guidelines: Statistical considerations, emission factor calculation, and data reporting. J. Environ. Qual. 49, 1156–1167. doi:10.1002/jeq2.20127
Decock, C. (2014). Mitigating nitrous oxide emissions from corn cropping systems in the midwestern U.S. Potential and data gaps. Environ. Sci. Technol. 48, 4247–4256. doi:10.1021/es4055324
Del Grosso, S. J., Halvorson, A. D., and Parton, W. J. (2008). Testing DAYCENT model simulations of corn yields and nitrous oxide emissions in irrigated tillage systems in Colorado. J. Environ. Qual. 37, 1383–1389. doi:10.2134/jeq2007.0292
Del Grosso, S. J., Ojima, D. S., Parton, W. J., Stehfest, E., Heistemann, M., DeAngelo, B., et al. (2009). Global scale DAYCENT model analysis of greenhouse gas emissions and mitigation strategies for cropped soils. Glob. Planet. Change 67, 44–50. doi:10.1016/j.gloplacha.2008.12.006
Del Grosso, S. J., Ogle, S. M., Parton, W. J., and Breidt, F. J. (2010). Estimating uncertainty in N2O emissions from U.S. cropland soils. Glob. Biogeochem. Cycles 24, GB1009. doi:10.1029/2009gb003544
Del Grosso, S. J., Parton, W. J., Keough, C. A., and Reyes-Fox, M. (2011). “Special features of the DayCent modeling package and additional procedures for parameterization, calibration, validation, and applications,” in Methods of introducing system models into agricultural research. Editors R. A. Laj, and L. Ma (Madison, WI: ASA, CSSA, SSSA), 155–176.
Del Grosso, S. J., Parton, W. J., Mosier, A. R., Walsh, M. K., Ojima, D. S., and Thornton, P. E. (2006). DAYCENT national-scale simulations of nitrous oxide emissions from cropped soils in the United States. J. Environ. Qual. 35, 1451–1460. doi:10.2134/jeq2005.0160
Del Grosso, S. J., Smith, W., Kraus, D., Massad, R. S., Vogeler, I., and Fuchs, K. (2020). Approaches and concepts of modelling denitrification: Increased process understanding using observational data can reduce uncertainties. Curr. Opin. Environ. Sustain. 47, 37–45. doi:10.1016/j.cosust.2020.07.003
Del Grosso, S. J., White, J. W., Wilson, G., Vandenberg, B., Karlen, D. L., Follett, R. F., et al. (2013). Introducing the GRACEnet/REAP data contribution, discovery, and retrieval system. J. Environ. Qual. 42, 1274–1280. doi:10.2134/jeq2013.03.0097
Eagle, A. J., Olander, L. P., Locklier, K. L., Heffernan, J. B., and Bernhardt, E. S. (2017). Fertilizer management and environmental factors drive N2O and NO3 losses in corn: A meta-analysis. Soil Sci. Soc. Am. J. 81, 1191–1202. doi:10.2136/sssaj2016.09.0281
Eghball, B., Wienhold, B. J., Gilley, J. E., and Eigenberg, R. A. (2002). Mineralization of manure nutrients. J. Soil Water Conserv. 57, 470–473. doi:10.1006/meth.2001.1262
Farahbakhshazad, N., Dinnes, D. L., Li, C., Jaynes, D. B., and Salas, W. (2008). Modeling biogeochemical impacts of alternative management practices for a row-crop field in Iowa. Agric. Ecosyst. Environ. 123, 30–48. doi:10.1016/j.agee.2007.04.004
Fernández, F. G., Venterea, R. T., and Fabrizzi, K. P. (2016). Corn nitrogen management influences nitrous oxide emissions in drained and undrained soils. J. Environ. Qual. 45, 1847–1855. doi:10.2134/jeq2016.06.0237
Foltz, M. E., Kent, A. D., Koloutsou-Vakakis, S., and Zilles, J. L. (2021). Influence of rye cover cropping on denitrification potential and year-round field N2O emissions. Sci. Total Environ. 765, 144295. doi:10.1016/j.scitotenv.2020.144295
Gaskin, J. W., Cabrera, M. L., Kissel, D. E., and Hitchcock, R. (2019). Using the cover crop N calculator for adaptive nitrogen fertilizer management: A proof of concept. Renew. Agric. Food Syst. 35, 550–560. doi:10.1017/S1742170519000152
Gautam, S., Mishra, U., Scown, C. D., and Zhang, Y. (2020). Sorghum biomass production in the continental United States and its potential impacts on soil organic carbon and nitrous oxide emissions. GCB Bioenergy 12, 878–890. doi:10.1111/gcbb.12736
Gilhespy, S. L., Anthony, S., Cardenas, L., Chadwick, D., del Prado, A., Li, C., et al. (2014). First 20 years of DNDC (DeNitrification DeComposition): Model evolution. Ecol. Modell. 292, 51–62. doi:10.1016/j.ecolmodel.2014.09.004
Giltrap, D. L., and Ausseil, A. G. E. (2016). Upscaling NZ-DNDC using a regression based meta-model to estimate direct N2O emissions from New Zealand grazed pastures. Sci. Total Environ. 539, 221–230. doi:10.1016/j.scitotenv.2015.08.107
Grant, R. F., Pattey, E., Goddard, T. W., Kryzanowski, L. M., and Puurveen, H. (2006). Modeling the effects of fertilizer application rate on nitrous oxide emissions. Soil Sci. Soc. Am. J. 70, 235–248. doi:10.2136/sssaj2005.0104
Grossel, A., Nicoullaud, B., Bourennane, H., Lacoste, M., Guimbaud, C., Robert, C., et al. (2016). The effect of tile-drainage on nitrous oxide emissions from soils and drainage streams in a cropped landscape in Central France. Agric. Ecosyst. Environ. 230, 251–260. doi:10.1016/j.agee.2016.06.015
Guenet, B., Gabrielle, B., Chenu, C., Arrouays, D., Balesdent, J., Bernoux, M., et al. (2021). Can N2O emissions offset the benefits from soil organic carbon storage? Glob. Chang. Biol. 27, 237–256. doi:10.1111/gcb.15342
Hansen, S. (2002). Daisy, a flexible soil-plant-atmosphere system model. Available at: https://daisy.ku.dk/pdfs/DaisyDescription.pdf (Accessed July 25, 2022).
He, W., Yang, J. Y., Drury, C. F., Smith, W. N., Grant, B. B., He, P., et al. (2018). Estimating the impacts of climate change on crop yields and N2O emissions for conventional and no-tillage in Southwestern Ontario, Canada. Agric. Syst. 159, 187–198. doi:10.1016/j.agsy.2017.01.025
Hensen, A., Skiba, U., and Famulari, D. (2013). Low cost and state of the art methods to measure nitrous oxide emissions. Environ. Res. Lett. 8, 025022. doi:10.1088/1748-9326/8/2/025022
Hergoualc’h, K., Akiyama, H., Bernoux, M., Chirinda, N., Prado, A., Kasimir, Å., et al. (2019). “N2O emissions from managed soils, and CO2 emissions from lime and urea application,” in 2019 Refinement to the 2006 IPCC Guidelines for National Greenhouse Gas Inventories. Editors D. Gómez, and W. Irving (Geneva, Switzerland: IPCC), 6–12.
Hernandez-Ramirez, G., Brouder, S. M., Smith, D. R., and Van Scoyoc, G. E. (2009). Greenhouse gas fluxes in an Eastern Corn Belt soil: Weather, nitrogen source, and rotation. J. Environ. Qual. 38, 841–854. doi:10.2134/jeq2007.0565
Hofstra, N., New, M., and McSweeney, C. (2010). The influence of interpolation and station network density on the distributions and trends of climate variables in gridded daily data. Clim. Dyn. 35, 841–858. doi:10.1007/s00382-009-0698-1
Homer, C., Dewitz, J., Fry, J., Coan, M., Hossain, N., Larson, C., et al. (2007). Completion of the 2001 national land cover database for the counterminous United States. Photogramm. Eng. Remote Sens. 73, 337–341.
Homer, C. G., Dewitz, J. A., Yang, L., Jin, S., Danielson, P., Xian, G., et al. (2015). Completion of the 2011 National Land Cover Database for the conterminous United States-Representing a decade of land cover change information. Photogramm. Eng. Remote Sens. 81, 345–354. doi:10.14358/PERS.81.5.345
Hong, J., Zhou, J., and Hong, J. (2015). Comparative study of life cycle environmental and economic impact of corn- and corn stalk-based-ethanol production. J. Renew. Sustain. Energy 7, 023106. doi:10.1063/1.4914008
Hsu, D. D., Inman, D., Heath, G. A., Wolfrum, E. J., Mann, M. K., and Aden, A. (2010). Life cycle environmental impacts of selected U.S. Ethanol production and use pathways in 2022. Environ. Sci. Technol. 44, 5289–5297. doi:10.1021/es100186h
IPCC (2019). Special Report on climate change, desertification, land degradation, sustainable land management, food security, and greenhouse gas fluxes in terrestrial ecosystems (SR2). Geneva, Switzerland: IPCC.
Iqbal, J., Mitchell, D. C., Barker, D. W., Miguez, F., Sawyer, J. E., Pantoja, J., et al. (2015). Does nitrogen fertilizer application rate to corn affect nitrous oxide emissions from the rotated soybean crop? J. Environ. Qual. 44, 711–719. doi:10.2134/jeq2014.09.0378
Iqbal, J., Necpalova, M., Archontoulis, S. V., Anex, R. P., Bourguignon, M., Herzmann, D., et al. (2018). Extreme weather-year sequences have nonadditive effects on environmental nitrogen losses. Glob. Chang. Biol. 24, e303–e317. doi:10.1111/gcb.13866
Jarecki, M. K., Parkin, T. B., Chan, A. S. K., Kaspar, T. C., Moorman, T. B., Singer, J. W., et al. (2009). Cover crop effects on nitrous oxide emission from a manure-treated Mollisol. Agric. Ecosyst. Environ. 134, 29–35. doi:10.1016/j.agee.2009.05.008
Jiang, R., Yang, J., Drury, C. F., He, W., Smith, W., Grant, B., et al. (2020). Assessing the impacts of diversified crop rotation systems on yields and nitrous oxide emissions in Canada using the DNDC model. Sci. Total Environ. 759, 143433. doi:10.1016/j.scitotenv.2020.143433
Kanter, D. R., Zhang, X., Mauzerall, D. L., Malyshev, S., and Shevliakova, E. (2016). The importance of climate change and nitrogen use efficiency for future nitrous oxide emissions from agriculture. Environ. Res. Lett. 11, 094003. doi:10.1088/1748-9326/11/9/094003
Karimi, T., Stöckle, C. O., Higgins, S. S., and Nelson, R. L. (2021). Impact of climate change on greenhouse gas emissions and water balance in a dryland-cropping region with variable precipitation. J. Environ. Manage. 287, 112301. doi:10.1016/j.jenvman.2021.112301
Katayanagi, N., Furukawa, Y., Fumoto, T., and Hosen, Y. (2012). Validation of the DNDC-rice model by using CH4 and N2O flux data from rice cultivated in pots under alternate wetting and drying irrigation management. Soil Sci. Plant Nutr. 58, 360–372. doi:10.1080/00380768.2012.682955
Kaye, J. P., and Quemada, M. (2017). Using cover crops to mitigate and adapt to climate change. A review. Agron. Sustain. Dev. 37, 4. doi:10.1007/s13593-016-0410-x
Kroeze, C., Mosier, A., and Bouwman, L. (1999). Closing the global N2O budget: A retrospective analysis 1500-1994. Glob. Biogeochem. Cycles 13, 1–8. doi:10.1029/1998GB900020
Kros, J., Heuvelink, G. B. M., Reinds, G. J., Lesschen, J. P., Ioannidi, V., and De Vries, W. (2012). Uncertainties in model predictions of nitrogen fluxes from agro-ecosystems in Europe. Biogeosciences 9, 4573–4588. doi:10.5194/bg-9-4573-2012
Kuo, S., and Sainju, U. M. (1998). Nitrogen mineralization and availability of mixed leguminous and non-leguminous cover crop residues in soil. Biol. Fertil. Soils 26, 346–353. doi:10.1007/s003740050387
Kwon, H., Liu, X., Dunn, J. B., Mueller, S., Wander, M. M., and Wang, M. (2020). Carbon calculator for land use and land management change from biofuels production (CCLUB). Lemont, IL: Argonne National Laboratory. Available at: https://publications.anl.gov/anlpubs/2020/10/162341.pdf%0AANL/ESD/12-5 Rev.6 (Accessed July 25, 2022).
Kwon, H., Ugarte, C. M., Ogle, S. M., Williams, S. A., and Wander, M. M. (2017). Use of inverse modeling to evaluate CENTURY-predictions for soil carbon sequestration in US rain-fed corn production systems. PLoS One 12, e0172861. doi:10.1371/journal.pone.0172861
Kwon, H. Y., and Hudson, R. J. M. (2010). Quantifying management-driven changes in organic matter turnover in an agricultural soil: An inverse modeling approach using historical data and a surrogate CENTURY-type model. Soil Biol. Biochem. 42, 2241–2253. doi:10.1016/j.soilbio.2010.08.025
Kwon, H. Y., Mueller, S., Dunn, J. B., and Wander, M. M. (2013). Modeling state-level soil carbon emission factors under various scenarios for direct land use change associated with United States biofuel feedstock production. Biomass Bioenergy 55, 299–310. doi:10.1016/j.biombioe.2013.02.021
Laville, P., Lehuger, S., Loubet, B., Chaumartin, F., and Cellier, P. (2011). Effect of management, climate and soil conditions on N2O and NO emissions from an arable crop rotation using high temporal resolution measurements. Agric. For. Meteorol. 151, 228–240. doi:10.1016/j.agrformet.2010.10.008
Lawrence, N. C., Tenesaca, C. G., VanLoocke, A., and Hall, S. J. (2021). Nitrous oxide emissions from agricultural soils challenge climate sustainability in the US Corn Belt. Proc. Natl. Acad. Sci. U. S. A. 118, 2112108118. doi:10.1073/pnas.2112108118
Leip, A., Busto, M., and Winiwarter, W. (2011). Developing spatially stratified N2O emission factors for Europe. Environ. Pollut. 159, 3223–3232. doi:10.1016/j.envpol.2010.11.024
Lewandrowski, J., Rosenfeld, J., Pape, D., Hendrickson, T., Jaglo, K., and Moffroid, K. (2020). The greenhouse gas benefits of corn ethanol–assessing recent evidence. Biofuels 11, 361–375. doi:10.1080/17597269.2018.1546488
Li, C., Frolking, S., and Frolking, T. A. (1992). A model of nitrous-oxide evolution from soil driven by rainfall events.1. Model structure and sensitivity. J. Geophys. Res. 97, 9759–9776. doi:10.1029/92JD00509
Li, C., Narayanan, V., and Harriss, R. C. (1996). Model estimates of nitrous oxide emissions from agricultural lands in the United States. Glob. Biogeochem. Cycles 10, 297–306. doi:10.1029/96GB00470
Li, C. (2007). Quantifying greenhouse gas emissions from soils: Scientific basis and modeling approach. Soil Sci. Plant Nutr. 53, 344–352. doi:10.1111/j.1747-0765.2007.00133.x
Li, C., Mosier, A., Wassmann, R., Cai, Z., Zheng, X., Huang, Y., et al. (2004). Modeling greenhouse gas emissions from rice-based production systems: Sensitivity and upscaling. Global Biogeochem. Cycles 18: GB1043. doi:10.1029/2003GB002045
Li, C., Zhuang, Y., Cao, M., Crill, P., Dai, Z., Frolking, S., et al. (2001). Comparing a process-based agro-ecosystem model to the IPCC methodology for developing a national inventory of N2O emissions from arable lands in China. Nutr. Cycl. Agroecosystems 60, 159–175. doi:10.1023/A:1012642201910
Li, H., Qiu, J., Wang, L., Tang, H., Li, C., and Van Ranst, E. (2010). Modelling impacts of alternative farming management practices on greenhouse gas emissions from a winter wheat-maize rotation system in China. Agric. Ecosyst. Environ. 135, 24–33. doi:10.1016/j.agee.2009.08.003
Li, L., Zheng, Z., Wang, W., Biederman, J. A., Xu, X., Ran, Q., et al. (2020). Terrestrial N2O emissions and related functional genes under climate change: A global meta-analysis. Glob. Chang. Biol. 26, 931–943. doi:10.1111/gcb.14847
Linn, D. M., and Doran, J. W. (1984). Effect of water-filled pore space on carbon dioxide and nitrous oxide production in tilled and nontilled soils. Soil Sci. Soc. Am. J. 48, 1267–1272. doi:10.2136/sssaj1984.03615995004800060013x
Liu, C., Ikeda, K., Rasmussen, R., Barlage, M., Newman, A. J., Prein, A. F., et al. (2017). Continental-scale convection-permitting modeling of the current and future climate of North America. Clim. Dyn. 49, 71–95. doi:10.1007/s00382-016-3327-9
Liu, S., Lin, F., Wu, S., Ji, C., Sun, Y., Jin, Y., et al. (2017). A meta-analysis of fertilizer-induced soil NO and combined NO+N2O emissions. Glob. Chang. Biol. 23, 2520–2532. doi:10.1111/gcb.13485
Lognoul, M., Theodorakopoulos, N., Hiel, M. P., Regaert, D., Broux, F., Heinesch, B., et al. (2017). Impact of tillage on greenhouse gas emissions by an agricultural crop and dynamics of N2O fluxes: Insights from automated closed chamber measurements. Soil Tillage Res. 167, 80–89. doi:10.1016/j.still.2016.11.008
Lokupitiya, E., and Paustian, K. (2006). Agricultural soil greenhouse gas emissions: A review of national inventory methods. J. Environ. Qual. 35, 1413–1427. doi:10.2134/jeq2005.0157
Lugato, E., Zuliani, M., Alberti, G., Vedove, G. D., Gioli, B., Miglietta, F., et al. (2010). Application of DNDC biogeochemistry model to estimate greenhouse gas emissions from Italian agricultural areas at high spatial resolution. Agric. Ecosyst. Environ. 139, 546–556. doi:10.1016/j.agee.2010.09.015
Lugato, E., Paniagua, L., Jones, A., De Vries, W., and Leip, A. (2017). Complementing the topsoil information of the Land Use/Land Cover Area Frame Survey (LUCAS) with modelled N2O emissions. PLoS One 12. doi:10.1371/journal.pone.0176111
Ma, B. L., Wu, T. Y., Tremblay, N., Deen, W., Morrison, M. J., Mclaughlin, N. B., et al. (2010). Nitrous oxide fluxes from corn fields: On-farm assessment of the amount and timing of nitrogen fertilizer. Glob. Chang. Biol. 16, 156–170. doi:10.1111/j.1365-2486.2009.01932.x
Ma, Y., Schwenke, G., Sun, L., Liu, D. L., Wang, B., and Yang, B. (2018). Modeling the impact of crop rotation with legume on nitrous oxide emissions from rain-fed agricultural systems in Australia under alternative future climate scenarios. Sci. Total Environ. 630, 1544–1552. doi:10.1016/j.scitotenv.2018.02.322
Maaz, T. M., Sapkota, T. B., Eagle, A. J., Kantar, M. B., Bruulsema, T. W., and Majumdar, K. (2021). Meta-analysis of yield and nitrous oxide outcomes for nitrogen management in agriculture. Glob. Chang. Biol. 27, 2343–2360. doi:10.1111/gcb.15588
Maharjan, B., Venterea, R. T., and Rosen, C. (2014). Fertilizer and irrigation management effects on nitrous oxide emissions and nitrate leaching. Agron. J. 106, 703–714. doi:10.2134/agronj2013.0179
Malmedal, K., Kroposki, B., and Sen, P. K. (2007). Energy policy act of 2005. IEEE Ind. Appl. Mag. 13, 14–20. doi:10.1109/MIA.2007.265799
Mazzetto, A. M., Styles, D., Gibbons, J., Arndt, C., Misselbrook, T., and Chadwick, D. (2020). Region-specific emission factors for Brazil increase the estimate of nitrous oxide emissions from nitrogen fertiliser application by 21%. Atmos. Environ. X. 230, 117506. doi:10.1016/j.atmosenv.2020.117506
McNunn, G., Karlen, D. L., Salas, W., Rice, C. W., Mueller, S., Muth, D., et al. (2020). Climate smart agriculture opportunities for mitigating soil greenhouse gas emissions across the U.S. Corn-Belt. J. Clean. Prod. 268, 122240. doi:10.1016/j.jclepro.2020.122240
Meersmans, J., Martin, M. P., Lacarce, E., Orton, T. G., De Baets, S., Gourrat, M., et al. (2013). Estimation of soil carbon input in France: An inverse modelling approach. Pedosphere 23, 422–436. doi:10.1016/S1002-0160(13)60035-1
Mei, K., Wang, Z., Huang, H., Zhang, C., Shang, X., Dahlgren, R. A., et al. (2018). Stimulation of N2O emission by conservation tillage management in agricultural lands: A meta-analysis. Soil Tillage Res. 182, 86–93. doi:10.1016/j.still.2018.05.006
Millar, N., Philip Robertson, G., Grace, P. R., Gehl, R. J., and Hoben, J. P. (2010). Nitrogen fertilizer management for nitrous oxide (N2O) mitigation in intensive corn (Maize) production: An emissions reduction protocol for US Midwest agriculture. Mitig. Adapt. Strateg. Glob. Chang. 57, 185–204. doi:10.1007/s11027-010-9212-7
Miller, L. T., Griffis, T. J., Erickson, M. D., Turner, P. A., Deventer, M. J., Chen, Z., et al. (2022). Response of nitrous oxide emissions to individual rain events and future changes in precipitation. J. Environ. Qual. 51, 312–324. doi:10.1002/jeq2.20348
Mitchell, D. C., Castellano, M. J., Sawyer, J. E., and Pantoja, J. (2013). Cover crop effects on nitrous oxide emissions: Role of mineralizable carbon. Soil Sci. Soc. Am. J. 77, 1765–1773. doi:10.2136/sssaj2013.02.0074
Montzka, S. A., Dlugokencky, E. J., and Butler, J. H. (2011). Non-CO2 greenhouse gases and climate change. Nature 476, 43–50. doi:10.1038/nature10322
Morris, T. F., Murrell, T. S., Beegle, D. B., Camberato, J. J., Ferguson, R. B., Grove, J., et al. (2018). Strengths and limitations of nitrogen rate recommendations for corn and opportunities for improvement. Agron. J. 110, 1–37. doi:10.2134/agronj2017.02.0112
Mosier, A., Kroeze, C., Nevison, C., Oenema, O., Seitzinger, S., and van Cleemput, O. (1998). Closing the global N2O budget : Nitrous oxide emissions through the agricultural nitrogen cycle inventory methodology. Nutr. Cycl. Agroecosyst. 52, 225–248. doi:10.1023/A:1009740530221
Mosier, A., and Kroeze, C. (2000). Potential impact on the global atmospheric N2O budget of the increased nitrogen input required to meet future global food demands. Chemosphere - Glob. Change Sci. 2, 465–473. doi:10.1016/S1465-9972(00)00039-8
Mosier, A. R., Duxbury, J. M., Freney, J. R., Heinemeyer, O., and Minami, K. (1996). Nitrous oxide emissions from agricultural fields: Assessment, measurement and mitigation. Prog. Nitrogen Cycl. Stud. 181, 589–602. doi:10.1007/978-94-011-5450-5_97
Muhammad, I., Sainju, U. M., Zhao, F., Khan, A., Ghimire, R., Fu, X., et al. (2019). Regulation of soil CO2 and N2O emissions by cover crops: A meta-analysis. Soil Tillage Res. 192, 103–112. doi:10.1016/j.still.2019.04.020
Nan, W., Yue, S., Li, S., Huang, H., and Shen, Y. (2016). Characteristics of N2O production and transport within soil profiles subjected to different nitrogen application rates in China. Sci. Total Environ. 542, 864–875. doi:10.1016/j.scitotenv.2015.10.147
Nayak, A. K., Rahman, M. M., Naidu, R., Dhal, B., Swain, C. K., Nayak, A. D., et al. (2019). Current and emerging methodologies for estimating carbon sequestration in agricultural soils: A review. Sci. Total Environ. 665, 890–912. doi:10.1016/j.scitotenv.2019.02.125
Ogle, S. M., Olander, L., Wollenberg, L., Rosenstock, T., Tubiello, F., Paustian, K., et al. (2014). Reducing greenhouse gas emissions and adapting agricultural management for climate change in developing countries: Providing the basis for action. Glob. Chang. Biol. 20, 1–6. doi:10.1111/gcb.12361
Olander, L., Wollenberg, E., Tubiello, F., and Herold, M. (2013). Advancing agricultural greenhouse gas quantification. Environ. Res. Lett. 8, 011002. doi:10.1088/1748-9326/8/1/011002
Oorts, K., Merckx, R., Gréhan, E., Labreuche, J., and Nicolardot, B. (2007). Determinants of annual fluxes of CO2 and N2O in long-term no-tillage and conventional tillage systems in northern France. Soil Tillage Res. 95, 133–148. doi:10.1016/j.still.2006.12.002
Osmond, D., Austin, R., Shelton, S., van Es, H., and Sela, S. (2018). Evaluation of adapt-N and realistic yield expectation approaches for maize nitrogen management in North Carolina. Soil Sci. Soc. Am. J. 82, 1449–1458. doi:10.2136/sssaj2018.03.0127
Pang, X. P., and Letey, J. (2000). Organic farming: Challenge of timing nitrogen availability to crop nitrogen requirements. Soil Sci. Soc. Am. J. 64, 247–253. doi:10.2136/sssaj2000.641247x
Parihar, C. M., Parihar, M. D., Sapkota, T. B., Nanwal, R. K., Singh, A. K., Jat, S. L., et al. (2018). Long-term impact of conservation agriculture and diversified maize rotations on carbon pools and stocks, mineral nitrogen fractions and nitrous oxide fluxes in inceptisol of India. Sci. Total Environ. 640–641, 1382–1392. doi:10.1016/j.scitotenv.2018.05.405
Parton, W. J., Hartman, M., Ojima, D., and Schimel, D. (1998). DAYCENT and its land surface submodel: Description and testing. Glob. Planet. Change 19, 35–48. doi:10.1016/S0921-8181(98)00040-X
Paustian, K., Collier, S., Baldock, J., Burgess, R., Creque, J., DeLonge, M., et al. (2019). Quantifying carbon for agricultural soil management: From the current status toward a global soil information system. Carbon Manag. 10, 567–587. doi:10.1080/17583004.2019.1633231
Petersen, S. O., Nielsen, T. H., Frostegård, Å., and Olesen, T. (1996). O2 uptake, C metabolism and denitrification associated with manure hot-spots. Soil Biol. Biochem. 28, 341–349. doi:10.1016/0038-0717(95)00150-6
Petersen, S. O., Regina, K., Pöllinger, A., Rigler, E., Valli, L., Yamulki, S., et al. (2006). Nitrous oxide emissions from organic and conventional crop rotations in five European countries. Agric. Ecosyst. Environ. 112, 200–206. doi:10.1016/j.agee.2005.08.021
Peyrard, C., Mary, B., Perrin, P., Véricel, G., Gréhan, E., Justes, E., et al. (2016). N2O emissions of low input cropping systems as affected by legume and cover crops use. Agric. Ecosyst. Environ. 224, 145–156. doi:10.1016/j.agee.2016.03.028
Quiring, S. M., Ford, T. W., Wang, J. K., Khong, A., Harris, E., Lindgren, T., et al. (2016). the North American soil moisture database: Development and applications. Bull. Am. Meteorol. Soc. 97, 1441–1459. doi:10.1175/BAMS-D-13-00263.1
R Core Team (2020). R: A language and environment for statistical computing. Vienna, Austria: R Foundation for Statistical Computing. Available at: https://www.r-project.org/(Accessed July 25, 2022).
Rabot, E., Cousin, I., and Hénault, C. (2015). A modeling approach of the relationship between nitrous oxide fluxes from soils and the water-filled pore space. Biogeochemistry 122, 395–408. doi:10.1007/s10533-014-0048-1
Riahi, K., Rao, S., Krey, V., Cho, C., Chirkov, V., Fischer, G., et al. (2011). RCP 8.5-A scenario of comparatively high greenhouse gas emissions. Clim. Change 109, 33–57. doi:10.1007/s10584-011-0149-y
Rochette, P., Angers, D. A., Chantigny, M. H., Gagnon, B., and Bertrand, N. (2008). N2O fluxes in soils of contrasting textures fertilized with liquid and solid dairy cattle manures. Can. J. Soil Sci. 88, 175–187. doi:10.4141/CJSS06016
Rumpel, C., Amiraslani, F., Koutika, L. S., Smith, P., Whitehead, D., and Wollenberg, E. (2018). Put more carbon in soils to meet paris climate pledges. Nature 564, 32–34. doi:10.1038/d41586-018-07587-4
Sawyer, J., Nafziger, E., Randall, G., Bundy, L., Rehm, G., and Joern, B. (2006). Concepts and rationale for regional nitrogen rate guidelines for corn concepts and rationale for regional nitrogen rate guidelines for corn. Ames, IA: Iowa State University Extension. Available at: https://store.extension.iastate.edu/product/Concepts-and-Rationale-for-Regional-Nitrogen-Rate-Guidelines-for-Corn (Accessed July 25, 2022).
Saxton, K., and Rawls, W. (2006). Soil water characteristic estimates by texture and organic matter for hydrologic solutions. Soil Sci. Soc. Am. J. 70, 1569–1578. doi:10.2136/sssaj2005.0117
Scheer, C., Grace, P. R., Rowlings, D. W., and Payero, J. (2013). Soil N2O and CO2 emissions from cotton in Australia under varying irrigation management. Nutr. Cycl. Agroecosyst. 95, 43–56. doi:10.1007/s10705-012-9547-4
Schmidt, U., Thöni, H., and Kaupenjohann, M. (2000). Using a boundary line approach to analyze N2O flux data from agricultural soils. Nutr. Cycl. Agroecosyst. 57, 119–129. doi:10.1023/A:1009854220769
Sela, S., van Es, H. M., Moebius-Clune, B. N., Marjerison, R., Moebius-Clune, D., Schindelbeck, R., et al. (2017). Dynamic model improves agronomic and environmental outcomes for maize nitrogen management over static approach. J. Environ. Qual. 46, 311–319. doi:10.2134/jeq2016.05.0182
Shakoor, A., Shakoor, S., Rehman, A., Ashraf, F., Abdullah, M., Shahzad, S. M., et al. (2021). Effect of animal manure, crop type, climate zone, and soil attributes on greenhouse gas emissions from agricultural soils—a global meta-analysis. J. Clean. Prod. 278, 124019. doi:10.1016/j.jclepro.2020.124019
Shang, Z., Abdalla, M., Kuhnert, M., Albanito, F., Zhou, F., Xia, L., et al. (2020). Measurement of N2O emissions over the whole year is necessary for estimating reliable emission factors. Environ. Pollut. 259, 113864. doi:10.1016/j.envpol.2019.113864
Shcherbak, I., Millar, N., and Robertson, G. P. (2014). Global metaanalysis of the nonlinear response of soil nitrous oxide (N2O) emissions to fertilizer nitrogen. Proc. Natl. Acad. Sci. U. S. A. 111, 9199–9204. doi:10.1073/pnas.1322434111
Sillmann, J., Kharin, V. V., Zwiers, F. W., Zhang, X., and Bronaugh, D. (2013). Climate extremes indices in the CMIP5 multimodel ensemble: Part 2. Future climate projections. J. Geophys. Res. Atmos. 118, 2473–2493. doi:10.1002/jgrd.50188
Six, J., Ogle, S. M., Breidt, F. J., Conant, R. T., Mosiers, A. R., and Paustian, K. (2004). The potential to mitigate global warming with no-tillage management is only realized when practised in the long term. Glob. Chang. Biol. 10, 155–160. doi:10.1111/j.1529-8817.2003.00730.x
Skiba, U., and Smith, K. A. (2000). The control of nitrous oxide emissions from agricultural and natural soils. Chemosphere - Glob. Change Sci. 2, 379–386. doi:10.1016/S1465-9972(00)00016-7
Skinner, C., Gattinger, A., Muller, A., Mäder, P., Fliebach, A., Stolze, M., et al. (2014). Greenhouse gas fluxes from agricultural soils under organic and non-organic management - a global meta-analysis. Sci. Total Environ. 468–469, 553–563. doi:10.1016/j.scitotenv.2013.08.098
Sleutel, S., De Neve, S., Hofman, G., Boecky, P., Beheydt, D., Van Cleemput, O., et al. (2003). Carbon stock changes and carbon sequestration potential of Flemish cropland soils. Glob. Chang. Biol. 9, 1193–1203. doi:10.1046/j.1365-2486.2003.00651.x
Smith, K. A. (2017). Changing views of nitrous oxide emissions from agricultural soil: Key controlling processes and assessment at different spatial scales. Eur. J. Soil Sci. 68, 137–155. doi:10.1111/ejss.12409
Smith, K. A., McTaggart, I. P., and Tsuruta, H. (1997). Emissions of N2O and NO associated with nitrogen fertilization in intensive agriculture, and the potential for mitigation. Soil Use Manag. 13, 296–304. doi:10.1111/j.1475-2743.1997.tb00601.x
Smith, P., Goulding, K. W., Smith, K. A., Powlson, D. S., Smith, J. U., Falloon, P., et al. (2001). Enhancing the carbon sink in European agricultural soils: Including trace gas fluxes in estimates of carbon mitigation potential. Nutr. Cycl. Agroecosyst. 60, 237–252. doi:10.1023/A:1012617517839
Smith, W. N., Grant, B., Desjardins, R. L., Lemke, R., and Li, C. (2004). Estimates of the interannual variations of N2O emissions from agricultural soils in Canada. Nutr. Cycl. Agroecosyst. 68, 37–45. doi:10.1023/B:FRES.0000012230.40684.c2
Smith, W. N., Grant, B. B., Desjardins, R. L., Worth, D., Li, C., Boles, S. H., et al. (2010). A tool to link agricultural activity data with the DNDC model to estimate GHG emission factors in Canada. Agric. Ecosyst. Environ. 136, 301–309. doi:10.1016/j.agee.2009.12.008
Snyder, C. S., Davidson, E. A., Smith, P., and Venterea, R. T. (2014). Agriculture: Sustainable crop and animal production to help mitigate nitrous oxide emissions. Curr. Opin. Environ. Sustain. 9–10, 46–54. doi:10.1016/j.cosust.2014.07.005
Stocker, B. D., Zscheischler, J., Keenan, T. F., Prentice, I. C., Peñuelas, J., and Seneviratne, S. I. (2018). Quantifying soil moisture impacts on light use efficiency across biomes. New Phytol. 218, 1430–1449. doi:10.1111/nph.15123
Stockmann, U., Adams, M. A., Crawford, J. W., Field, D. J., Henakaarchchi, N., Jenkins, M., et al. (2013). The knowns, known unknowns and unknowns of sequestration of soil organic carbon. Agric. Ecosyst. Environ. 164, 80–99. doi:10.1016/j.agee.2012.10.001
Su, C., Kang, R., Huang, W., and Fang, Y. (2021). Temporal patterns of N2O fluxes from a rainfed maize field in northeast China. Front. Environ. Sci. 9, 668084. doi:10.3389/fenvs.2021.668084
Tesfaye, K., Takele, R., Sapkota, T. B., Khatri-Chhetri, A., Solomon, D., Stirling, C., et al. (2021). Model comparison and quantification of nitrous oxide emission and mitigation potential from maize and wheat fields at a global scale. Sci. Total Environ. 782, 146696. doi:10.1016/j.scitotenv.2021.146696
Tian, H., Xu, R., Canadell, J. G., Thompson, R. L., Winiwarter, W., Suntharalingam, P., et al. (2020). A comprehensive quantification of global nitrous oxide sources and sinks. Nature 586, 248–256. doi:10.1038/s41586-020-2780-0
United States Department of AgricultureNatural Resources Conservation Service (2016). Gridded soil survey geographic (gSSURGO) database for the conterminous United States. Available at: https://gdg.sc.egov.usda.gov/ (Accessed July 25, 2022).
United States Department of Agriculture (2019). ARMS farm financial and crop production practices. Tailored Reports: Crop Production Practices. Available at: https://data.ers.usda.gov/reports.aspx?ID=17883 (Accessed July 25, 2022).
United States Department of Agriculture (2018). Fertilizer use and price. Economic Research Service. Available at: https://www.ers.usda.gov/data-products/fertilizer-use-and-price.aspx (Accessed July 25, 2022).
United States Department of Agriculture (2010). Field crops: Usual planting and harvesting dates for U.S. field crops. Washington, DC: USDA National Agricultural Statistics Service. Available at: https://downloads.usda.library.cornell.edu/usda-esmis/files/vm40xr56k/dv13zw65p/w9505297d/planting-10-29-2010.pdf (Accessed July 25, 2022).
US EPA (2021). Inventory of U.S. greenhouse gas emissions and sinks: 1990-2019. Available at: https://www.epa.gov/sites/default/files/2021-04/documents/us-ghg-inventory-2021-main-text.pdf (Accessed July 25, 2022).
Van Der Weerden, T. J., Kelliher, F. M., and De Klein, C. A. M. (2012). Influence of pore size distribution and soil water content on nitrous oxide emissions. Soil Res. 50, 125–135. doi:10.1071/SR11112
van Groenigen, J. W., Huygens, D., Boeckx, P., Kuyper, T. W., Lubbers, I. M., Rütting, T., et al. (2015). The soil N cycle: New insights and key challenges. Soil 1, 235–256. doi:10.5194/soil-1-235-2015
van Kessel, C., Venterea, R., Six, J., Adviento-Borbe, M. A., Linquist, B., and van Groenigen, K. J. (2013). Climate, duration, and N placement determine N2O emissions in reduced tillage systems: A meta-analysis. Glob. Chang. Biol. 19, 33–44. doi:10.1111/j.1365-2486.2012.02779.x
Varvel, G. E. (2006). Soil organic carbon changes in diversified rotations of the Western Corn Belt. Soil Sci. Soc. Am. J. 70, 426–433. doi:10.2136/sssaj2005.0100
Venterea, R. T., Dolan, M. S., and Ochsner, T. E. (2010). Urea decreases nitrous oxide emissions compared with anhydrous ammonia in a Minnesota corn cropping system. Soil Sci. Soc. Am. J. 74, 407–418. doi:10.2136/sssaj2009.0078
Vinther, F. P., Hansen, E. M., and Olesen, J. E. (2004). Effects of plant residues on crop performance, N mineralisation and microbial activity including field CO2 and N2O fluxes in unfertilised crop rotations. Nutr. Cycl. Agroecosyst. 70, 189–199. doi:10.1023/B:FRES.0000048477.56417.46
Wagner, W., Scipal, K., Pathe, C., Gerten, D., Lucht, W., and Rudolf, B. (2003). Evaluation of the agreement between the first global remotely sensed soil moisture data with model and precipitation data. J. Geophys. Res. 108, 4611. doi:10.1029/2003jd003663
Wagner-Riddle, C., Congreves, K. A., Abalos, D., Berg, A. A., Brown, S. E., Ambadan, J. T., et al. (2017). Globally important nitrous oxide emissions from croplands induced by freeze-thaw cycles. Nat. Geosci. 10, 279–283. doi:10.1038/ngeo2907
Walling, E., and Vaneeckhaute, C. (2020). Greenhouse gas emissions from inorganic and organic fertilizer production and use: A review of emission factors and their variability. J. Environ. Manage. 276, 111211. doi:10.1016/j.jenvman.2020.111211
Wang, M., Wu, M., and Huo, H. (2007). Life-cycle energy and greenhouse gas emission impacts of different corn ethanol plant types. Environ. Res. Lett. 2, 024001. doi:10.1088/1748-9326/2/2/024001
Wang, X., Li, Y., Waqas, M. A., Wang, B., Hassan, W., and Qin, X. (2021). Divergent terrestrial responses of soil N2O emissions to different levels of elevated CO2 and temperature. Oikos 130, 1440–1449. doi:10.1111/oik.07738
Weitz, A. M., Linder, E., Frolking, S., Crill, P. M., and Keller, M. (2001). N2O emissions from humid tropical agricultural soils: Effects of soil moisture, texture and nitrogen availability. Soil Biol. Biochem. 33, 1077–1093. doi:10.1016/S0038-0717(01)00013-X
Werner, C., Butterbach-Bahl, K., Haas, E., Hickler, T., and Kiese, R. (2007). A global inventory of N2O emissions from tropical rainforest soils using a detailed biogeochemical model. Glob. Biogeochem. Cycles 21, GB3010. doi:10.1029/2006GB002909
Wu, D., Dong, W., Oenema, O., Wang, Y., Trebs, I., and Hu, C. (2013). N2O consumption by low-nitrogen soil and its regulation by water and oxygen. Soil Biol. Biochem. 60, 165–172. doi:10.1016/j.soilbio.2013.01.028
Xia, Y., Ek, M. B., Wu, Y., Ford, T., and Quiring, S. M. (2015b). Comparison of NLDAS-2 simulated and NASMD observed daily soil moisture. Part I: Comparison and analysis. J. Hydrometeorol. 16, 1962–1980. doi:10.1175/JHM-D-14-0096.1
Xia, Y., Ford, T. W., Wu, Y., Quiring, S. M., and Ek, M. B. (2015a). Automated quality control of in situ soil moisture from the North American Soil Moisture Database using NLDAS-2 products. J. Appl. Meteorol. Climatol. 54, 1267–1282. doi:10.1175/JAMC-D-14-0275.1
Xia, Y., Guan, K., Copenhaver, K., and Wander, M. (2020). Estimating cover crop biomass nitrogen credits with Sentinel-2 imagery and sites covariates. Agron. J. 113, 1084–1101. doi:10.1002/agj2.20525
Xia, Y., Kwon, H., and Wander, M. (2021). Developing county-level data of nitrogen fertilizer and manure inputs for corn production in the United States. J. Clean. Prod. 309, 126957. doi:10.1016/j.jclepro.2021.126957
Xia, Y., and Wander, M. (2022). Management zone-based estimation of positive and negative nitrous oxide flux in organic corn fields. Soil Sci. Soc. Am. J. 86, 1043–1057. doi:10.1002/saj2.20416
Yan, X., Akimoto, H., and Ohara, T. (2003). Estimation of nitrous oxide, nitric oxide and ammonia emissions from croplands in East, Southeast and South Asia. Glob. Chang. Biol. 9, 1080–1096. doi:10.1046/j.1365-2486.2003.00649.x
Yan, X., Hosen, Y., and Yagi, K. (2001). Nitrous oxide and nitric oxide emissions from maize field plots as affected by N fertilizer type and application method. Biol. Fertil. Soils 34, 297–303. doi:10.1007/s003740100401
Yao, H., Wen, Z., Xunhua, Z., Shenghui, H., and Yongqiang, Y. (2006). Estimates of methane emissions from Chinese rice paddies by linking a model to GIS database. Acta Ecol. Sin. 26, 980–987. doi:10.1016/S1872-2032(06)60016-4
Yuan, S., Quiring, S. M., and Leasor, Z. T. (2021). Historical changes in surface soil moisture over the contiguous United States: An assessment of CMIP6. Geophys. Res. Lett. 48, 2020GL089991. doi:10.1029/2020GL089991
Zhang, Y., Marx, E., Williams, S., Gurung, R., Ogle, S., Horton, R., et al. (2020). Adaptation in U.S. Corn Belt increases resistance to soil carbon loss with climate change. Sci. Rep. 10, 13799. doi:10.1038/s41598-020-70819-z
Keywords: N2O emissions, corn biofuel, parameterized CENTURY model, emission factor, soil moisture, meta-analytical summary
Citation: Xia Y, Wander MM, Quiring SM, Yuan S and Kwon H (2022) Process-based modeling of soil nitrous oxide emissions from United States corn fields under different management and climate scenarios coupled with evaluation using regional estimates. Front. Environ. Sci. 10:971261. doi: 10.3389/fenvs.2022.971261
Received: 16 June 2022; Accepted: 02 August 2022;
Published: 01 September 2022.
Edited by:
Ryusuke Hatano, Hokkaido University, JapanReviewed by:
Xiaolei Huang, Shanxi Agricultural University, ChinaKazuya Nishina, National Institute for Environmental Studies (NIES), Japan
Copyright © 2022 Xia, Wander, Quiring, Yuan and Kwon. This is an open-access article distributed under the terms of the Creative Commons Attribution License (CC BY). The use, distribution or reproduction in other forums is permitted, provided the original author(s) and the copyright owner(s) are credited and that the original publication in this journal is cited, in accordance with accepted academic practice. No use, distribution or reproduction is permitted which does not comply with these terms.
*Correspondence: Hoyoung Kwon, hkwon@anl.gov
†Present Address: Yushu Xia, Woodwell Climate Research Center, Falmouth, MA, United States