Analysis of air pollution characteristics, transport pathways and potential source areas identification in Beijing before, during and after the COVID-19 outbreak
 Hanyu Zhang
 Xuejun Wang
 Xianbao Shen
 Xin Li1,2
  Zhiliang Yao
- 1School of Ecology and Environment, Beijing Technology and Business University, Beijing, China
- 2State Environmental Protection Key Laboratory of Food Chain Pollution Control, Beijing Technology and Business University, Beijing, China
A series of lockdown measures in response to the Corona Virus Disease 2019 (COVID-19) outbreak resulted in a drop in anthropogenic emissions and changes in concentrations of PM2.5 and O3. Backward trajectories analysis, cluster analysis, potential source contribution function (PSCF) and concentration weighted trajectory (CWT) technologies were conducted to reveal the characteristics and potential source areas of pollutants in Beijing before the COVID-19 outbreak (BCO period), during the outbreak (COB period) and after the outbreak (ACO period), as well as the contemporaneous period in 2019 (CCO period), which is critical for exploring the efficient control measures and making policy. The results indicated that despite the significant reduction in anthropogenic emissions during the epidemic, the PM2.5 concentrations increased by 1.0% caused by unfavorable meteorological conditions. O3 concentrations increased by 174.8% compared to that during the BCO period due to the increased temperature and inappropriate precursor reduction ratios. A considerable decrease of NO3- in PM2.5 was observed under the influence of significant reductions in vehicle emissions during the lockdown. The cluster analysis revealed that short-range transport played a significant role in the accumulation of local PM2.5 pollution, while long-range northwest airflows contributed more to O3 accumulation, and weakened as the season changed. The PSCF and CWT analysis demonstrated that potential source areas of PM2.5 were mostly located in the central and southern Hebei, the southwestern Shandong in the CCO period, and expanded to central Inner Mongolia and northern Shanxi in the COB period. These areas were highly compatible with the high emission areas of the emission inventory statistics. After the outbreak, the source areas of O3 were centered in the Beijing-Tianjin-Hebei region and Shandong province, with a radial dispersion in all directions, while they were distributed in the central Mongolia and Inner Mongolia during the other periods.
1 Introduction
China has recently experienced unprecedented industrialization, urbanization, and economic growth. As a consequence, PM2.5 (particulate matter with an aerodynamic diameter of less than 2.5 μm) and O3 have become the major air pollutants, which can negatively affect climate and ecosystems by reducing atmospheric visibility (Yao et al., 2021) and enhancing oxidation (Wang Y. et al., 2021), induce cardiovascular and respiratory disease (Lei et al., 2019; Yang et al., 2022), and increase the risk of premature death (Wang C. et al., 2021). PM2.5 and O3 have a complex relationship in that they share common precursors, namely volatile organic compounds (VOCs) and nitrogen oxides (NOx) (Wang Y. et al., 2020), and interact with each other in the atmosphere. Aerosol particles affect photolysis efficiency by interfering with ground-level radiation, as well as NOx and HO2 uptake, thereby inhibiting O3 formation (Li et al., 2019). High ozone concentrations lead to increased atmospheric oxidation, which favors the production of secondary particulate matter in PM2.5 (Zhao et al., 2018). Since 2013, a series of policies were enacted in China (Geng et al., 2019; Wang et al., 2019), which significantly improved air quality as a result (Li W. et al., 2020), while PM2.5 heavy pollution events still occurred from time to time (Feng et al., 2019; Zhao et al., 2021). In addition, ozone pollution has deteriorated significantly, especially in the Beijing-Tianjin-Hebei (BTH), Yangtze River Delta region (YRD), etc. (Fan et al., 2020). Therefore, it is crucial to conduct research on the characteristics of PM2.5 and O3 to deal with the huge challenges brought by the regional complex air pollution.
The worldwide outbreak and spread of COVID-19 in early 2020 created an unprecedented nationwide extreme reduction scenario. The strength of labor-intensive activities such as transportation, building construction, and catering services were significantly reduced, atmospheric pollution emissions from these sections dropped dramatically. Light and processing industries were basically shut down, while continuous energy supply equipment for thermal power generation, residential heating, steel and petrochemicals production were still in operation (Tang et al., 2021). Numerous studies have reported the decline in the traffic emissions of air pollutants, especially NO2 (Liu F. et al., 2020; Le et al., 2020; Huang et al., 2021). The average daily traffic flow in Beijing decreased rapidly by 62% during the outbreak, also the emission intensities of NOx, PM2.5, CO and HC from vehicles were reduced by approximately 30% (Cao et al., 2021). Daily emissions of SO2, NOx, VOCs and PM2.5 from the thermal power and industrial sectors in the BTH region decreased by 25%, 29%, 40% and 20%, respectively (Tang et al., 2021). After the outbreak, the level of anthropogenic activities picked up as work and production resumed. The daily traffic flow in Beijing increased rapidly by nearly 50% from May 1 to June 15 in 2020 but declined again after that by approximately 23% because the COVID-19 epidemic recurred in the Beijing Xinfadi Market (Cao et al., 2021). At the same time, a growing emission of primary oxygenated VOC by 51.10 ± 8.28% was observed for the enhanced usage of clean and disinfected products (Zhang Z. et al., 2022).
The reduction in primary pollutant emissions has led to a decrease in pollutants’ concentrations in the atmosphere and a significant improvement in air quality (Chauhan and Singh, 2020; P. Wang et al., 2020a). NO2, PM2.5 and PM10 were reduced dramatically by 50.6%, 41.2% and 33.1% in Wuhan city by taking the most stringent control measures (Sulaymon et al., 2021). PM2.5 concentrations in the YRD region and Pearl River Delta region decreased by 41.87% and 43.30%, respectively (Liu et al., 2022). However, inappropriate emission reduction ratios and unfavorable meteorological conditions not only moderated the impact of emission reduction on air quality, but also may cause an increase in pollutant concentrations (Ma et al., 2022). Due to the effects of meteorological conditions, such as high temperature, high humidity, and low wind speed, as well as the incomplete shutdown of the energy sector during the lockdown, PM2.5 concentrations in the BTH region only decreased by 2.01% (Liu et al., 2022). The related studies found an increase of 19.5% in Beijing during January and February 2020 (Nichol et al., 2020), even heavy pollution days (Wang P. et al., 2020; Zhang X. et al., 2022). In addition, significant NOx emission reduction weakened the NO titration effect (NO + O3 = NO2+O2) and lowered O3 utilization (Mahato et al., 2020). Coupled with the increased temperature during the outbreak, elevated O3 concentrations were reported at multiple locations (Le et al., 2020; Shi et al., 2021). The resulting enhanced atmospheric oxidation further contributed to secondary aerosol generation (Wang Y. et al., 2021; Huang et al., 2021).
Regional transport also has a significant impact on the air quality. The Hybrid Single-Particle Lagrangian Integrated Trajectory (HYSPLIT), the Potential Source Contribution Function (PSCF), and the Concentration Weighted Trajectory (CWT) technologies have been widely applied to identify the regional transport pathways of airflows and potential source areas contributions (Zong et al., 2018; Hui et al., 2019; Xiong and Du, 2020). Studies have investigated the potential source regions of air pollutants by the PSCF model in Jiaxing, and found that the COVID-19 outbreak resulted in a significant decline in weighted PSCF value, while exerted little effect on potential source areas (Xiong et al., 2021). The reduced potential source areas due to the lockdown were observed in Changchun by HYSPLIT and PSCF model (Gao et al., 2021). The transport pathways and source distribution of PM2.5 in the BTH region during the polluted episodes of the COVID-19 outbreak were investigated by HYSPLIT, PSCF and CWT method, and deduced that local emission sources dominated air pollution during the first episode, while short-distance transport from the southern and southwestern areas was primarily responsible for the second episode (Zhao et al., 2020).
In a word, air pollutants concentrations are affected by meteorological conditions, local emissions, and regional transport (An et al., 2019), while significant emission reductions during the epidemic lockdown contributed to meteorological conditions and regional transport to pollutant concentrations more prominent. Therefore, the objectives of this paper are organized as follows: 1) to analyze the concentration characteristics of PM2.5 and O3 in Beijing before, during and after the outbreak of coronavirus disease in 2020 as well as the same lockout period in 2019. 2) to investigate the relationship between air pollutants (PM2.5 and O3) and meteorological variables (temperature, relative humidity, wind speed and wind direction) by correlation analysis. 3) to demonstrate the transport pathways and potential source contribution of air pollutants at different stages based on backward trajectory, cluster, PSCF and CWT analyses. 4) to reveal the causes of variations in pollutants concentrations, transport pathways, and potential source areas in different periods. The results can provide scientific and technological support for future joint prevention and control of regional air pollution in Beijing.
2 Materials and methods
2.1 Study area and data collection
This study focused on Beijing, the detailed target area and environmental monitoring sites are shown in Figure 1. To investigate the effects of the COVID-19 epidemic, the hourly concentration profiles of PM2.5 and O3 were obtained from site 1 (116.136°E, 39.742°N) located in Liangxiang town at an altitude of 47 m, and the hourly profiles of PM2.5 components were derived from site 2 (115.832°E, 39.542°N) located in Dashiwo town at an altitude of 52 m. Both sites 1 and 2 are located in the plain area of Fangshan district, in southwestern Beijing, and the distance between the two sites is 34.2 km. The meteorological data were obtained from the hourly ERA5 reanalysis dataset, which involved temperature (T), relative humidity (RH), wind speed (WS), and wind direction (WD). The wind directions were categorized as follow: 348.76° < N ≤ 11.25°, 11.26° < NNE ≤ 33.75°, 33.76° < NE ≤ 56.25°, 26.26° < ENE ≤ 78.75°, 78.76° < E ≤ 101.25°, 101.26° < ESE ≤ 123.75°, 123.76° < SE ≤ 146.25°, 146.26° < SSE ≤168.75°, 168.76° < S ≤ 191.25°, 191.26° < SSW ≤213.75°, 213.76° < SW ≤ 236.25°, 236.26° < WSW ≤ 258.75°, 258.76° < W ≤ 281.25°, 281.26° < WNW ≤ 303.75°, 303.76° < NW ≤ 326.25°, 326.26° < NNW ≤ 348.75°.
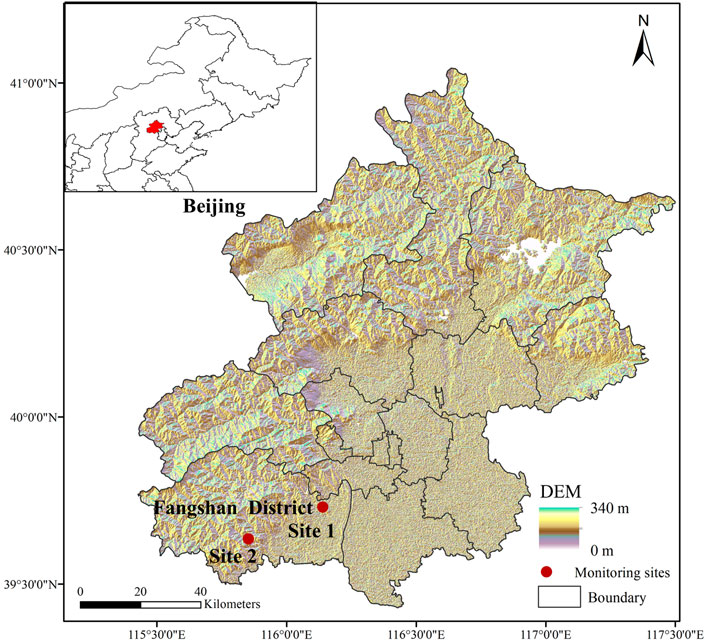
FIGURE 1. Topography map of Beijing and distribution of the environmental monitoring sites.
The study period was divided into four parts, including the contemporaneous period of the COVID-19 outbreak (CCO period, from January 23 to 31 March 2019), the period before the outbreak (BCO period, from 15 November 2019, to 22 January 2020), the period of the outbreak (COB period, from January 23 to 31 March 2020), as well as the period after the outbreak (ACO period, from May 1 to 15 July 2020).
2.2 Backward trajectory analysis
HYSPLIT model, developed by United States National Oceanic and Air Administration (NOAA) (Draxler and Hess, 1998), was performed to calculate 48-h backward trajectories with 1-h time resolution to track the transport pathways of airflow arriving at site 1. Regarding the height of the starting point, some researchers use 500 m above ground level (AGL) to start well within the boundary layer (Liu Y. et al., 2020; Fang et al., 2021). Others use a height of 100 m AGL to represent the near-ground situation (Gao et al., 2021; Wang et al., 2022). Therefore, backward trajectory simulations were performed at both 100 and 500 m AGL to investigate the effect of release height on clustering analysis and potential source area identification.
HYSPLIT is a full-fledged system for transforming basic air parcel trajectories into sophisticated dispersion and deposition models (Li L. et al., 2017), which can determine the sources of air masses arriving at a receptor location. The input meteorological data were provided by the global data assimilation system (ftp://arlftp.arlhq.noaa.gov/pub/archives/gdas1/).
Moreover, cluster analysis as a multivariate statistical analysis technique categorizes the trajectory data into various transit clusters by Angle distance or Euclidean distance methods (Li D. et al., 2017). The Euclidean distance method can categorize backward trajectories based on velocity as well as the direction of airflows (Zhou et al., 2021). Therefore, the Euclidean distance method was used to divide the backward trajectories into distinct clusters based on the TrajStat model (version 1.5.3) in MeteoInfo software (version 3.2.2).
2.3 Potential source contribution function and concentration weighted trajectory technologies
The PSCF method can build a probability map of the areas surrounding a receptor site based on the allocation of air mass residence time to pinpoint potential sources affecting the air quality at the receptor site (dos Santos and Hoinaski, 2021). Each trajectory was classified as polluted or clean based on a threshold value. According to the backward trajectories modeling results, the geographic region was divided into grid cells at 0.25° × 0.25° resolution, and the PSCF value for the ijth grid cell is defined as
where in Eq. 1 mij and nij represent the number of polluted and total trajectories endpoints that fall in the ijth grid cell, respectively. Since PSCF is a conditional probability function, large uncertainty arises when the airflow’s residence time in the grid is short, that nij is less than three times the average number of trajectory endpoints (Avg) of all grid cells in the study area. Therefore, an arbitrary weight function Wij multiplied by the PSCF to reduce the uncertainty (Wang H. et al., 2018; Liu et al., 2018), which is defined as WPSCF and can be calculated by Eq. 2 and Eq. 3 below:
However, PSCF only represents the proportion of polluted trajectories in the grid cells, but can’t reflect their contribution to the receptor sites. Therefore, the CWT method was used to analyze its pollution contribution to the target grid and identify potential source areas by calculating the average weight concentration (Cij) of the ijth grid. The calculation formula is as follows (Li H. et al., 2020):
Where in Eq. 4
3 Results and discussion
3.1 Overview of pollutants concentration
3.1.1 Variation in PM2.5 and O3 concentrations
Figure 2 shows the time series of PM2.5 and O3 concentrations and the meteorological parameters (T, RH, WS and WD) during the CCO, BCO, COB and ACO periods. The wind direction and wind speed rose diagrams for each period are shown in Supplementary Figure S1. The ranges and mean values of PM2.5, O3 and meteorological variables in different periods are presented in Table 1. In addition, the correlation between pollutants and meteorological variables in each period was further analyzed by pearson correlation analysis (Figure 3).
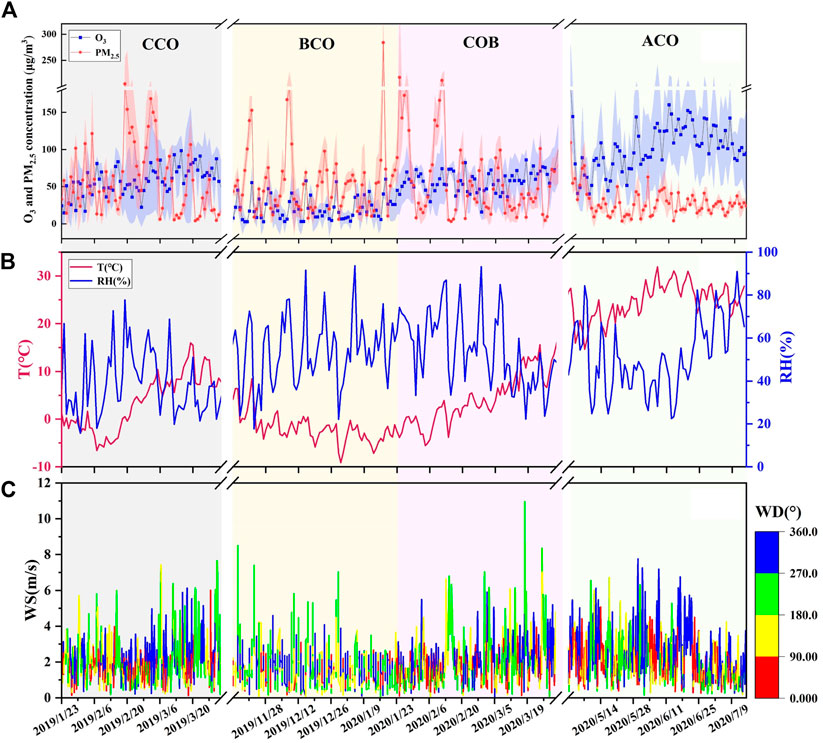
FIGURE 2. Time series of (A) PM2.5 and O3, concentrations, (B) temperature (T) and relative humidity (RH), and (C) wind speed (WS) and wind direction (WD) during the CCO, BCO, COB and ACO periods in Beijing.
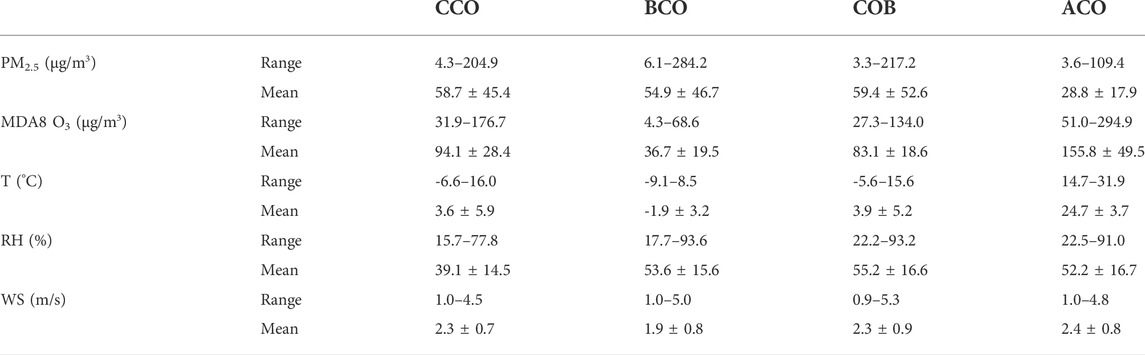
TABLE 1. Range and average concentration of pollutants and meteorological variables during the four periods.
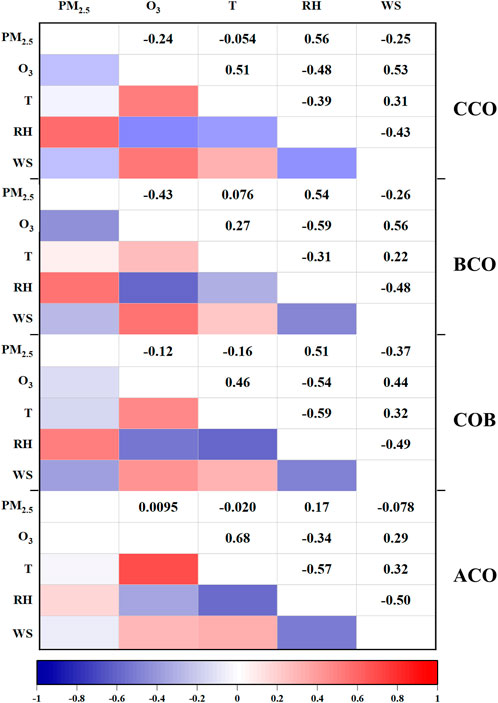
FIGURE 3. Heat map of the correlation between pollutants and meteorological variables in different periods.
The average concentrations of PM2.5 in four periods were 58.7 ± 45.4, 54.9 ± 46.7, 59.4 ± 52.6, and 28.8 ± 17.9 μg/m3, respectively. In terms of polluted days, the 24-h mean concentration exceeded the Grade II (75 μg/m3) Ambient Air Quality Standard (AAQS, GB 3095–2012), still accounted for 29.9%, 16.2% and 27.9% of total days during the CCO, BCO and COB periods. Two polluted episodes lasting about a week occurred during both the CCO and COB periods. During the CCO period, one pollution episode lasted from 19 to 24 February 2019 (CCO I episode) and the other was from 27 February to 5 March 2019 (CCO II episode), with the average PM2.5 concentration of 133.2 and 122.9 μg/m3, and the highest daily PM2.5 concentrations were 2.7 and 2.2 times the Grade II AAQS, respectively. Polluted episodes during the COB period lasted from 24 to 29 January, 2020 (COB I episode) and 8 to 13 February, 2020 (COB II episode), with the average concentration of 155.5 and 151.6 μg/m3, which were both approximately twice the standard limit. Despite the significant reduction in anthropogenic emissions during the outbreak, PM2.5 concentrations increased by 8.2% and 1.0% compared to the pre-outbreak period and the reference period in 2019, which was mainly attributed to the significant negative impact of two heavy pollution episodes caused by unfavorable meteorological conditions. By Pearson Correlation Analysis, PM2.5 concentration was significantly and positively correlated with RH during the CCO (r = 0.56), BCO (r = 0.54) and COB (r = 0.51) period. RH during the COB period increased by 3.0% and 41.2% compared to that of the BCO and CCO periods, which favored heterogeneous chemistry and led to the increase in PM2.5 concentrations (Le et al., 2020; Huang et al., 2021). Also, due to the low surface temperature in winter, the increased temperature may lead to the formation of an inversion layer, resulting in PM2.5 accumulation (Xu T. et al., 2019). During the ACO period, the high temperature in summer not only enhanced the atmospheric convection to accelerate the diffusion of PM2.5 (Yang et al., 2016), but also made the loss of volatile components in PM2.5 (Wang et al., 2006; Chuang et al., 2017). Combined with the washing effect of frequent precipitation (Wang X. et al., 2018), PM2.5 concentrations dropped by 51.5%.
During the CCO, BCO, COB and ACO periods, the hourly mean concentrations of O3 were 57.9 ± 40.8, 20.6 ± 22.8, 56.6 ± 30.2 and 103.5 ± 59.3 μg/m3, respectively. O3 concentrations increased by 174.8% during the outbreak relative to the pre-lockdown period, which might be influenced by the reduced NO2 that weakened the NO titration effect and lowered O3 utilization (Le et al., 2020; Nichol et al., 2020; Shab et al., 2020). Restrictions on vehicles during the epidemic closure have led to a significant reduction in NOx emissions, especially in the central cities (Supplementary Figure S2). At the same time, the increased use of disinfection and cleaning products during the prevention and control period has led to an increase in the precursor of ozone, namely VOCs, which may also cause a significant increase in ozone concentration. The maximum daily 8-h average (MDA8) O3 concentrations were used to assess the severity of ozone pollution, with polluted days having MDA8 O3 concentrations greater than 160 μg/m3, and moderately polluted days having MDA8 O3 concentrations greater than 215 μg/m3. Then, a day is deemed to be extremely polluted if the MDA8 O3 surpasses 265 μg/m3. O3 concentrations continuously increased as the epidemic progressed, with the number of polluted days growing from none in BCO and COB periods to 37 days during the ACO period. Moderately polluted days accounted for 11.8% in this period. May 1st was an extremely polluted day with a MDA8 O3 concentration of 294.9 μg/m3, which was 1.8 times the standard value. A six-day-long ozone pollution process occurred from June 18 to June 23, with MDA8 O3 concentrations 1.1–1.4 times the standard. There was a significant positive correlation between O3 and T (r = 0.68), and this pollution process corresponds to high temperatures, with an average of 28.5°C.
3.1.2 Profiles of water-soluble inorganic ions (WSIIs) in PM2.5
WSIIs are the dominant component of PM2.5, accounting for 20–77% of the total PM2.5 (Sun et al., 2019), comprised of NO3−, SO42-, NH4+, Cl−, K+, Ca2+, Na+, Mg2+, and often increased rapidly during the haze event in Beijing (Xu Q. et al., 2019). The characteristics of WSIIs in PM2.5 during four periods are shown in Figure 4. The ions that accounted for a significantly large part include NO3−, SO42- and NH4+, which constituted secondary inorganic aerosol (SIA), accounting for 77.8%, 88.2%, 76.0% and 93.9% during CCO, BCO, COB and ACO, respectively. NO3− always played an important role in PM2.5, with proportions of 39.3%, 41.8%, 30.6% and 38.4% during the four periods, which indicates that motor vehicles might be the important sources of PM2.5 (Ahmad et al., 2020). The decreased proportion of NO3− during the COB period reflects the PM2.5 emission reduction of mobile sources during the COVID-19 lockdown. The percentage of NO3− increased during the ACO period as the blockade was relaxed and vehicle activity resumed. SO42- increased during the outbreak compared to the pre-outbreak period and the reference period in 2019, presumably due to increased demand for coal for heating as people stayed in their homes during the lockdown (Sulaymon et al., 2021). NO3−/SO42- is often used to determine what kind of source pollution is dominant in cities, with values greater than 1, mobile sources have a larger impact, and vice versa, stationary sources have a larger impact (Kong et al., 2021). The ratio of NO3−/SO42- was 2.1, 2.0, 1.6 and 1.3 during four periods. This illustrates that the mobile sources played a more important role than stationary sources in Beijing. The relatively lower value of NO3−/SO42- in COB and ACO periods reflected that the impact of mobile source abatement is greater than that of stationary source abatement. Other WSIIs (Cl−, K+, Ca2+, Na+, Mg2+) accounted for less with a total proportion lower than 24.0%. Ca2+ mainly comes from road dust and construction dust (Xiong et al., 2021). The concentration of Ca2+ decreased in the COB period by 67.9% and picked up in the ACO period, which was also associated with the lockdown.
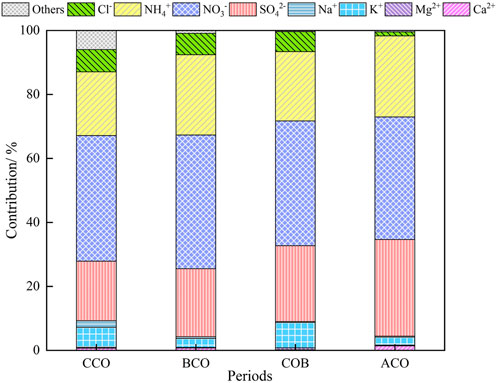
FIGURE 4. Contribution of identified components of PM2.5 in Beijing during the CCO, BCO, COB and ACO periods.
3.2 Backward trajectory analysis and cluster analysis
3.2.1 The impact of release height in the HYSPLIT model
The results of backward trajectory and cluster analysis at 500 m were slightly different from the results at 100 m (Supplementary Figure S3, Supplementary Table S1). The clusters calculated at 500 m release height were longer than that at 100 m. This reflected that the trajectories that started higher above ground tended to move faster and went back farther than those that started at lower heights, which was consistent with previous studies (Gebhart et al., 2005). In addition, the number of clusters in the COB and ACO period was less than that of 100 m. However, the coming direction of the clusters did not alter significantly, also the dominant clusters and the ranking of clusters by proportion remained the same as at 100 m. In general, the release height had little influences on the trajectory and cluster analysis. The changes in clusters number and percentage may be caused by the chosen Eulerian clustering method, for the Eulerian method clusters trajectories by velocity and direction, while the velocity of trajectories at 100 and 500 m differed.
We also conducted PSCF and CWT analysis at the release height of 500 m AGL (Supplementary Figure S4 and S5) to clarify the impact, and found that the distribution of potential source regions was very similar, like the results of previous studies (Zhu et al., 2011; Fang et al., 2018). Due to the longer retracing distance of the partial backward trajectory at 500 m altitude, the WPSCF and WCWT maps were larger at the release height of 500 m than that of 100 m, which may be helpful to identify more source areas. However, considering that a height of 100 m is the layer we are more concerned about, which is more reflective of the ground situations. In addition, the abnormally shallow planetary boundary layer heights (PBLH) during the epidemic may bring uncertainty to the simulation results at 500 m (Su et al., 2020), therefore, this paper focused on the case of a release height of 100 m.
3.2.2 Backward trajectory analysis and cluster analysis
In this study, the Grade II AAQS (75 μg/m3) was used to distinguish polluted and clean trajectories of PM2.5, while the hourly mean concentrations were regarded as the threshold of O3, with the value of 57.8 μg/m3, 20.5 μg/m3, 56.5 μg/m3, 103.3 μg/m3 for CCO, BCO, COB, ACO period, respectively. Figure 5 depicts the calculated backward trajectories arriving in Beijing during the four periods, as well as the main clusters. Statistical characteristics are shown in Table 2.
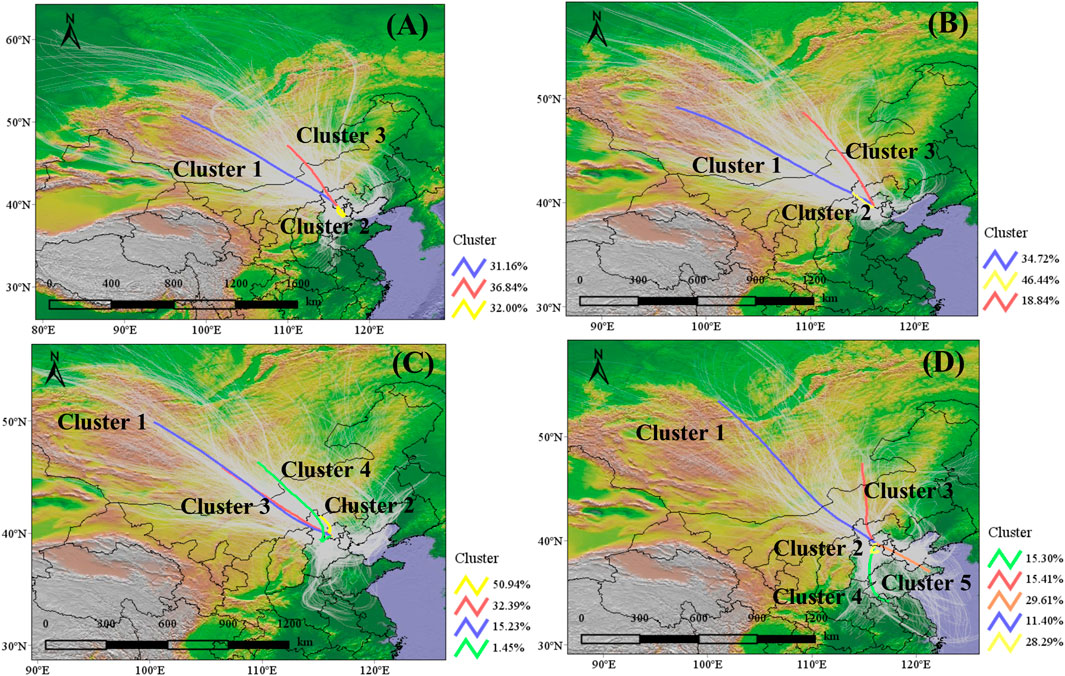
FIGURE 5. Cluster-mean back-trajectories by using the HYSPLIT model in Beijing at 100 m AGL during the CCO (A), BCO (B), COB (C) and ACO (D) periods.
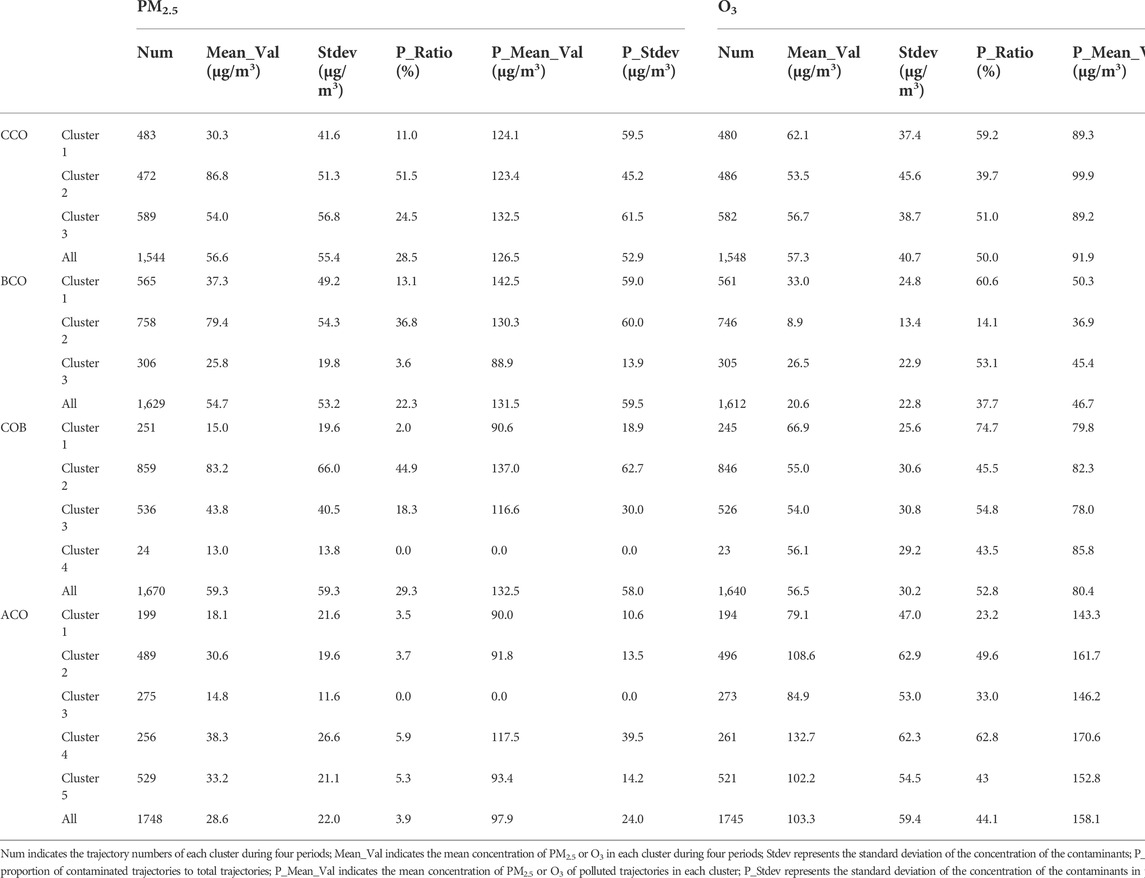
TABLE 2. Statistical characteristics of clustered trajectories at 100 m AGL during four periods.
Overall, 1,632, 1,656, 1,656 and 1824 backward trajectories were clustered into 3, 3, 4 and 5 clusters during the CCO, BCO, COB and ACO period, respectively, whose characteristics in each period coincided with the monsoon climate of Beijing. Since the CCO, BCO and COB period were closer to the winter season, influenced by the strong Siberian cold current, with the strong northwest winds prevailed, so the clusters originating from the northwest accounted for more than 68%. In contrast, the ACO period is in summer, when Beijing is under the Pacific subtropical high pressure with prevailing southeast winds. The distribution of clusters in this period was relatively scattered, and cluster 5 originating from the Yellow Sea and reaching Beijing via Shandong and southeastern Hebei was getting the upper hand by 29.61%. The proportion of the longest Cluster 1, which passed through western Mongolia, Central Inner Mongolia and Northwestern Hebei Province, dropped from 34.7% in the BCO period to 11.4% in the ACO period as the season changed. While the shortest Cluster 2 occupied a large proportion of 28.3%–50.9% though reached Beijing via various cities in Hebei province during different periods. It was a circular cluster covering Langfang located in the south of Beijing in the CCO period, but originated from Zhangjiakou in BCO and COB period. This reflected the great contributions of the short-range transport from regions around Beijing. Trajectories belonging to Cluster 2 increased by 4.5% in the COB period compared to the BCO period, which may be influenced by the difference in WD and WS. Before the outbreak, Cluster 2 was coming from the WNW direction accounting for only 4.8%, with a mean WS of 1.8 m/s. While Cluster 2 came from the NNW direction accounting for 20%, with a mean WS of 2.7 m/s during the outbreak.
The PM2.5 carried by different clusters during the four periods showed a similar pattern that a small amount of PM2.5 attached to those long clusters, while short clusters carried more PM2.5. Because the short clusters reflected stable meteorological conditions (low wind speed, weak diffusion and dilution effect) (Chen et al., 2018), and passed through areas with advanced industries located in Hebei and Shandong province, which were conducive to the transport of pollutants towards Beijing. Meanwhile, the airflows in the long clusters moved quickly and passed through cleaner areas, bringing less pollution to Beijing and facilitating pollution dispersion. Cluster 2 was polluted clusters in the CCO, BCO and COB period, with the mean concentrations of 86.6 ± 51.3, 79.4 ± 54.3 and 83.2 ± 66.0 μg/m3, respectively. Compared to the BCO period, the average PM2.5 concentrations and the number of contaminated trajectories contained in the contaminated Cluster 2 increased slightly during the outbreak. However, according to the 2019 and 2020 MEIC emissions inventory map (Supplementary Figure S6), primary emissions of PM2.5 in Zhangjiakou decreased during February and March 2020 compared to November and December 2019, leading to the assumption that secondary PM production in Zhangjiakou was transported to Beijing with the air mass during the outbreak (Huang et al., 2021). Compared to the CCO, BCO and COB period, the concentration of PM2.5 in each cluster was significantly lower during the ACO period, which could be attributed to the lush vegetation and adequate rainfall in summer. In particular, plant leaves can efficiently absorb and remove air pollution particles, and rainfall has a large effect on pollutant removal, which can speed up the particle sedimentation process under the combined actions (McDonald et al., 2007). According to cluster analysis of WSIIs (Supplementary Table S2), NO3− showed the same trend as NH4+, with the highest concentration occurred in Cluster 2. In contrast, the characteristics of SO42- varied in four periods. Especially for Cluster 3, originated from central Mongolia, passed through central Inner Mongolia and northwestern Hebei Province, resulting in more SO42- during the BCO and COB periods.
The situation of O3 was the opposite. The clusters carrying more PM2.5 tended to have a lower O3 concentration, and the clusters with less PM2.5 had a higher concentration of O3. The long Cluster 1 originating in western Mongolia carried more O3 than other clusters during the CCO, BCO and COB period, but was still far below the limited value specified in the AAQS, with concentrations of 62.1 ± 37.4, 33.0 ± 24.8, 66.9 ± 25.6 μg/m3, respectively. After the COVID-19 outbreak, the concentration of O3 in each cluster was significantly higher compared to the previous periods, which may be caused by the high temperatures and intense ultraviolet irradiation in summer.
3.3 Potential source regions identification during four periods
The clustering analysis could only reveal the major direction of airflows, therefore we performed PSCF and CWT analysis to further determine the distribution of potential source areas contributions (Fan et al., 2019; Fang et al., 2021). The WPSCF results of PM2.5 and O3 during four periods were represented in Figure 6 (A-D) and Figure 6 (E-H), respectively, as well as the WCWT map represented in Figure 7 (A-D) and Figure 7 (E-H).
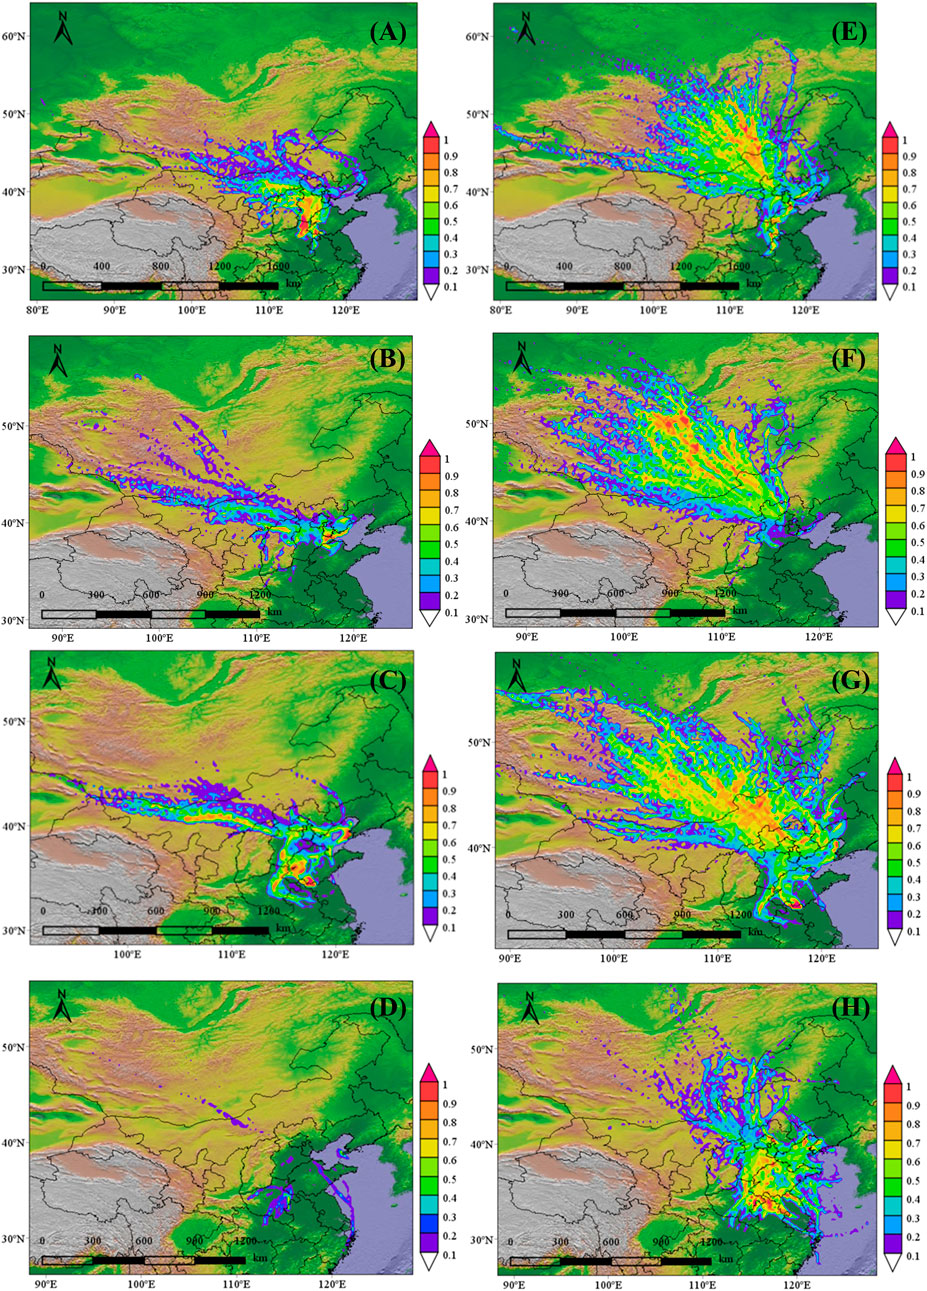
FIGURE 6. WPSCF maps for PM2.5 (A–D) and O3 (E–H) arriving in Beijing at 100 m AGL during the four periods. (A) and (E) showed the situation during the CCO period; (B) and (F) showed the situation during the BCO period; (C) and (G) showed the situation during the COB period; (D) and (F) showed the situation during the ACO period.
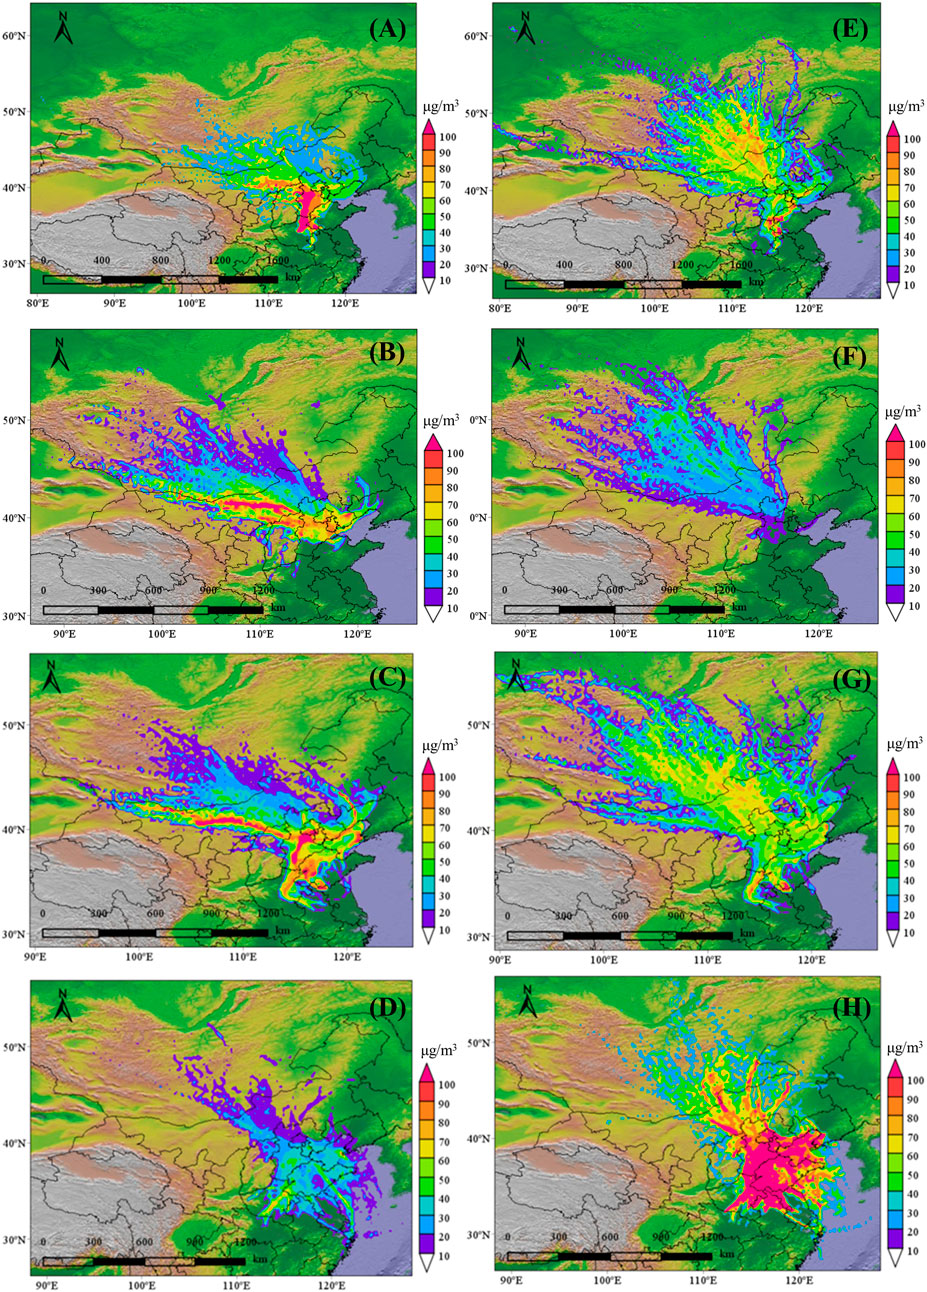
FIGURE 7. WCWT maps for PM2 5 (A–D) and O3 (E–H) arriving in Beijing at 100 m AGL during the four periods. (A) and (E) showed the situation during the CCO period; (B) and (F) showed the situation during the BCO period; (C) and (G) showed the situation during the COB period; (D) and (F) showed the situation during the ACO period.
For PM2.5, significant potential source areas with high WPSCF values (>0.7) can be observed in the CCO and COB period, reflecting the important contribution of regional transport to heavy pollution episodes. Moreover, these areas overlapped highly with the high emission areas shown on the MEIC inventory map (Supplementary Figure S6). PM2.5 emissions are concentrated in the economically developed and densely populated areas east of the Heihe-Tengchong line. And in North China, especially in Hebei, Shandong, Henan and Shanxi province, the majority of PM2.5 emissions are contributed by the industrial sector (Fang and Yu, 2021). High emission areas in the BTH region are concentrated in the south and southeast, including the central urban areas of Beijing and Tianjin, as well as Langfang, Baoding, Shijiazhuang, Xingtai and Handan in Hebei Province. More PM2.5 emissions in winter than in summer due to residential coal-fired heating. During the CCO period, the majority of potential source areas were located in the southwestern provinces with dense industrial facilities, high energy consumption and air pollutant emissions (Zhang et al., 2018; Zheng et al., 2019), including the central and southern Hebei province, the southwestern Shandong province, and the northern Henan province, with the WCWT value exceeding 100 μg/m3. Accordingly, the monthly PM2.5 emissions in these places were higher than 200 t from January to March 2019. Some regions of southwestern Inner Mongolia and northern Shanxi also contributed to PM2.5 in Beijing with WCWT values higher than 80 μg/m3 and emissions higher than 100 t. This indicating that primary PM2.5 emissions from those areas contributed significantly to Beijing by short-range transmission. The distribution of potential source areas in the COB period was remarkably similar to that of the CCO period. Southwestern Shandong province, central and southern Hebei province were still important potential source regions, while the scope has shrunk and the contribution has diminished. This reflected the obvious impact of emission reduction caused by the COVID-19 lockdown, which was further confirmed by the significant reduction of PM2.5 emissions in these regions observed on the MEIC inventory map from January to March 2020. Additionally, a northwest-southeast oriented strip area extending from western Inner Mongolia to central Shanxi was also the potential source region with WCWT higher than 100 μg/m3. Considering that emissions in this area did not differ significantly between CCO and BCO periods, the secondary PM2.5 generated under high humidity contributed to PM2.5 accumulation and occurrence of heavy pollution episodes in Beijing through long-distance transport. A dust storm lasting about 12 h with wind force 6-7 on 18 March 2020 under the influence of a Mongolian cyclone was reported, which also contributed to the higher WCWT values in the pathway area.
From the WPSCF and WCWT map of WSIIs (Supplementary Figure S7 and S8), the distribution of potential source areas of NO3− and NH4+ showed a similar pattern. Southern Hebei Province, western Shandong Province, and northeastern Henan Province were potential source areas for them with WPSCF greater than 0.7 during CCO and COB periods. Compared to the CCO period, the belt region from western Inner Mongolia to northern Shanxi Province, and western Hebei Province was also the potential source area of NO3− and NH4+ in the COB period. Although the distribution of potential source areas was extremely similar, the contribution differed greatly. In the CCO period, the WCWT values of NH4+ in southern Hebei Province, western Shandong Province, and northeastern Henan Province reached higher than 18 μg/m3. The distribution of the potential source area of SO42- varied widely among the four periods. During the CCO period, the potential source area was mainly distributed in southern Henan province and western Shandong province, and mainly distributed along the landward side of Bohai Bay during the BCO period.
Compared to PM2.5, the distribution of potential source areas for O3 was more dispersed and widespread. Central Mongolia and central Inner Mongolia were the potential areas of O3 during the CCO, BCO and COB period, with the WPSCF value higher than 0.7. This indicated that long-range transport exerted crucial effects on local O3 accumulation. However, it is also possible that the high extremes in the grids far from the study area are caused by the low number of trajectories and the short total dwell time, despite the introduction of the Wij (Wei et al., 2020). Over time, the main extent of the potential source area is gradually moving in a northwest-southeast direction toward Beijing, and the northern Hebei province and Beijing itself had become potential source areas by the time of the COVID-19 outbreak. Therefore, in addition to long-range transport from Mongolia, short-range transport and local generation were also important causes of O3 accumulation in this period. The potential source areas expanded significantly after the COVID-19 outbreak, centered in the BTH region and Shandong province with a radial dispersion in all directions, and covered the Henan, Anhui, Jiangsu, Shanxi province. This was highly consistent with the spatial distribution of NOx emissions, the important precursor of O3 (Supplementary Figure S2). The WCWT values of the northern Henan and the northern Anhui were already well above 100 μg/m3. And in the border area of Shandong, Henan and Anhui provinces, the WCWT values were greater than 160 μg/m3 (Figure S9). WCWT values in southeastern Shandong and northeastern Henan province, the potential source areas during the COB period, increased from 80 to 100 μg/m3 to 120–160 μg/m3. It is worth mentioning that WCWT values were notably higher in the Bohai Bay region, which may be caused by the pollutants transported from their adjacent sea areas through the sea-land winds (Wang et al., 2022). Additionally, the PSCF and CWT model adopt the same treatment for air masses at various locations (e.g., urban, suburban, rural, forest, and ocean areas), that is the contributions of unit emission from each grid cell along a trajectory are equally weighted in calculating the mole fraction at the receptor sites (Fang et al., 2018), which may cause the overestimation in the contributions from remote areas such as ocean and Mongolia. The considerable difference of potential source areas between ACO and COB period could be explained by the seasonality or the changes in precursors emissions caused by the epidemic. To further confirm the dominant influence factors, a comparison analysis was conducted between the ACO periods and the reference period in the summer of 2019 (Supplementary Figure S9). The mean MDA8 O3 concentration in the summer of 2019 was 182.5 ± 55.9 μg/m3, 17.1% higher than that during the ACO period. Under the similar meteorological conditions (Supplementary Table S3), the incoming direction and proportion of the backward trajectories were also very similar in these two periods. And the potential source areas identified by PSCF and CWT methods were all with the high NOx emission. This suggested that seasonality dominated the increased O3 concentrations and the expansion of potential source areas during the ACO period. However, the contribution of potential source areas varied considerably. Compared to the reference period in 2019, the decreased WCWT values were observed in southwestern Beijing, southeastern Hebei, western and central Shandong, northern Henan, northeastern Shanxi, and so on. WCWT values in the potential source area south of Beijing decreased substantially, from higher than 160 μg/m3 in the summer of 2019 to below 140 μg/m3 during the ACO period. This suggested that the impact of the epidemic was equally important.
3.4 Potential source region identification during heavy pollution episodes
Cluster analysis, PSCF and CWT methods were conducted to identify the potential source area of PM2.5 during heavy pollution episodes in the CCO (Figure 8) and COB period (Figure 9).
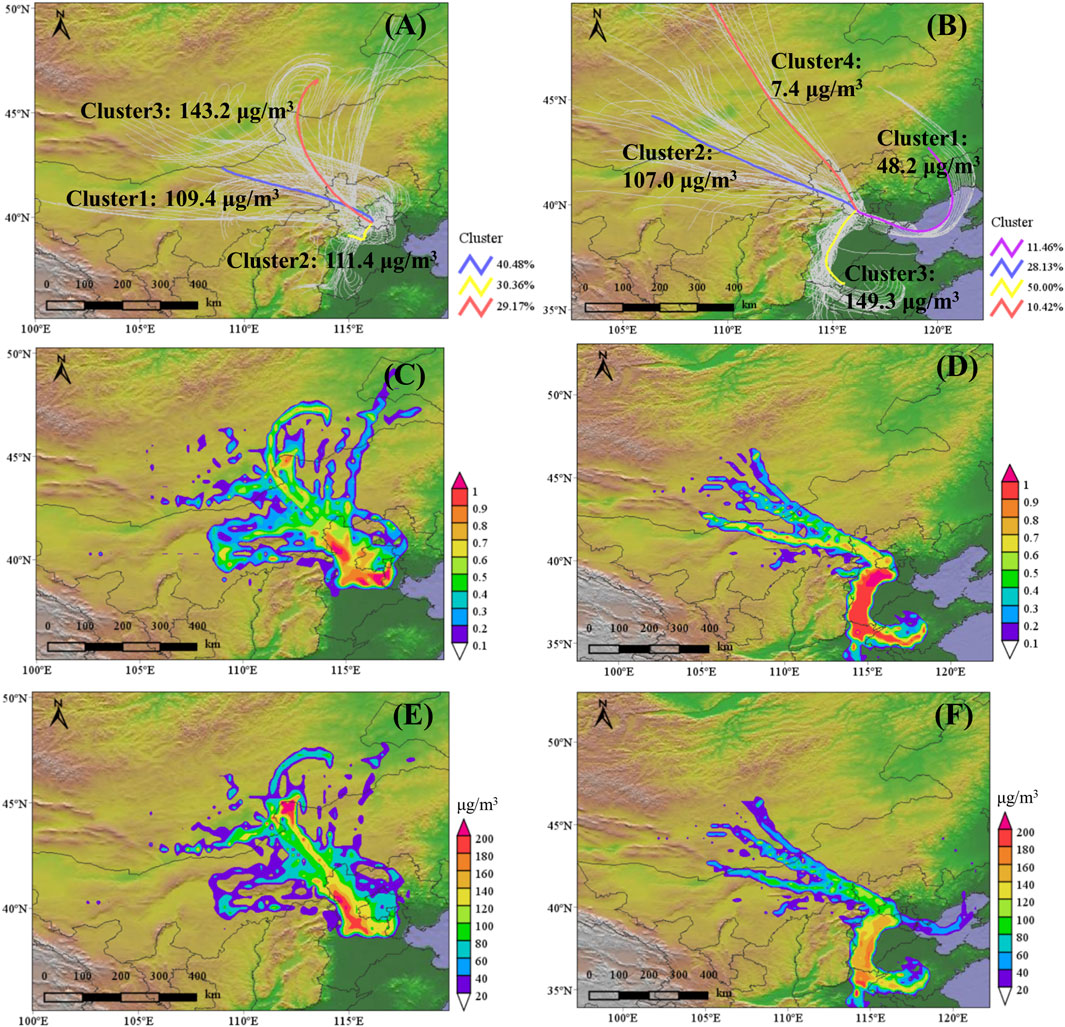
FIGURE 8. Cluster-mean back-trajectories (A,B), WPSCF maps (C,D) and WCWT maps (E,F) of PM2.5, during the CCO I episode (A,C,E) and CCO II episode (B,D,F).
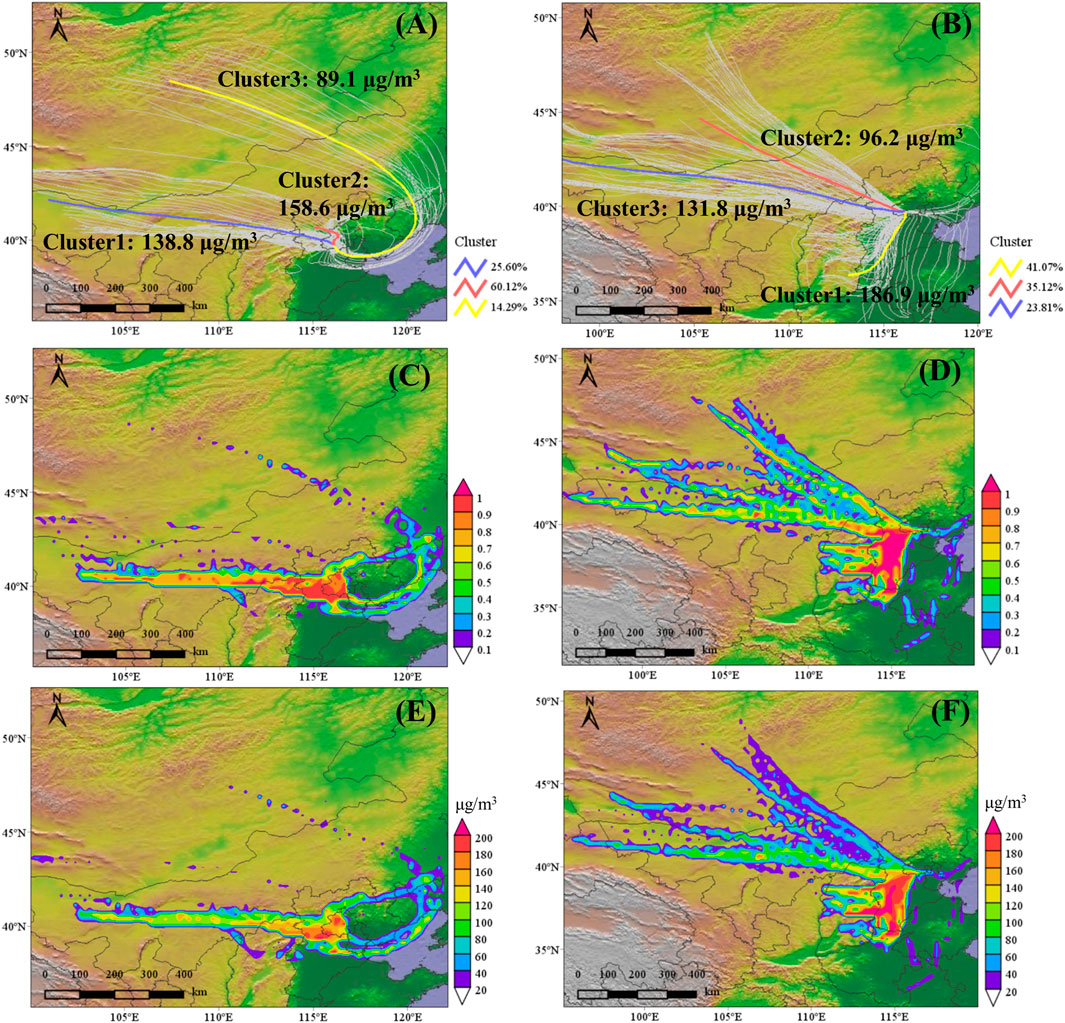
FIGURE 9. Cluster-mean back-trajectories (A,B), WPSCF maps (C,D) and WCWT maps (E,F) of PM2.5 during the COB I episode (A,C,E) and COB II episode (B,D,F).
Three and four clusters were calculated in the CCO I and II episode, respectively. During the CCO I episode, Cluster 1 originated from north-central Inner Mongolia, and reached Beijing through the northwestern Hebei Province, with the dominant concentration of 109.4 ± 76.6 μg/m3. During the CCO II episode, the dominant Cluster 3 passed through Liaocheng, a city in southwestern Shandong Province, accounting for 50.0% of total clusters, with PM2.5 concentration of 149.3 ± 41.6 μg/m3. The potential source areas with WPSCF >0.7 and WCWT >200 μg/m3 were mainly located in cities surrounding southwestern Beijing, like Zhangjiakou, Baoding and Langfang in Hebei province, as well as the western Tianjin during the CCO I episode. In addition, the Xilin Gol league in central Inner Mongolia was also an important potential source area, which contributed a lot to PM2.5 in Beijing with the WCWT higher than 180 μg/m3. The potential source areas in the CCO II episode were mainly located in Baoding, Shijiazhuang, Xingtai, and Handan, with WCWT higher than 140 μg/m3. Heze, Jining, Zaozhuang, and Linyi located in southwestern Shandong province were also important potential source areas, with WPSCF higher than 0.8.
Compared with the two heavy pollution episodes in the CCO period, the concentrations of PM2.5 in the dominant cluster were higher and the contributions of regional transport were greater during the COVID-19 outbreak. Three clusters were calculated in both COB I and II episode, with the direction varying considerably. The dominant Cluster 2 in the COB I episode passed through Zhangjiakou, with the PM2.5 concentration of 158.6 ± 84.6 μg/m3. While the concentration of PM2.5 in the dominant Cluster 1 originating from southeastern Shanxi province was 186.9 ± 42.9 μg/m3 during COB II episode. The distribution of potential source areas for the two heavy pollution episodes was quite different. During the COB I episode, the WPSCF values were higher in the belt region from western Inner Mongolia to northern Shanxi province, and western Hebei province. The WCWT values were getting higher as the trajectory transported, and they were already greater than 180 μg/m3 by the time it arrived in western Hebei province. What’s more, local emissions in western Beijing also contributed significantly during this episode, with the WCWT values higher than 140 μg/m3. The potential source areas during the COB II episode were mainly located in the southwest of Hebei province and the border areas of Hebei, Shanxi and Henan province, with the WCWT values higher than 200 μg/m3.
4 Conclusion
In this study, urban comprehensive analysis was conducted in Beijing during four different periods to identify the variations in pollution levels, chemical components, air mass trajectory and potential source areas contributions of PM2.5 and O3.
Despite the significant reduction in anthropogenic emissions during the outbreak, the average concentration of PM2.5 increased by 8.2% and 1.0% compared to that of the BCO and CCO period affected by the high humidity. A considerable decrease in NO3− reflected the impact of significant reductions in PM2.5 emissions from motor vehicles caused by the lockdown. Opposite to PM2.5, the O3 concentration showed an incremental pattern, and an exceedance phenomenon was observed after the outbreak, influenced by high temperatures and intense ultraviolet irradiation.
Different simulation starting heights have less influence on the results of backward trajectory clustering analysis, PSCF and CWT analysis. Due to the high speed, the calculated reverse trajectory at high altitude is usually longer, and the obtained PSCF and CWT maps also have a relatively large range, but may be influenced by PBLH. From the backward trajectory and cluster analysis, proximity transport from the surrounding areas of Beijing was always the main external source of local pollutant accumulation. The contribution of long-range transport influenced by the Siberian cold current decreased with seasonal changes, but the contribution of a sandstorm from the Inner Mongolia desert remained significant especially in spring. Short clusters from the southeast tend to carry more PM2.5 compared to long clusters from the northwest and pass through the area with heavy industry, while long-range transport from the northwest is thought to contribute more to O3 accumulation in Beijing.
Source areas identified by PSCF and CWT overlapped highly with high emission areas in the maps. The potential source area of PM2.5 expanded in the COB period, from central and southern Hebei, southwestern Shandong, and northern Henan province during the COB period to an extending belt region from western Inner Mongolia to Beijing. While the contribution of some potential source areas with heavy industries decreased, which reflected the effect of emission reductions during the lockdown. Compared to PM2.5, the potential source area of O3 was more dispersed, whose contributions to O3 in Beijing were not significant until the ACO period. This was largely dominated by seasonality, but the lower contribution of potential source areas compared to the reference period in summer of 2019 also indicated the non-negligible impact of the COVID-19 outbreak. The distribution of potential source areas in heavy pollution events during the CCO and COB period was different. Both proximity transport from Hebei province and remote transport from Inner Mongolia Plateau played important roles in PM2.5 accumulation in Beijing during the outbreak.
Data availability statement
The original contributions presented in the study are included in the article/Supplementary Material, further inquiries can be directed to the corresponding author.
Author contributions
HZ: Conceptualization, Methodology, Resources, Writing - original draft, Writing - review and editing, Formal analysis, Visualization. XW: Investigation, Writing - original draft, Formal analysis, Visualization. XS: Resources, Supervision, Project administration. XL: Data curation, Supervision. BW: Methodology, Data curation. WC: Methodology, Data curation. ZY: Conceptualization, Methodology, Resources, Writing - review and editing, Supervision, Project administration, Funding acquisition.
Funding
This work was supported by the Beijing Natural Science Foundation (JQ19030) and the Research Foundation for Youth Scholars of Beijing Technology and Business University (QNJJ 2021–32). The authors are grateful to the anonymous reviewers for their insightful comments.
Conflict of interest
The authors declare that the research was conducted in the absence of any commercial or financial relationships that could be construed as a potential conflict of interest.
Publisher’s note
All claims expressed in this article are solely those of the authors and do not necessarily represent those of their affiliated organizations, or those of the publisher, the editors and the reviewers. Any product that may be evaluated in this article, or claim that may be made by its manufacturer, is not guaranteed or endorsed by the publisher.
Supplementary material
The Supplementary Material for this article can be found online at: https://www.frontiersin.org/articles/10.3389/fenvs.2022.982566/full#supplementary-material
References
Ahmad, M., Cheng, S., Yu, Q., Qin, W., Zhang, Y., and Chen, J. (2020). Chemical and source characterization of PM2.5 in summertime in severely polluted Lahore, Pakistan. Atmos. Res. 234, 104715. doi:10.1016/j.atmosres.2019.104715
An, Z., Huang, R.-J., Zhang, R., Tie, X., Li, G., and Cao, J. (2019). Severe haze in northern China: A synergy of anthropogenic emissions and atmospheric processes. Proc. Natl. Acad. Sci. 116, 8657–8666. doi:10.1073/pnas.1900125116
Cao, X., Tian, Y., Shen, Y., Wu, T., Li, R., Liu, X., et al. (2021). Emission variations of primary air pollutants from highway vehicles and implications during the COVID-19 pandemic in beijing, China. Int. J. Environ. Res. Public. Health 18, 4019. doi:10.3390/ijerph18084019
Chauhan, A., and Singh, R. P. (2020). Decline in PM2.5 concentrations over major cities around the world associated with COVID-19. Environ. Res. 187, 109634. doi:10.1016/j.envres.2020.109634
Chen, Y., Xie, S., and Luo, B. (2018). Seasonal variations of transport pathways and potential sources of PM2.5 in Chengdu, China (2012-2013). Front. Environ. Sci. Eng. 12, 12. doi:10.1007/s11783-018-1009-z
Chuang, M.-T., Chou, C. C.-K., Lin, N.-H., Takami, A., Hsiao, T.-C., Lin, T.-H., et al. (2017). A simulation study on PM2.5 sources and meteorological characteristics at the northern tip of taiwan in the early stage of the asian haze period. Aerosol Air Qual. Res. 17, 3166–3178. doi:10.4209/aaqr.2017.05.0185
dos Santos, O. N., and Hoinaski, L. (2021). Incorporating gridded concentration data in air pollution back trajectories analysis for source identification. Atmos. Res. 263, 105820. doi:10.1016/j.atmosres.2021.105820
Draxler, R. R., and Hess, G. D. (1998). An overview of the HYSPLIT_4 modelling system for trajectories. Aust. Meteorol. Mag. 47. Available at: http://www.researchgate.net/publication/239061109_An_overview_of_the_HYSPLIT_4_modelling_system_for_trajectories (Accessed June 21, 2022).
Fan, H., Zhao, C., and Yang, Y. (2020). A comprehensive analysis of the spatio-temporal variation of urban air pollution in China during 2014-2018. Atmos. Environ. 220, 117066. doi:10.1016/j.atmosenv.2019.117066
Fan, W., Qin, K., Xu, J., Yuan, L., Li, D., Jin, Z., et al. (2019). Aerosol vertical distribution and sources estimation at a site of the Yangtze River Delta region of China. Atmos. Res. 217, 128–136. doi:10.1016/j.atmosres.2018.11.002
Fang, C., Wang, L., Li, Z., and Wang, J. (2021). Spatial characteristics and regional transmission analysis of PM2.5 pollution in northeast China, 2016-2020. Int. J. Environ. Res. Public. Health 18, 12483. doi:10.3390/ijerph182312483
Fang, D., and Yu, B. (2021). Driving mechanism and decoupling effect of PM2.5 emissions: Empirical evidence from China’s industrial sector. Energy Policy 149, 112017. doi:10.1016/j.enpol.2020.112017
Fang, X., Saito, T., Park, S., Li, S., Yokouchi, Y., and Prinn, R. G. (2018). Performance of back-trajectory statistical methods and inverse modeling method in locating emission sources. Acs Earth Space Chem. 2, 843–851. doi:10.1021/acsearthspacechem.8b00062
Feng, Y., Ning, M., Lei, Y., Sun, Y., Liu, W., and Wang, J. (2019). Defending blue sky in China: Effectiveness of the “air pollution prevention and control action plan” on air quality improvements from 2013 to 2017. J. Environ. Manage. 252, 109603. doi:10.1016/j.jenvman.2019.109603
Gao, H., Wang, J., Li, T., and Fang, C. (2021). Analysis of air quality changes and influencing factors in Changchun during the COVID-19 pandemic in 2020. Aerosol Air Qual. Res. 21, 210055. doi:10.4209/aaqr.210055
Gebhart, K. A., Schichtel, B. A., and Barna, M. G. (2005). Directional biases in back trajectories caused by model and input data. J. Air Waste Manag. Assoc. 55, 1649–1662. doi:10.1080/10473289.2005.10464758
Geng, G., Xiao, Q., Zheng, Y., Tong, D., Zhang, Y., Zhang, X., et al. (2019). Impact of China’s air pollution prevention and control action plan on PM2.5 chemical composition over eastern China. Sci. China-Earth Sci. 62, 1872–1884. doi:10.1007/s11430-018-9353-x
Huang, X., Ding, A., Gao, J., Zheng, B., Zhou, D., Qi, X., et al. (2021). Enhanced secondary pollution offset reduction of primary emissions during COVID-19 lockdown in China. Natl. Sci. Rev. 8, nwaa137. doi:10.1093/nsr/nwaa137
Hui, L., Liu, X., Tan, Q., Feng, M., An, J., Qu, Y., et al. (2019). VOC characteristics, sources and contributions to SOA formation during haze events in Wuhan, Central China. Sci. Total Environ. 650, 2624–2639. doi:10.1016/j.scitotenv.2018.10.029
Kong, L., Tan, Q., Feng, M., Qu, Y., An, J., Liu, X., et al. (2021). Investigating the characteristics and source analyses of PM2.5 seasonal variations in Chengdu, Southwest China (vol 243, 125267, 2020). Chemosphere 266, 128990. doi:10.1016/j.chemosphere.2020.128990
Le, T., Wang, Y., Liu, L., Yang, J., Yung, Y. L., Li, G., et al. (2020). Unexpected air pollution with marked emission reductions during the COVID-19 outbreak in China. Science 369, 702. doi:10.1126/science.abb7431
Lei, R., Zhu, F., Cheng, H., Liu, J., Shen, C., Zhang, C., et al. (2019). Short-term effect of PM2.5/O-3 on non-accidental and respiratory deaths in highly polluted area of China. Atmos. Pollut. Res. 10, 1412–1419. doi:10.1016/j.apr.2019.03.013
Li, D., Liu, J., Zhang, J., Gui, H., Du, P., Yu, T., et al. (2017a). Identification of long-range transport pathways and potential sources of PM2.5 and PM10 in Beijing from 2014 to 2015. J. Environ. Sci. 56, 214–229. doi:10.1016/j.jes.2016.06.035
Li, H., He, Q., and Liu, X. (2020a). Identification of long-range transport pathways and potential source regions of PM2.5 and PM10 at akedala station, central asia. Atmosphere 11, 1183. doi:10.3390/atmos11111183
Li, K., Jacob, D. J., Liao, H., Zhu, J., Shah, V., Shen, L., et al. (2019). A two-pollutant strategy for improving ozone and particulate air quality in China. Nat. Geosci. 12, 906. doi:10.1038/s41561-019-0464-x
Li, L., Yan, D., Xu, S., Huang, M., Wang, X., and Xie, S. (2017b). Characteristics and source distribution of air pollution in winter in Qingdao, eastern China. Environ. Pollut. 224, 44–53. doi:10.1016/j.envpol.2016.12.037
Li, W., Shao, L., Wang, W., Li, H., Wang, X., Li, Y., et al. (2020b). Air quality improvement in response to intensified control strategies in Beijing during 2013-2019. Sci. Total Environ. 744, 140776. doi:10.1016/j.scitotenv.2020.140776
Liu, C., Huang, Z., Huang, J., Liang, C., Ding, L., Lian, X., et al. (2022). Comparison of PM2.5 and CO2 concentrations in large cities of China during the COVID-19 lockdown. Adv. Atmos. Sci. 39, 861–875. doi:10.1007/s00376-021-1281-x
Liu, F., Page, A., Strode, S. A., Yoshida, Y., Choi, S., Zheng, B., et al. (2020a). Abrupt decline in tropospheric nitrogen dioxide over China after the outbreak of COVID-19. Sci. Adv. 6, eabc2992. doi:10.1126/sciadv.abc2992
Liu, Y., Song, M., Liu, X., Zhang, Y., Hui, L., Kong, L., et al. (2020b). Characterization and sources of volatile organic compounds (VOCs) and their related changes during ozone pollution days in 2016 in Beijing, China. Environ. Pollut. 257, 113599. doi:10.1016/j.envpol.2019.113599
Liu, Y., Yu, Y., Liu, M., Lu, M., Ge, R., Li, S., et al. (2018). Characterization and source identification of PM2.5-bound polycyclic aromatic hydrocarbons (PAHs) in different seasons from Shanghai, China. Sci. Total Environ. 644, 725–735. doi:10.1016/j.scitotenv.2018.07.049
Ma, T., Duan, F., Ma, Y., Zhang, Q., Xu, Y., Li, W., et al. (2022). Unbalanced emission reductions and adverse meteorological conditions facilitate the formation of secondary pollutants during the COVID-19 lockdown in Beijing. Sci. Total Environ. 838, 155970. doi:10.1016/j.scitotenv.2022.155970
Mahato, S., Pal, S., and Ghosh, K. G. (2020). Effect of lockdown amid COVID-19 pandemic on air quality of the megacity Delhi, India. Sci. Total Environ. 730, 139086. doi:10.1016/j.scitotenv.2020.139086
McDonald, A. G., Bealey, W. J., Fowler, D., Dragosits, U., Skiba, U., Smith, R. I., et al. (2007). Quantifying the effect of urban tree planting on concentrations and depositions of PM10 in two UK conurbations. Atmos. Environ. 41, 8455–8467. doi:10.1016/j.atmosenv.2007.07.025
Nichol, J. E., Bilal, M., Ali, M. A., and Qiu, Z. (2020). Air pollution scenario over China during COVID-19. Remote Sens. 12, 2100. doi:10.3390/rs12132100
Shab, C., Qya, B., Xtabd, E., Yza, F., Min, Z., Pl, C., et al. (2020). Analysis of surface and vertical measurements of O3 and its chemical production in the NCP region, China - ScienceDirect. Atmos. Environ. 241. doi:10.1016/j.atmosenv.2020.117759
Shi, Z., Song, C., Liu, B., Lu, G., Xu, J., Van Vu, T., et al. (2021). Abrupt but smaller than expected changes in surface air quality attributable to COVID-19 lockdowns. Sci. Adv. 7, eabd6696. doi:10.1126/sciadv.abd6696
Su, T., Li, Z., Zheng, Y., Luan, Q., and Guo, J. (2020). Abnormally shallow boundary layer associated with severe air pollution during the COVID-19 lockdown in China. Geophys. Res. Lett. 47, e2020GL090041. doi:10.1029/2020GL090041
Sulaymon, I. D., Zhang, Y., Hopke, P. K., Zhang, Y., Hua, J., and Mei, X. (2021). COVID-19 pandemic in Wuhan: Ambient air quality and the relationships between criteria air pollutants and meteorological variables before, during, and after lockdown. Atmos. Res. 250, 105362. doi:10.1016/j.atmosres.2020.105362
Sun, Z., Duan, F., He, K., Du, J., and Zhu, L. (2019). Sulfate-nitrate-ammonium as double salts in PM2.5: Direct observations and implications for haze events. Sci. Total Environ. 647, 204–209. doi:10.1016/j.scitotenv.2018.07.107
Tang, Q., Zheng, B., Xue, W.-B., Zhang, Q., Lei, Y., and He, K.-B. (2021). Contributors to air pollutant emission changes in autumn and winter in beijing-tianjin-hebei and surrounding areas. Huan Jing Ke Xue Huanjing Kexue 42, 1591–1599. doi:10.13227/j.hjkx.202007218
Wang, C., Wang, Y., Shi, Z., Sun, J., Gong, K., Li, J., et al. (2021a). Effects of using different exposure data to estimate changes in premature mortality attributable to PM2.5 and O-3 in China. Environ. Pollut. 285, 117242. doi:10.1016/j.envpol.2021.117242
Wang, H., Tian, M., Chen, Y., Shi, G., Liu, Y., Yang, F., et al. (2018a). Seasonal characteristics, formation mechanisms and source origins of PM2.5 in two megacities in Sichuan Basin, China. Atmos. Chem. Phys. 18, 865–881. doi:10.5194/acp-18-865-2018
Wang, J., Zhong, Y., Li, Z., and Fang, C. (2022). Temporal and spatial analysis of PM2.5 and O3 pollution characteristics and transmission in central liaoning urban agglomeration from 2015 to 2020. Sustainability 14, 511. doi:10.3390/su14010511
Wang, P., Chen, K., Zhu, S., Wang, P., and Zhang, H. (2020a). Severe air pollution events not avoided by reduced anthropogenic activities during COVID-19 outbreak. Resour. Conserv. Recycl. 158, 104814. doi:10.1016/j.resconrec.2020.104814
Wang, X., Dickinson, R. E., Su, L., Zhou, C., and Wang, K. (2018b). Pm2.5 pollution in China and how it has been exacerbated by terrain and meteorological conditions. Bull. Am. Meteorol. Soc. 99, 105–120. doi:10.1175/BAMS-D-16-0301.1
Wang, Y., Gao, W., Wang, S., Song, T., Gong, Z., Ji, D., et al. (2020b). Contrasting trends of PM2.5 and surface-ozone concentrations in China from 2013 to 2017. Natl. Sci. Rev. 7, 1331–1339. doi:10.1093/nsr/nwaa032
Wang, Y., Li, W., Gao, W., Liu, Z., Tian, S., Shen, R., et al. (2019). Trends in particulate matter and its chemical compositions in China from 2013-2017. Sci. China-Earth Sci. 62, 1857–1871. doi:10.1007/s11430-018-9373-1
Wang, Y., Zhu, S., Ma, J., Shen, J., Wang, P., Wang, P., et al. (2021b). Enhanced atmospheric oxidation capacity and associated ozone increases during COVID-19 lockdown in the Yangtze River Delta. Sci. Total Environ. 768, 144796. doi:10.1016/j.scitotenv.2020.144796
Wang, Y., Zhuang, G., Zhang, X., Huang, K., Xu, C., Tang, A., et al. (2006). The ion chemistry, seasonal cycle, and sources of PM2.5 and TSP aerosol in Shanghai. Atmos. Environ. 40, 2935–2952. doi:10.1016/j.atmosenv.2005.12.051
Wei, W., Zang, J., Wang, X., and Cheng, S. (2020). Peroxyacetyl nitrate (PAN) in the border of Beijing, Tianjin and Hebei of China: Concentration, source apportionment and photochemical pollution assessment. Atmos. Res. 246, 105106. doi:10.1016/j.atmosres.2020.105106
Xiong, C., Zhang, Y., Yan, J., Yang, X., Wang, Q., Tu, R., et al. (2021). Chemical composition characteristics and source analysis of PM2.5 in jiaxing, China: Insights into the effect of COVID-19 outbreak. Environ. Technol. doi:10.1080/09593330.2021.1979104
Xiong, Y., and Du, K. (2020). Source-resolved attribution of ground-level ozone formation potential from VOC emissions in Metropolitan Vancouver, BC. Sci. Total Environ. 721, 137698. doi:10.1016/j.scitotenv.2020.137698
Xu, Q., Wang, S., Jiang, J., Bhattarai, N., Li, X., Chang, X., et al. (2019a). Nitrate dominates the chemical composition of PM2.5 during haze event in Beijing, China. Sci. Total Environ. 689, 1293–1303. doi:10.1016/j.scitotenv.2019.06.294
Xu, T., Song, Y., Liu, M., Cai, X., Zhang, H., Guo, J., et al. (2019b). Temperature inversions in severe polluted days derived from radiosonde data in North China from 2011 to 2016. Sci. Total Environ. 647, 1011–1020. doi:10.1016/j.scitotenv.2018.08.088
Yang, X., Zhao, C., Zhou, L., Wang, Y., and Liu, X. (2016). Distinct impact of different types of aerosols on surface solar radiation in China. J. Geophys. Res.-Atmospheres 121, 6459–6471. doi:10.1002/2016JD024938
Yang, Z., Mahendran, R., Yu, P., Xu, R., Yu, W., Godellawattage, S., et al. (2022). Health effects of long-term exposure to ambient PM2.5 in asia-pacific: A systematic review of cohort studies. Curr. Environ. Health Rep. 9, 130–151. doi:10.1007/s40572-022-00344-w
Yao, L., Kong, S., Zheng, H., Chen, N., Zhu, B., Xu, K., et al. (2021). Co-benefits of reducing PM2.5 and improving visibility by COVID-19 lockdown in Wuhan. Npj Clim. Atmos. Sci. 4, 40. doi:10.1038/s41612-021-00195-6
Zhang, H., Cheng, S., Wang, X., Yao, S., and Zhu, F. (2018). Continuous monitoring, compositions analysis and the implication of regional transport for submicron and fine aerosols in Beijing, China. AtmosEnviron 195, 30–45. doi:10.1016/j.atmosenv.2018.09.043
Zhang, X., Zhang, Z., Xiao, Z., Tang, G., Li, H., Gao, R., et al. (2022a). Heavy haze pollution during the COVID-19 lockdown in the Beijing-Tianjin-Hebei region, China. J. Environ. Sci. 114, 170–178. doi:10.1016/j.jes.2021.08.030
Zhang, Z., Man, H., Duan, F., Lv, Z., Zheng, S., Zhao, J., et al. (2022b). Evaluation of the VOC pollution pattern and emission characteristics during the Beijing resurgence of COVID-19 in summer 2020 based on the measurement of PTR-ToF-MS. Environ. Res. Lett. 17, 024002. doi:10.1088/1748-9326/ac3e99
Zhao, H., Chen, K., Liu, Z., Zhang, Y., Shao, T., and Zhang, H. (2021). Coordinated control of PM2.5 and O-3 is urgently needed in China after implementation of the “Air pollution prevention and control action plan. Chemosphere 270, 129441. doi:10.1016/j.chemosphere.2020.129441
Zhao, H., Zheng, Y., and Li, C. (2018). Spatiotemporal distribution of PM2.5 and O-3 and their interaction during the summer and winter seasons in beijing, China. Sustainability 10, 4519. doi:10.3390/su10124519
Zhao, N., Wang, G., Li, G., Lang, J., and Zhang, H. (2020). Air pollution episodes during the COVID-19 outbreak in the Beijing-Tianjin-Hebei region of China: An insight into the transport pathways and source distribution. Environ. Pollut. 267, 115617. doi:10.1016/j.envpol.2020.115617
Zheng, H., Cai, S., Wang, S., Zhao, B., Chang, X., and Hao, J. (2019). Development of a unit-based industrial emission inventory in the Beijing-Tianjin-Hebei region and resulting improvement in air quality modeling. Atmos. Chem. Phys. 19, 3447–3462. doi:10.5194/acp-19-3447-2019
Zhou, H., Zhang, F., Du, Z., and Liu, R. (2021). Forecasting PM2.5 using hybrid graph convolution-based model considering dynamic wind-field to offer the benefit of spatial interpretability. Environ. Pollut. 273, 116473. doi:10.1016/j.envpol.2021.116473
Zhu, L., Huang, X., Shi, H., Cai, X., and Song, Y. (2011). Transport pathways and potential sources of PM10 in Beijing. Atmos. Environ. 45, 594–604. doi:10.1016/j.atmosenv.2010.10.040
Keywords: PM2.5, O3, COVID-19, backward trajectories, cluster analysis, potential source contribution function and concentration weighted trajectory technologies
Citation: Zhang H, Wang X, Shen X, Li X, Wu B, Chen W and Yao Z (2022) Analysis of air pollution characteristics, transport pathways and potential source areas identification in Beijing before, during and after the COVID-19 outbreak. Front. Environ. Sci. 10:982566. doi: 10.3389/fenvs.2022.982566
Received: 30 June 2022; Accepted: 25 August 2022;
Published: 29 September 2022.
Edited by:
Yang Gao, Ocean University of China, ChinaCopyright © 2022 Zhang, Wang, Shen, Li, Wu, Chen and Yao. This is an open-access article distributed under the terms of the Creative Commons Attribution License (CC BY). The use, distribution or reproduction in other forums is permitted, provided the original author(s) and the copyright owner(s) are credited and that the original publication in this journal is cited, in accordance with accepted academic practice. No use, distribution or reproduction is permitted which does not comply with these terms.
*Correspondence: Zhiliang Yao, yaozhl@th.btbu.edu.cn