The analysis of the spatio-temporal differentiation characteristics of total factor productivity of maize: Introducing the perspective of financial support
 Sha Lou
- School of Finance, Harbin University of Commerce, Harbin, Heilongjiang, China
The problem we studied is the analysis of the spatio-temporal differentiation characteristics of total factor productivity of maize. The importance lies in that maize is one of the prominent grain crops in China, the improvement of maize production efficiency is helpful to guarantee the national food security. From the perspective of financial support, deepened the connotation of DEA model, this paper innovatively constructs the Global Malmquist index method, in view of the data of 13 major grain producing areas in China from 2007 to 2017, talks over the temporal evolution characteristics and spatial distribution modes of total factor productivity (TFP) of maize. The main results show that the TFP of maize production in China’s major grain producing areas is mostly of a high level between 2007 and 2017, revealing a fluctuating upward drift, with an average annual rate of increase of 10.7%. The conclusion we draw from the results is that as shown in the decomposition index, the variation of TFP of maize production mainly attributes to the shift of technological progress. In terms of space, the TFP of maize production in the central district is the highest, the eastern and western districts are relatively low.
Introduction
Maize is one of the leading food crops in China which is an important strategic material with multiple uses such as grain, economy, feed and energy (He et al., 2020). According to the “China Food Development Report” issued by the China Food and Materials Reserve Bureau, the maize planting of China areas reached 42.40 million hectares in 2017, with a total output of 25907 million tons, accounting for 30% and 39.2% of the entire grain planting areas and outputs respectively. Maize is widely planted in the whole country (Zhao and Wang, 2013), which is of great significance to promote maize production and increase farmers’ income (Zhao et al., 2015). However, at present, a large number of maize production population progressively migrated to cities (Tian et al., 2000), resulting in the corresponding loss of labour in maize production (Zhang et al., 2021a). In the meantime, under the background of maize supply-side reform, the area of cultivated land that can grow maize is also gradually decreasing (Wang and Wei 2017). These reasons determine that China’s maize production can not rely on the unlimited expansion of input factors to develop (Mwalupaso et al., 2019), so it is vitally important to improve the efficiency of maize production (Ayinde et al., 2015). At the moment, the data envelopment analysis (DEA) model is mainly used to measure maize production efficiency (Geta et al., 2017; Zhao et al., 2019). In the selection of input indicators, scholars usually choose land resources and labour resources (Linh et al., 2015; Anang et al., 2020). However, the ‘2019 Key Agricultural Benefit Policy’ issued by the Ministry of Agriculture and Rural Areas and the Ministry of Finance stressed increasing subsidies for the protection of cultivated land and increasing loan to maize producers in Liaoning, Jilin, Heilongjiang and Inner Mongolia (Zou et al., 2018). China presented the ‘Rural Revitalization Strategy’ and continued its fiscal policy of agricultural support, fostered the innovation of rural financial organizations, guaranteed the development of the rural economy and ensured the high efficiency and accuracy of the supply of maize production funds (Gai et al., 2013; Rupnik et al., 2019). This can be proved that agricultural loans can also be transformed to production factors to study the productivity of maize. As a result, the innovation of this manuscript is to put agricultural loans as the input index and adopt Global Malmquist index to explore the temporal evolution characteristics and spatial distribution modes of TFP of maize production which plays an important role to improve the performance of maize production in the leading maize producing districts of China (Anupama and Singh RP Kumar 2005), the current situation of maize production and the healthy development of maize industry (Yu, 2019).
The structure of this manuscript is as below: Chapter two is the literature review that discusses the maize production efficiency; The third part introduces the research method, the indicators and data sources; The fourth part is the empirical analysis of maize production and the fifth part is a biref summary.
Literature review
At present, domestic and foreign scholars mostly study maize production efficiency from the two following sides:
First is the measurement method of maize productivity. In view of the panel data of maize production from 2001 to 2008, Wang et al. (2010) measured the otal factor productivity of maize in corn core production districts by using the parametric stochastic frontier analysis (SFA). The empirical results showed that the rise of corn production efficiency in maize core production districts of China from 2001 to 2008 was apparent, and TFP has become the driving source of maize growth (Wang et al., 2010). Ehsan et al. (2012) chose the data of agricultural machinery information and fertilizer utilization in the southwestern Iranian maize production area, and measured the maize productivity based on the DEA method. It is believed that the improvement of maize production efficiency is mainly due to the adcancement of energy utilization efficiency (Ehsan et al., 2012). Because of the SFA model has some defects, and the DEA model can avoid the strong hypothesis bias of the SFA model, such as random interference normal distribution, and can reasonably evaluate the production activities with more inputs and more outputs, so it is widely used in the study of production efficiency (Ehsan et al., 2012). Shamsudeen Abdulai (2013) used the SFA method to estimate the technical efficiency of maize growers in view of the data of 2011 and 2012 planting seasons in three districts of northern Ghana. The conclusion shows that the ability of maize growers to improve maize yield and achieve sustainable production of maize depends on effective farm practices, that is, technical efficiency. The determinants of maize production in northern Ghana are farm size, seeds, fertilizers and herbicides (Abdulai et al., 2013). Musa Hasen Ahmed et al. (2018) assessed the technical, economic and allocation performance of corn production in eastern Ethiopia that use cross-sectional record gathered from 480 maize farms in Ethiopia. The random production function suited by Cobb-Douglas production function shows that species quantity, farmland quantity and DAP are of great significance to the determination of maize yield in the study area. The results also show that the potential of improving economic performance of corn production in the research area is more dependent on allocation efficiency than technical performance (Ahmed et al., 2018). Previous studies on maize production efficiency are primarily based on the static analysis of the DEA model and SFA model.
The second is the selection of indicators and samples for measuring maize production efficiency. Yusha’u Hassan (2014) used the annual secondary data of maize yield in Nigeria from 1971 to 2010. Input-output indicators selected maize yield, maize seed number, maize sowing area and fertilizer number. The empirical results show that the DEA efficiency score is higher than SFA. Meanwhile, under the conditions of stochastic frontier analysis and data envelopment analysis, China’s technical efficiency output range can be expanded by 35.5%, 22.2% and 12.3%, respectively (Hassan et al., 2014). Asmara et al. (2016) studied the technical performance of maize production in view of the data of maize seeds, fertilizers and pesticides, and maize production in East Java of Indonesia by using data envelopment analysis. The results show that most farmers are in the stage of increasing returns to scale (Asmara et al., 2016). Li and Zhu et al. (2018) took maize production population, effective irrigation area and maize planting area of 18 cities in Henan bewten 2006 and 2016 as input indexes, and maize yield as output index. Data envelopment analysis was used to research maize production efficiency. The empirical outcomes reveal that the overall level of TFP of maize production in 18 cities of Henan is high. Furthermore, the research and development degree of advanced technology in corn production in Henan has rised in the 10 years, and the advanced technology has not been thoroughly accelerated (Li and Zhu, 2018). Shamsudeen Abdulai (2018) adopted the DEA method based on input orientation, and the input-output indicators selected the number of maize cultivation years, the amount of maize seeds and maize yields. The technical efficiency in the north of Ghana was tested using cross-sectional record for the 2011/2012 planting season. The study found that maize production in northern Ghana showed an increasing trend of returns to scale, and the average technical performance was 77%. More importantly, the amount of input utilized is higher than the amount required to realize the current level of maize yield, which is the main reason for low efficiency (Abudulai et al., 2018). The selection of input indicators in previous studies on maize production efficiency is similar and lacks innovation.
Therefore, in view of the shortcomings in previous literatures (Dong et al., 2022; Xiang et al., 2022a; Yan et al., 2022; Zhang et al., 2022), this manuscript mainly addresses the problem of maize production efficiency in China’s main grain producing areas.The current specific knowledge gap is that DEA model is used to measure maize production efficiency, and in the selection of input indicators, scholars usually choose land resources and labour resources. The implication can be referred is that the innovation of this manuscript is mostly reflected in the following two sides: First, from the angle of research, this paper introduces agriculture loan as an input variable into the estimation hierarchy of maize production performance, highlighting the significance of financial support for maize production. Second, on the basis of the classical DEA method, this paper innovatively constructs the Global Malmquist index method to evaluate the total factor productivity and its decomposition index of maize production. The temporal evolution characteristics and spatial distribution modes of maize production efficiency in prominent grain producing areas are explained in detail in this article. In order to provide a more reliable theoretical basis for improving maize production efficiency and meeting the needs of the people, and ensuring national food security (Xiang et al., 2022b).
Model construction and index selection
Global Malmquist index model
Domestic research on the Malmquist index is mainly based on the method proposed by Fare (Fare et al., 1997), decomposing the index into technical progress and technical efficiency. However, the technology change measured via the Malmquist index of the traditional DEA method is not based on the entire technology change, but on the relative technological change based on each production frontier, which can not fully show an active shift process of technical efficiency (Perez et al., 2017). The Global Malmquist index constructed by Pastor and Lovell can fully show an active process of technical efficiency. Based on the ideas of Pastor and Lovell (Pastor and Lovell, 2005), this manuscript establishes the Global Malmquist index model method.
Assuming that the period of a DMU is q = 1,2,…,Q, the production technology Sq represents the transformation process from input to output (Ray and Desli, 1997). The production possibility set of period of q is defined as follows:
According to Eq 1, the Global base period technology is defined. The sum of possible production sets of each base period is as follows:
The output distance function is defined as follows:
Where the superscripts “b, c, and n” represent the CRS, VRS and Global benchmark technology respectively, and the subscript “a” represents output. CRS refers to the fixed return to scale model, that is, CCR model. It reflects the production efficiency of the input factors of the decision-making unit at a certain (optimal scale), and is a comprehensive measurement and evaluation of the resource allocation capacity, resource utilization efficiency and other capabilities of the decision-making unit. VRS refers to the variable return to scale model, that is, BCC model. It is to discuss efficiency from the perspective of output, that is, under the same input level, compare the achievement of output resources, and obtain “technical benefits”. Therefore, the Global Malmquist productivity index is as follows:
Different from the Global Malmquist index decomposition proposed by Pastor and Lovell, this paper divides it into three parts:
Namely, TFPCH is decomposed into technical efficiency change (EC) and technical progress change (TC), and technical efficiency change can be further decomposed into pure technical efficiency change (PECH) and scale efficiency change (SECH). Where PECH is defined as the change of pure technical efficiency, SECH is defined as the change of scale efficiency and TC is defined as the change of technical progress (Mathur and Ramnath, 2018). Based on the Global Malmquist index method and the above three decomposition indexes, this paper explores the dynamic changes of maize production performance in China’s major grain producing districts.
Variable selection, data sources and sample sources
Based on the connotation of TFP of maize (Monga and Sidana, 2020), according to the previous research results and the actual condition of maize production in China’s leading grain production district, regarding the practicability of index quantification and the accessibility of data (Xiang et al., 2022c), this paper selects three input indexes and one output index to build an evaluation hierarchy of maize production performance. The indexes are explained as below.
1) Agricultural loans. It refers to the loans provided by financial institutions to enterprises and individuals engaged in agricultural production for the needs of agricultural production.
2) Agricultural employees. It mainly includes the rural population over 16 years old who actually take part in agricultural production activities and gain material or monetary income.
3) The planting area of maize. It refers to the actual planting area of maize in cultivated land, and can be used for frequent hoeing.
4) Maize yield. It refers to the total number of maize made by agricultural producers in a whole year.
In order to ensure the authenticity of the data, the data studied in this article is derived from the annals of statistics bewteen 2007 and 2017, including agricultural loans from “China Financial Yearbook”, agricultural employees from “China Statistical Yearbook”, and the planting area of maize and maize yield from “China Rural Statistical Yearbook”. The missing record is supplemented by the average method. Since the data of agricultural loans and agricultural employees in Heilongjiang Province and other provinces have not been published in 2018 and 2019, the indicator span of this paper is from 2007 to 2017.
The sample of this manuscript is 13 prominent grain producing districts in China which mean the pivotal grain production districts with fixed scope and economic results and suitable for maize growth in local climate conditions, environment and soil (Zhang et al., 2019). As shown in Figure 1, this paper divides 13 major grain producing provinces in China into three districts: the eastern district, the central district and the western district. The main aim of this manuscript is to measure the total factor productivity and its decomposition efficiency of maize production in different districts from 2007 to 2017 (Long et al., 2018).
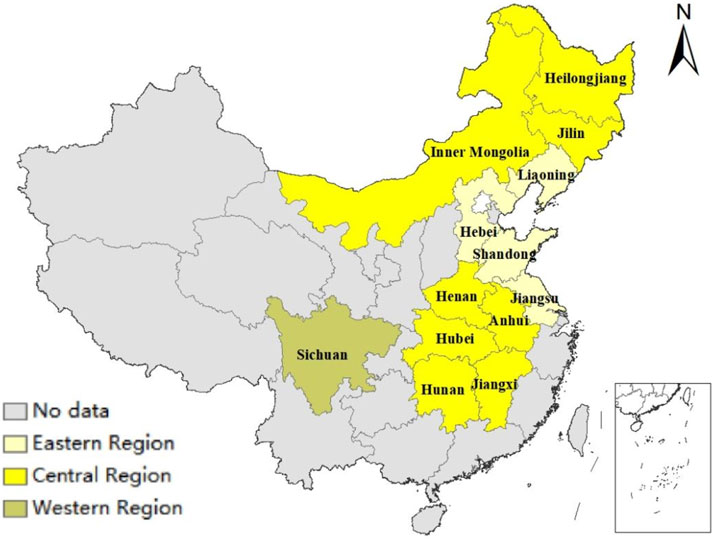
FIGURE 1. Districtal division among provinces.
Performance evaluation based on Global Malmquist index
Temporal variation characteristics of TFP of maize production
In terms of the overall standard, as shown in Table 1, the total factor productivity of maize production in China’s prominent grain producing areas is quitely of a high degree. Except for Henan, Jiangxi and Shandong, the mean TFP of maize production in other prominent grain producing districts is greater than 1. The reasons lie in that government sector has increased fiscal support for maize production, formulated a lot of ffisal policies to support agriculture, improved the incentive policy environment for maize production, and gradually reduced the loan interest generated by farmers’ maize production after 2007. These policies have increased the vested interests of farmers, and the attitude of farmers to take part in maize production. Therefore, the overall TFP of maize production is mostly of a high level. The maen TFP of maize production in Heilongjiang Province is 1.047 which is the fastest growing inside the 13 provinces. The reason should be that Heilongjiang, well implemented grain subsidy policy, has increased the support for maize production. Meanwhile, it has a strong sense of protection of maize cultivated land, which can promote the ratio of return on human capital investment in maize production, and then promote the improvement of maize production performance. The mean TFP of maize production in Jiangxi is 0.970 which is the slowest growth rate among the 13 provinces. The reasons may be that the agricultural subsidy funds of Jiangxi have not been applied to the construction of agricultural mechanization and other infrastructure, the distribution of maize subsidy funds is cumbersome, and the maize production mode has not been improved.
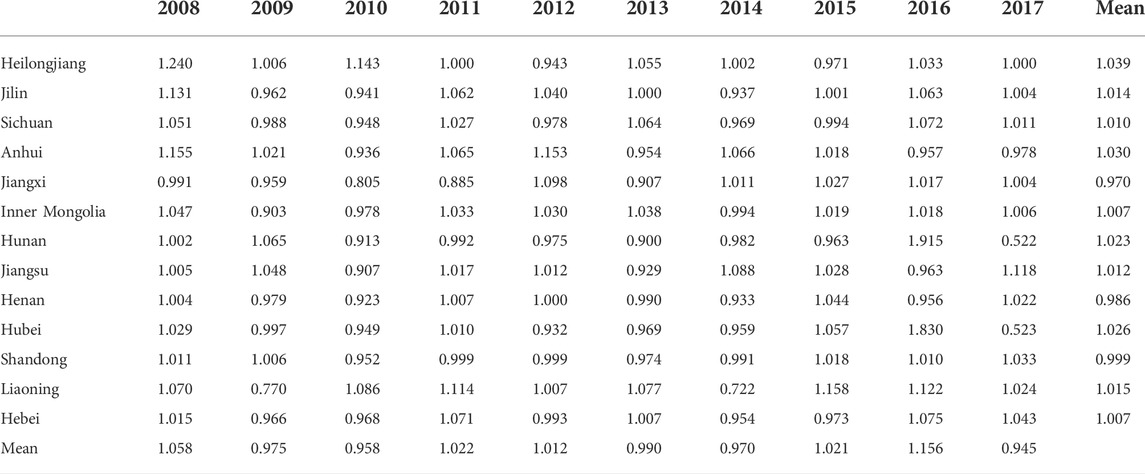
TABLE 1. TFP of maize production from 2008 to 2017.
In terms of time, as shown in Figure 2 and Table 1, the TFP of maize production shows a fluctuating upward drift with an mean annual rise of 10.7%. Which in 2008 than in 2007 raised by 5.8%, this may be due to the beginning of 2008, China’s maize market betrayed the downturn in maize sales, farmers tested interests increased, the enthusiasm for maize production increased significantly. Meanwhile, the government formulated the corresponding financial support policies to encourage maize production and export which has a significant role in promoting the efficiency of maize production. From 2008 to 2010, it decreased by 2.5% and 4.2%, respectively. This may be because from 2008 to 2010, the prices of agricultural means of production, such as fertilizer costs and seed costs, increased significantly, which was much higher than in previous years. Besides, the main body engaged in maize production was primarily small-scale farmers, and the enthusiasm of traditional small-scale farmers for food production was generally not high, so it was difficult to guarantee the maize yield, so the maize production efficiency decreased significantly. TFP increased by 2.2% and 1.2% respectively from 2010 to 2012, the reason may be that the prominent grain producing districts have increased scientific and technological investment in maize cultivation techniques and pest management, and actively developed maize varieties more suitable for production at that time. However, it decreased by 0.1% and 0.3% respectively in 2012–2014, this may be due to the abnormal climate conditions in China from 2012 to 2014, the rainy weather, the severe disaster of maize planting area, the reduction of maize yield and the decline of maize production efficiency. From 2014 to 2016, the TFP of maize production increased by 2.1% and 15.6% respectively, because of the main maize producing provinces actively improved the maize extension system and strengthened the construction of maize production infrastructure. At the same time, it overcomes the difficulties in the early warning of sudden natural disasters. These measures can maximize the protection of farmland from disasters and maize yield. However, the TFP of maize production in 2017 decreased by 5.5% compared with that in 2016, which may be thate with the constant progress of science and technology, a large number of personnel engaged in maize planting are transferred to cities, and a large number of labour forces for maize production are lost, which limit the improvement of TFP of maize production.
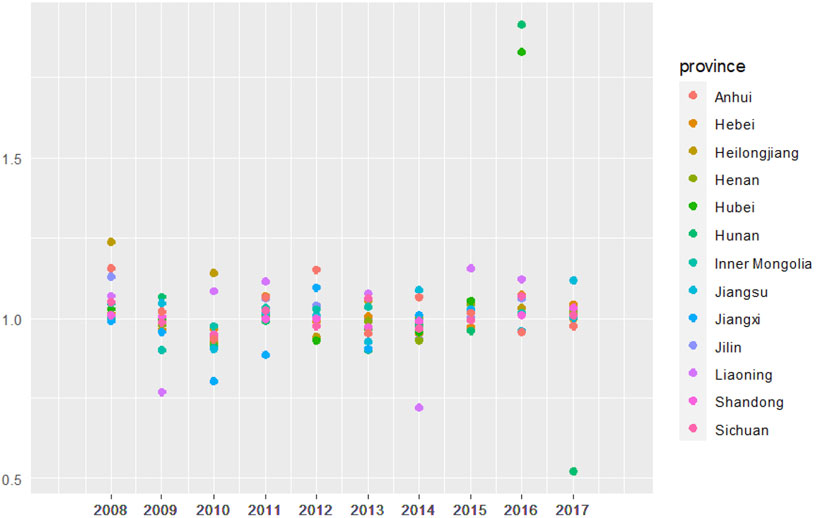
FIGURE 2. TFP of corn production from 2007 to 2017.
In view of the decomposition index, it can be seen from Figure 3, the TFP appeared an overall fluctuating drift from 2007 to 2017, with the largest increase of 15.6% in 2016 and the largest decrease of 5.5% in 2017. The change trend of technology progress index is basically consistent with that of TFP. Meanwhile, technological progress has raised by 1.7%, while the rise ratio of technical efficiency has only increased by 0.4%, implying that the rise of TFP is mostly lie in the rise of technological progress. In addition, the slow rise of technical efficiency is mostly due to the descend of pure technical efficiency. The average annual decrease of pure technical efficiency is 0.4%, and the mean annual increase of scale efficiency is 0.9%. The decline trend shows that the growth dividend of maize production brought by pure technical efficiency in main maize producing areas from 2007 to 2017 is gradually disappearing. There are some phenomenon in maize production, such as the disconnection between technology and production, and the different channels of maize production technology. The related policies put forward by the goverment finance are not combined with the innovation of maize production technology, and the water conservancy foundation such as farmland irrigation is not deeply promoted the construction of the city. Futhermore, the scale efficiency increased by 0.9%, which indicates that the prominent grain producing districts can appropriately improve the maize production subsidy standard according to local conditions, and determine different maize production subsidy scale.
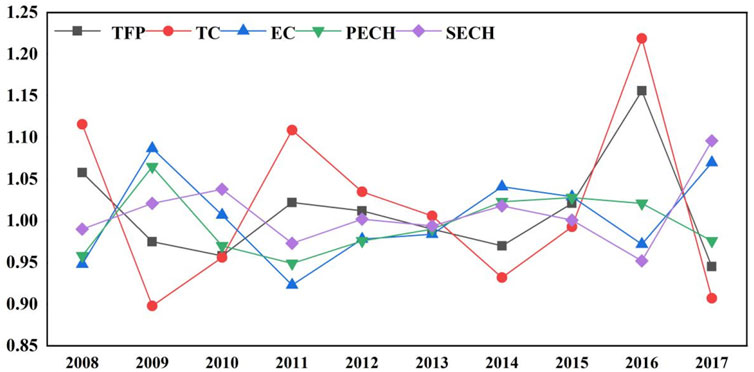
FIGURE 3. TFP index and decomposition index from 2007 to 2017.
In order to consider the factors for the shift of TFP better, this manuscript resolves the TFP of maize production into PECH, SECH and TC (Zhang, 2020, and Figure 4 shows the value and change trend. As shown in Figure 4, from 2007 to 2017, the overall degree of technological progress of maize production in major grain producing areas was of a high level, but most of them showed a fluctuating downward trend. Only Jilin Province and Inner Mongolia showed a fluctuating upward trend in technological progress, of which Inner Mongolia had the largest increase, with an increase of only 0.5%. The reason may be that the subsidy method of Inner Mongolia is highly efficient, which leads to the maximum effective utilization of subsidy funds in maize production technology, and thus the technical progress of maize production increases. From 2007 to 2017, the technical progress of maize production showed significant differences, and the mean technical progress index of maize production was greater than one. Among them, the average value of maize production technology progress index in Jiangxi Province is the largest, with an mean annual growth rate of 5%. It may be that Jiangxi Province, with the support of grain subsidy policy, actively increases investment in maize production and scientific research, improves maize production technology, and then improves the status quo of maize production. We can find that from Figure 4 that the pure technical efficiency of maize production in main grain producing areas between 2007 and 2017 is significantly different. During the sample period, the pure technical efficiency in Henan was the lowest, only 0.977. This means that the management level and management mode of maize production in Henan have not improved significantly, so the PEC of maize production is low. Furthermore, the average technical efficiency of Anhui Province was the highest, reaching 1.026, which is due to the high level of subsidies in Anhui Province, the meeting degree of maize production technology and productivity is relatively high, and the technical progress and technical efficiency of maize production can be promoted in parallel. Meanwhile, anhui province can promote the technical efficiency based on the improvement of agricultural technology, so as to boost the improvement of PEC. As can be seen from Figure 4, although there are differences in the scale efficiency of maize production from 2007 to 2017, the differences are not obvious, and the mean scale efficiency is mostly close to 1. The average scale efficiency of Jiangxi is the highest, reaching 1.047. It may be that at the level of food subsidies, most of the major grain producing areas cannot combine the local resource endowment conditions and adjust measures to local conditions, which is difficult to boost the formation of scope effect of maize production. Nevertheless, Inner Mongolia can change the mode of maize production from the aspects of its own maize scale management and cultivation of new maize varieties, and actively optimize the proportion of input-output between the scale of maize production subsidies and the scale of maize production, which leads to the highest average scale efficiency of its own maize production. The average scale efficiency of Jiangsu Province is the lowest, only 0.998. The reason may be that the government of Shandong province has not invested in the constant yield of maize in the financial support of agriculture, and cannot formulate scientific support measures in the development of agricultural machinery (Lou et al., 2021; Zhang et al., 2021b).
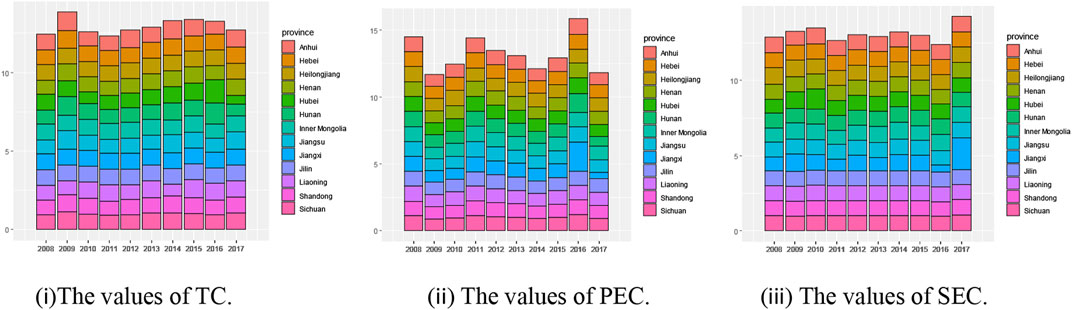
FIGURE 4. Decomposition index of TFP from 2007 to 2017. (i) The values of TC. (ii) The values of PEC. (iii) The values of SEC.
Spatial variation characteristics of total factor productivity of maize production
This paper uses ArcGIS to draw the space pattern map of TFP of maize production in China’s main grain producing areas bewteen 2007 and 2017. Figure 5 reveals the space distribution of TFP of maize production clearly. As shown in Table 1 and Figure 5, from the overall average, we can find that the maize production performance showed the characteristics of unbalanced space development from 2007 to 2017, which normally revealed a decreasing drift from the central district to the eastern and western districts, with more provinces with high TFP of maize in the central district. Bewteen 2007 and 2012, the TFP of maize production showed a waving decrease drift in most provinces. The TFP of corn in Jiangxi in the central district has been declining in 4 years. The reason may be that there are more rain weather in Jiangxi Province in 5 years, which leads to the increase of the affected space of cultivated land that directly reduce the corn production. From 2012 to 2017, except Hubei Province, Hunan Province and Anhui Province in the central district, the TFP of maize production in other prominent grain producing districtsrevealeded a fluctuating upward trend.
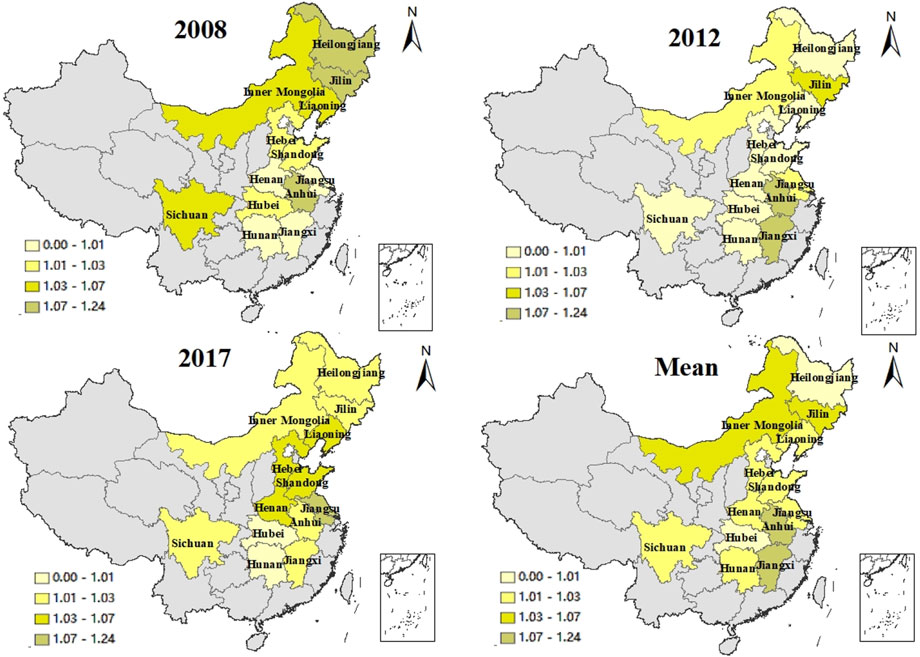
FIGURE 5. Space pattern of TFP of maize production.
In 2008, except Jiangxi Province in the central district, the TFP of maize production in other prominent grain producing areas rised momentously. Among them, the TFP of maize in Heilongjiang, Jilin, Anhui and Liaoning Provinces in the central district is higher than the average. These four provinces have become high-level areas of maize production, which may be due to the unique climate conditions and rich maize cultivated land resources in these areas, resulting in the increase of TFP level of maize production. In 2012, except Heilongjiang, Hubei e, Hunan and Sichuan Provinces in the central distrivt, Hebei and Shandong Provinces in the east district the TFP of maize production in other major grain producing areas rised. The TFP of maize production in Jilin, Jiangxi and Anhui Provinces in the central district is higher than the average, becoming the high-level areas of maize production. In 2017, except for Hubei, Hunan and Anhui Provinces, the TFP of maize production in other prominent grain producing areas increased. Except Hubei and Hunan Provinces in the central district, the TFP of maize food production in other provinces is higher than the average, which makes them become high-level areas of maize production.
In view of the districtal differences, as shown in Table 1 and Figure 6, from the internal view of districtal differences, the TFP level of maize production in the central district is the highest, followed by that in the eastern district, and that in the western district is the smallest. On the whole, there are relatively more provinces with high total factor productivity of maize production from 2007 to 2017, most of which are gathered in the central district, it may be that the abundant cultivated land resources have a great role in boosting the rise of TFP of maize bewteen 2007 and 2017. The TFP gap of maize production in the prominent grain producing areas in the central district was large. The difference between Heilongjiang Province with the highest TFP of maize production and Jiangxi with the lowest TFP of maize was 6.9%. The TFP gap of maize production in the eastern district was small. The difference between Liaoning Province with the highest TFP of maize production and Shandong Province with the lowest TFP of maize production was only 1.6%. The reason may be that in the process of maize production in the prominent grain producing provinces in the central district, due to the different scale of maize production subsidies in each province, the matching degree of maize production technology and productivity is different. The technological progress of maize production and the rise of technical efficiency cannot be promoted in parallel, resulting in a large gap in TFP of maize in each province. Those provinces in the eastern district have made significant progress in the management level and management mode of maize production in the process of maize production, which can promote the technical efficiency of grain production on the basis of improving agricultural technology. Therefore, the TFP of maize production has little difference. Due to the implementation of the strategy of Western Development by the state, the government in the western district provides high-intensity subsidies for maize production. Therefore, the proportion of government investment in financial support for agriculture in Sichuan Province is increased, the vested interests of maize producers are increased, and the enthusiasm for maize production is high, so the TFP of maize production in Sichuan Province is relatively high.
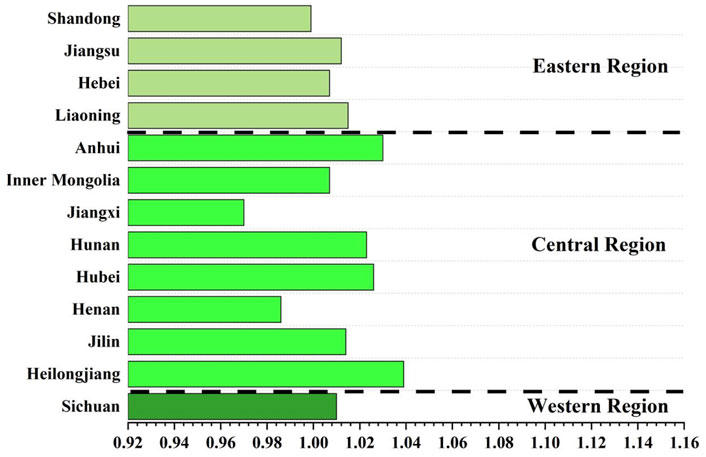
FIGURE 6. Districtal distribution of TFP of maize production.
Conclusion and suggestions
Based on the relevant data of maize production bewteen 2007 and 2017, this paper uses the Global Malmquist index to measure the total factor productivity of maize production and draw the following conclusions:
1) From the perspective of time, the TFP of maize in China’s major grain producing districts revealed a trend of overall fluctuation and gradually rose bewteen 2007 and 2017, with a mean annual increase of 10.7%. In 2008, it raised by 5.8% compared with 2007. The TFP decreased by 2.5% and 4.2% respectively from 2008 to 2010. Although it fell by 2.2% and 1.2% respectively from 2010 to 2012, it decreased by 0.1% and 0.3% respectively from 2012 to 2014. Although the TFP of maize production increased by 2.1% and 15.6% from 2014 to 2016, it still decreased by 5.5% in 2017.
2) As can be seen from space, the TFP of maize in China’s major grain producing districts revealed a significant difference from 2007 to 2017, showing a decreasing drift from the central district to the eastern and western districts. In view of the districts, the central area has the largest districtal difference.
3) In view of the index decomposition, the decomposition indexes of TFP showed that the scale efficiency index and technological progress index increased, in contrast, the pure technical efficiency index decreased. The change of TFP mostly contributes to the shift of technological progress.
The significance is to improve the performance of maize production in the leading maize producing districts of China, the current situation of maize production and the healthy development of maize industry.
According to the empirical results of this paper, the policy recommendations are as follows:
1) Adjust the scale structure of maize production. The main maize producing areas should transfer the abandoned maize cultivated land to farmers with rich professional knowledge of maize planting or a high level of mechanization by using the form of land, so as to realize scale operation. At the same time, we should encourage farmers to take advantage of cultivated land and combine it with modern maize production technology to expand the scale of maize production.
2) Increase investment in science and technology for maize production. The key to improve production efficiency is to improve maize production technology. We must speed up the cultivation of new maize varieties. Effective seeds can enhance the quality of maize production. Local governments at all levels should increase financial support for new maize varieties. Cultivate high-quality varieties, increase investment in agricultural production technology in universities and local colleges, research maize production technology, so as to improve maize yield.
3) Further optimize the spatial distribution of maize production. Considering the influence of non-agricultural employment opportunities, traditional planting habits, urbanization level and resource conditions, the scale of maize production will show a pattern of coordinated development in space. Simultaneously, each maize producing area should fully consider its actual situation and implement differentiated support policies for different maize growers (Table 2).
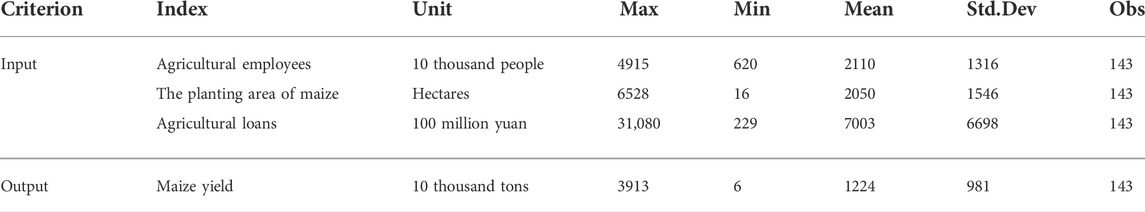
TABLE 2. Descriptive statistics of indicators.
Data availability statement
The original contributions presented in the study are included in the article/supplementary material, further inquiries can be directed to the corresponding author.
Author contributions
The author is responsible for writing the whole article, drawing graphics, collecting receipts and subsequent article revisions.
Funding
Heilongjiang Province Philosophy and Social Science Fund Project (21JYE394); Heilongjiang Province Philosophy and Social Science Fund Project (21JYD272); National Social Science Foundation of China (17BJY119).
Conflict of interest
The author declares that the research was conducted in the absence of any commercial or financial relationships that could be construed as a potential conflict of interest.
Publisher’s note
All claims expressed in this article are solely those of the authors and do not necessarily represent those of their affiliated organizations, or those of the publisher, the editors and the reviewers. Any product that may be evaluated in this article, or claim that may be made by its manufacturer, is not guaranteed or endorsed by the publisher.
References
Abdulai, S., Nkegbe, P. K., and Donkoh, S. A. (2013). Technical efficiency of maize production in Northern Ghana. Afr. J. Agric. Res. 8, 5251–5259. doi:10.5897/AJAR2013.7753
Abdulai, S., Nkegbe, P. K., and Donkoh, S. A. (2018). Assessing the technical efficiency of maize production in northern Ghana: The data envelopment analysis approach. Cogent Food Agric. 4, 1512390. doi:10.1080/23311932.2018.1512390
Ahmed, M. H., Tazeze, A., Mezgebo, A., and Andualem, E. (2018). Measuring maize production efficiency in the eastern Ethiopia: Stochastic frontier approach. Afr. J. Sci. Technol. Innovation Dev. 10, 779–786. doi:10.1080/20421338.2018.1514757
Anang, B. T., Alhassan, H., and Abbeam, G. D. (2020). Estimating technology adoption and technical efficiency in smallholder maize production: A double bootstrap DEA approach. Cogent Food Agric. 6, 1833421. doi:10.1080/23311932.2020.1833421
Anupama, J., and Singh RP Kumar, R. (2005). Technical Efficiency in Maize Production in Madhya Pradesh: Estimation and Implications. Agriculture Economics. 18, 305–316. doi:10.22004/ag.econ.58479
Asmara, R., Hanani, N., Syafrial, S., and Mustadjab, M. M. (2016). Technical efficiency on Indonesian maize production: Frontier stochastic analysis (SFA) and data envelopment analysis (DEA) approach. Russ. J. Agric. Socioecon. Sci. 10, 24–29. doi:10.18551/rjoas.2016-10.03
Ayinde, I. A., Aminu, R. O., and Ibrahim, S. B. (2015). Technical efficiency of maize production in Ogun State, Nigeria. J. Dev. Agric. Econ. 7, 55–60. doi:10.5897/jdae2014.0579
Dong, K. Y., Zhao, J., Ren, X. H., and Shi, Y. K. (2022). Environmental regulation, human capital, and pollutant emissions: The case of SO2 emissions for China. J. Chin. Econ. Bus. Stud., 1–25. doi:10.1080/14765284.2022.2106539
Ehsan, H., Hossein, A., Morteza, A., Sheikh Davoodi, M. J., and Witlox, F. (2012). Sustainable and efficient energy consumption of corn production in southwest Iran: Combination of multi-fuzzy and DEA modeling. Energy 44, 672–681. doi:10.1016/j.energy.2012.05.025
Fare, R., Grosskopf, S., Norris, M., and Zhang, Z. (1997). Productivity growth, technical progress, and effciency change in industrialized countries:reply. Am. Econ. Rev. 87, 1040–1044.
Gai, Y. D., Wen, T., Yi, W., and Wang, X. H. (2013). A spatial econometric study on effects of fiscal and financial supports for agriculture in China. Agric. Econ. 59, 315–332. doi:10.17221/126/2012-agricecon
Geta, E., Bogale, A., Kassa, B., and Elias, E. (2017). Productivity and efficiency analysis of smallholder maize producers in southern Ethiopia. J. Hum. Ecol. 41, 67–75. doi:10.1080/09709274.2013.11906554
Hassan, Y., Abdullah, A. M., Ismail, M. M., and Mohamed, Z. (2014). Technical efficiency of maize production in Nigeria: Parametric and NonParametric approach. Asian J. Agric. Rural Dev. 4, 281–291.
He, H. Y., Hu, Q., Li, R., Pan, X. B., Huang, B. X., and He, Q. J. (2020). Regional gap in maize production, climate and resource utilization in China. Field Crops Res. 254, 107830. doi:10.1016/j.fcr.2020.107830
Li, B. J., and Zhu, X. X. (2018). Analysis of maize production efficiency based on DEA-malmquist indexes: A case study of henan province. J. Agric. Chem. Environ. 7, 176–187. doi:10.4236/jacen.2018.74015
Linh, T. T., Nanseki, T., and Chomei, Y. (2015). Productive efficiency of crop farms in Viet Nam: A DEA with a smooth bootstrap application. J. Agric. Sci. (Tor). 7, 37–46. doi:10.5539/jas.v7n5p37
Long, H. L., Ge, D. Z., Zhang, Y. N., Tu, S. S., Qu, Y., and Ma, L. (2018). Changing man-land interrelations in China’s farming area under urbanization and its implications for food security. J. Environ. Manag. 209, 440–451. doi:10.1016/j.jenvman.2017.12.047
Lou, S., Zhang, B. R., and Zhang, D. H. (2021). Foresight from the hometown of green tea in China: Tea farmers’ adoption of pro-green control technology for tea plant pests. J. Clean. Prod. 320, 128817. doi:10.1016/j.jclepro.2021.128817
Mathur, R., and Ramnath, S. R. (2018). Efficiency in food grains production in India using DEA and SFA. Central Eur. Rev. Econ. Manag. 2, 79–101. doi:10.29015/cerem.589
Monga, S., and Sidana, B. K. (2020). Total factor productivity of coarse cereals in India: State-level analysis using Malmquist approach. J. Pharmacogn. Phytochemistry 9, 683–689.
Mwalupaso, G. E., Wang, S. G., Rahman, S., Alavo, E. G., and Tian, X. (2019). Agricultural informatization and technical efficiency in maize production in Zambia. Sustainability 11, 2451. doi:10.3390/su11082451
Pastor, J. T., and Lovell, C. (2005). A global Malmquist productivity index. Econ. Lett. 88, 266–271. doi:10.1016/j.econlet.2005.02.013
Pérez, K., González-Araya, M. C., and Iriarte, A. (2017). Energy and GHG emission efficiency in the Chilean manufacturing industry: Sectoral and regional analysis by DEA and Malmquist indexes. Energy Econ. 66, 290–302. doi:10.1016/j.eneco.2017.05.022
Ray, S. C., and Desli, E. (1997). Productivity growth, technical progress, and efficiency change in industrialized countries: Comment. Am. Econ. Rev. 87, 1033–1039.
Rupnik, R., Kukar, M., Vračar, P., Košir, D., Pevec, D., and Bosnić, Z. (2019). AgroDSS: A decision support system for agriculture and farming. Comput. Electron. Agric. 161, 260–271. doi:10.1016/j.compag.2018.04.001
Tian, W. M., and Wan, G. H. (2000). Technical efficiency and its determinants in China grain production. J. Prod. Analysis 13, 159–174. doi:10.1023/a:1007805015716
Wang, J., Xu, X. H., Wang, H. L., and Yao, F. T. (2010). Growth and decomposition analysis of maize production efficiency in China’s core advantage producing areas. Maize Sci. 18, 133–137. (In Chinese).
Wang, J. R., and Wei, J. Y. (2017). Study on the Reform of Agricultural Supply Side Based on Food Security. Asian Agriculture Research. 9, 8–10. doi:10.22004/ag.econ.262767
Xiang, X. W., Ma, X., Ma, Z. L., Ma, M. D., and Cai, W. G. (2022a). Python-LMDI: A tool for index decomposition analysis of building carbon emissions. Buildings 12, 83–13. doi:10.3390/buildings12010083
Xiang, X. W., Ma, X., Ma, Z. L., and Ma, M. D. (2022b). Operational carbon change in commercial buildings under the carbon neutral goal: A LASSO–WOA approach. Buildings 12, 54–13. doi:10.3390/buildings12010054
Xiang, X. W., Ma, M. D., Ma, X., Chen, L. M., Cai, W. G., Feng, W., et al. (2022c). Historical decarbonization of global commercial building operations in the 21st century. Appl. Energy 322, 119401. doi:10.1016/j.apenergy.2022.119401
Yan, R., Xiang, X. W., Cai, W. G., and Ma, M. D. (2022). Decarbonizing residential buildings in the developing world: Historical cases from China. Sci. Total Environ. 847, 157679. doi:10.1016/j.scitotenv.2022.157679
Yu, X., Sun, J., Sun, S., Yang, F., Lu, Y., Wang, Y., et al. (2019). A comprehensive analysis of regional grain production characteristics in China from the scale and efficiency perspectives. J. Clean. Prod. 212, 610–621. doi:10.1016/j.jclepro.2018.12.063
Zhang, D. H. (2020). The innovation research of contract farming financing mode under the block chain technology. J. Clean. Prod. 270, 122194. doi:10.1016/j.jclepro.2020.122194
Zhang, L., Pang, J. X., Chen, X. P., and Lu, Z. M. N. (2019). Carbon emissions, energy consumption and economic growth: Evidence from the agricultural sector of China’s main grain-producing areas. Sci. Total Environ. 665, 1017–1025. doi:10.1016/j.scitotenv.2019.02.162
Zhang, D. H., Wang, H. Q., and Lou, S. (2021a). Research on grain production efficiency in China’s main grain producing areas from the perspective of grain subsidy. Environ. Technol. Innov. 22, 101530. doi:10.1016/j.eti.2021.101530
Zhang, D. H., Wang, H. Q., Lou, S., and Zhong, S. (2021b). Research on grain production efficiency in China’s main grain producing areas from the perspective of financial support. Plos One 16, e0247610. doi:10.1371/journal.pone.0247610
Zhang, S. F., Ma, M. D., Xiang, X. W., Cai, W. G., Feng, W., and Ma, Z. L. (2022). Potential to decarbonize the commercial building operation of the top two emitters by 2060. Resour. Conserv. Recycl. 185, 106481. doi:10.1016/j.resconrec.2022.106481
Zhao, J. F., Guo, J. P., Xu, Y. H., and Mu, J. (2015). Effects of climate change on cultivation patterns of spring maize and its climatic suitability in Northeast China. Agric. Ecosyst. Environ. 202, 178–187. doi:10.1016/j.agee.2015.01.013
Zhao, Y. Z., Jiang, Q. X., and Wang, Z. L. (2019). The system evaluation of grain production efficiency and analysis of driving factors in Heilongjiang province. Water 11, 1073. doi:10.3390/w11051073
Zhao, J. R., and Wang, R. H. (2013). Development process, problem and countermeasure of maize production in China. J. Agric. Sci. Technol. 15, 1–6.
Keywords: financial support, maize production efficiency, major grain producing areas, global malmquist index, China
Citation: Lou S (2022) The analysis of the spatio-temporal differentiation characteristics of total factor productivity of maize: Introducing the perspective of financial support. Front. Environ. Sci. 10:995576. doi: 10.3389/fenvs.2022.995576
Received: 03 August 2022; Accepted: 24 October 2022;
Published: 04 November 2022.
Edited by:
Kangyin Dong, University of International Business and Economics, ChinaReviewed by:
Minda Ma, Lawrence Berkeley National Laboratory, United StatesXiwang Xiang, Chongqing University, China
Copyright © 2022 Lou. This is an open-access article distributed under the terms of the Creative Commons Attribution License (CC BY). The use, distribution or reproduction in other forums is permitted, provided the original author(s) and the copyright owner(s) are credited and that the original publication in this journal is cited, in accordance with accepted academic practice. No use, distribution or reproduction is permitted which does not comply with these terms.
*Correspondence: Sha Lou, 102896@hrbcu.edu.cn