Assessment of riverbank filtration performance for climatic change and a growing population
 Ismail Abd-Elaty
 Alban Kuriqi
 Hala M. Ganayem1
  Ashraf Ahmed
- 1Water and Water Structures Engineering Department, Faculty of Engineering, Zagazig University, Zagazig, Egypt
- 2Civil Engineering Research and Innovation for Sustainability, Instituto Superior Técnico, Universidade de Lisboa, Lisbon, Portugal
- 3Civil Engineering Department, University for Business and Technology, Pristina, Kosovo
- 4Department of Civil and Environmental Engineering, Brunel University London, Sussex, United Kingdom
- 5Department of Civil Engineering: Hydraulics, Energy and Environment, Universidad Politécnica de Madrid, Madrid, Spain
Riverbank filtration (RBF) consists of green drinking water production in many regions and is used as a pre-treatment phase. This study investigates the performance of the RBF in the Nile delta, Egypt, for climate change and population growth scenarios of 2030, 2040, and 2050. This study presents a new method for predicting the sharing of riverbanks considering three cases: i) the river stage controlling the water levels in the river, ii) increasing RBF pumping, and iii) changing the groundwater levels. This last scenario is achieved by changing the general head in the MODFLOW model. The results showed that RBF sharing (RBFS) is a proportion of the river leakage inflow, in which the decrease of the river stage due to the influence of climate change reduced the river leakage inflow and RBFS. In addition, increasing RBF pumping, decreasing RBF pumping, and lowering the groundwater levels due to the increase in the future drinking water pumping for the population growth increased the river leakage inflow and RBFS. Finally, combining the three cases decreased RBFS in the coming years of 2030, 2040, and 2050, respectively, due to more groundwater sharing than the river inflow. The results show that the water budget is a good tool to investigate RBFS compared with MT3D results. This technique can reduce the cost of water quality collection and analysis; moreover, it will help with the estimation of RBF and save time compared with solute transport modeling.
1 Introduction
Water is essential for survival; clean fresh water is necessary for drinking, sanitation, cultivating crops, animals, and industry, andestablishing and sustaining the ecosystems on which all live (Obaideen et al., 2022). The demand for water supply is constantly increasing in Egypt, which might be due to increasing urbanization or population growth. This coincides with a shortage of current resources as Egypt falls below the water poverty line, according to the WWAP (2018). As a result of global warming, changes in the moisture and radiation balances, including the average, lowest, and highest temperatures, and precipitation levels, are anticipated. The global climate projections and their regional transformation still include much uncertainty (Kumar, 2012).
The Nile River is the major source of surface water in Egypt and provides 55.5 billion cubic meters of water per year [BCM/yr.], which accounts for approximately 82.1% of the country’s water resources (El-Atfy, 2007). Surface water provides around 91.4% of Egypt’s drinking water, while groundwater and desalination contribute 8.3% and 0.24%, respectively (HCWW, 2017). Egypt’s surface and groundwater are deteriorating rapidly due to increased pollution discharges from agricultural, domestic, and industrial effluents into its conduits (Ahmed and Ali, 2011). The Nile water is polluted by three forms: agricultural runoff and drainage, including pollutants from pesticides and herbicides, industrial and household effluents carrying hazardous heavy metals and suspended particles, and sewage. The third is that ferries and ships regularly discharge oil waste and other toxins (Ghannam, 2021).
Moreover, approximately 65% of the industrial water demands are provided by the Nile River, whereas the effluents returning to the Nile are more than 57% (MWRI, 2013). High turbidity is created by receiving torrents from the desert border during severe rainstorms (HCWW, 2017). The appearance of an oil slick in 2010 from industrial wastewater plants at Edfu city in Aswan along a 6-km stretch demonstrated the history of Nile calamities (MWRI, 2013). Other spills were recorded in 2012, when an old boat burnt near the coast in the south of Isna with an area covering approximately 1.05 km2 (Al-Masry, 2012; Ewida, 2014), and leakage of pesticides from Kafr El-Zayat industries in Kafr El-Sheikh, Rashid branch, resulted in the death of a considerable quantity of fish. Effluents from the Kima Plant and the Elsayel drain in Aswan have recently been identified as additional causes of Nile pollution.
Riverbank filtration (RBF) is an environmentally beneficial method of pre-treatment of direct drinking water supply using aquifer sediments as a natural filter. River water flows via natural pores in the riverbed and aquifers created by water abstraction from pumping wells. The water quality of the infiltrating water (bank filtrate) is enhanced by adsorption, filtration, and biodegradation processes (Abd-Elaty et al., 2022). For more than a century, it has been used in Europe for water treatment or pre-treatment (Doussan et al., 1997) because of its ability to eliminate by-product precursors and pathogens, such as Giardia and Cryptosporidium. This system is approved as a supplementary water source for municipal and industrial applications in Germany, India, the United States, Thailand, and Switzerland (Weiss et al., 2003; Pholkern et al., 2015).
Climate change has a two-fold impact on global warming, which is especially visible during the ripening period. However, the intensity and frequency of extreme climate events, such as heavy rainfalls, floods, and droughts, will increase, elevating the possibility of pollution incidents and complicating water–environment risk prevention (Santos et al., 2020). Climate change has a significant impact on the RBF system. RBF evaluated the impact of climate change on the production of safe drinking water in the Lower Rhine Valley, Germany. It was shown to have both quantitative and qualitative impacts (Covatti and Grischek, 2021). During periods of low river water, the capacity of RBF wells decreases.
Moreover, decreased discharge into the river is associated with increased concentrations of some chemicals. The change of raw water composition for the next technical treatment stage must be addressed, in addition to the higher water temperatures affecting the hydrogeochemical processes during RBF (Eckert et al., 2008). This study aims to predict and investigate the RBF share (RBFS) using limited numerical simulation models by investigating the water budget compared to field examinations at the Embaba site in Egypt. The study used visual MODFLOW, the base-case water zone budget, river-phase scenarios, and RBF and aquifer pumping rates.
2 Materials and methods
2.1 Study area
Figure 1A presents the selected study area of the Embaba site, Giza Governorate, Egypt. It is located between latitude 30 ̊ 06′–30 ̊ 07′ N and longitude 31 ̊ 12′–31 ̊ 13′ E. This drinking water site covers approximately 4 km2 and provides water for more than 8 million people (Capmas, 2020). The climate of the study area is moderate, where the average annual relative humidity is 55.8%, the average daily temperature ranges between 12°C and 31°C in January and July, respectively, the rainfall is less than 40 mm year-1, and evaporation reaches 15 mm day-1 (Mahmoud, 2014). Concerning total water supplies. Climate change predictions indicated that its trends would decrease and there would be more chances for flash floods (MWRI, 2013). The average land levels are ranged between 17 and 20 m above the mean sea level (masl) to reach 23 m at the western boundary; the eastern boundary is the Nile River branch with an average bed level of 8.8 (masl).
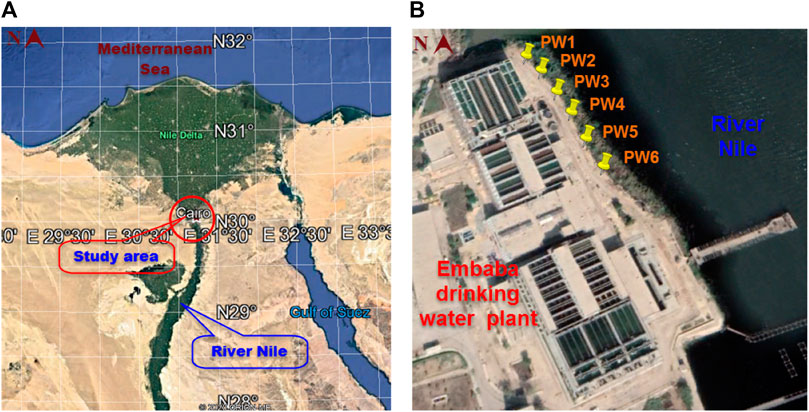
FIGURE 1. Study site location: (A) Egypt map and (B) RBF location.
2.1.1 Study area population
The population of Egypt reached 101 million in January 2020 (Capmas, 2020). It is considered the most populous country in the Middle East, the third most populous country in the African continent, and the fourteenth in the world. Cairo, Giza, and Alexandria are the main cities in the country and elsewhere along the banks of the Nile Valley, the Nile Delta, and the Nile. These areas occupy approximately 4% of the country’s area. They are among the most densely populated regions globally, with a population density of approximately 1,500 per capita km-2.
Figure 2 presents Egypt’s population over the years, reaching 26.63, 34.51, 43.31, 56.13, 82.76, 102.30, and 104.30 million. In addition, the population growth rates reached 2.70%, 2.40%, 2.40%, 2.40%, 1.90%, 2%, 1.90%, and 1.90% in the years 1960, 1970, 1980, 1990, 2000, 2010, 2020, and 2021, respectively (Figure 2). Egypt’s projected population is estimated to be 124, 149, and 180 million in 2030, 2040, and 2050, respectively. The water consumption is estimated using 200 liters-1 capita-1 day-1 to reach 5.33, 6.90, 8.66, 11.23, 13.77, 16.55, 20.46, and 20.86 BCM year-1. Giza is one of the most populated and the second most populous governorates in terms of population. The population will reach 9.30 million in 2021 and is expected to be 11, 13, and 16 million in the years 2030, 2040, and 2050, respectively. Population growth rates reached 1.90%. The population increase was 18%, 43%, and 73% from the baseline case in 2021.
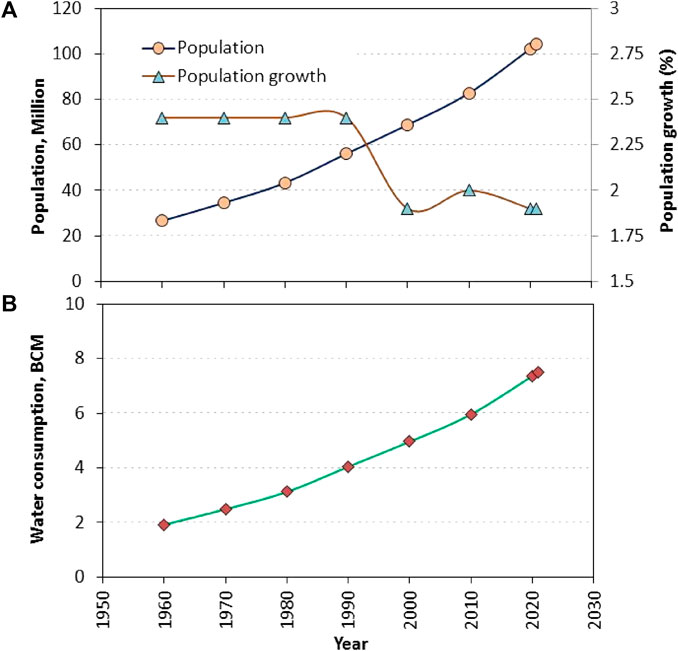
FIGURE 2. Egypt’s population and water consumption. (A) Population, million. (B) Water consumption, BCM.
2.1.2 Geology setting
Two geological formations compose the current study area. The first is the Bilqas Formation at the upper layer with fine to medium-grained sand, silt, and clay interbeds. This formation was established in the Holocene. The second is the Mit-Ghamr Formation at the lower layer, including organic matter and peat beds (Said, 2017). The current RBF site at Embaba locates in the quaternary aquifer of the Nile Delta, where the aquifer thickness ranges from 800 m in the north to 200 m in Cairo (RIGW, 1992). The thickness of the Holocene deposit is approximately 77 m (Stanley, 1990). Its sediments are alternating sand, silt, and clay beds. The quaternary deposits are represented by the Nile sediments, occasionally covered by a thin layer of wind-blown sands. The sediments constitute variable proportions of sands, clays, and gravels of variable thicknesses (Sallouma, 1983).
2.1.3 Hydrogeological systems
The Nile River represents surface water in the study area 940 km from the Aswan old dam that lies in the east (Figure 1). The river hydrograph ranges from 16 m to 16.40 m AMSL according to Embaba water plant measurements, and the river width ranges from 200 m to 400 m to reach 350 m at the site of the study area (Ghodeif et al., 2016). The river peak discharge reaches approximately 6.97 BCM month-1 in July, with the lowest discharge occurring in January with 2.54 BCM month-1. Hasan et al. (2021) studied the changes in total water storage (TWS) during the 20th century and future projections in the Nile River Basin. The study showed remarkable wet periods in 1917, 1924, 1930 to 1940, 1964, 1989, 2000, 2007, 2014, and 2020. Between 2021 and 2050, the future water storage deficit record indicated fewer dry conditions relative to normal and slightly wetter conditions and a reduction between 10% and 30% in total water storage.
The main hydrogeological stratum of the study area is a quaternary aquifer, which consists of graded sand and gravel with intercalations of clay lenses at different depths. The flow to the aquifer depends on the Nile River at the source of the delta barrages, and its flow is generally in a northern direction due to overpumping. The groundwater heads are lower in the east (the Marg) and the west (Giza pyramids) due to the provision of water to the El Remaya club and the golf club. The abstraction wells by the Remaya Club and the golf club in the southwest are lowering the groundwater heads and keeping the flow direction toward the west (El-Arabi et al., 2013). The hydraulic conductivity of the aquifer decreases toward the south and west, where the vertical conductivity of the Holocene deposits ranges between 0.001 and 0.01 m day-1 (Laeven, 1991). The quaternary hydraulic prosperities as vertical [kv] and horizontal [kh] hydraulic conductivity, specific yield, storage coefficient, transmissivity, and total and effective porosity are shown in Table 1.
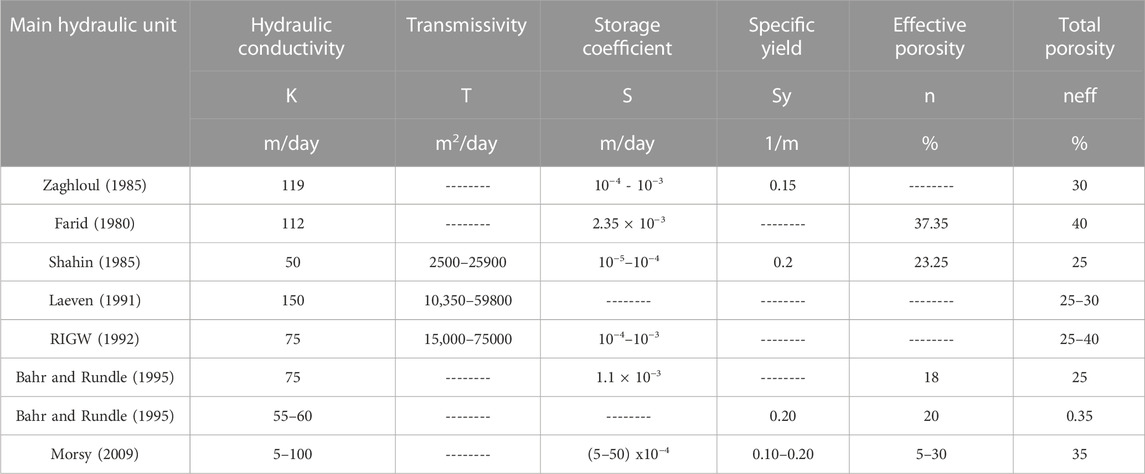
TABLE 1. Hydraulic parameters of the quaternary Nile Delta aquifer.
The annual abstraction rates in the Nile Delta reached 1.60, 2.60, 3.02, 3.50, and 7 billion cubic meters (BCM) in 1980, 1991, 1999, 2003, and 2016, respectively (RIGW, 1992, 2003; Morsy, 2009; Molle et al., 2016). Trends of the abstraction rate increased by 0.10 BCM year-1 until 2003 and increased to 0.20 BCM year-1 from 2003 to 2010. The future abstraction rates were estimated to reach 8.20, 9.65, and 11.09 BCM in the years 2030, 2040, and 2050 increasing by 33%, 56%, and 79% from the current base case (2021), respectively, based on the regression (Figure 3B). The water quality of this aquifer shows variations of salinity ranging from less than 1,000 to 1,000 ppm, while the river Nile TDS value is close to 260 ppm (Omran, 2019).
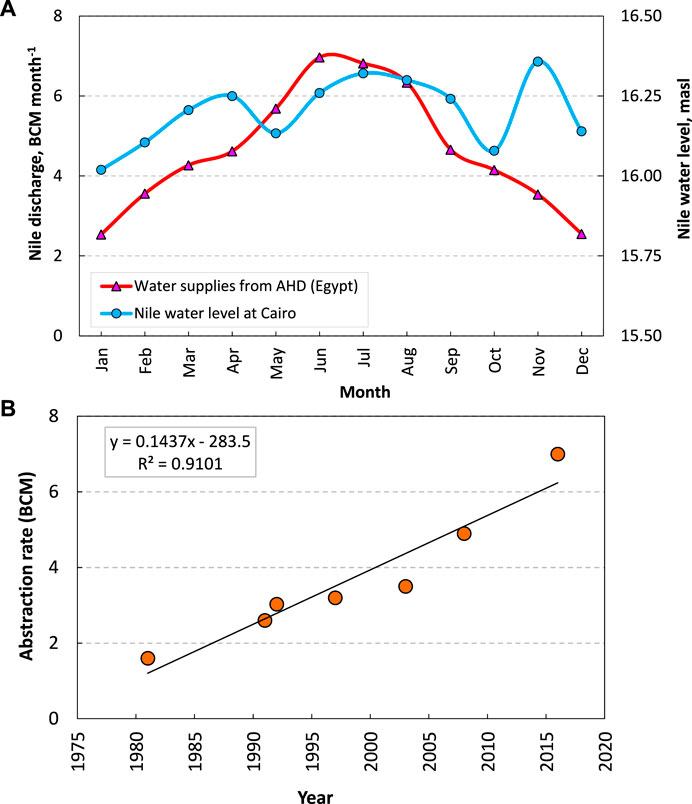
FIGURE 3. Abstraction wells rates in the Nile Delta aquifer. (A) Nile discharge, BCM month-1. (B) Abstraction rate (BCM).
2.2 Embaba riverbank filtration
The Embaba water plant was constructed in phases from 1985–1999 to 2005 on Corniche El Nil Street. The design capacity is 900,000 m3 day-1, while the production capacity is 1,130,040 m3 day-1, and the future plan is to add 400,000 m3 day-1 in two phases. The first phase is over 2 years, and the amount of filtered water is estimated to be 1,276,367 m3day-1. The feeding water supply areas are Warraq, Imbaba, Dokki, Mohandessin, and some villages adjacent to the service areas.
The Holding Company for Water and Wastewater drilled six pumping wells at the current RBF site at Embaba, Nile Delta, Egypt, close to the river Nile in 2015 (HCWW, 2017). The RBF depth is 54 m, having diameters of 450 mm with a discharge of 150 m3h-1 for each well, and the distances between the wells and the river shoreline are from 10 m to 15 m. In addition, the total capacity ranges from 14,000 m3day-1 to 21,000 m3day-1, as shown in Figure 4 (Ghodeif et al., 2016).
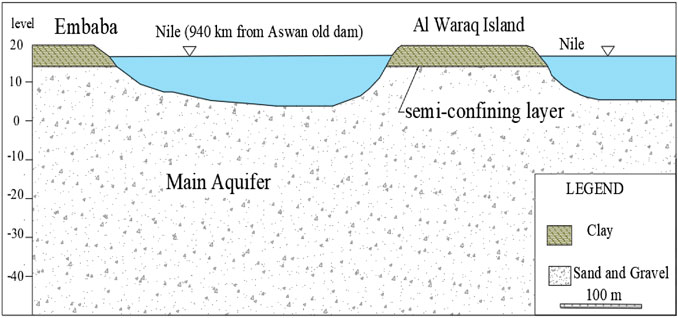
FIGURE 4. Hydrogeologic cross-section East-West shows the clay-cap semi-confining layer, main aquifer after Ghodeif et al. (2018).
2.3 Groundwater flow and the contaminant transport model
The partial-differential groundwater flow equation is used in visual MODFLOW (McDonald and Harbaugh, 1988), as shown in Eq. (1):
Here, Kxx, Kyy, and Kzz are hydraulic conductivity values along the x, y, and z coordinate axes [LT-1], respectively. h is the potentiometric head [L]. SS is the specific storage of the porous material [L-1]. t is time [T]. q is the volumetric flux per unit volume representing source/sink terms, with q < 0.0 for the outflow of the ground water system and q > 0.0 for the inflow [T-1].
The numerical model of the MT3D code was used to simulate RBF. The following partial differential equation describes the solute mass transport in groundwater (Zheng and Bennett, 1995), as shown in Eq. (2):
Here, Ck is the concentration of species k [MLˉ³], Ɵ is the porosity [-], t is time [T], Du is the hydrodynamic dispersion coefficient [L2Tˉ1], Vi is the seepage or linear water velocity [LTˉ1], qs is the volumetric flux of water per unit volume [Tˉ1],
2.3.1 Design and setup of the model
The visual mudflow model was applied in the current study area to cover a square area of 90000 m2 [300 m length × 300 m width]. Figure 5A presents the study domain divided into 60 columns and 60 rows, six layers where the first layer thickness is 5.8 m (the clay cap), and the other layers are the quaternary aquifer with a thickness of approximately 42 m.
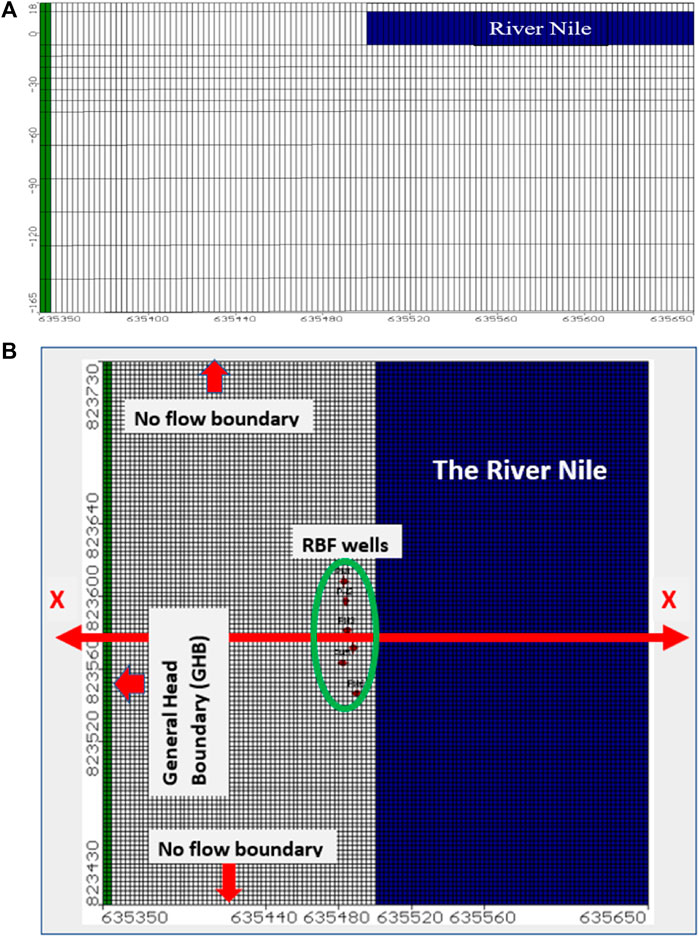
FIGURE 5. (A) Study area digitizing and boundary conditions for sections X–X (upper figure) and (B) the aerial view (lower figure).
2.3.2 Boundary conditions and hydraulic parameters
The river package was used to assign the river boundary conditions, where the water level was assigned to be 16.15 AMSL. The real slope of the water surface was estimated to be 0.02%. Moreover, a no-flow boundary was assigned at the northern and southern boundaries. A general head boundary (GHB, Cauchy BC) along the western model boundary was assigned to represent the unaffected groundwater head and starts from 16.14 to 16.12 (m.a.s.l), considering the natural groundwater slope was assigned 0.083% (Figure 5) (Table 2).
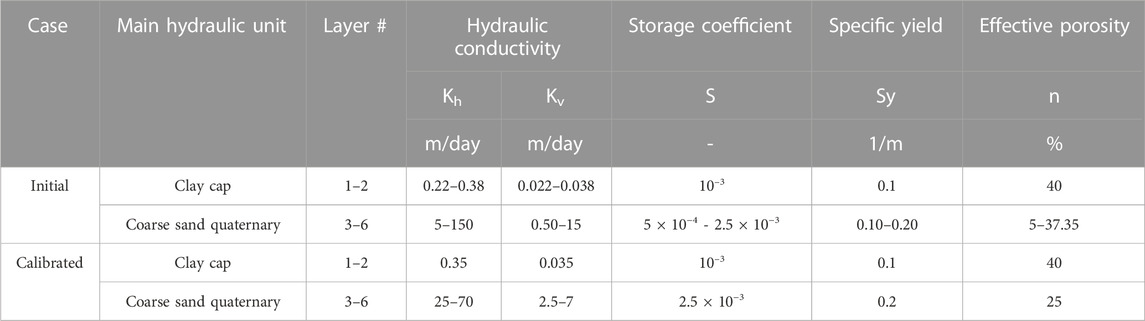
TABLE 2. Initial and calibrated hydraulic parameters of the study area.
The total abstraction from the current area reached 150 m3hr-1–21,600 m3 day-1, while the average net recharge is 0.5 mm day-1 (Abd-Elaty et al., 2020). A constant concentration of 260 ppm was assigned along the river boundary, while the initial concentration was set at 1,000 ppm (Morsy, 2009; Al-Agha et al., 2015).
2.3.3 Model calibration
The study area model calibration was carried out by comparing the calculated head from the simulation with the measured field data from the observation wells using the piezometric contour map in Greater Cairo developed by El-Arabi et al. (2013). This step was developed by changing the aquifer hydraulic conductivity using trial and error to reach a good match between the model results and field data. Figure 6A shows the relationship between the calculated and observed heads. The residual ranges between 0.001 m and 1.431 m, the mean residual is 0.114 m, the absolute residual mean is 0.243 m, the standard error of the estimate is 0.044 m, the root means square [RMS] and the normalization RMS are 0.374 m and 7.477%, respectively, and the correlation coefficient is 94%.
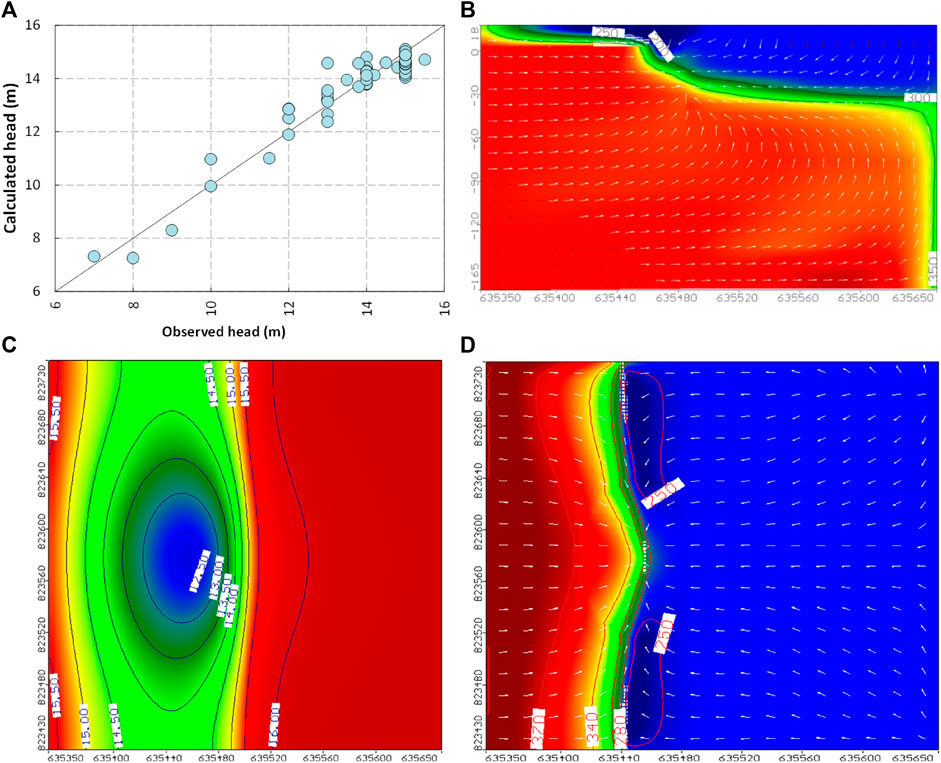
FIGURE 6. Model calibration results for the base case for (A) calculated vs. observed head, (B) map of Head and path line, (C) map view of TDS contamination, and (D) vertical cross section for distribution of TDS.
The groundwater heads in the study area range between 13 and 15 (m.a.s.l) (Figure 6C). In addition, the TDS in the study area ranges between 250 and 350 ppm at layer #2 and is presented in Figures 6B, D.
2.3.4 Model of water budget
One of the important results from the model calibration is water balance for hydrological processes. The main components of the groundwater system are the constant head, general head, well extraction, river, drain, recharge, lake seepage, stream leakage, and change in aquifer storage; these parameters are estimated using the zone budget code in visual MODFLOW. Figure 7A shows the zone budget of inflow and outflow of the study area model with the total inflow and outflow; the general head inflow is 15,164 m3day-1, recharge is 45 m3day-1, the canal leakage inflow is 6,289 m3day-1, and the total inflow is 21,498 m3day-1. In comparison, the total outflow is 21,600 m3day-1, and the difference between the total inflow and the total outflow is 102 m3day-1.
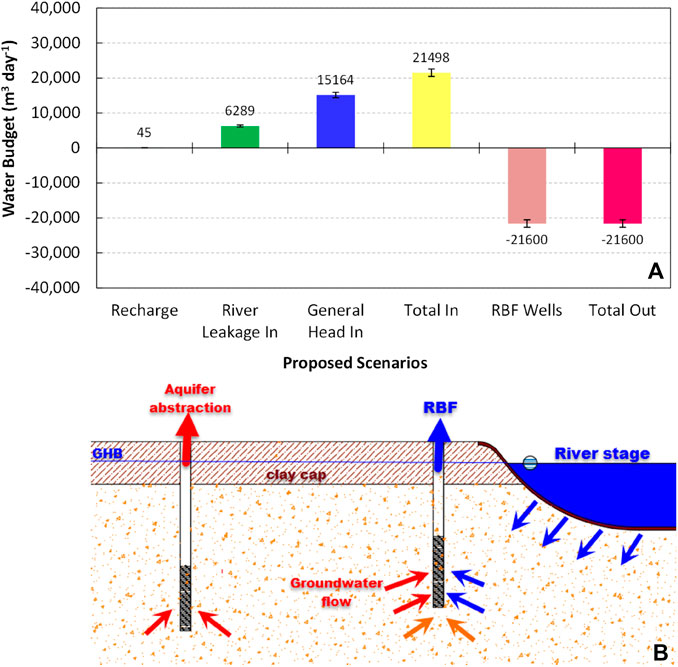
FIGURE 7. (A) Calibrated water balance components in Nile Delta aquifer, and (B) RBF cross-section at Embaba and definition of model cases.
2.4 RBF sharing
The riverbank filtration share (RBFS) in percent was calculated using the mean values of TDS for groundwater [GW], river water (Dawoud et al., 2005), and pumped water [RBF]. RBFS was calculated using Eq. (3).
Here, [TDS]GW is the concentration of TDS in the aquifer around the pumping well, [TDS]RBF is the concentration of TDS in pumped water due to using a filter, and [TDS] River is the concentration of TDS in the surface water or river. The calculated RBFS reached 69% using the mean values of TDS for groundwater at 1,000 ppm, pumped water at 304 ppm, and the river at 260 ppm.
2.5 Proposed scenarios
The model was developed for three cases and included different scenarios to assess the impacts of the interaction between surface water and groundwater on the water zone budget (WZB) and the share of bank filtrate [RBFS]. Figure 7B shows the three cases. The first is the river stage, which happens by reducing the river hydrograph by 10%, 20%, and 30% to reach the levels of (15.44), (14.70), and (13.97) AMSL by 2030, 2040, and 2050, respectively, compared with (16.16) AMSL at the base case. The second scenario is increasing the RBF pumping rates by 18%, 43%, and 73% as the expected abstraction due to overpopulation reaching 25,488 m3 day-1, 30,888 m3 day-1, and 37,368 m3 day-1 by 2030, 2040, and 2050, respectively (Table 3).
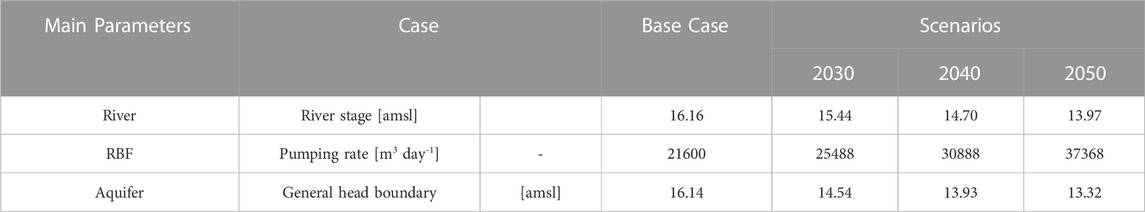
TABLE 3. Defined scenarios for pumping rates and aquifer parameters.
The third is increasing aquifer pumping due to future demand by 33%, 56%, and 79% by 2030, 2040, and 2050, respectively; the model GHB, assigned to study the influence of groundwater on the zone water budget, changed to (14.54), (13.93), and (13.32) a.m.s.l, compared with (16.14) at the base case.
3 Results
The impact of the river stage due to climate change, the aquifer abstraction rates due to increasing water demands for agriculture, industrial and domestic applications, and the RBF overpumping due to overpopulation and increasing water consumption were the cases considered in this study on water budget and RBFS.
3.1 Impact of the river hydrograph on WZB and the RBF portion
In this stage, four cases were investigated by changing the river stage and starting from level (16.15) to (15.44) and (14.70) to (13.97) a.m.s.l. due to a decrease in the river hydrograph by 10%, 20%, and 30% by 2030, 2040, and 2050, respectively (Figure 8).
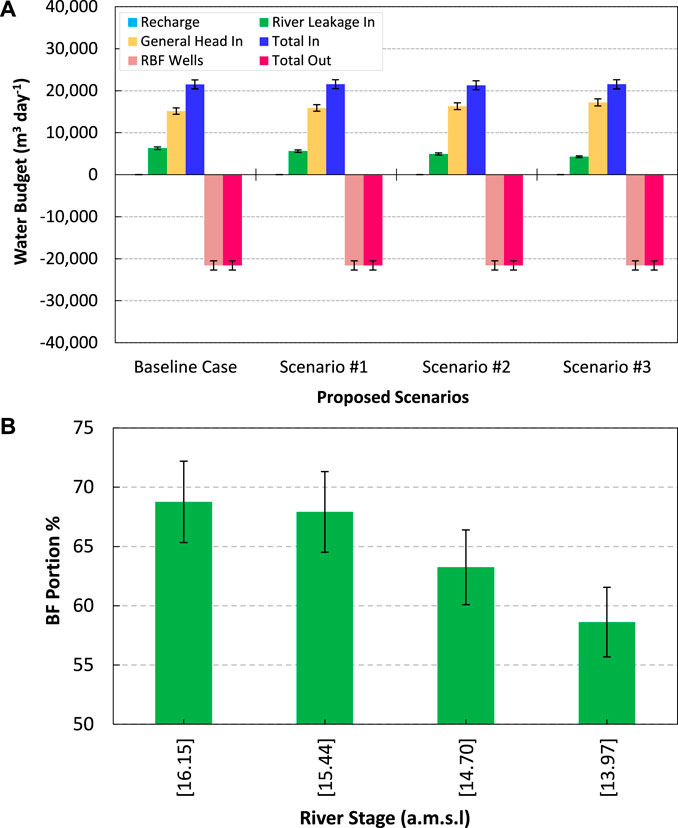
FIGURE 8. Relationship between the river stage with (A) WZB and (B) RBFS.
Figure 8B presents the results of this stage on the WZB. At the same time, the well’s abstraction and the flow to the aquifer remained constant at 21,600 m3day-1 and 45 mm day-1, respectively. The canal leakage decreased to 5,627, 4,937, and 4,278 m3day-1 compared with 6,289 m3day-1 at the base case. The general head inflow increased to 15,890, 16,320, and 17,207 m3day-1 compared with 15,164 m3day-1 at the base case. The total inflow reached 21,562, 21,302, and 21,529 m3day-1, respectively, compared with 21,498 m3day-1. The total outflow reached 21,600 m3day-1 for all cases.
Moreover, the RBF portion reached 67%, 63%, and 58%, respectively, compared with 69% in the base case (Figure 8B). The results indicated that decreasing the river hydrograph decreased the canal leakage inflow by the river and increased the general head inflow by groundwater sharing. This agrees with the model results, where the RBFs are decreased.
3.2 Impact of the general head on WZB and the RBF portion
The stage was simulated by increasing RBF well pumping by 18%, 43%, and 73% from the current base case (2021) in 2030, 2040, and 2050 to reach 25,488, 30,888, and 37,368 m3 day-1 (Figure 9) due to the expected overpopulation by 2030, 2040, and 2050, respectively, compared with 21,600 m3day-1 at the base case.
FIGURE 9. Relationship between RBF pumping with (A) WZB and (B) RBFS.
In this stage, WZB for the flow to the aquifer remained constant at 45 m3day-1. RBF pumping was increased to 25,488 m3day-1, 30,888 m3day-1, and 37,368 m3day-1 compared with 21,600 m3day-1, and the river leakage was increased to 7,430, 9,012, and 10,910 m3day-1 compared with 6,289 m3 day-1 at the base case (Figure 9A).
The general head inflow increased to 17,956, 21,774, and 26,379 m3day-1 compared with 15,164 m3day-1 at the base case. The total inflow reached 25,431, 30831 and 37,334 m3day-1, respectively, compared with 21,498 m3day-1, while the total outflow reached 21,600 m3day-1 for all cases. The results of WAB are good compared with the MT3D of RBF, where the RBFS reached 70%, 72%, and 75% compared with 68% in the base case (Figure 9B).
3.3 Impact of aquifer pumping on WZB and the RBF portion
The model GHB shows a decline of 1.60 m, 2.21 m, and 2.82 m to reach the level of (14.54), (13.93), and (13.32) a.m.s.l. compared with (16.14) at the base case (Figure 10). This reduction in the groundwater level is due to the expected aquifer abstraction rate increase by 33%, 56%, and 79% by 2030, 2040, and 2050, respectively. The modeling results showed that WZB for the RBF pumping rates and flow to the aquifer remained constant at 21,600 m3day-1 and 45 m3day-1, respectively. The river leakage increased to 7,750, 8,308, and 8,860 m3day-1 compared with 6,289 m3day-1 at the base case. The general head inflow decreased to 13,682, 13180, and 12,609 m3day-1 compared with 15,164 m3day-1 at the base case. The total inflow reached 21,477, 21,533, and 21,514 m3day-1, respectively, compared with 21,498 m3 day-1, while the total outflow reached 21,600 m3day-1 for all cases (Figure 10A). The results of WAB are good compared with the MT3D of RBF, where the RBFS reached 80%, 83%, and 86% compared with 68% in the base case (Figure 10B).
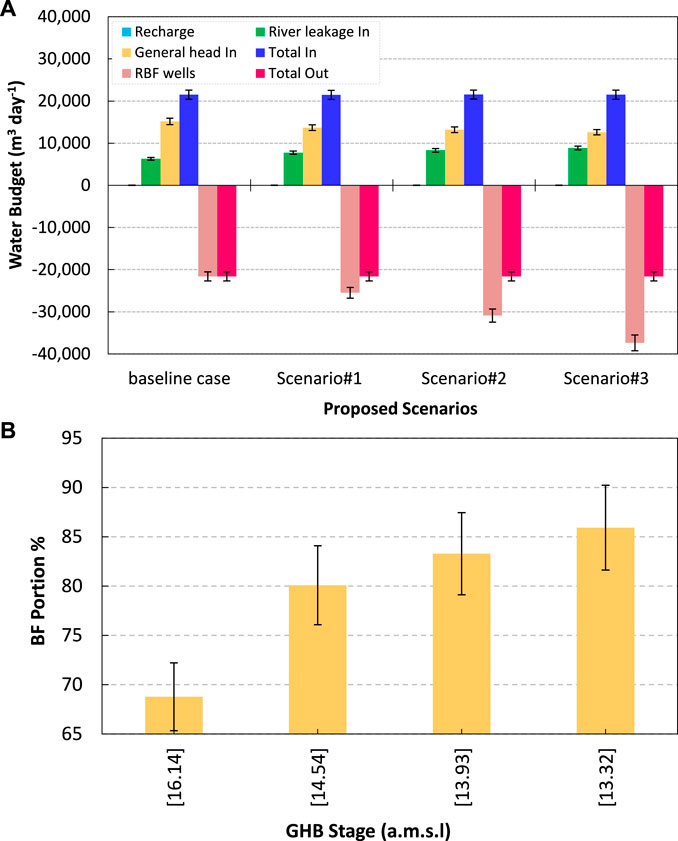
FIGURE 10. Relationship between GHB with (A) WZB and (B) RBFS and.
3.4 Impact of the combination scenario on WZB and the RBF portion
The model was simulated for three cases in the years 2030, 2040, and 2050 by changing the river stage and starting from level (16.16) to (15.44) and (14.70) to (13.97) a.m.s.l. (Figure 11). The RBF was increased by 18%, 43%, and 73% to reach 25,488, 30,888, and 37,368 m3 day-1, respectively, compared with 21,600 m3 day-1 at the base case. The GHB was a decline by 1.60 m, 2.21 m, and 2.82 m to reach the level of (14.54), (13.93), and (13.32) a.m.s.l., respectively, compared with (16.14) at the base case.
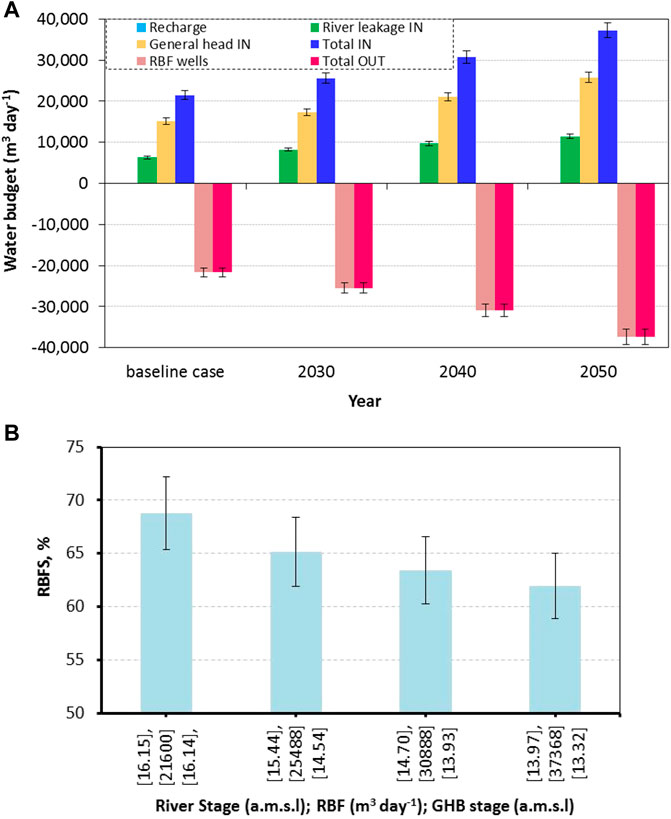
FIGURE 11. Relationship between (A) WZB and GHB and (B) RBFE and combination of scenarios.
The WZB is presented in Figure 11A; the results showed that the flow to the aquifer remained constant at 45 m3 day-1. The RBF pumping was increased to 25,488 m3 day-1, 30,888 m3 day-1, and 37,368 m3 day-1 compared with 21,600 m3 day-1, and the river leakage was increased to 8,232, 9,684, and 11463 m3 day-1 compared with 6,289 m3 day-1 at the base case. The general head inflow increased to 17,280, 21,060, and 25,761 m3 day-1 compared with 15,164 m3 day-1 at the base case. The total inflow reached 25,557, 30,789, and 37,269 m3 day-1 compared with 21,498 m3 day-1, while the total outflow reached 25,488, 30,888, and 37,368 compared with 21,600 m3 day-1 for all cases. The RBFS decreased and reached 65%, 63%, and 61% compared with 68% at the base case; this agrees with the WAB results, where the aquifer heads were lowered, and the sharing of the aquifer was increased (Figure 11B).
4 Discussion
Decreasing the river hydrograph by 10%, 20%, and 30% by 2030, 2040, and 2050, respectively, decreased the canal inflow to 5,627, 4,937, and 4,278 m3day-1 compared to 6,289 m3day-1 at the base case. Moreover, the RBF portion reached 67%, 63%, and 58% compared with 69% in the base case. Increasing the RBF well pumping by 18%, 43%, and 73% from the current base case, the river leakage was increased to 7,430, 9,012, and 10,910 m3day-1, and the RBFS reached 70%, 72%, and 75%. The GHB decline by 1.60 m, 2.21 m, and 2.82 m led to the increase in the river leakage to 7,750, 8,308, and 8,860 m3day-1. In addition, the RBFS reached 80%, 83%, and 86%. Combining the three cases increased the river leakage to 8,232, 9,684, and 11,463 m3day-1. Moreover, the general head inflow was increased to 17,280, 21,060, and 25,761 m3day-1 compared with 15,164 m3day-1 at the base case. The RBFS decreased and reached 65%, 63%, and 61% due to the reduction of river sharing and increasing the sharing of the aquifer.
River hydrology, hydrogeological conditions, and the aims for water withdrawal are influenced by the siting and design of RBF systems (Fukada et al., 2003). Lee et al. (2012) used numerical simulation and pumping tests to evaluate the impact of well structure and pumping rates on the extraction efficiency of the RBF system near the Nakdong River at Daesan-myeon at the northwestern border of Changwon City, Korea. The result indicated that the distance between the RBF well and the river is estimated as the volume of filtered river water. Abdalla and Shamrukh (2016) indicated that the simulation and modeling software can make an actual visualization of RBF and help in overcoming some of the problems. Grischek and Paufler (2017) indicated that using wells’ continuous well operation decreased the iron and manganese concentrations over longer periods in Torgau and Dresden, Germany. Rossetto et al. (2020) applied numerical modeling to assess the changes in recharge from the river to the aquifer to construct RBF infrastructure along the Serchio River in Lucca, Italy. Wang et al. (2020) showed that increasing the permeability connection between the canal and aquifer increased the bank filtration sharing by 23% due to the canal reconstruction for the abstracted water near the waterworks. Abd-Elaty et al. (2021c) showed that the reduction in the river stages and the aquifer abstraction well rates had lowered the portions of bank filtrate, while the high productivity of RBF wells increased the RBF. Shebl et al. (2021) showed that the surface water quality, the aquifer hydraulic characteristics, and the RBF system, including well number, distances, and abstraction rates, influence the RBF sharing. Pholkern et al. (2015) and Jaramillo et al. (2019) evaluated RBF systems using numerical and experimental models to simulate pesticide removal. Kazak and Pozdniakov (2021) applied numerical simulations in Voronezh, Russian Federation, to reveal the potential source of iron in groundwater pumped through riverbank wells. The current study’s limitations relate to applying field investigation at the different river stages, RBF system, and aquifer abstraction rates and estimating the water budget and RBF sharing.
5 Conclusion
Bank filtering is widely used worldwide; it is used to supply water to industries and municipalities. Riverbank filtration (RBF) performance is studied using the technique of water budget, considering the climatic changes and over population, a case study at the Embaba site, Egypt. The results of the groundwater flow and solute transport using visual MODFLOW and MT3D showed that a combination of the three cases by reducing the river stage, increasing the RBF pumping, and declining the groundwater levels using the general head boundary led to the river leakage being increased to 8,232, 9,684, and 11,463 m3day-1 compared to 6,289 m3day-1 at the base case. Moreover, the general head inflow was increased to 17,280, 21,060, and 25,761 m3day-1 compared with 15,164 m3day-1 at the base case. RBFS decreased and reached 65%, 63%, and 61% due to the reduction of river sharing and increasing the sharing of the aquifer.
The solution-oriented findings resulting from this study might serve as a useful reference for investigating the performance of RBFS in other study cases using water budget modeling, which can reduce the cost of water quality collection and analysis, the time of the simulation run, and that required to investigate the RBF of the simulation using the solute transport model.
Data availability statement
The original contributions presented in the study are included in the article/Supplementary Material; further inquiries can be directed to the corresponding authors.
Author contributions
IA-E, HG, and OS: Conceptualization, Methodology, Investigation, Formal analysis, Data curation. IA-E, AK, HG, AA, and OS, Visualisation, Writing–original draft, Resources. IA-E, AK, AA, and LG: Supervision, Writing–review & Editing. All authors contributed to the article and approved the submitted version.
Acknowledgments
The authors are thankful to the Department of Water and Water Structures Engineering, Faculty of Engineering, Zagazig University, Zagazig 44519, Egypt, for constant support during the study. AK is grateful for the Foundation for Science and Technology’s support through funding UIDB/04625/2020 from the research unit CERIS.
Conflict of interest
The authors declare that the research was conducted in the absence of any commercial or financial relationships that could be construed as a potential conflict of interest.
Publisher’s note
All claims expressed in this article are solely those of the authors and do not necessarily represent those of their affiliated organizations, or those of the publisher, the editors, and the reviewers. Any product that may be evaluated in this article, or claim that may be made by its manufacturer, is not guaranteed or endorsed by the publisher.
References
Abd-Elaty, I., Ghanayem, H. M., Zeleňáková, M., Mésároš, P., and Saleh, O. K. (2021a). Numerical investigation for riverbank filtration sustainability considering climatic changes in arid and semi-arid regions; case study of RBF site at Embaba, nile delta, Egypt. Sustainability 13 (4), 1897. doi:10.3390/su13041897
Abd-Elaty, I., Javadi, A. A., and Abd-Elhamid, H. (2021c). Management of saltwater intrusion in coastal aquifers using different wells systems: A case study of the nile delta aquifer in Egypt. Hydrogeology J. 29 (5), 1767–1783. doi:10.1007/s10040-021-02344-w
Abd-Elaty, I., Pugliese, L., Zelenakova, M., Mesaros, P., and Shinawi, A. E. (2020). Simulation-based solutions reducing soil and groundwater contamination from fertilizers in arid and semi-arid regions: Case study the eastern nile delta, Egypt. Int. J. Environ. Res. Public Health 17 (24), 9373. doi:10.3390/ijerph17249373
Abd-Elaty, I., Saleh, O. K., Ghanayem, H. M., Grischek, T., and Zelenakova, M. (2021b). Assessment of hydrological, geohydraulic and operational conditions at a riverbank filtration site at Embaba, Cairo using flow and transport modeling. J. Hydrology Regional Stud. 37, 100900. doi:10.1016/j.ejrh.2021.100900
Abd-Elaty, I., Saleh, O. K., Ghanayem, H. M., Zeleňáková, M., and Kuriqi, A. J. F. i. E. S. (2022). Numerical assessment of riverbank filtration using gravel back filter to improve water quality in arid regions. Nile Delta, Egypt: Case Study of RBF Site at Embaba, 10.
Abdalla, F., and Shamrukh, M. (2016). Quantification of River Nile/Quaternary aquifer exchanges via riverbank filtration by hydrochemical and biological indicators, Assiut, Egypt. J. Earth Syst. Sci. 125 (8), 1697–1711. doi:10.1007/s12040-016-0755-1
Ahmed, A. A., and Ali, M. H. (2011). Hydrochemical evolution and variation of groundwater and its environmental impact at Sohag, Egypt. Arabian J. Geosciences 4 (3-4), 339–352. doi:10.1007/s12517-009-0055-z
Al-Agha, D. E., Closas, A., and Molle, F. (2015). Survey of groundwater use in the central part of the Nile Delta. Water and salt management in the Nile Delta: Report (6).
Al-Masry, A. Y (2012). Sugar factory - naga hammad - head of oil spill leakage. Available at: https://www.dostor.org/96146.
Bahr, D. B., and Rundle, J. B. (1995). Theory of lattice Boltzmann simulations of glacier flow. J. Glaciol. 41 (139), 634–640. doi:10.3189/s0022143000034948
Covatti, G., and Grischek, T. (2021). Sources and behavior of ammonium during riverbank filtration. Water Res. 191, 116788. doi:10.1016/j.watres.2020.116788
Dawoud, M. A., Darwish, M. M., and El-Kady, M. M. (2005). GIS-based groundwater management model for Western Nile Delta. Water Resour. Manag. 19 (5), 585–604. doi:10.1007/s11269-005-5603-z
Doussan, C., Poitevin, G., Ledoux, E., and Detay, M. (1997). River bank filtration: Modeling of the changes in water chemistry with emphasis on nitrogen species.
Eckert, P., Lamberts, R., and Wagner, C. (2008). The impact of climate change on drinking water supply by riverbank filtration. Water Sci. Technol. Water Supply 8 (3), 319–324. doi:10.2166/ws.2008.077
El-Arabi, N., Fekri, A., Zaghloul, E., and Elbeih, S. (2013). Laake A. Assessment of groundwater movement at Giza pyramids plateau using GIS techniques. J. Appl. Sci. Res. 9, 4711–4722.
El-Atfy, H. (2007). Integrated national water resources plan in Egypt. Egypt: Ministry of Water Resources and Irrigation, Alexandria Governorate.
Ewida, A. (2014). Oil spills: Impact on water quality and microbial community on the Nile River, Egypt. Int. J. Environ. 3 (4), 192–198.
Fukada, T., Hiscock, K. M., Dennis, P. F., and Grischek, T. (2003). A dual isotope approach to identify denitrification in groundwater at a river-bank infiltration site. Water Res. 37 (13), 3070–3078. doi:10.1016/S0043-1354(03)00176-3
Ghannam, H. E. (2021). Risk assessment of pollution with heavy metals in water and fish from River Nile, Egypt. Appl. Water Sci. 11 (7), 125. doi:10.1007/s13201-021-01449-7
Ghodeif, K., Grischek, T., Bartak, R., Wahaab, R., and Herlitzius, J. (2016). Potential of river bank filtration (RBF) in Egypt. Environ. Earth Sci. 75 (8), 671. doi:10.1007/s12665-016-5454-3
Ghodeif, K., Paufler, S., Grischek, T., Wahaab, R., Souaya, E., Bakr, M., et al. (2018). Riverbank filtration in Cairo, Egypt—part I: Installation of a new riverbank filtration site and first monitoring results. Environ. Earth Sci. 77 (7), 270. doi:10.1007/s12665-018-7450-2
Grischek, T., and Paufler, S. (2017). Prediction of iron release during riverbank filtration. Water [Online] 9 (5), 317. doi:10.3390/w9050317
Hasan, E., Tarhule, A., and Kirstetter, P.-E. (2021). Twentieth and twenty-first century water storage changes in the Nile river basin from grace/grace-fo and modeling. Remote Sens. 13 (5), 953. doi:10.3390/rs13050953
Jaramillo, M., Grischek, T., Boernick, H., and Velez, J. I. (2019). Evaluation of riverbank filtration in the removal of pesticides: An approximation using column experiments and contaminant transport modeling. Clean Technol. Environ. Policy 21 (1), 179–199. doi:10.1007/s10098-018-1627-y
Kazak, E. S., and Pozdniakov, S. P. (2021). Field study and reactive simulation of iron migration in groundwater during the riverbank filtration. Appl. Geochem. 124, 104817. doi:10.1016/j.apgeochem.2020.104817
Kumar, C. (2012). Climate change and its impact on groundwater resources. Int. J. Eng. Sci. 1 (5), 43–60.
Laeven, M. (1991). Hydrogeological study of the Nile Delta and adjacent desert areas, Egypt, with emphasis on hydrochemistry and isotope hydrology. Amsterdam, Netherlands: Free University of Amsterdam.
Lee, E., Hyun, Y., Lee, K.-K., and Shin, J. (2012). Hydraulic analysis of a radial collector well for riverbank filtration near Nakdong River, South Korea. Hydrogeology J. 20 (3), 575–589. doi:10.1007/s10040-011-0821-3
Mahmoud, S. H. (2014). Investigation of rainfall–runoff modeling for Egypt by using remote sensing and GIS integration. Catena 120, 111–121. doi:10.1016/j.catena.2014.04.011
McDonald, M. G., and Harbaugh, A. W. (1988). A modular three-dimensional finite-difference ground-water flow model. VA: US Geological Survey Reston.
Morsy, W. (2009). Environmental management to groundwater resources for Nile Delta region. Egypt: PhD, Cairo University.
MWRI (2013). Proposed climate change adaptation strategy for the ministry of water resources and irrigation in Egypt. Joint programme for climate change risk management in Egypt.
Obaideen, K., Shehata, N., Sayed, E. T., Abdelkareem, M. A., Mahmoud, M. S., and Olabi, A. G. (2022). The role of wastewater treatment in achieving sustainable development goals (SDGs) and sustainability guideline. Energy Nexus 7, 100112. doi:10.1016/j.nexus.2022.100112
Omran, E.-S. E. (2019). “Land and groundwater resources in the Egypt's Nile Valley, delta, and its fringes,” in Groundwater in the nile delta. Editor A. M. Negm (Cham: Springer International Publishing), 45–103.
Pholkern, K., Srisuk, K., Grischek, T., Soares, M., Schäfer, S., Archwichai, L., et al. (2015). Riverbed clogging experiments at potential river bank filtration sites along the Ping River, Chiang Mai, Thailand. Environ. Earth Sci. 73 (12), 7699–7709. doi:10.1007/s12665-015-4160-x
Ramla, T., Salsan, K., Saranya, S., and Sasikala, D. (2014). Groundwater flow modelling of KCAET campus using visual modflow. Tavanur, India: Department of Irrigation and Drainage Engineering, Kelappaji College of Agricultural Engineering & Technology. Available at: http://14.139.181.140:8080//jspui/handle/123456789/242.
RIGW (1992). Hydrogeological map of Egypt. Cairo: Institute for Groundwater, National Water Research Center, El-Kanater al-Khieria.
Rossetto, R., Barbagli, A., De Filippis, G., Marchina, C., Vienken, T., and Mazzanti, G. (2020). Importance of the induced recharge term in riverbank filtration: Hydrodynamics, hydrochemical, and numerical modelling investigations. Hydrology 7 (4), 96. doi:10.3390/hydrology7040096
Sallouma, M. (1983). “Hydrogeological and hydrogeochemical studies east of Nile Delta,”. Unpublished doctoral dissertation (Cairo, Egypt: Faculty of Science, Ain Shams University).
Santos, J. A., Fraga, H., Malheiro, A. C., Moutinho-Pereira, J., Dinis, L.-T., Correia, C., et al. (2020). A review of the potential climate change impacts and adaptation options for European viticulture. Appl. Sci. 10 (9), 3092. doi:10.3390/app10093092
Shebl, A., Abdel Wahaab, R., Elazizy, I., and Hagras, M. (2021). Hydraulic performance of riverbank filtration: Case study west sohag, Egypt. Water Supply 22 (1), 294–308. doi:10.2166/ws.2021.273
Stanley, D. J (1990). Recent subsidence and northeast tilting of the Nile delta, Egypt. Mar. Geol. 94 (1-2), 147–154. doi:10.1016/0025-3227(90)90108-v
Wang, W.-s., Oswald, S. E., Gräff, T., Lensing, H.-J., Liu, T., Strasser, D., et al. (2020). Impact of river reconstruction on groundwater flow during bank filtration assessed by transient three-dimensional modelling of flow and heat transport. Hydrogeology J. 28 (2), 723–743. doi:10.1007/s10040-019-02063-3
Weiss, W. J., Bouwer, E. J., Ball, W. P., O'Melia, C. R., Lechevallier, M. W., Arora, H., et al. (2003). Riverbank filtration—Fate of DBP precursors and selected microorganisms. Journal-American Water Works Assoc. 95 (10), 68–81. doi:10.1002/j.1551-8833.2003.tb10475.x
Wwap, (2018). "The united nations world water development report 2018", in: Nature-based solutions for water. (Paris, UNESCO. UN-Water).
Zaghloul, M. G. (1985). Flow distribution through groundwater aquifer of the Nile Delta. MSc thesis. Alexandria: Faculty of Engineering, Alexandria University.
Keywords: river stages, pumping, constant heads, riverbank filtration, water budget and water quality
Citation: Abd-Elaty I, Kuriqi A, Ganayem HM, Ahmed A, Saleh OK and Garrote L (2023) Assessment of riverbank filtration performance for climatic change and a growing population. Front. Environ. Sci. 11:1136313. doi: 10.3389/fenvs.2023.1136313
Received: 02 January 2023; Accepted: 02 May 2023;
Published: 22 May 2023.
Edited by:
Yu Wu, Tianjin University, ChinaReviewed by:
Daniel A. Ayejoto, Texas Christian University, United StatesMustafa El-Rawy, Minia University, Egypt
Copyright © 2023 Abd-Elaty, Kuriqi, Ganayem, Ahmed, Saleh and Garrote. This is an open-access article distributed under the terms of the Creative Commons Attribution License (CC BY). The use, distribution or reproduction in other forums is permitted, provided the original author(s) and the copyright owner(s) are credited and that the original publication in this journal is cited, in accordance with accepted academic practice. No use, distribution or reproduction is permitted which does not comply with these terms.
*Correspondence: Ismail Abd-Elaty, eng_abdelaty2006@yahoo.com; Ashraf Ahmed, Ashraf.ahmed@brunel.ac.uk