Taking advantage of water scarcity? Concentration of agricultural land and the politics behind water governance in Chile
 Rodrigo Perez-Silva1,2*
  Mayarí Castillo2,3,4
- 1Department of Agricultural Economics, Pontificia Universidad Católica de Chile, Santiago, Chile
- 2Center for the Integrated Development of Territories (CEDIT), Santiago, Chile
- 3Centro de Economía y Políticas Sociales, Facultad de Ciencias Sociales y Artes, Universidad Mayor, Santiago, Chile
- 4Center For Intercultural and Indigenous Research (CIIR), Santiago, Chile
Chile is currently facing a major drought that has caused several problems, most of them concentrated in terms of the availability of water for both human consumption and irrigation for agriculture. Under such conditions, the main instrument the government has at hand to assign water for agricultural use is the Water Scarcity Decree (WSD), which, among other aspects, allows for the extraction of underground water. However, this practice requires an important investment from the agricultural producer, making it only affordable by relatively larger producers. Therefore, under the current climatic conditions and a generalized lack of water, larger agricultural producers are the ones who benefit the most from the establishment of a WSD and thus have the incentives to use their political power to pressure for its issuing. Whereas conventional wisdom suggest that this is indeed the case, there is no previous evidence trying to link the size of agricultural exploitations and the likelihood of the establishment of a WSD. In the paper we use the share of large exploitations at the municipality level, as a measure that can proxy for local political power, and the establishment, the number, and duration of WSD within any given year. Consistent with the hypothesis, our results show that areas dominated by larger producers/exploitations are more likely to be declared as water scarce, to have more decrees in a year, and to have them in place for longer periods of time, even after controlling for socioeconomic characteristics and climatic conditions, such as precipitations and water flow.
1 Introduction
Water scarcity is currently one of the major issues facing humanity, causing several economic and developmental impacts, and threatening, among other aspects, human consumption and food production (Wheeler and von Braun, 2013; Liu et al., 2017; Tol, 2018). While this issue has been concerning humanity for decades, current estimates of the impact climate change is generating to the availability of water, makes this an even more pressing issue. For instance, even in the absence of climate change it has been estimated that around 44% of the global population or more than 3.2 billion people would have faced water scarcity in 2020, percentage that is expected to reach 53% by 2050, only due to an increase in population (Gosling and Arnell, 2016). The increase in the number and severity of droughts registered (Mukherjee et al., 2018) and expected for coming years (Strzepek et al., 2010) makes this scenario even more concerning.
In Latin America and the Caribbean, climate change is causing several impacts, as mean temperatures are projected go up by an average of 4.5° across the region, with altered precipitations, an increase in droughts, aridity, a sea level rise, and tropical storms (Reyer et al., 2017). Moreover, while Latin America has one of the largest shares of the planet’s water, it is one of the most unequal regions in terms of its access. This is further aggravated in scenarios such as the one face by several countries of the region, including Chile, country that is currently experiencing a sustained drop in precipitation, referred to here as “the megadrought”.1 In this context, differences in access to water have amplified significantly and have had substantial implications regarding water justice, as vulnerable populations and territories have suffered most of the costs associated with water scarcity and have experienced a marked reduction in water availability.
For the case of Chile, one of the main consequences of climate change has been an intensification in the number and severity of droughts over the last decades. As such, between 2008 and 2015, seventy-five of Chile’s 101 river basins were declared as suffering from water scarcity (Centro de Ciencia del Clima y la Resiliencia 2, 2015), almost all of them in the north and center of the country, poles of mining and agricultural development. Whereas, this reduced access to water has become a key issue for food production and agriculture everywhere (Vallino et al., 2020), at least for the case of Chile, the effects of droughts and water scarcity have not been evenly distributed across agricultural producers and the population, and local scholars debate as to what extent this is not just a random undesirable outcome. The key point here is the dynamics of agro-export extractivism in Chile: the configuration and strengthening of this sector in Chile were closely linked to the concentration of land and water in a few hands. Additionally, these sectors received direct support from the state in the incorporation of irrigation technology and water accumulation, specifically oriented to the expansion of certain crops, very demanding in water and export oriented (Budds, 2016). Thus, water management is a key piece in the formation of the agro-export sector, promoted by the state (Budds, 2012; Madariaga et al., 2021) and water scarcity one of the key issue that challenges the continuity of this extractive industry. In fact, a major concern for Chile has been the way in which the policies regarding water governance are potentially magnifying the inequality in access to water (i.e., allocating more water resources to larger agricultural producers instead of for human consumption or small farmers) (see Donoso, 2015; Donoso, 2018, for a review). In such a context, extensive research has been done on the role played by various aspects of the Chilean Water Code in terms of the unequal allocation of water resources (Yáñez and Molina, 2008; Budds, 2009; Larraín, 2012; Molina, 2012; Jordan et al., 2023). However, the same cannot be said about state mechanisms that, through managing scarcity, could also be establishing conditions that reproduce or amplify the inequalities in access to water.
It follows that water scarcity and the unequal distribution of the effects of the droughts might not only be a climatic or economic problem, but also one that deals with the politics behind the governance of water. We base our analysis on the concept of the hydro-social cycle, a concept that implies recognizing water as an ecological entity that interrelates with economic cycles that politicize it (Bakker, 2003; Swyngedouw, 2015). Using the classical Weber’s power definition: “Power is the ability to exercise one’s will over others” (Weber. 1978), we understand the governance of water and its different actors as a disputed legal, political, and institutional framework that has been modified over time and is the product of power inequalities between the different actors involved. These differentials of power acquire greater visibility in a context of scarcity, such as the one that has marked central Chile in recent decades.
To address this, we focus on one of the most relevant mechanisms in the configuration of the hydro-social cycle in territories suffering from water crises in Chile: the Water Scarcity Decrees (WSDs). The WSDs are legal tools issued by the Presidency of the Chilean Government under the technical recommendation of the Directorate General of Water (DGA in its Spanish acronym). They suspend ordinary regulation of water2 and the powers of water organizations in extremely critical moments. When a territory is subject to the WSD, user organizations are no longer responsible for water distribution; it is the state that is responsible for enforcing private water rights3. Among these powers is the authorization of the use of groundwater, the building of wells, and the suspension of ecological flows, to name a few (Budds, 2016). Given its extraordinary powers, this decree is designed to last only 6 months; however, it has become so recurrent in the last decade that some territories have been subject to it continuously for years.
Moreover, it seems that the WSD tends to favor the use of water for large agricultural producers. For example, data analysis for the case of Chile shows that the regions of Maule and Coquimbo, where a substantial number of agribusinesses and subsidies for efficient irrigation management are concentrated, are also the regions where the WSDs have been massively and continually applied, often for more than the regulatory 6 months4. This is relevant in the context of water shortages that threaten the survival of these agricultural activities.
The reasoning behind this coincidence seems to be that such a mechanism could be attractive to certain sectors that have the technical and economic capacity to exploit aquifers or suspend ecological flows, as allowed by the WSD. Therefore, it could be hypothesized that there is a relationship between the WSD (and its extensions beyond the regulatory 6 months), and the overexploitation of the water basins. Moreover, having established that there are at least incentives for large producers to seek the establishment of the WSD in the areas where they produce, it seems straightforward to think that it might exist an association between the share of large producers, their political power and influence, and the WSD. However, to date, there are no documented studies on these potential associations and the impact of these decrees in the unequal allocation of water resources, especially in the context of water scarcity.
This manuscript attempts to identify the association between the establishment of WSD by the government and the size of the local producers, as a measure that proxies for local political power, using the Weber’s power definition (Weber. (1978) and understanding the correlation between political, ecological and sociocultural projects playing a role in water resources dispute; also management and access to such a critical asset (Swyngedouw, 2015). We see it as the most effective way to set out this local political power with the available data. To do this, we use data from the Chilean Irrigation National Commission (CNR in Spanish), the General Direction of Water (DGA in Spanish), the 2007 Agricultural Census of Chile and information on precipitations and water flows for the 2008–2019 period from the Center for Climate and Resilience Research (CR2). We focus our study in Chile´s central zone, between Coquimbo and Maule (excluding the Metropolitan Region of Santiago), where most of the agricultural activity takes place, and test whether municipalities where production is dominated by larger producers and exploitations are more likely to being declared as water scarce areas, and whether these decrees last longer.
Our main results show that not only municipalities with large exploitations are more likely to be declared as water scarce areas, but also that the duration of these decrees tends to be longer, even when controlling for water availability variables (standardized water flow and precipitation indices). Overall, these results seem to suggest the existence of an important local political power that significantly influences the implementation of the water policy, since both the establishment and duration of the decrees cannot be explained by climatic characteristics or other sociodemographic factors.
The rest of the paper is organized as follows. Section 2 highlights the main aspects of the governance of water in Chile and the local political power associated with the existence of large agricultural producers. Section 3 describes the data and methods used to test the hypotheses presented. Section 4 presents the main results and Section 5 concludes.
2 A brief explanation of Chile’s water governance
This study takes the Code DFL-1122 enacted in 1981 as a general framework. This code is important because as it is the legal framework currently in force and it marks the historical change in the way water is conceived in Chile. This is, moving from being considered a public good to a private one. This legal framework structured a water market in the country, with its consequent effects in terms of inequality of ownership and access to water (Bauer, 2004; Bauer, 2015; Correa et al., 2020). The code currently shapes water governance in Chile by establishing a series of institutions relevant to this study such as the Directorate General of Water and organizations of water users.
From the enactment of this legal instrument, although water is recognized as a national good of public use, the state has granted exploitation rights to private parties in perpetuity, at first only with legal registration, at no cost, and without the need to prove its productive use (Fernández, 2019). In a context of information asymmetry and speculation, several groups were and continue to be excluded from the process and access to water. For instance, rural and indigenous populations have had great difficulties properly registering the waters they have traditionally used, thus creating scenarios of water rights being concentrated only in certain users, typically large agricultural producers. As an example, 71% of the volume of water transferred is used for irrigation and just 1% of the water right holders account for 79% of all the water available in the system (Correa et al., 2020).
A highly relevant issue that makes this legal framework unique in the world is that the legislation definitively separates land ownership from water rights and establishes at the same time two types of water rights5: surface and ground (Donoso et al., 2020). This is relevant in the first place because it allows speculation and hoarding of water rights without productive purposes: a legal person or individual does not necessarily have to own land to obtain water rights, and, on the other hand, it is possible to own land without access to the watercourses that run through it. Secondly, the separation between surface water rights and groundwater rights is fundamental when dealing with the phenomenon of scarcity, as it does not consider the water cycle as an integrated phenomenon involving surface flows and the recharge of aquifers and water bodies in general. The difference between these two types of rights in times of crisis has led to the overexploitation of river basins (Duran-Llacer et al., 2020).
The water code was modified in some respects during 2005; however, none of these changes modified aspects related to water property rights. In this context, WSDs are the only legal tool that allows suspending the water property regime in times of crisis. However and whereas WSDs are important because they are designed for short crises, they also expand the access of those with water rights beyond the capacities of the basins through two specific mechanisms: first, the suspension of the ecological surface flow of rivers, which means that it is possible to use all the water brought by a basin for private purposes; and second, the decree allows access to groundwater without the need for legally constituted rights, which directly benefits those producers with the resources and technical capacity to extract water using deep wells, affecting the recharge of aquifers, and increasing the stress on the river basins. Thus, during times of droughts, those who already have the water rights and those with access to resources to extract groundwater are probably the most benefited, creating the economic incentives for them to pressure in favor of a WSD.
3 Data and methods
Our main data source is the administrative register of the WSDs applied in Chile during the 2008–2019 period. For data consolidation and comparability purposes, we work at the municipality level. However, it is important to note that some of the declarations are made at the basin level, case in which we have selected the municipalities within each basin to assign the declarations. Something similar holds for declarations issued at the Provincia (a conglomerate of municipalities) and regional level (similar to states in USA).
We complement this information with data on the number of producers and size of exploitations from the Agricultural Census of20076 and on income and employment from the CASEN household surveys. In the case of CASEN, for our period of analysis we have data only for years 2009, 2011, 2013, 2015, and 2017, so we have repeated the data for the missing years (e.g., data from 2009 was also used for 2008 and 2010, whereas data from 2011 was used for 2012 as well).7
Data on precipitations and river flows comes from the DGA and the Center for Climate and Resilience Research (CR2). This information is acquired at the basin level and matched to represent municipalities contained in each basin. When data for more than one station for a given municipality is available, we computed the average of all stations within the municipality. A similar procedure was used when a municipality is comprised of more than one basin. Here, instead of simply using the level of precipitations and water flow, we use the standardized indices of both variables, which are measures of deviation in levels with respect to the means for each respective basin. They are also, according to the aforementioned law, the only technical variables that the authorities should consider when issuing a WSD.
As mentioned, our unit of information is the municipality-year. We started with a total of 4,131 municipality-year observations for the country as a whole, out of which 828 have had at least one water scarcity declaration over the 2008–2019 period (around 20%). For our area of interest (regions of Coquimbo, Valparaiso, O’Higgins and Maule) we had 1,373 municipality-year observations, out of which 703 (around 51%) have had at least one declaration. However, our final dataset with full information on precipitations, water flows and socioeconomic conditions is of 1,244 municipality-year observations, 266 with at least one WSD (21.4%), for the whole country, and 443 observations for the Coquimbo-Maule region.
Our interest is to estimate whether the chances of a municipality being declared as water scarce is associated with local agricultural productive capacity. In particular, we want to determine whether municipalities with larger exploitations are more likely to be declared as water scarce areas, after we control for several climatic and socioeconomic indicators. Our initial basic model is
Where the outcome is a dummy variable which takes the value of one when a water scarcity declaration has been issued for municipality
A second model follows the same specification presented in Eq. 1, but instead of using a dichotomous variable to differentiate between areas with no declaration and those where at least one declaration has been issued, we use a continuous variable measuring 1) the number of declarations for any given year, and 2) the number of days in which a municipality had been under the declaration for a given year. In these cases, we use both a linear regression model and a negative binomial model, given that an important proportion of the sample has zero declarations and 0 days under water scarcity declaration. However, for simplicity we report results from a standard OLS model, given the fact that whereas OLS models could fail in produce a precise estimate of the effect, they do provide consistent estimates, similar to those usually encountered in a logit/probit model (Wooldridge, 2010).
The reader should note that in Eq. 1 we do not include region fixed-effects. The reason for not using region dummies is the little variation within every region-year in terms of number of decrees and their length.8 Nonetheless, additional estimates using region dummies were computed successfully, yielding similar results in terms of direction and magnitude, but reducing the number of significant parameters (because of the almost inexistent variation within a region-year). These additional results are available upon request.
To define large producers, we use information from the Agricultural Census, regarding the size of the exploitations. Specifically, we compute the percentage of exploitation of at least 100 ha with respect to the total hectares used for agriculture. According to the Ministry of Agriculture’s Office of Studies and Agricultural Policies (ODEPA in Spanish), around 7.6% of agricultural land is under management of producers with at least 100 ha of more, and only 2% with surfaces of at least 500 ha (ODEPA, 2019). However, given that there is not a strict definition of what should be considered a ‘large producer’, we have considered two other measures: 1) the percentage of exploitations of at least 500 ha, and 2) those of at least 2,000 ha. Results are generally presented for the definition of 100 ha, but other estimations, which yield basically the same results, are also presented and discussed in the final tables.
Our analysis relies on the orthogonality between the existence of large exploitations (the percentage of them) and the likelihood of a drought that causes the generation of a water scarcity declaration (under the perhaps naive assumption that WSDs are not influenced by the existence of large producers). However, as hypothesized it could be the case that large producers tend to randomly concentrate in water scarce areas or that, because larger exploitations are concentrated in certain areas, those areas are under a more severe pressure for water and reducing river flows and producing the water scarce declaration. If this is the case, this is, if large producers are precisely located in water scarce areas, we would be only capturing the association between water scarcity and the likelihood or number of water scarce declarations, which, if the policy is well implemented, should be positive.
Nonetheless, if the policy only obeys the technical criteria, the WSD should always be declared when the minimum thresholds of precipitation and water flows (the standardizes indices) are met, and moreover, they should be extended to every municipality where the conditions are met, regardless of the size of the producers. To assess this aspect, our preferred estimations include controls for precipitations (unlikely to be affected by the size of exploitations) and basins’ water availability.
4 Results
Before diving into the main estimates, it is worth providing a broad picture of the trends in terms of WSDs over time in Chile. Nationally the number of declarations has increased over time, from 70 in 2008 to 180 in 2019. The year 2019 represents a 61% increase with respect to 2018 and a 157% increase with respect to 2008, the initial year in our data. When looking at the situation in the Coquimbo-Maule area the pattern is very similar, with a 53% increase in the number of decrees between 2019 and 2018, and a 210% increase in the same variable between 2019 and 2008. It is important to notice that for the year 2019, 158 out of the 180 total declarations issued in that year (around 88%) are concentrated in our area of interest (Coquimbo-Maule). This percentage has remained high over the whole period studied, with peaks of 97% in 2011 and lows of 73% in the initial years of our dataset (2008 and 2009).
Now moving closer to the research question, Figure 1 compares the share of large exploitations with respect to the declaration issuing for both, the rest of the country (in the left-hand size of the graphic) and the area of interest (right hand size). From here we conclude that areas where at least one declaration has been issued in any given year tend to be larger in size in both cases, although differences are small in means. In Figure 2, however, differences are more marked as the number of declarations issued in any given year increases with the share of large exploitations in the municipality. This is, municipalities with larger shares of large exploitations are more likely to be declared as water scarce areas or, more specifically, to have multiple water scarcity declarations during any given year. In fact, the only possibility for a municipality to have three water scarcity declarations within a year is by being produced only by large exploitations. Looking at the Coquimbo-Maule area, the average share of large exploitations is 96% for municipalities with three water scarcity declarations.
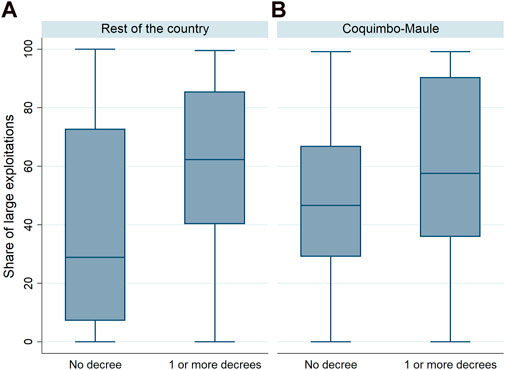
FIGURE 1. Share of large exploitations (100 ha or more) according to the issue of a declaration, Rest of the country (A) and Coquimbo-Maule area (B). Source: own calculations based on CNR data.
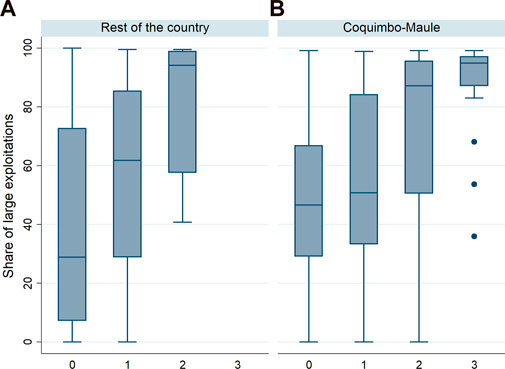
FIGURE 2. Share of large exploitations (100 ha or more) according to the number of declarations issued, Rest of the country (A) and Coquimbo Maule area (B). Source: own calculations based on CNR data.
It is important to note that most of the variation in terms of WSDs comes from the regions of Coquimbo and Valparaiso, with fewer days under WSD in Maule, and almost none in O’Higgins for many of the years considered (Figure 3). This is something that it would be important to pay attention to when analyzing our main results and the differences in impacts across regions.
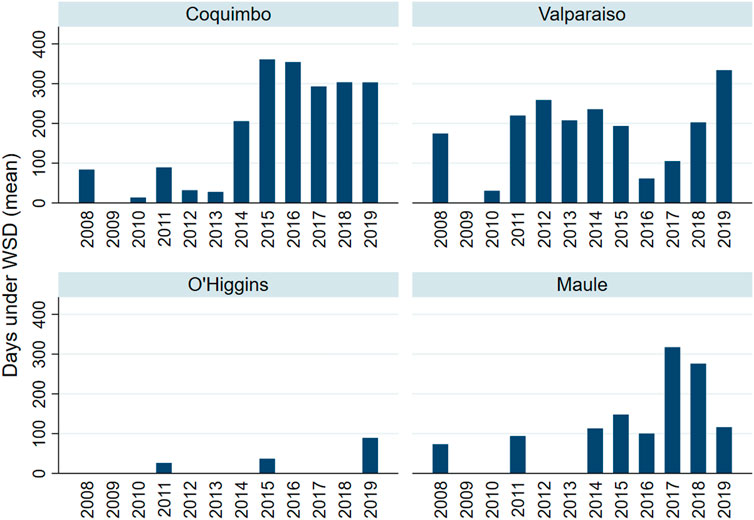
FIGURE 3. Days under water scarcity declaration by region and year (municipality average), Coquimbo-Maule 2008–2019. Source: own calculations based on CNR data.
Now we move to the main results of our study. Tables 1–5 present different results for both the national level and the Coquimbo-Maule area. Table 1 presents the results at the national level for all three outcomes: presence of a declaration, the number of declarations in a year, and the number of days under water scarcity declaration in a year. The first three columns of Table 1 show results for all three outcomes using no controls other than year and region dummies. Columns [4] to [6] re-estimate the same models but adding socioeconomic controls, such as poverty and schooling level, income, among others. Finally, the last three columns of Table 1 present the results for the fully specified model, including all previous controls plus the standardized indices of water flow and precipitation. This same organization is repeated in Tables 2–5.
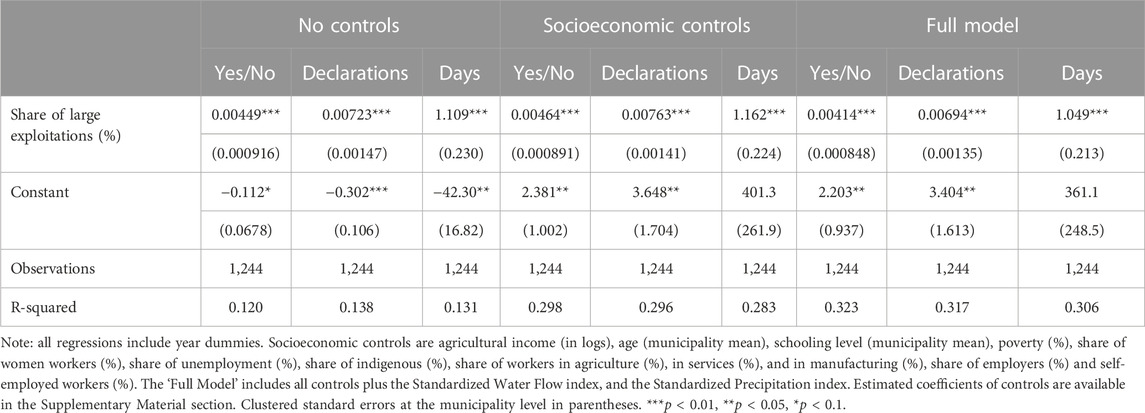
TABLE 1. Estimates of the association between the percentage of large exploitations and water scarcity declarations, Chile.
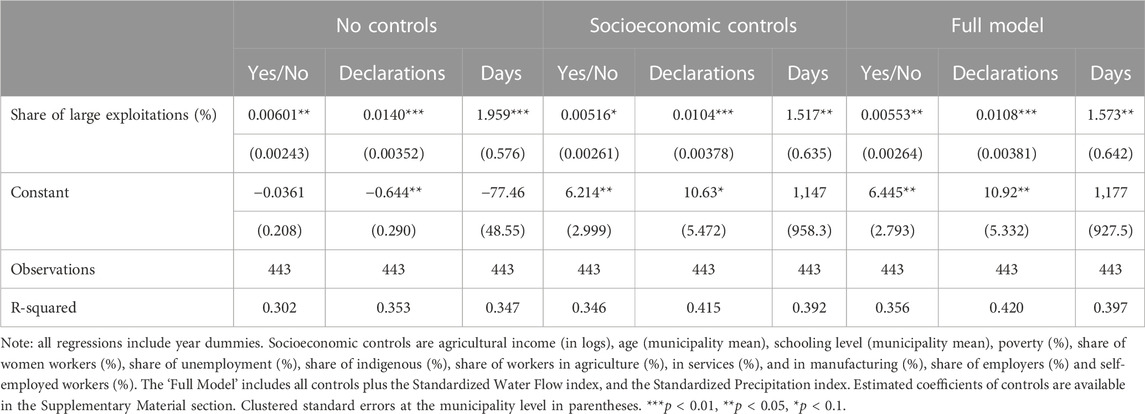
TABLE 2. Estimates of the association between the percentage of large exploitations and water scarcity declarations, Coquimbo-Maule area.
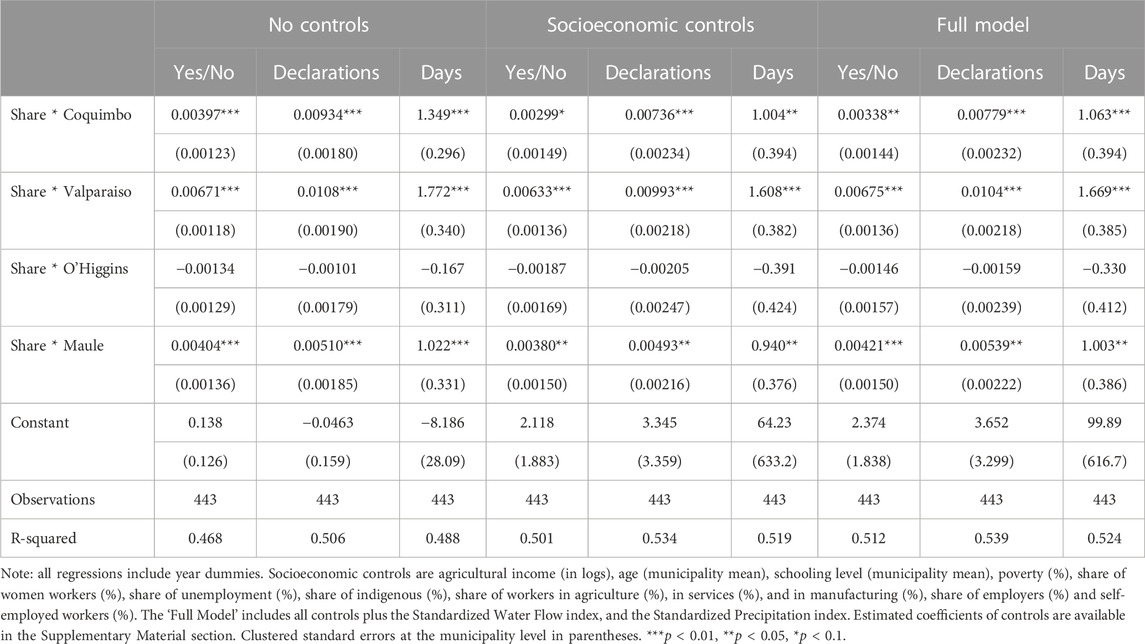
TABLE 3. Estimates of the association between the percentage of large exploitations and water scarcity declarations by region, Coquimbo-Maule area.
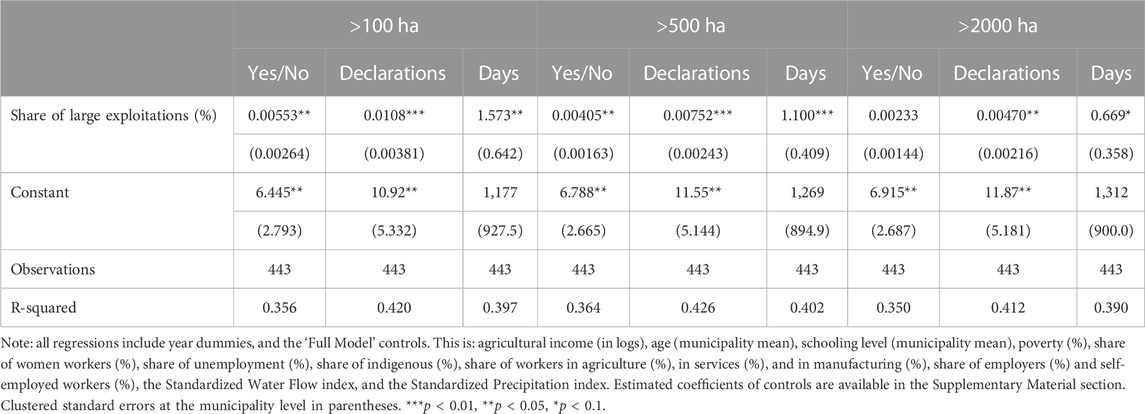
TABLE 4. Estimates of the association between the percentage of large exploitations and water scarcity declarations, Coquimbo-Maule area. Different definitions of ‘large exploitations’.
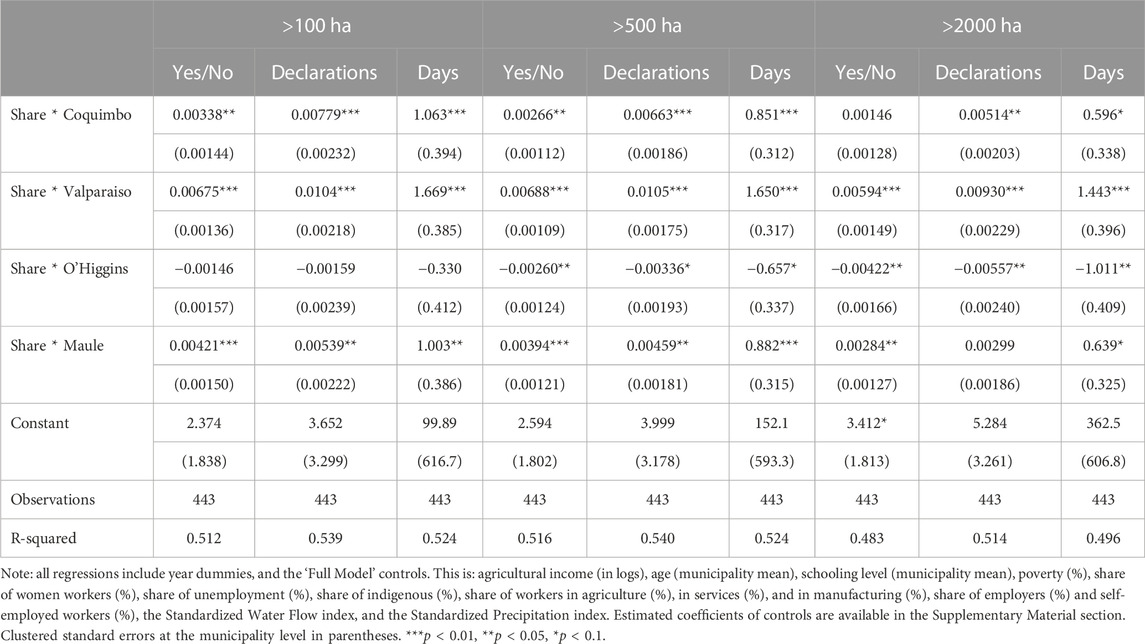
TABLE 5. Estimates of the association between the percentage of large exploitations and water scarcity declarations by region, Coquimbo-Maule area. Different definitions for ‘large exploitations’.
Table 2 is an exact copy of Table 1 but for the Coquimbo-Maule area. Table 3 interacts the share of large exploitations (defined as those exploitations of at least 100 ha) with the region where the municipality is located to look for heterogeneity in terms of the association between the percentage of large exploitations and the declaration of water scarcity. Finally, Tables 4, 5 modify the definition of large exploitations to test whether our results are an artifact of the definition used. Here we are interested in showing whether the coefficients of Tables 2, 3 change when the definition of large exploitations is stricter. We explore changes in the results by moving our definition to consider a large exploitation those with at least 500 ha, and those with at least 2000 ha. In all tables, columns [1], [4] and [7] present the results for the first outcome (the presence of a water scarcity declaration), columns [2], [5] and [8] present those of the number of declarations within a year, and columns [3], [6] and [9] do the same for the number of days under declaration for a given year at the municipality level.
According to the results of Table 1 for the whole country, the share of large exploitations is positively associated with all three outcomes (the presence of a declaration, the number of declarations in a year, and the number of days under declaration for a year). Interestingly, these results are always statistically significant, despite adding several controls to the regressions. Looking at the results for the existence of a decree, the point estimate moves from 0.0041 in the full model to 0.0045 in the model with no controls. This is, for each 1% increase in the share of large exploitations, the likelihood of a declaration increases by around 0.4% in all models.
Moving to the results of the number of declarations and the number of days under declaration, the situation is similar with a point estimate of 0.007 for the first outcome (number of declarations) under the full model (above 0.007 in the other specifications) and a point estimate of around 1 for the second (number of days). This last result implies that for each 1% increase in the proportion of large exploitations, the number of days under decree increase by around one. This result is consistent across all specifications. For the case of number of declarations, the estimate seems small, but the reader should keep in mind that the outcome is bounded between 0 and 3, thus a 0.007 increase in the coefficient estimated, represents close to a 0.2% increase in the number of declarations.
In short, at the national level, the elasticities between the size of exploitations and the decrees are 0.4 for the case of the issuing, and 0.2 for the number of declarations within a year. For the number of days, the 1% increase in the share of large exploitations increases the number of days under decree by 1 each year. The reader should be reminded that this is after accounting for several socioeconomic characteristics and including measures of water flow and precipitations.
As mentioned, in Table 2 we repeat the analysis but for the Coquimbo-Maule area. Here the results, perhaps as expected given that most of the declarations are concentrated in this area, are larger and remain significant for all models, including the fully specified model. Focusing precisely on the results of the full model, we see that a 1% increase in the share of large exploitations is associated with a 0.55% increase in the likelihood of having a declaration issued in the municipality. The association is around 0.01 for the number of declarations within a year (around 0.3% effect) and between 1.5 and 2 days more under declaration for the last outcome. This is, when we focus only in the area of interest, where most of the decrees had been issued, the results are larger and again highly significant. However, it should be reminded that for the O’Higgins region, almost no decree has been issued in several years (see Figure 3), so therefore these results can be more than anything a reflection of what is happening in the other three regions (Coquimbo, Valparaiso and Maule). We now explore these differences in Table 3.
According to the results of Table 3, the share of large exploitations is important to explain the issuing of a declaration in all regions but in O’Higgins, where the effect is statistically zero (no association). Again, part of this results could be explained by the fact that in O’Higgins almost no declaration has been issued in our period under investigation.
In addition to that, this association seems to be more important in Valparaiso, rather than in Coquimbo and Maule. For instance, in Valparaiso a 1% increase in the share of large exploitations is associated with a 0.7% increase in the odds of getting a declaration issued. This association is 0.3% in Coquimbo, and 0.4% in Maule. In the case of the number of decrees, the association is again positive and significant for Coquimbo, Valparaiso and Maule, but not significant for the case of O’Higgins. Here we found that a 1% increase in the share of large producers is associated with a 0.008 increase in the number of declarations in Coquimbo (0.2%), a 0.01 (0.3%) increase in Valparaiso, and 0.0054 (0.2%) increase in Maule.
Regarding the last outcome, a 1% increase in the share of large exploitations is associated with 1 more day under declaration in Coquimbo and in Maule, and 1.7 days in Valparaiso. For the case of O’Higgins, a 1% increase in the share of large exploitations does not produce a significant change in the number of days under declaration for the municipalities within the region.
Whereas these results might seem small, they are indicative of an association between large exploitations and the WSDs, and they are also suggestive that the WSDs are not associated with socioeconomic or climatic conditions. Moreover, given that most of the municipalities and regions used as area of interest for this study are almost permanently under a WSD, these results confirm that the likelihood of a declaration been issued, the number of decrees, and the length of these decrees all increase with the share of large producers/exploitations in the area, even when we compare municipalities within the same region.
As mentioned, we are aware that there is not a standard definition of what should be considered a ‘large’ exploitation, and that this definition is probably context dependent. Thus, we now change the definition used (up until here, only those of at least 100 ha are considered large exploitations) and made the definition stricter. In the following results presented in Tables 4, 5, we compare the estimates of the fully specified models for the area of interest under three definitions: 1) our current “at least 100 ha”, 2) “at least 500 ha” and 3) “2000 ha or more”, each time reducing the sample of large exploitations.9 Notice that, to have a reference, the first three columns of Tables 4, 5, repeat the estimates given in the last three columns of Tables 2, 3 (our full model estimates). For parsimony, we do not present this analysis for the country as a whole, but the results of that exercise are also available upon request.
The results of Table 4 show that municipalities with larger exploitations are associated with a higher probability of declaration of water scarcity, regardless of the definition used for large exploitations. In the case of the 500 ha threshold, the estimate is slightly smaller than the one obtained using the 100 ha cutoff, but it remains positive and significant. The estimate obtained using the stricter measure of 2000 ha or more is also positive (0.0023), although smaller and not statistically significant.
A similar situation we observe when looking at the estimates of the association between the share of large exploitations and the number of decrees in a given year. The coefficient estimated gets smaller, moving from 0.0108 to 0.0047, as we increase the size of the exploitation considered large. However, in all cases the point estimate is positive and statistically significant. Finally, for the case of the length of the decree, all estimates are positive and significant, and again the point estimate gets smaller as we move from our preferred definition to a stricter one. Using the 100 ha cutoff we got a 1.57 estimate (a 1% increase in the share of large exploitations is associated with 1.57 more days under a decree), and this coefficient gets reduced to 1.1 (with the 500 ha cutoff) and to 0.67 (with the 2000 ha measure).
In the case of Table 5 we need to distinguish between regions. For the cases of Valparaiso, the one with the largest number of decrees in our period under investigation, all coefficients remain positive, significant and present smaller changes in magnitude, following the results of Table 4 (a reduction in magnitude as we move from smaller to larger exploitations for the definition of “large”). Similarly, in Coquimbo and in Maule all estimates remain positive, but in both cases only one coefficient is no longer significant under the stricter measure of large exploitations. Finally, the case of O’Higgins, the region where very few decrees have been issued, is a particular one as its estimates shift from non-significant in the model with 100 ha as the cutoff, to negative and significant when the other two definitions are used. We believe this is probably more a reflection of the number of positive observations (positive number of declarations and days) used in the regressions than a true association between the two variables and should probably be looked more carefully than those of the other regions.
5 Conclusion
A WSD is a legal tool that emerges as a solution to crises caused by drought and, in principle, has a limited application in time. It seeks to address the lack of precipitation, not scarcity, a phenomenon that, as we have established, has permanence in time given the decisions made by different actors in the system regarding access, control, and ownership of water.
Within an institutional framework that prioritizes the fulfillment of private water rights in times of crisis, the WSD has become a drought control mechanism that does not consider the long-term crises marked by climate change and the increase in temperatures observed in a large part of the country. However, does not only that: previous evidence indicates that it could constitute a device vulnerable to the political pressures of those actors with greater capacity of influence in the state, whether at a local, regional or national level. Its implications at the legal level could be those of generating incentives for local actors to pressure for a legal declaration of water scarcity and its maintenance over time, especially in territories with a greater concentration of land ownership and larger exploitations.
Extension throughout the years of Water Scarcity Decrees, legal instrument created to operate during brief periods of time, became relevant because it authorizes water extraction in extreme drought conditions. According to what is mentioned in article n° 314 of Water Code, this presidential Decrees “authorizing underground and surface water extraction from any spot without the need of having water entitlements and without minimum ecological volume”. With a constant decrease in rainfall, keeping this decree in areas where there is a big presence of agricultural activity and overused water basins, generates severe water resources sustainability problems. Management of water resources infrastructure is, without doubt, one of the key aspects in the present climate crisis and has to do not only with strictly technical criteria, but also with certain development projects and groups inside society, with different political power levels. Through this work, it has been shown that management of water drought in Chile had been connected with the pushing of the agro–export sector, increasing pressure over water resources. This phenomenon has also been verified also for other Latin American countries with a strong presence of agribusiness (Pont and Thomas, 2009; Budds and Roa, 2018; Castelblaco, 2018).
In this paper, we have estimated the association between the existence of large exploitations and the likelihood of a water scarcity declaration, the number of declarations issued within a year, and their duration in days. Our results showed that areas with larger exploitations are on average more prone to be under a water scarcity declaration, to have more decrees issued in a year, and when they have them, they are in place for longer periods of time. All of this is after controlling for economic and climatic conditions. In short, municipalities with a larger share of smaller agricultural producers are less likely to get the same treatment in terms of water management and use than their counterparts get, even in the same regions and areas of the country, and with similar climatic conditions.
As mentioned, this is not the result of climatic differences or other socioeconomic conditions, although they all seem to affect the estimates, as models without controls yield larger estimates. Taken at face value, and despite not being able to directly estimate it, the results seem to suggest that larger local producers are more able to influence the water policy to their own advantage.
Our estimates could be considered somewhat small, especially for the case of the number of decrees within a year or the number of days. However, it should be reminded that they are obtained from an area with little or almost no variation in terms of number of declarations even within any given year. This is, most municipalities within a given region are continuously under declaration in Valparaiso and Maule, at least in the last few years, and, on the other hand, almost no declaration has been issued in O’Higgins in most of the period. This is especially true when estimating results interacting our variable of interest with region dummies and the main reason behind the decision of choosing to run a random effects model, instead of the perhaps more common region fixed-effect model.
In our study we have chosen the cutoff point of 100 ha to distinguish large exploitations from the rest. While this cutoff point seems to be appropriate according to the definitions currently used by ODEPA (2019), we modified this definition and consider other two cutoff points. Our results show that, regardless of the definition used, the association between the percentage of large producers and the WSD remains positive and significant, for all indicators and all measures. Perhaps the only exception is the Region of O’Higgins, where we found either an association zero or a negative one, but that can be explained by the reduced number of declarations issued in the region over the period considered.
Our results have direct implications for public policies in two areas. First, they provide evidence to improve the institutional and legal design in managing water scarcity: a key point is the need to modify the current governance of water, setting appropriate limits to these mechanisms that are susceptible to being taken over by large landowners, with the consequent effects in terms of sustainability and access to water justice. Legislation that makes it possible to face scarcity at the basin level, integrating surface-groundwater and that incorporates limits to the lobby at the local level of the different actors, is key to managing a future water crisis. This problem will become critical in the coming decades in the context of climate change. By showing the weaknesses in the water scarcity decrees in relation to possible pressures from local stakeholders, our results constitute a key input for designing long-term policies for mitigation and adaptation to the new scenario of water resource availability.
Secondly, they allow researchers and policymakers to establish a discussion on the need to include the criteria of justice in the access, control, and ownership of water in the design of policies aimed at scarcity management, by showing the favorable impact that certain legal have on certain pressure groups in the long-term with their direct consequences in terms of inequality.
Data availability statement
Publicly available datasets were analyzed in this study. This data can be found here: https://www.cr2.cl/bases-de-datos/ http://observatorio.ministeriodesarrollosocial.gob.cl/encuesta-casen https://www.ine.gob.cl/estadisticas/economia/agricultura-agroindustria-y-pesca/censos-agropecuarios.
Author contributions
RP-S: Conception and design of the study, methodology, statistical analysis, writing and editing. MC: Conception and design of the study, writing, editing and manuscript revision. All authors contributed to the article and approved the submitted version.
Acknowledgments
Funded by FONDECYT N°1210858; and grant NCS2022_013 of the Millennium Scientific Initiative of the Ministry of Economy, Development and Tourism (Chile).
Conflict of interest
The authors declare that the research was conducted in the absence of any commercial or financial relationships that could be construed as a potential conflict of interest.
Publisher’s note
All claims expressed in this article are solely those of the authors and do not necessarily represent those of their affiliated organizations, or those of the publisher, the editors and the reviewers. Any product that may be evaluated in this article, or claim that may be made by its manufacturer, is not guaranteed or endorsed by the publisher.
Supplementary material
The Supplementary Material for this article can be found online at: https://www.frontiersin.org/articles/10.3389/fenvs.2023.1143254/full#supplementary-material
Footnotes
1According to the available data, precipitation in Chile has been below its own average continuously since 2007, with the period 2000–2019 as the driest since we have data.
2This ordinary water governance depends on the Code DFL-1122 enacted in 1981, as a general framework. Further details are provided in point 2.
3According to Article 314 of the water code, this presidential power enables the Directorate General of Water to redistribute water resources in order to “authorize the extraction of surface or groundwater from any point without the need to establish water use rights and without limiting the minimum ecological flow” (MOP, S/F).
4The extension of WSD is carried out, following the recommendation of the DGA, through the presidential signing of a decree that extends its duration. The area must be in extreme drought according to the DGA criteria, which is currently in the process of being updated to adjust to the reality of global environmental change. This decision is requested by the local DGA authorities, when necessary.
5The Code DFL-1122 establishes governance at the local level based in regular times the Directorate General of Water and organizations of water users. These water communities are the organizations that bring together individual water rights owners. These organizations of water users have no influence on the construction of wells or the extraction of groundwater, which in Chilean law are rights of an individual nature different from surface rights, with no connection at the ecosystem level. Although surface organizations of water users have a long history in Chile, groundwater organizations are in the process of being formed, given the limited knowledge that exists among the population about this.
6Whereas Chile has recently released a new Agricultural Census (2020/2021), this has been under serious scrutiny among scholars and researchers, mainly because of several problems reported during the field work especially in terms of its non-response rate. As an example, within the O’Higgins and Los Lagos regions (the main area of agricultural production in Chile) the non-response rate reached up to 23%, and yield reductions in agricultural production and surfaces, which do not seem to match conventional wisdom and knowledge. For more information regarding the methodology used in the 2021/22 Census, see https://www.ine.gob.cl/docs/default-source/censo-agropecuario/metodologia/2021/documento-metodol%C3%B3gico-caf-2021.pdf?sfvrsn=157b7b33_4.
7However, the reader will soon notice that excluding these years and using only those for which we do have the CASEN household information, do not modify our results substantially.
8The reader can see this in Supplementary Appendix Tables SA1–SA3, in the appendix, where we present the standard deviation of each variable (the issuing of a WSD, the number of WSDs, and the number of days under WSD) for every region-year pair.
9In our sample, around 12% of the producers has an exploitation of at least 100 ha. This percentage is 5% for those with at least 500 ha, and 2% for exploitations of at least 2000 ha.
References
Bakker, K. J. (2003). A political ecology of water privatization. Stud. political Econ. 70 (1), 35–58. doi:10.1080/07078552.2003.11827129
Bauer, C. (2004). Siren song: Chilean water law as a model for international reform. New York, NY: Routledge.
Bauer, C. (2015). Water conflicts and entrenched governance problems in Chile’s market model. Water Altern. 8 (2), 147–172.
Budds, J. (2009). Contested H2O: Science, policy and politics in water resources management in Chile. Geoforum 40, 418–430. doi:10.1016/j.geoforum.2008.12.008
Budds, J. (2012). La demanda, evaluación y asignación del agua en el contexto de escasez: un análisis del ciclo hidrosocial del valle del río La Ligua, Chile. Rev. de Geogr. Norte Gd. 52, 167–184. doi:10.4067/S0718-34022012000200010
Budds, J., and Roa, M. (2018). Agua, Equidad y Justicia: El Papel de las Relaciones de Poder en la Asignación, Uso y Gobernanza de Recursos Hídricos en los Andes. Perú: Fondo Editorial PUCP. Available at: https://www.fondoeditorial.pucp.edu.pe/antropologia/782-equidad-y-justicia-hidrica.html#.XZXnDi-ZNQI.
Budds, J. (2016). “Whose scarcity? The hydrosocial cycle and the changing waterscape of La ligua river basin, Chile,” in Contentious geographies (New York, NY: Routledge), 81–100.
Castelblaco, A. (2018). “¿A quién le pertenece el agua? Apropiación del agua en la vereda Buenos Aires,” in Agua y disputas territoriales en Chile y Colombia (359–390). Editor E. A. U. Y. H. Romero-Toledo (Colombia: Universidad Nacional de Colombia).
Centro de Ciencia del Clima y la Resiliencia (CR)2 (2015). Informe a la Nación. La megasequía 2010-2015: Una lección para el futuro. Available at: https://www.cr2.cl/megasequia/.
Correa, J., Aguirre, C., and Vergara, F. (2020). Water privatization and inequality: Gini coefficient for water resources in Chile. Water 12, 3369. doi:10.3390/w12123369
Donoso, G. (2015). “Chilean water rights markets as a water allocation mechanism,” in Use of economic instruments in water policy. Global issues in water policy. Editors M. Lago, J. Mysiak, C. Gómez, G. Delacámara, and A. Maziotis (Cham: Springer).
Donoso, G., Lictevout, E., and Rinaudo, J. D. (2020). “Groundwater management lessons from Chile,” in Sustainable groundwater management. Global issues in water policy. Editors J. D. Rinaudo, C. Holley, S. Barnett, and M. Montginoul (Cham: Springer), 24.
Donoso, G. (2018). “Overall assessment of Chile’s water policy and its challenges,” in Water policy in Chile. Global issues in water policy. Editor G. Donoso (Cham: Springer).
Duran-Llacer, I., Munizaga, J., Arumí, J. L., Ruybal, C., Aguayo, M., Sáez-Carrillo, K., et al. (2020). Lessons to Be learned: Groundwater depletion in Chile’s Ligua and Petorca watersheds through an interdisciplinary approach. Water 12, 2446. doi:10.3390/w12092446
Fernández, J. E. (2019). EL agua ¿bien nacional de USO público? Derechos de aprovechamiento, usos consuetudinarios y propiedad privada de cara a una reforma al Código de Aguas de 1981. Documento de Trabajo ICSO - N° 54/2019, serie de Laboratorio constitucional UDP. Universidad Diego Portales. Available at: https://labconstitucional.udp.cl/documentos/el-agua-bien-nacional-de-uso-publico-derechos-de-aprovechamiento-usos-consuetudinarios-y-propiedad-privada-de-cara-a-una-reforma-al-codigo-de-aguas-de-1981/.
Gosling, S. N., and Arnell, N. W. (2016). A global assessment of the impact of climate change on water scarcity. Clim. Change 134, 371–385. doi:10.1007/s10584-013-0853-x
Jordan, C., Donoso, G., and Speelman, S. (2023). Irrigation subsidy policy in Chile: Lessons from the allocation, uneven distribution and water resources implications. Int. J. Water Resour. Dev. 39 (1), 133–154. doi:10.1080/07900627.2021.1965964
Larraín, S. (2012). Human rights and market rules in Chile’s water conflicts: A call for structural changes in water policy. Environ. Justice 5 (2), 82–88. doi:10.1089/env.2011.0020
Liu, J., Yang, H., Gosling, S. N., Kummu, M., Flörke, M., Pfister, S., et al. (2017). Water scarcity assessments in the past, present and future. Earths Future 5 (6), 545–559. doi:10.1002/2016EF000518
Madariaga, A., Maillet, A., and Rozas, J. (2021). Multilevel business power in environmental politics: The avocado boom and water scarcity in Chile. Environ. Politics 30 (7), 1174–1195. doi:10.1080/09644016.2021.1892981
Molina, F. (2012). ‘‘Competing rationalities in water conflict: Mining and the indigenous community in chiu chiu, el loa province, northern Chile,’’ Singapore. J. Trop. Geogr. 33, 93–107. doi:10.1111/j.1467-9493.2012.00451.x
Mukherjee, S., Mishra, A., and Trenberth, K. E. (2018). Climate change and drought: A perspective on drought indices. Curr. Clim. Change Rep. 4, 145–163. doi:10.1007/s40641-018-0098-x
ODEPA (2019). Panorama de la Agricultura chilena. Oficina de Estudios y políticas agrarias. Available at: https://www.odepa.gob.cl/wp-content/uploads/2019/09/panorama2019Final.pdf.
Pont, P. M., and Thomas, H. (2009). ¿Cómo fue que el viñedo adquirió importancia? Significados de las vides, calidades de las uvas, y cambio socio-técnico en la producción vinícola de Mendoza. Apunt. Investig. del CECYP 15, 77–96.
Reyer, C., Adams, S., Albrecht, T., Baarsch, F., Boit, A., Canales Trujillo, N., et al. (2017). Climate change impacts in Latin America and the Caribbean and their implications for development. Reg. Environ. Change 17, 1601–1621. doi:10.1007/s10113-015-0854-6
Strzepek, K., Yohe, G., Neumann, J., and Boehlert, B. (2010). Characterizing changes in drought risk for the United States from climate change. Environ. Res. Lett. 5, 044012. doi:10.1088/1748-9326/5/4/044012
Swyngedouw, E. (2015). Liquid power: Water and contested modernities in Spain, 1898-2010. London: Mit Press.
Tol, R. (2018). The economic impacts of climate change. Assoc. Environ. Resour. Econ. 12 (1), 4–25. doi:10.1093/reep/rex027
Vallino, E., Ridolfi, L., and Laio, F. (2020). Measuring economic water scarcity in agriculture: A cross-country empirical investigation. Environ. Sci. Policy 114, 73–85. doi:10.1016/j.envsci.2020.07.017
Weber, M. (1978). in Economy and society: An outline of interpretive sociology. Editors G. Roth, and C. Wittich (Berkeley: University of California Press). (Original work published 1921).
Wheeler, T., and von Braun, J. (2013). Climate change impacts on global food security. Science 341 (6145), 508–513. doi:10.1126/science.1239402
Wooldridge, J. (2010). Econometric analysis of cross section and panel data. Cambridge, Massachusetts, USA: The MIT Press.
Keywords: water scarcity, climate change, drought, agriculture, political power, Chile
Citation: Perez-Silva R and Castillo M (2023) Taking advantage of water scarcity? Concentration of agricultural land and the politics behind water governance in Chile. Front. Environ. Sci. 11:1143254. doi: 10.3389/fenvs.2023.1143254
Received: 12 January 2023; Accepted: 14 July 2023;
Published: 26 July 2023.
Edited by:
Adam Schlosser, Massachusetts Institute of Technology, United StatesReviewed by:
Nidhi Nagabhatla, The United Nations University Institute on Comparative Regional Integration Studies (UNU-CRIS), BelgiumGeoff Darch, Anglian Water Services, United Kingdom
Copyright © 2023 Perez-Silva and Castillo. This is an open-access article distributed under the terms of the Creative Commons Attribution License (CC BY). The use, distribution or reproduction in other forums is permitted, provided the original author(s) and the copyright owner(s) are credited and that the original publication in this journal is cited, in accordance with accepted academic practice. No use, distribution or reproduction is permitted which does not comply with these terms.
*Correspondence: Rodrigo Perez-Silva, raperezs@uc.cl