Simulation of spatiotemporal patterns of habitat quality and driving mechanism in Anhui province, China
 Guanjin Zhang
 Siti Nur Aliaa Roslan1
 - 1Department of Civil Engineering, Faculty of Engineering, Universiti Putra Malaysia, Serdang, Selangor, Malaysia
- 2College of Resource and Environment, Anhui Science and Technology University, Chuzhou, China
Understanding the characteristics of habitat quality and its influence under land use change is crucial for rapid urbanization, regional ecological protection, and national restoration and optimization of the ecological layout. This paper examined Anhui Province, China, through topo-graphic data, climate data, human activity data, and land use data from 2000, 2010, and 2020. To reveal the habitat quality impact mechanisms, the paper assessed the province’s spatiotemporal evolution characteristics of habitat quality by the Patch-generating Land Use Simulation (PLUS) model, Integrated Valuation of Ecosystem Services and Trade-offs (INVEST) model, and geo-graphic probe model. The results showed that: 1) From 2000 to 2020, Paddy field, Dryland, and Wooded land covered 70% of the study area. From 2000 to 2020, the integrated land use dynamic attitude was 0.51%, with active changes in the Paddy field, Dryland, and open Wooded land and a continuous increase in dynamic attitude. Compared to 2020, the spatial distribution characteristics of land use types in 2030 remain largely unchanged. However, Paddy fields and Drylands still show an increasing trend, while Wooded land, Reservoir ponds, and Urban land demonstrate a small decreasing trend. All other land types remain unchanged; 2) Secondly, between 2000 and 2020, habitat quality gradually decreased, while the percentage of poor habitat quality increased by 1.47% and the percentage of worse habitat quality decreased by −1.41%. All other classes exhibited a small decreasing trend; the mean habitat quality decreased by 0.01 compared to 2020 in 2030, and was mainly distributed in the southwestern and eastern edges of the province; and 3) DEM, aspect, precipitation, and evapotranspiration have a high explanatory power for habitat quality, while the variable Places has significantly increased its explanatory power for habitat quality between 2010 and 2020. Natural factors laid down the graded distribution pattern of habitat quality, and the location and intensity of human activities drove the evolution of habitat quality. Analyzing the mechanism behind habitat quality in Anhui Province provides a theoretical basis for ecological restoration and ecological planning.
1 Introduction
The Intergovernmental Platform on Biodiversity and Ecosystem Services for Science (IPBES) reports that natural resources are being destroyed at an unprecedented rate, and millions of species are on the edge of extinction (Dai et al., 2020). Large-scale net losses of biodiversity are occurring around the world (Newbold et al., 2015). Habitat quality refers to the ability of the natural environment to provide suitable conditions for individuals or populations to survive, depending on the accessibility of the habitat to human land use and land use intensity (Hall et al., 1997). The quality of habitat has become a key factor in measuring the ecological health and sustainability of a region. In recent years, the rapid development of urbanization and industrialization has intensified the active spatial expansion of urban land, and large areas of cultivated land and ecological land have been invaded and converted to construction land, which directly leads to the fragmentation and reduction of habitat patches. As a result, habitat quality degradation has become an important global issue (Vitousek et al., 1997; Wilcove et al., 1998). In the coming decades, climate change will intensify the above situation (O'Connor et al., 2020), especially in terms of the conflict between human activities and resources. Changes in land use dynamic attitude are the most intuitive and realistic response (Jiren et al., 2018) and are a key factor driving biodiversity decline (Watson et al., 2019). Land use type change directly affects habitat spatial changes ecological processes, such as the energy flow cycle, which in turn weakens the regional ecological supply capacity and service function. It is urgent to reveal the spatiotemporal evolution patterns of habitat quality changes caused by land use changes, predict future habitat change trends, and clarify the driving mechanisms affecting habitat quality as a basis for ecological civilization construction. Aiming to provide a basis for decision making on regional ecological security and land use planning.
The assessment of habitat quality gives an effective interface for exploring the mechanisms linking land use change and species’ breeding habitats. At present, research methods for habitat quality range from early static evaluation of single indicators (Thiel, 1985; Engel et al., 1999) to comprehensive measurement of habitat quality with multiple evaluation indicators (Simeone et al., 2021; Zhang et al., 2021) and distributed models measuring the development process of spatiotemporal heterogeneity of regional habitat quality (Fan et al., 2021; Liu et al., 2022). Spatial modeling using habitat biodiversity information requires comprehensive consideration of the complexity of regional ecosystems, and traditional ground-based species surveys have limited applicability for studies in areas of species scarcity and large and medium scales based on sample data limitations. Even though habitat indicator modeling is highly accurate and purposeful, it is not suitable for large-scale habitat quality evaluation due to the limitation of sample data. Integrated remote sensing and GIS technologies can reveal habitat quality evolution characteristics at a larger scale. The main models in use are Solves model, HSI model, Maxent model, Invest model, etc. The Habitat Quality (HQ) model within the INVEST model connects the suitability of organisms and different land covers with threat sources, assesses the distribution and degradation of habitat quality in different landscape patterns according to the sensitivity of habitats to sources of threat (Terrado et al., 2016), and weighs the impact of threats caused by human activities on overall ecological quality in terms of spatial distance (Peng et al., 2018), such as the spatial heterogeneity of habitat quality at different regional scales (e.g., nature reserves (Yang et al., 2021), cities (Song et al., 2020), and watersheds (Gong et al., 2019)). Until now, researchers have con-ducted habitat quality studies related to land use, human activities, spatiotemporal changes, and impact factor detection. Wu et al. (2021) estimated the spatiotemporal variation of HQ in the Guangdong–Hong Kong–Macao Greater Bay Area based on the Invest model, decline in HQ was found to be possibly related to vegetation loss, land use change, and intensity of human activities. Wang and Cheng. (2022) explored the response of different land use types to regional HQ based on the Invest model, HQ of different landscape types was found to show spatial aggregation of the mineral contribution. Among these research topics, ecological effects caused by land use changes have become the center of ecological studies. At present, land use simulation and land use prediction methods involving system dynamic attitude model (Geng et al., 2017), Markov model (Huang et al., 2020), STLU-MOO model (Cao et al., 2019), Clue-S model (Ma et al., 2019; Chang et al., 2021), and SLEUTH model (Wagner and de Vries, 2019) have been used often used in research. In contrast, the Patch-generating Land Use Simulation (PLUS) model (Liang et al., 2021) represents a new type of land use simulation model that has greater simulation accuracy and better supports the spatial prediction of regional habitat quality (Xu et al., 2022). At present, topographic factors, climatic factors, and anthropogenic activities play an important role in changing habitat quality. Among these factors, the disturbance of anthropogenic activities most notably shifts the overall regional ecological pattern and degrades and destroys the habitat quality (Gao et al., 2022). Therefore, this study INVEST gates the mechanisms of different factors on habitat quality and the interaction between its two factors by introducing a geographic detector model (Zhu and Kasimu, 2020; Zhang et al., 2022). With rapid socio-economic and population growth leading to increased spatial and temporal variability in habitat quality in the background of rapid urbanization. In provinces with clear spatial territorial characteristics, the factors influencing habitat quality and their mechanisms in different regions are more complex, making it necessary to explore their habitat quality driving mechanisms. It is particularly important to clarify the spatiotemporal differences in habitat quality in Anhui Province and to explore the mechanisms influencing the spatiotemporal variability. Therefore, this study combined land use types data from multiple periods and coupled Invest and PLUS models to explore the response of habitat quality to predictive simulations of land use change. A Geodetector model was also introduced to detect the driving factors affecting the spatial differentiation and temporal evolution of habitat quality by selecting indicators in terms of natural, climatic and socioeconomic factors (Zhu and Kasimu, 2020; Zhang et al., 2022).
In recent years, its urbanization process has experienced rapid growth and sprawling spatial expansion, with urban land area growth and infrastructure expansions undoubtedly putting enormous pressure on habitat quality (Hu et al., 2022). This paper assessed the temporal variation patterns of habitat quality in Anhui Province based on the Invest model to elucidate the differences in spatial patterns of habitat quality. Predicting future land use response to habitat quality based on the PLUS model. The Geodetector model was introduced to combine natural environmental and socio-economic factors to quantitatively reveal the characteristics of the changing spatial pattern of habitat quality and the influence mechanism. The results of the study provide scientific reference for the sustainable development of ecosystems and land use planning in Anhui Province.
2 Materials and methods
2.1 Overview of the study area
Anhui Province is situated in the Yangtze River Delta region of East China (114°54′–119°37′E, 29°41′–34°38′N) (Figure 1). Its total area covers 140,100 km2. China’s important Qinling-Huaihe geographical divide crosses the province, and ecological elements such as climate, biology and soil exhibit obvious longitudinal and transitional characteristics. The province’s topography is high in the southwest and low in the northeast. Its terrain differs between the north and south, and is divided into five natural regions, including the Huaibei Plain, the Jianghuai Hills, the Dabie Mountains in western Anhui, the riverine plains, and the mountains in southern Anhui Province. Anhui Province belongs to the transitional climate, between the subtropical and warm temperate zones. Its average annual temperature is measured between 13°C and 22°C and its average precipitation is between 773 mm and 1,670 mm. The resident population of Anhui Province was 61.027 million at the end of 2020, and the urbanization rate of the resident population was 58.33%. The total economic value was 38,680.6 billion CNY, and the structure of the three industries was 8.2: 40.5: 51.3. The province is densely populated, with fertile land, rich resources, and convenient transportation. It is an important grain production base, energy and mineral base, and manufacturing base in China. Because of its diverse landscape types, superior water and heat conditions, high ecosystem productivity and rich species, Anhui plays a top-down role in the ecological security of the Yangtze River Economic Belt. In addition, the province’s ecological location is extremely important. Furthermore, Anhui Province is located at the strategic point of national economic development and is the docking zone of several major eco-nomic blocks in China.
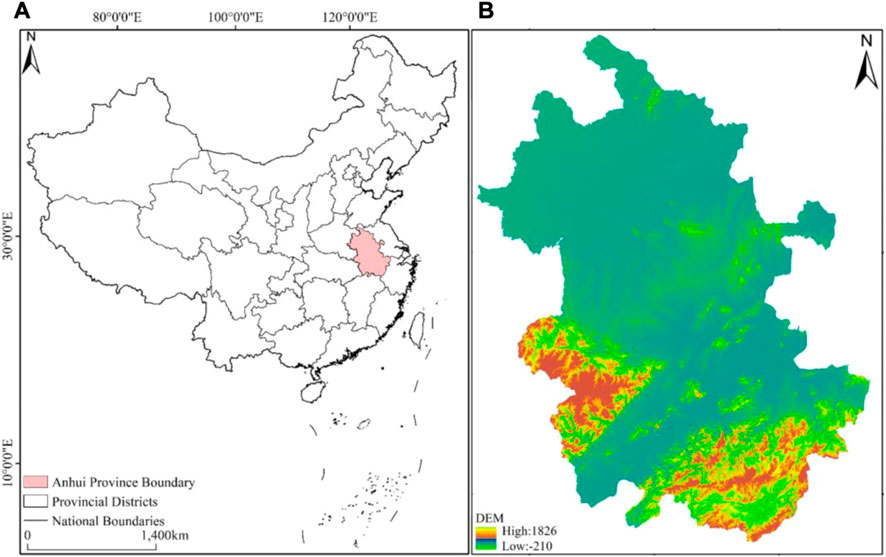
FIGURE 1. Location map of the study area. (A) China, (B) Anhui province DEM.
2.2 Data sources and preprocessing
Land use data for 2000, 2010, and 2020 were used to describe the land use conversion constraints (Table 1) in order to determine the meta-cell conversion rules. The classification of land use types in the study area is based on land resources and their utilization attributes. The secondary classification includes 16 categories, including Paddy field, Dryland, Wooded land, Shrubland, Open Wooded land, Other forested land, High coverage grassland, Medium coverage grassland, Low coverage grassland, Waterways, Lake, Reservoir pond, Bottomland, Urban land, Rural settlement, Other construction land. All driving factors and land use data in this paper have inconsistent spatial resolutions. Using the resampling module in ArcGIS, all data were resampled to a spatial resolution of 100 m. All images in this study were uniformly projected in UTM and WGS84 coordinate system.
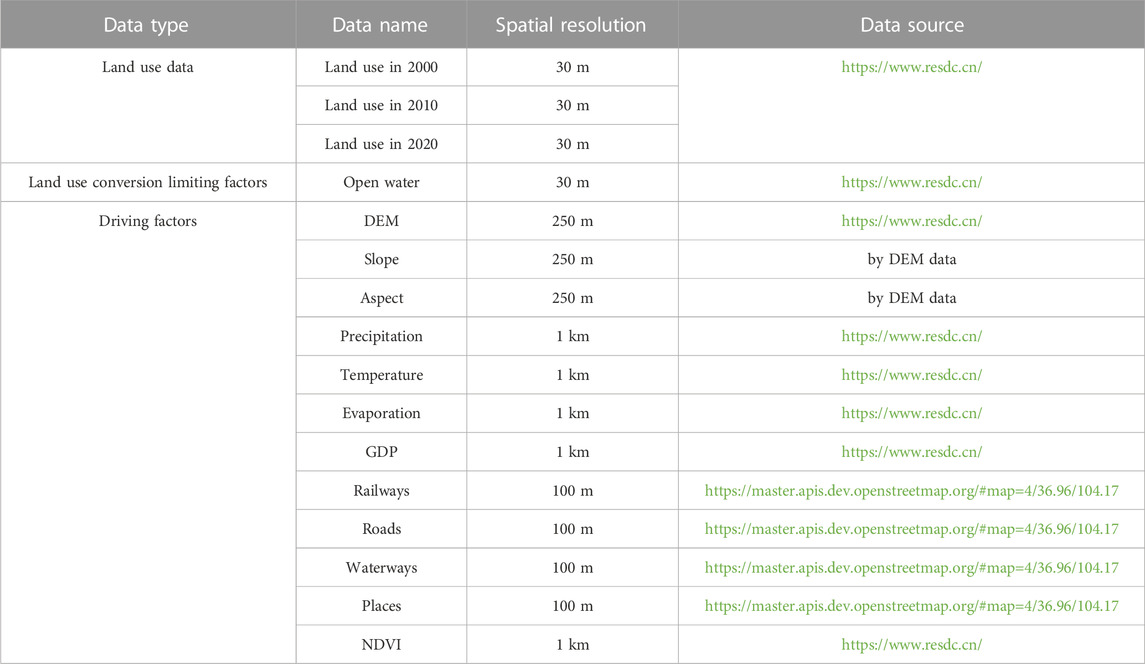
TABLE 1. Description of the driving factor data.
2.3 Research methodology
2.3.1 Research framework
This paper analyzed the spatiotemporal evolution of land use in Anhui Province between 2000 and 2020. It also simulated the 2030 land use projections based on the PLUS model by combining four dimensional drivers, including topographic factors, climatic factors, human activities, and accessibility. The habitat quality response of land use was based on Quality Habitat in the INVEST model, while a geographic probe was used to quantitative analyze the driving factors of habitat quality (Figure 2).
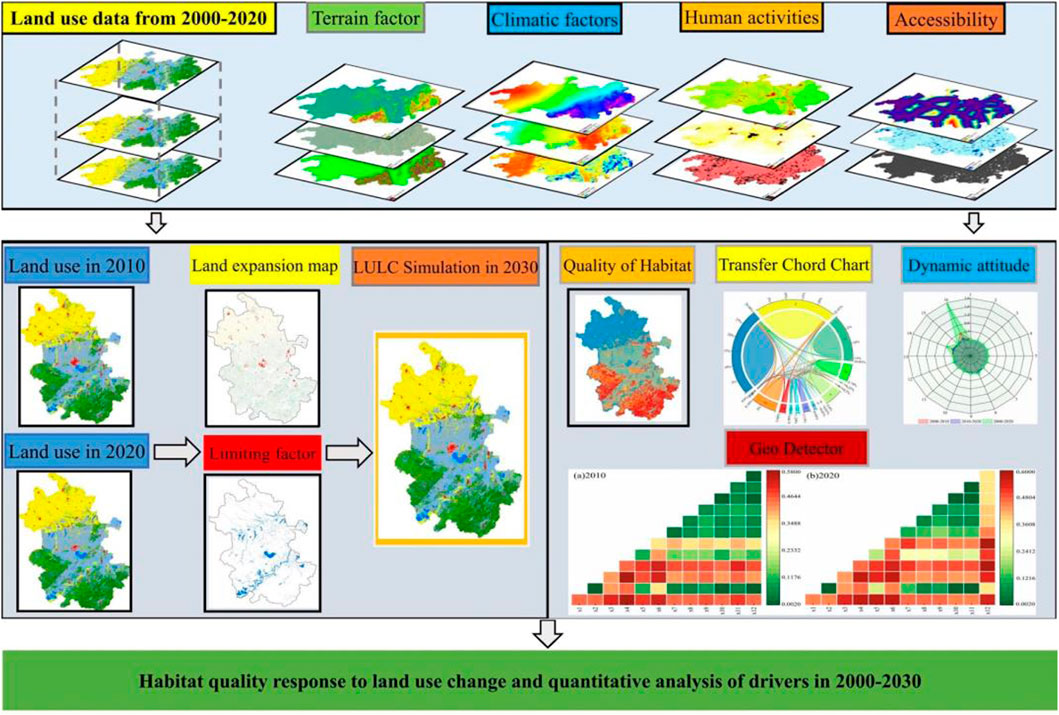
FIGURE 2. Research framework.
2.3.2 Land use dynamic attitude
Land use dynamic attitude represent the quantitative changes of land use types during a certain period. They reflect the degree of land use change and the regional differences between the change rates. In general, land use dynamic attitude may be di-vided into single land use dynamic attitude and comprehensive land use dynamic attitude. Eq. 1 for the single land use dynamic attitude is as follows:
where, K represents the dynamic attitude of a land use type during the study period. Next, Ua denotes the area of a land use type at the beginning of the research period, while Ub represents the area of that land use type at the end of the research period. Lastly, T denotes the length of the research period.
Equation 2 for the comprehensive land use dynamic attitude is as follows:
where,
2.3.3 Habitat quality model
The INVEST habitat quality model measures the regional habitat quality based on a range of habitat or vegetation types in an area and their degree of degradation. The model assumes that areas with good habitat quality also have high biodiversity (Liu and Wang, 2018). The specific calculations are as follows:
where Dxj represents the degree of habitat degradation of raster x in habitat type j. Next, R denotes the number of threat factors, while Wr is the weight of the threat source r. Yr represents the raster number of the threat source, while ry denotes the stress value of raster y, and
Where,
where, Qxj represents the habitat quality index of the x raster in habitat type j, while Hj denotes the habitat suitability of habitat type j with a value range of [0, 1]. Moreover, k represents the half-saturation constant, which is measured as half of the maximum habitat degradation and adjusted to 0.2 by the reference study (Hu et al., 2020). On the other hand, z is the normalization constant set to 2.5. Cultivated land, Industrial and mining land, rural settlements, and urban land were extracted as threat sources. The sensitivity of different habitats and the maximum stress distance, weight, Table 2, attenuation type of each source was set as shown in the following Table 3.
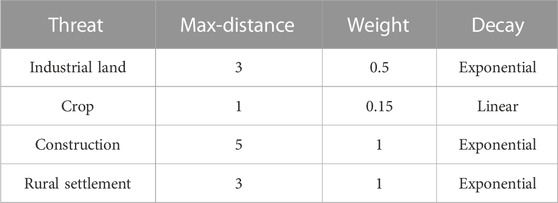
TABLE 2. Threat data.
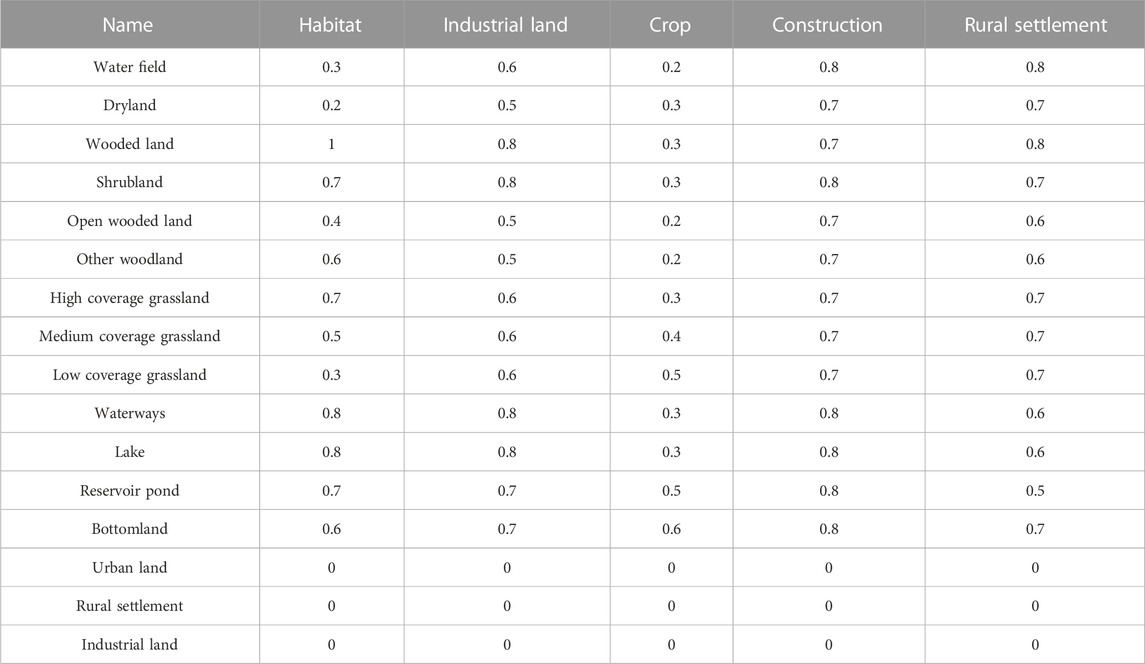
TABLE 3. Habitat sensitivity data.
2.3.4 PLUS model
The PLUS model is based on raster data and proposes a patch-generated land use change simulation model coupled with a new land expansion analysis strategy (LEAS) and a CA model based on multiple types of random patch seeds (CARS), with better understanding of the influencing factors across categories and a higher accuracy of the simulation results. The model uses a random forest algorithm to calculate the development probability of each class by extracting the expansion part of each class in 2010 and 2020. It then predicts future land use based on a CA model with multi-class random patch seeds.
The formula for the random forest algorithm in LEAS is.
where d takes the value of 0 or 1, 1 indicates that there is a conversion of other land classes to land class k, and 0 indicates any other land use conversion that does not include land class k. I is the indicator function of the decision tree;
where
2.3.5 Land use simulation driving factors
With reference to previous studies, this paper selected a total of 12 drivers in the PLUS model to simulate land use type changes with four dimensional drivers of topo-graphic factors, climatic factors, human factors, and accessibility factors (Figure 3).
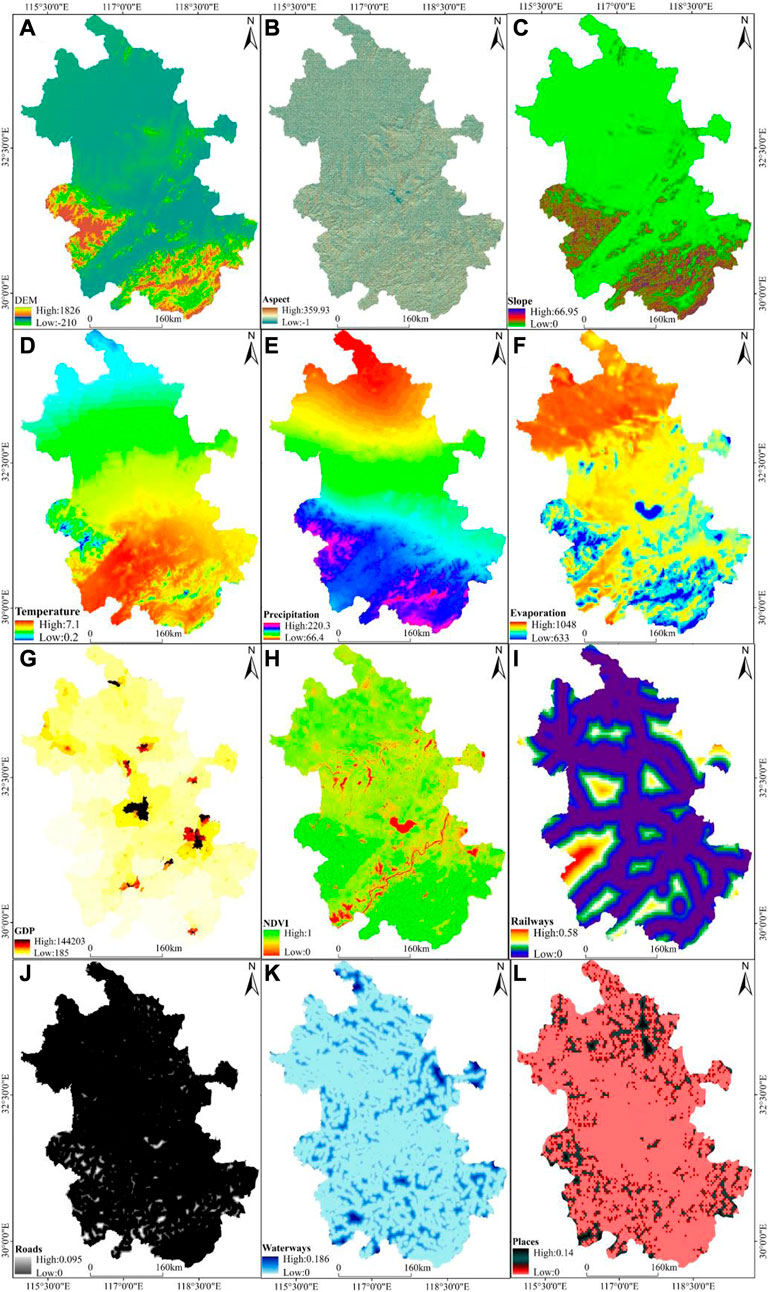
FIGURE 3. Land use simulation drivers. (A) DEM, (B) Aspect, (C) Slope, (D) Temperature, (E) Precipitation, (F) Evaporation, (G) GDP, (H) NDVI, (I) Railways, (J) Roads, (K) Waterways, (L) Places.
2.3.6 Geodetector model
Geodetector is a new statistical method for detecting spatial differentiation and revealing its driving mechanism. It consists of 4 modules: risk detection, factor detection, ecological detection, and interaction detection. This paper uses ecological detection to determine whether there is a significant influence of the driving factors on the formation of habitat quality differences. It then quantitatively analyzes the effects of these factors on habitat quality and their mutual interaction through factor and interaction detection. The aim is to clarify the driving mechanism behind habitat quality under regional land use change.
In general, ecological detection is used to reveal differences in the importance of the independent variables, as measured by the F-statistic and calculated as follows:
where, Nx1 and Nx2 denote the sample size of the two factors, while L1 and L2 denote the number of stratifications of independent variables X1 and X2.
The idea behind factor detection is that if there is an independent variable x that influences a dependent variable y, then the spatial distribution of the independent variable and the dependent variable should converge. Eq. 10 is as follows:
where, q represents the power value of the detection factor on the dependent variable,
3 Results
This study explored the response of land use change to HQ by analyzing the land time series change from 2000 to 2020 in combined with the Invest model. The PLUS model was used to project land use changes in 2030 and analyzed the evolutionary trends of HQ in 2030. The extent to which different drivers contribute to HQ was explored in combination with a Geodetector model.
3.1 Change in land use in the period 2000–2020
Between 2000 and 2020, the main land use types in Anhui Province were Paddy field, Dryland, and Wooded land (Figure 4). Together, the sum of the three types exceeds 70% of the total research area. Paddy field and Dryland dominated the research area. Dryland was most commonly found in the north, Paddy field in the middle, and Wooded land in the south and southwest of Anhui Province. Lakes were situated in the middle and southwest of the province, while other Reservoir ponds were found in patches. High coverage grassland is distributed in the southwest, while other grassland areas are small and distributed in patches. Urban land is concentrated in the central and northern areas, while some areas in the south are concentrated in patches across the province.
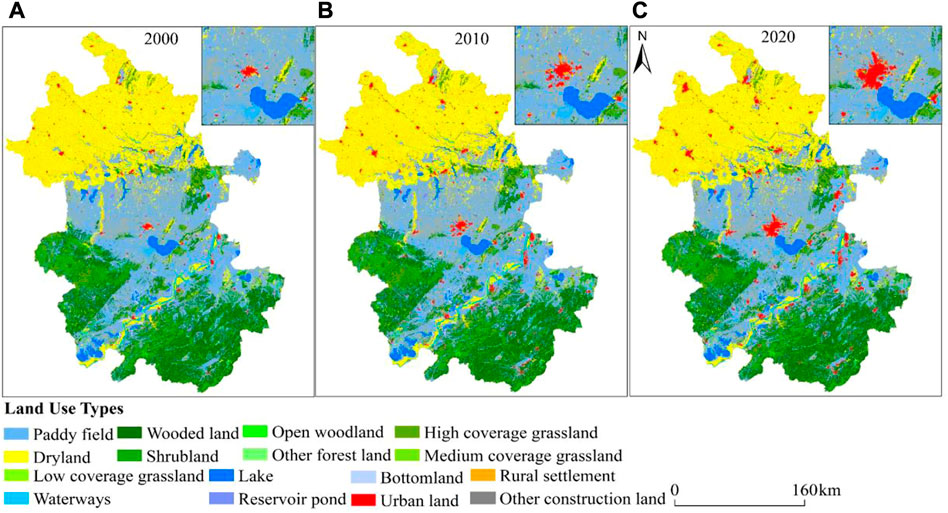
FIGURE 4. Land use in the period 2000–2020. (A) 2000 Land use, (B) 2010 Land use, (C) 2020 Land use.
As seen in Figure 5, there has been a large transition between land types in the research area between 2000 and 2010 (Figure 5A), the transferred area of Paddy field, Dryland, and Wooded land accounted for 21.57%, 11.23%, and 11.26%, respectively, while the transferred area of Urban land and Rural settlement accounted for 11.85% and 22.73%, respectively. The transferred area of Paddy field and Dryland accounted for a larger share, 36.21% and 19.35%, respectively, while the transferred area of Wooded land and Rural settlement both accounted for more than 10%, and small fluctuations among other land types There were small fluctuations between land types. From 2010 to 2020 (Figure 5B) during this period, the transferred areas of Paddy field, Dryland, and Wooded land account for 22.85%, 13.93%, and 11.86%, respectively. Moreover, transferred rural settlements account for 21.09%. The transferred Paddy field and Dryland account for a larger proportion, 29.76% and 18.98%, respectively, and the transferred-out area of Rural settlement accounted for 19.89%. Between 2000 and 2020 (Figure 5C), the transferred area was 17,959.51 km2, accounting for 9.43% of the total research area. The transferred areas of Paddy field, Dryland, and Wooded land account for 19.46%, 11.77% and 10.21%, respectively. The transferred areas of Urban land and Rural settlements accounted for 14.38% and 22.12%, respectively. The transfer out of paddy land and dry land accounted for a relatively large area of 34.80% and 21.45% respectively, while transferred rural settlement accounted for 16.35%. In 2000–2020, 1898.86 km2 of Paddy field was transferred to Rural settlement, 1941.01 km2 of Dry land was transferred to Rural settlement, 959.03 km2 of Wooded land was transferred to Paddy field, and 1,186.64 km2 and 1,433.37 km2 of Rural settlement was transferred to Paddy field and Dry land. 1) This transfer reflected the squeezing of agricultural and ecological space by human development and construction, and more significantly, the urbanization process occurred mainly in the urban periphery. 2) The mutual transformation of Paddy field and Waterways was a mutual game of returning land to the lake and creating land around the lake. 3) The conversion of Paddy field to Wooded land and High coverage grassland, and the conversion of High coverage grassland to Wooded land was also larger, reflecting the effectiveness of Wooded land growth and ecological conservation and restoration projects. 4) The partial conversion of construction land to Paddy field was the result of intensive planning of village land and reclamation of Paddy field.

FIGURE 5. Land use transfer chord map. (A) 2000–2010 Land use transfer, (B) 2010–2020 Land use transfer, (C) 2000–2020 Land use transfer.
It can be seen from the dynamic attitude of land use under different time series (Figure 6; Table 4). Between 2000 and 2010, the composite land use dynamic attitude of the research area was 0.14%. During this period, Paddy field and Dryland were significantly reduced with a dynamic attitude of −0.26% and −0.17%, respectively, while Urban land and other urban land changed dramatically with 8.59% and 38.40%, respectively. The dynamic attitude of other land types was less than 0.1% and tended to be stable. Between 2010 and 2020, the dynamic attitude of integrated land use was 0.12%, while the dynamic attitude of medium coverage grassland, low coverage grassland, urban land, and other urban land were 6.76%, 3.43%, 4.94%, and 11.70%, respectively. Furthermore, from 2000 to 2020, the dynamic attitude of integrated land use was 0.51%. Areas covered with Paddy field, Dryland, and open Wooded land actively changed, with dynamic attitude of −0.93%, −0.68%, and −0.41%, respectively. Lastly, the area of medium coverage grassland, low coverage grassland, urban land, and other urban land showed an abrupt increase with a dynamic attitude of 13.38%, 6.76%, 35.52%, and 190.05%, respectively.
FIGURE 6. Single action land use attitude.

TABLE 4. Comprehensive land use dynamic attitude.
3.2 Habitat quality changes from 2000 to 2020
The paper divided the habitat quality results into five classes according to the equidistant interval method, namely, poor habitat quality (0 ∼ 0.2), worse habitat quality (0.2 ∼ 0.4), middle habitat quality (0.4 ∼ 0.6), good habitat quality (0.6 ∼ 0.8), and excellent habitat quality (0.8 ∼ 1.0). The spatial distribution indicates (Figure 7) that the poor and worse habitat quality dominates. The poor habitat quality is distributed in the northern part of the province, while the worse habitat quality is found in the central part. The good and excellent habitat quality are both distributed in the southwestern and southern regions of the province, while the middle habitat quality is clustered in patches in the southwestern region. Statistics from 2000, 2010, and 2020 indicate that the mean value of habitat quality in Anhui Province was 0.43, 0.42, and 0.42, respectively. Thus, the habitat quality gradually decreases, while the standard deviation of habitat quality increases from 0.32 in 2000 to 0.33 in 2020. Other than the poor and worse habitat quality classes, the zoning statistics suggest that there is little change in the percentage of classes. Namely, the percentage of poor habitat quality increased by 1.47% and the percentage of worse habitat quality decreased by −1.41%. All other classes showed an insignificant changing trend from 2000 to 2020. The habitat quality transfer provided in Figure 8 shows that the habitat quality level transfer change is not significant from 2000 to 2010. Conversely, the quality change is active between 2010 and 2020, mainly for poor and good habitat quality whose transfer characteristics are significant. Habitat quality remains stable in the northern part of the research area, with no transfer.
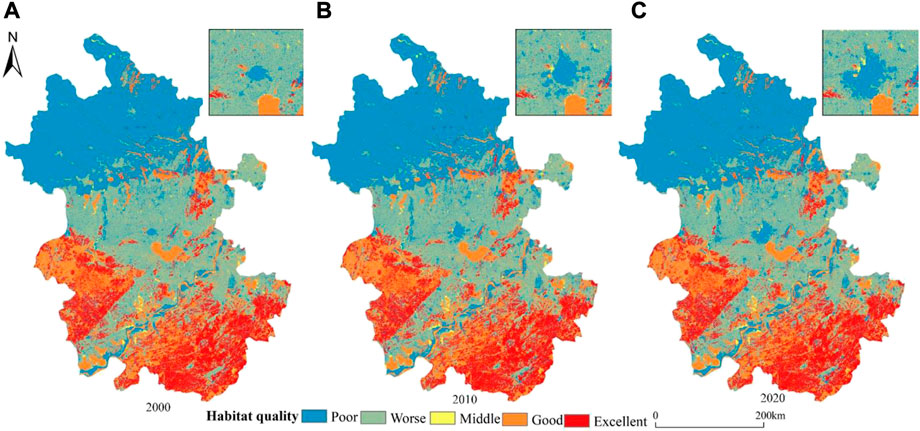
FIGURE 7. Habitat quality in the period 2000–2020. (A) 2000 Habitat quality, (B) 2010 Habitat quality, (C) 2020 Habitat quality.
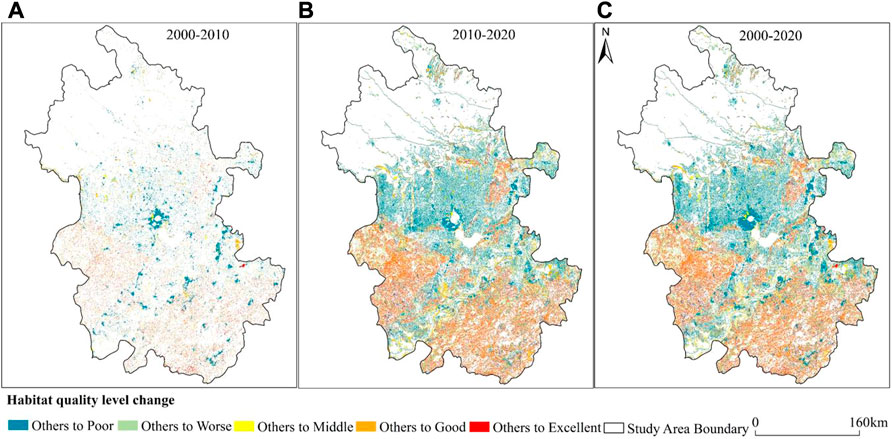
FIGURE 8. Habitat quality transfer in the period 2000–2020. (A) 2000 Habitat quality transfer, (B) 2010 Habitat quality transfer, (C) 2020 Habitat quality transfer.
3.3 Simulation of land use in 2030
3.3.1 Validation of the 2020 land use simulation
To clarify the spatiotemporal evolution trend of Anhui Province in 2030, the paper based the simulation on the predicted land use change in 2000 and 2010. The kappa and FOM values of the 2020 land use prediction were calculated as 0.87 and 0.06, respectively (Figure 9). These values are highly consistent with the real land use layer in 2020 and the simulation accuracy is high, meeting the requirements of the prediction simulation. The distribution characteristics of the predicted land use types and the real land use types in 2020 are consistent. However, the predicted urban land area is slightly less compared to the real one, while the distribution of other land types remains highly consistent.
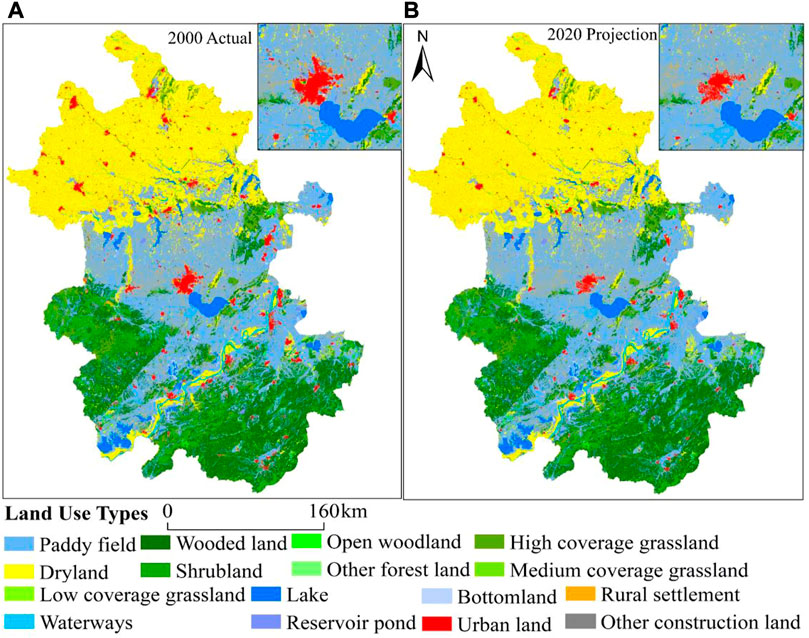
FIGURE 9. Land use simulation in 2020. (A) 2020 Actual Land use, (B) 2020 Projection Land use.
3.3.2 Analysis of potential drivers of land use expansion
Research on the probability of development of different land use types (Figure 10) and the weight of driving factors on the development potential of various land use types through the LEAS module in PLUS (Figure 11). Among them, the development probability of medium coverage grassland and low coverage grassland is the smallest, basically in a stable state. The reason for this is that the area of moderately and low coverage grasslands is too small. That Paddy field and waterways are most influenced by NDVI with 14.77% and 19.87%, respectively. Dryland and low coverage grassland are most influenced by precipitation, namely, 17.02% and 23.94%. Moreover, wooded land, shrubland, lake and reservoir ponds are most affected by DEM, with an influence of 18.30%, 21.23%, 51.87%, and 23.81%, respectively. Open woodland is mainly distributed in the area with 18.81% of evapotranspiration; Other woodland is distributed in the area with 28.56% of temperature. High coverage grassland is distributed in the area with 17.88% of slope. Lastly, medium coverage grassland, bottomland, urban land, rural settlement, and other urban land are most affected by the GDP, with the degree of influence of 52.11%, 24.33%, 25.08%, 13.30%, and 16.08%, respectively.
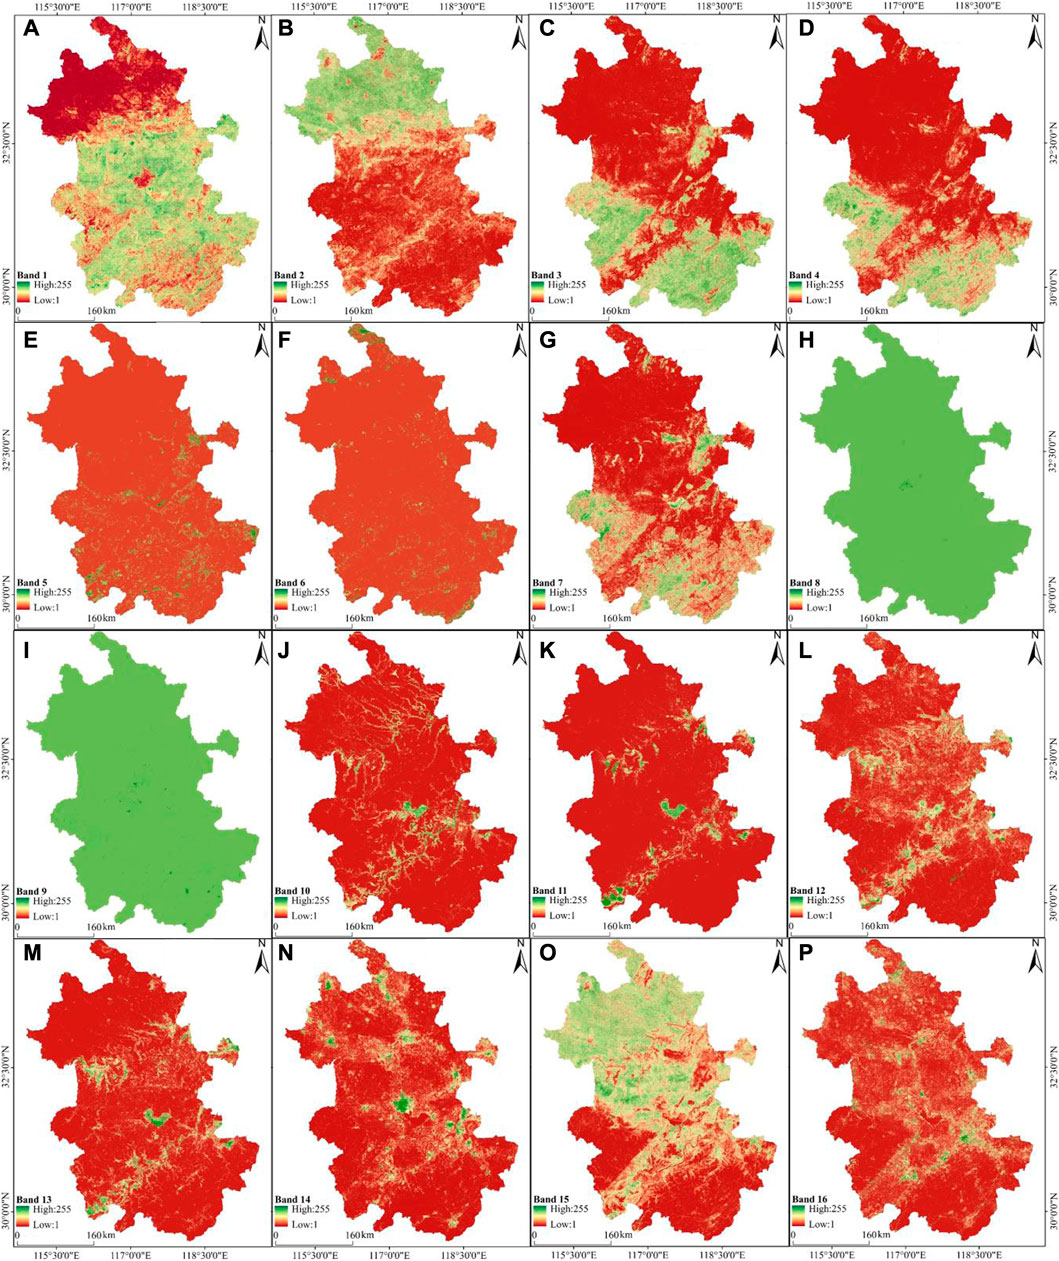
FIGURE 10. Probability of land use development. (A) Land use Band 1, (B) Land use Band 2, (C) Land use Band 3, (D) Land use Band 4, (E) Land use Band 5, (F) Land use Band 6, (G) Land use Band 7, (H) Land use Band 8, (I) Land use Band 9, (J) Land use Band 10, (K) Land use Band 11, (L) Land use Band 12, (M) Land use Band 13, (N) Land use Band 14, (O) Land use Band 15, (P) Land use Band 16.
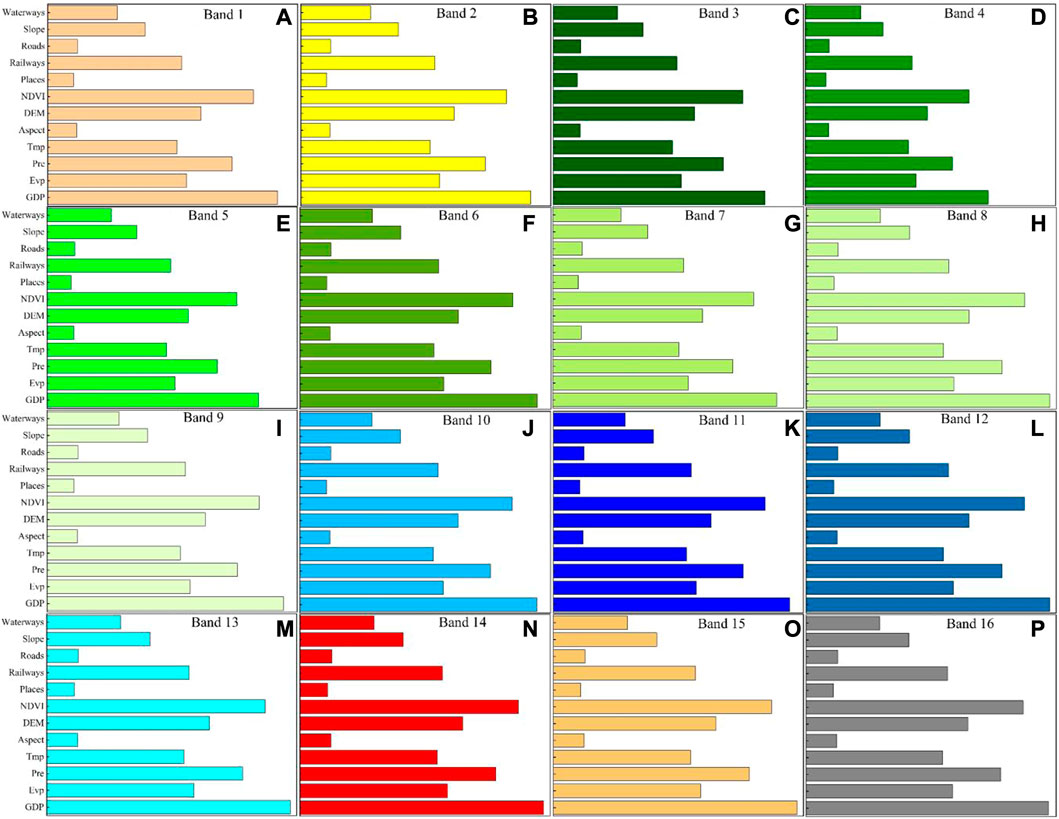
FIGURE 11. Weighting of the importance of different drivers affecting land use change. (A) Land use Band 1 Contribution, (B) Land use Band 2 Contribution, (C) Land use Band 3 Contribution, (D) Land use Band 4 Contribution, (E) Land use Band 5 Contribution, (F) Land use Band 6 Contribution, (G) Land use Band 7 Contribution, (H) Land use Band 8 Contribution, (I) Land use Band 9 Contribution, (J) Land use Band 10 Contribution, (K) Land use Band 11 Contribution, (L) Land use Band 12 Contribution, (M) Land use Band 13 Contribution, (N) Land use Band 14 Contribution, (O) Land use Band 15 Contribution, (P) Land use Band 16 Contribution.
3.3.3 Land use simulation in 2030
Based on the verification by accuracy, it is assumed that the land use change in Anhui Province only follows the historical development trend, i.e., the natural and socio-economic factors basically develop along the present rate, which is defined as the natural development scenario in this paper. Using the PLUS model to simulate the land use in Anhui Province in 2030 was shown (Figure 12A). The spatial distribution of land use in 2030 basically maintained a high degree of similarity with that in 2020. Among them, dry land was mainly distributed in the northern part of the study area and on both sides of the Yangtze River basin, while paddy field was mainly distributed in the central region of the study area and dominated the land use types. The urban land was mainly clustered and concentrated in the central built-up area of the study area; the woodland and grassland types were mainly distributed in the southwest and south and part of the eastern area of the study area. However, the areas of Paddy field and Dryland have an increasing trend, with an increase of 0.71% and 0.11%, respectively. On the other hand, wooded land, reservoir ponds, urban land, and other urban land experience a small decrease, with a decrease of −0.16%, −0.11%, −0.56%, and −0.37%, respectively. The change trends of other land use types remain unchanged, with a change rate of less than 0.1%.
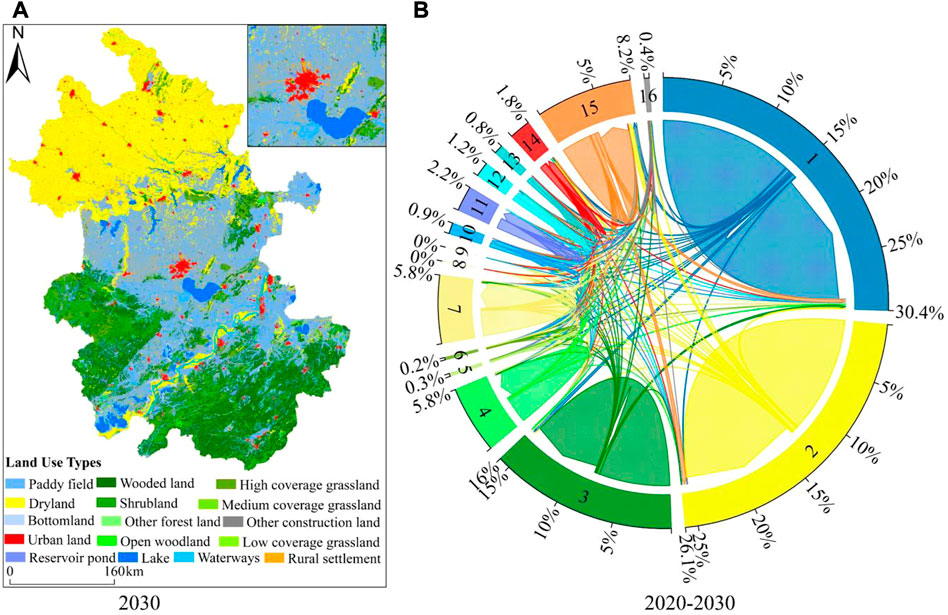
FIGURE 12. (A) Land use simulation in 2030, (B) Land use transfer in the period 2020–2030.
As shown by the land use transfer chord diagram for 2020–2030 (Figure 12B), the overall land use change area was 17,789.03 km2, accounting for 9.4% of the total area of the study area. The transferred areas of paddy field, dry land and rural settlement were relatively large, 5,484.16 km2, 3,243.27 km2, and 3,684.68 km2 respectively, with transfer ratios of 30.83%, 18.23% and 20.71% respectively, and paddy field and dry land were mainly transferred to rural settlement. Medium coverage grassland and low coverage grassland were transferred to the least area, 1.08 km2 and 1.15 km2 respectively. The largest area was transferred from paddy field and rural settlement, with 3,936.27 km2 and 3,558.61 km2, respectively, and the transfer ratio was 22.13% and 20.00%, respectively. The other land types were dominated by small transfers among them.
3.3.4 Habitat quality changes in 2030
Based on the coupling of PLUS and INVEST, the paper obtained the distribution of habitat quality classes in Anhui Province for 2030 (Figure 13A). The mean value of habitat quality in 2030 is 0.41, exactly 0.01 lower than that in 2020. Even though the habitat quality continues to decrease, this decrease is small, and the standard deviation remains unchanged between 2030 and 2020, indicating a relatively stable habitat quality in 2030. Between 2020 and 2030 (Figure 13B), there is a large shift in the area of poor habitat quality. Namely, it increases by 1.06%, mainly in the southwestern and eastern edges of the province. Moreover, worse habitat quality was found primarily in the central part of the research area, with an increase of 0.15%. The areas of middle habitat quality, good habitat quality, and excellent habitat quality exhibit a decreasing trend, with a decrease of −0.10%, −0.55%, and −0.55%, respectively. The areas of good habitat quality and excellent habitat quality remain consistent, they were mainly distributed in the southwest and south of the research area, with a small area shift in the east.
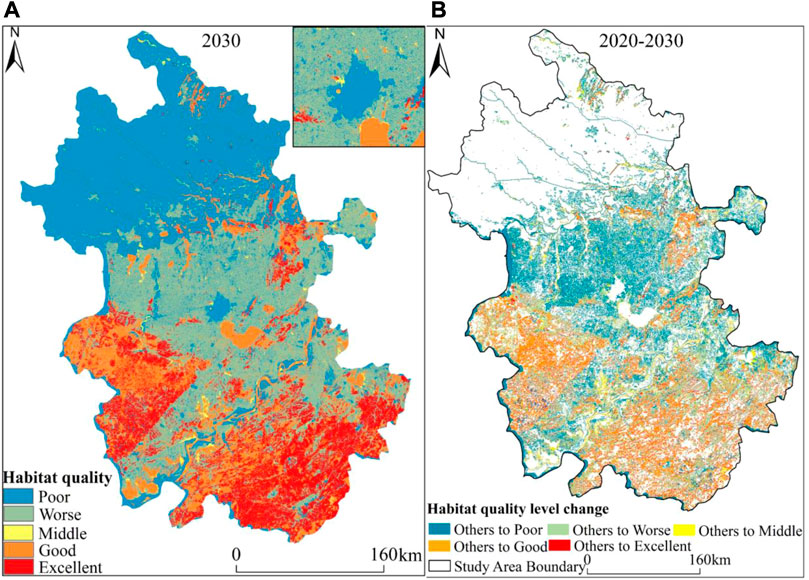
FIGURE 13. (A) Habitat quality in 2030, (B) Habitat quality transfer in the period 2020–2030.
3.4 Quantitative analysis of habitat quality drivers
3.4.1 Structure and analysis of variance and factor detectors
Based on previous research, this paper selected 12 driving factors to calculate the amount of change of each influencing factor. The data were then discretized into 5 layers by the natural breakpoint method, and their effects on habitat quality were studied by using the geographic detector’s variance and factor detector (Table 3). The main influencing factors were DEM, Aspect, Precipitation, and Evaporation, with the explanation rates of 45.4%, 41.7%, 44.6%, and 35.0%, respectively, in 2010, and 45.9%, 42.1%, 47.0%, and 44.3%, respectively, in 2020. These results suggest that habitat quality has a high correlation with topographic and climatic factors. Furthermore, the explanation rate of the influencing factors of habitat quality in 2020 is higher than the overall explanation rate in 2010. Even though the level of habitat quality was most influenced by DEM and Precipitation, the explanatory power of Places increased in 2020. This increase may be related to the rapid rate of urbanization expansion, i.e., when urbanization expansion accelerates, habitat quality perturbation becomes active. Table 5.
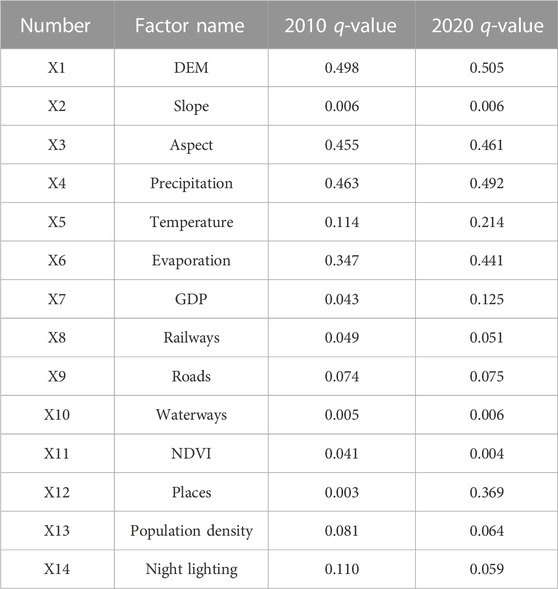
TABLE 5. Results of the variance and factor detector of habitat quality in Anhui Province.
3.4.2 Interaction detector structure and analysis
Based on the interaction detector, the type and magnitude of factor two-by-two interactions on habitat quality were INVEST gated. Results from 2010 demonstrate that DEM and Temperature, DEM and GDP, DEM and Railways, DEM and Roads, DEM and Waterways, DEM and NDVI, DEM and Places Precipitation and Waterways, Precipitation and NDVI, Precipitation and Places, Temperature and Railways, Temperature and Waterways, Temperature and NDVI, Temperature and Places, Evaporation and Places, GDP and Waterways, Railways and Waterways, Railways and Places, Roads and Waterways, Waterways and NDVI, Waterways and Places, NDVI and Places, DEM and Population density, DEM and Night lighting, Slope and Population density, Slope and Night lighting, Precipitation and Population density, Precipitation and Night lighting, Places and Population density, Temperature and Night lighting interaction types are non-linearly enhanced. The remaining factor interactions are bifactor enhanced. Secondly, results in 2020 indicate that DEM and Temperature, DEM and GDP, DEM and Railways, DEM and Roads, DEM and Waterways, DEM and NDVI, Precipitation and Waterways, Precipitation and NDVI, Temperature and Railways, Temperature and Waterways, Temperature and NDVI, Evaporation and NDVI, Railways and Waterways, Railways and NDVI, and Waterways and NDVI, Waterways and Places, DEM and Population density, DEM and Night lighting, Temperature and Night lighting, the type of interaction between the previously mentioned impact factors is a non-linear enhancement. The interaction between the remaining factors was bivariate enhanced. The result demonstrated that most factors have a stronger effect on habitat quality when they interact dual-dual. Moreover, the results showed that the q-value of the interaction of other factors is greater than the sum of the q-values of the two factors. In other words, none of the factors are independent in their effect on habitat quality and there is an enhanced dual-dual interaction.
The results of interaction detection of factors influencing habitat quality were plotted according to the q-value of the interaction (Figure 14). The results of interaction detection further complemented the results of divergence and factor detection. Results from 2010 found that DEM, Aspect, and Precipitation interacted strongly with each of the other factors, indicating that DEM and Aspect changes had significant effects on habitat quality, while the Precipitation exacerbated the habitat quality response. Furthermore, results from 2020 found that DEM, Aspect, Precipitation, and Evaporation had strong interactions with each of the other factors. This is especially true with Evaporation, which had a significantly stronger degree of influence. The remaining factors with weaker single factor explanatory power interacted with other factors to produce a more significant barrel effect.
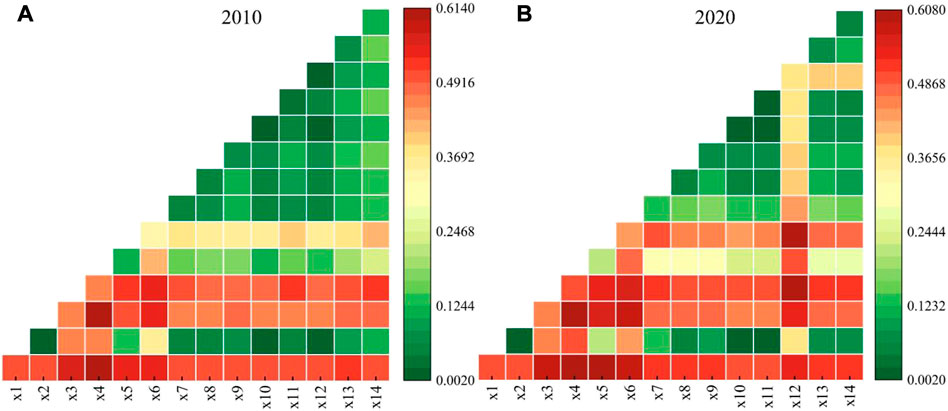
FIGURE 14. Results of interaction detection of factors influencing habitat quality in Anhui Province in 2010 (A) and 2020 (B).
4 Discussion
This study explored the response of 16 land use types to HQ from 2000 to 2020, and explored the extent of land use change using land use dynamics. Based on the PLUS model to simulate the land use prediction in 2030, combined with the Invest model to explore the evolution of HQ in Anhui Province in 2030. Quantitative contributions of different drivers to HQ were clarified using the Geodetector model. The results of the study will provide a scientific reference for the sustainable development of ecosystems and land use planning in Anhui Province.
4.1 Response of habitat quality to land use change
Anhui Province is an important grain and energy base in China. With urbanization and human activities, the conflict between the ecological environment and economic development is steadily increasing. Based on land use data from three periods between 2000 and 2020, this paper simulates the land use projections for 2030. To provide a basis for future ecological planning, spatial protection and restoration, the paper further evaluated the response between land use change and habitat quality by coupling the PLUS-INVEST model. Based on the spatial distribution of land use, the study observed that large areas of grassland and woodland were distributed in the southern and southwestern regions of Anhui Province. Large areas of Dryland were found in the north, and large areas of Paddy field and urban land in the central part of the research area. Mining mineral and coal resources in the study area caused land use structures to be disturbed, resulting in a large reduction of cultivated land and a large increase of urban land, and vegetation to be destroyed, this result was consistent with the findings of (Qian et al., 2021). Between 2000 and 2020, the area of Dryland and Paddy field decreased by 5,407.02 km2, while the fragmentation of farmland increased. The latter was mainly influenced by the urbanization and policies of returning farmland to forests and fields to lake. Urban land, rural settlements, and other urban land increased by 4,594.37 km2, thus becoming the most dominant landscape in Anhui Province. Furthermore, the development of anthropogenic activities has led to a continuous aggregation of urban land patches, concentrated in the provincial capital Hefei and along the riverine urban agglomerations in a patchwork distribution (Hu et al., 2020). In 2010, when the construction of the demonstration zone of the Anhui Wanjiang City belt was incorporated into the national development strategy, the provincial industrial structure began to develop and attracted many people to the province. This led to the continuous expansion of urbanization, which in turn encroached on productive land such as Paddy field and Dryland. Urban land is highly concentrated and poses a threat to the habitat quality of other regions. With the construction of ecological civilization projects, the quality of habitats surrounding nature reserves such as woodlands, grasslands, and wetlands has been improved. However, the overall improvement is still not significant. With the progress of the 14th Five-Year Plan, the state has strengthened the construction of an ecological civilization. This is especially true of the current proposal which advocates for returning forests to cultivation, and lakes to fields, aiming at sustainable human development and long-term effective use of resources. This paper found that the area of Dryland and Paddy field increased by 1,561.35 km2 from 2020 to 2030, while the area of urban land and other urban land decreased by 1765.27 km2, which is in line with ecosystem protection. While strictly adhering to the ecological protection red line, An hui Province promotes the implementation of ecological protection and restoration projects to reduce the damage to ecological source sites caused by the expansion of urban land and farmland reclamation. Furthermore, these ecological policies aim to improve the patch area of habitats and the connectivity between patches, thus improving the overall habitat quality of Anhui Province.
4.2 Impact of drivers on habitat quality
The spatial differences in habitat quality in Anhui Province are the result of a combination of the natural environment and socio-economic development. Namely, the spatial heterogeneity of natural resource environments among cities formed the initial spatial pattern of habitat quality. With the increase in population and rapid socio-economic development, the relative aggregation and continuous expansion of construction land, the increasing demand for land resources, and the disturbance of other factors have led to increasing spatial variability in habitat quality.
Between 2000 and 2020, land use types in Anhui Province experienced continuous dynamic changes, while the regional habitat quality exhibited a declining trend. Furthermore, from 2010 to 2020, habitat quality transfer was characterized significantly, especially in the southern part of the study area, dominated by the transfer of good and excellent habitat quality. From 2020 to 2030, dominated by poor habitat quality transfer, especially in the central and western fringes of the research area. Between 2020 and 2030, poor habitat quality will be dominant, specifically in the central and western edges of Anhui Province. The spatial differentiation of habitat quality in the study area was the result of multiple factors. The synergistic enhancement among these driving factors intensified the spatial differentiation of habitat quality (Dong et al., 2022). The impact of each factor on the spatial distribution of habitat quality is different, and the difference between most factors has always been significant. The superimposed impact of two factors on the spatial distribution of habitat quality is greater than the impact of the single factor (Hu et al., 2022). The Geodetector results indicate that DEM, Slope, Precipitation, and Railways have high explanatory power for good habitat quality, the results of the study were consistent with the findings of different grid-scale habitat quality driving mechanisms in megacities (Hu et al., 2022). In other words, these factors largely influence the status of biological habitat quality. Furthermore, Temperature, Evapotranspiration, GDP, Roads, and NDVI indices also influenced habitat quality, showing that they are also important factors affecting biological habitat quality conditions. The explanatory power of habitat quality did not change for Slope and River, suggesting that the spatial distribution of habitat quality was not influenced by these two factors, which is consistent with the findings (Chen et al., 2021). Lastly, with urbanization development, the explanatory power of settlements rapidly increased, which is again consistent with habitat quality reduction due to the expansion of urban land in Changchun City (Bai et al., 2019). The results of this study showed that topographic and climatic factors were the main drivers affecting the spatial pattern of habitat quality, and the intensity of human activities drove the spatiotemporal evolution of habitat quality. The future regional development of Anhui Province should focus on the areas with the most prominent HQ degradation and rapid urbanization development, and strive to deal with the relationship between human and nature to provide a reference for promoting high-quality development in Anhui Province.
4.3 Limitations and uncertainties
This study examined the response and drivers of habitat quality to land use change by studying long time series. Longitudinal studies weaken the abrupt variability of short-term data and thus reduce uncertainty. Future trends in habitat quality are also identified from future land use data. However, this paper choosed a land use interval of 10 years per phase, which was not specific enough for the response of economic development to land use. Therefore, we will conduct land use research with a time interval of 5 years in the future stage. Furthermore, by examining the driving mechanisms of habitat quality through Geodetector models, the quantitative effect of various factors is clarified. However, there are data limitations in the driver analysis. In addition, multi-scenario predictions under future development are not considered in the PLUS prediction model, which is a limitation that will be further INVEST gated in future work. The results of the urban land use simulations differed significantly from the actual model, due to the fact that the simulated results remained largely consistent for most of the simulated land use types. This situation caused by the resolution of the driving and limiting factors, led to the simulation of urban land classes differing from the real simulation results. The underestimation of urban land area by LULC products can be described by a logarithmic law, and the potential threshold of this law is about 30 m resolution. When using LULC products with coarse resolution, the urban features are severely distorted. Therefore, in subsequent studies, more high-precision data are needed for predictive simulations.
Based on the land use-driven change assessment of HQ, the ecological impacts of different land use types were identified. These provide support to decision makers to optimize land use structure and achieve the sustainable development goals. The rapid urbanization in the southern region of the study area accelerated the transfer of forest to other land types, leading to a continuous decline in forest HQ. Because the southern region is an ecologically protected area, it is necessary to reasonably delineate the urban development boundary (Cao et al., 2021), limit the disorderly expansion of urban open space, actively build ecological corridors, stabilize the ecosystem structure (Andersson et al., 2019), and strictly observe the ecological protection red line. Although the HQ for large open water and collapsed water areas formed by coal mining subsidence were the highest in the region, further water expansion prevention and control measures are still needed because natural land use transfer is irreversible. In addition, farmland ecosystems represented the largest area encroached upon during urbanization; therefore, the red line of 1.8 billion acres of cultivated land protection needs to be strictly observed (Zhou et al., 2021). Development should accommodate increasing HQ under urbanization and socioeconomic development goals. By setting up four scenarios for land use simulation and analysis, we optimized land use structure, improved land utilization, and provided important references for future ecological construction and land use expansion in the basin.
5 Conclusion
Combining ArcGIS 10.6 software with the habitat quality module of the PLUS model and the INVEST model, this paper investigated the spatiotemporal evolution characteristics of land use change projections and habitat quality in Anhui Province between 2000 and 2030. The Geodetector model then further explored the driving mechanisms of habitat quality changes. The main conclusions are as follows.
(1) Between 2000 and 2020, Anhui Province was dominated by Paddy field, Dryland, and wooded land, which together covered more than 70% of the total area. Paddy field, Dryland, wooded land, urban land, and rural settlements were interconverted, with the spatial distribution of each patch showing significant heterogeneity. In 2030, Paddy field and Dryland areas experienced an increase, while wooded land, reservoir ponds, urban land, and other urban land demonstrated a small decrease. Other remaining land uses remained unchanged.
(2) During the 20-year research period, the overall habitat quality in Anhui Province exhibited a small unilateral decline, with poor and worse habitat quality dominating. Due to the rapid expansion of urban land, the habitat quality around the regional centre decreases significantly. Compared to the habitat quality in 2020, the habitat quality in 2030 exhibited a small decrease, while the poor habitat quality increased, mainly in marginal areas.
(3) Natural environment and socio-economic development are important for the development of spatial variability in habitat quality in Anhui Province. Among these factors, DEM, Aspect, Precipitation, and Evapotranspiration have high explanatory power for habitat quality. Furthermore, the explanatory power of influencing factors in 2020 was higher than in 2010, with a notable increase in the explanatory power of Places, showing that socio-economic factors have a decisive influence on changes in habitat quality.
Data availability statement
The original contributions presented in the study are included in the article/supplementary material, further inquiries can be directed to the corresponding author.
Author contributions
Conceptualization, GZ and SR; methodology, GZ; software, LQ; validation, GZ, SR, and LQ; formal analysis, PY; resources, PY; writing—original draft preparation, GZ All authors have read and agreed to the published version of the manuscript.
Funding
This research was funded by Key research Project of Anhui Provincial Department of Education, grant number KJ 2021A0891.
Conflict of interest
The authors declare that the research was conducted in the absence of any commercial or financial relationships that could be construed as a potential conflict of interest.
Publisher’s note
All claims expressed in this article are solely those of the authors and do not necessarily represent those of their affiliated organizations, or those of the publisher, the editors and the reviewers. Any product that may be evaluated in this article, or claim that may be made by its manufacturer, is not guaranteed or endorsed by the publisher.
References
Andersson, E., Langemeyer, J., Borgström, S., McPhearson, T., Haase, D., Kronenberg, J., et al. (2019). Enabling green and blue infrastructure to improve contributions to human well-being and equity in urban systems. BioScience 69 (7), 566–574. doi:10.1093/biosci/biz058
Bai, L., Xiu, C., Feng, X., and Liu, D. (2019). Influence of urbanization on regional habitat quality: A case study of Changchun city. Habitat Int. 93, 102042. doi:10.1016/j.habitatint.2019.102042
Cao, K., Zhang, W., and Wang, T. (2019). Spatio-temporal land use multi-objective optimization: A case study in central China. Trans. GIS 23, 12535–12744. doi:10.1111/tgis.12535
Cao, Y., Kong, L., Zhang, L., and Ouyang, Z. (2021). The balance between economic development and ecosystem service value in the process of land urbanization: A case study of China’s land urbanization from 2000 to 2015. Land Use Policy 108, 105536. doi:10.1016/j.landusepol.2021.105536
Chang, X., Zhang, F., Cong, K., and Liu, X. (2021). Scenario simulation of land use and land cover change in mining area. Sci. Rep. UK 11, 12910–12912. doi:10.1038/s41598-021-92299-5
Chen, M., Bai, Z., Wang, Q., and Shi, Z. (2021). Habitat quality effect and driving mechanism of land use transitions: A case study of henan water source area of the middle route of the south-to-north water transfer project. Land 10, 796. doi:10.3390/land10080796
Dai, C., Qin, X. S., Lu, W. T., and Zang, H. K. (2020). A multimodel assessment of drought characteristics and risks over the Huang-Huai-Hai River basin, China, under climate change. Theor. Appl. Climatol. 141, 601–613. doi:10.1007/s00704-020-03236-x
Dong, J., Zhang, Z., Liu, B., Zhang, X., Zhang, W., and Chen, L. (2022). Spatiotemporal variations and driving factors of habitat quality in the loess hilly area of the yellow River basin: A case study of lanzhou city, China. J. Arid Land 14 (6), 637–652. doi:10.1007/s40333-022-0097-6
Engel, D. W., Thayer, G. W., and Evans, D. W. (1999). Linkages between fishery habitat quality, stressors, and fishery populations. Environ. Sci. Policy 2, 465–475. doi:10.1016/S1462-9011(99)00043-X
Fan, X., Gu, X., Yu, H., Long, A., Tiando, D. S., Ou, S., et al. (2021). The spatial and temporal evolution and drivers of habitat quality in the hung river valley. Land 10, 1369. doi:10.3390/land10121369
Gao, S., Yang, L., and Jiao, H. (2022). Spatio-temporal analysis of the effects of human activities on habitat quality: A case study of guiyang city, guizhou province, China. Land 11, 1837. doi:10.3390/land11101837
Geng, B., Zheng, X., and Fu, M. (2017). Scenario analysis of sustainable intensive land use based on SD model. Sustain. Cities Soc. 29, 193–202. doi:10.1016/j.scs.2016.12.013
Gong, J., Xie, Y., Cao, E., Huang, Q., and Li, H. (2019). Integration of InVEST-habitat quality model with landscape pattern indexes to assess mountain plant biodiversity change: A case study of bailongjiang watershed in gansu province. J. Geogr. Sci. 29, 1193–1210. doi:10.1007/s11442-019-1653-7
Hall, L. S., Krausman, P. R., and Morrison, M. L. (1997). The habitat concept and a plea for standard terminology. Wildl. Soc. Bull. 25, 173–182. Avaliable At: https://www.jstor.org/stable/3783301.
Hu, J., Zhang, J., and Li, Y. (2022b). Exploring the spatial and temporal driving mechanisms of landscape patterns on habitat quality in a city undergoing rapid urbanization based on GTWR and MGWR: The case of Nanjing, China. Ecol. Indic. 143, 109333. doi:10.1016/j.ecolind.2022.109333
Hu, S., Chen, L., Li, L., Zhang, T., Yuan, L., Cheng, L., et al. (2020). Simulation of land use change and ecosystem service value dynamics under ecological constraints in Anhui Province, China. Int. J. Env. Res. Pub. He. 17, 4228. doi:10.3390/ijerph17124228
Hu, Y., Xu, E., Dong, N., Tian, G., Kim, G., Song, P., et al. (2022a). Driving mechanism of habitat quality at different grid-scales in a Metropolitan City. Forests 13 (2), 248. doi:10.3390/f13020248
Huang, Y., Yang, B., Wang, M., Liu, B., and Yang, X. (2020). Analysis of the future land cover change in Beijing using CA-Markov chain model. Environ. Earth Sci. 79, 60–12. doi:10.1007/s12665-019-8785-z
Jiren, T. S., Dorresteijn, I., Schultner, J., and Fischer, J. (2018). The governance of land use strategies: Institutional and social dimensions of land sparing and land sharing. Conserv. Lett. 11, e12429. doi:10.1111/conl.12429
Liang, X., Guan, Q., Clarke, K. C., Liu, S., Wang, B., and Yao, Y. (2021). Understanding the drivers of sustainable land expansion using a patch-generating land use simulation (PLUS) model: A case study in wuhan, China. Comput. Environ. Urban Syst. 85, 101569. doi:10.1016/j.compenvurbsys.2020.101569
Liu, C., and Wang, C. (2018). Spatio-temporal evolution characteristics of habitat quality in the loess hilly region based on land use change: A case study in yuzhong county. Acta Ecol. Sin. 38, 7300–7311.
Liu, S., Liao, Q., Xiao, M., Zhao, D., and Huang, C. (2022). Spatial and temporal variations of habitat quality and its response of landscape dynamic in the three gorges reservoir area, China. Int. J. Env. Res. Pub. He. 19, 3594. doi:10.3390/ijerph19063594
Ma, X., Longley, I., Gao, J., Kachhara, A., and Salmond, J. (2019). A site-optimised multi-scale GIS based land use regression model for simulating local scale patterns in air pollution. Sci. Total Environ. 685, 134–149. doi:10.1016/j.scitotenv.2019.05.408
Newbold, T., Hudson, L. N., Hill, S. L., Contu, S., Lysenko, I., Senior, R. A., et al. (2015). Global effects of land use on local terrestrial biodiversity. Nature 520, 45–50. doi:10.1038/nature14324
O'Connor, B., Bojinski, S., Röösli, C., and Schaepman, M. E. (2020). Monitoring global changes in biodiversity and climate essential as ecological crisis intensifies. Ecol. Inf. 55, 101033. doi:10.1016/j.ecoinf.2019.101033
Peng, J., Pan, Y., Liu, Y., Zhao, H., and Wang, Y. (2018). Linking ecological degradation risk to identify ecological security patterns in a rapidly urbanizing landscape. Habitat Int. 71, 110–124. doi:10.1016/j.habitatint.2017.11.010
Qian, X., Wang, D., Wang, J., and Chen, S. (2021). Resource curse, environmental regulation and transformation of coal-mining cities in China. Resour. Policy 74, 101447. doi:10.1016/j.resourpol.2019.101447
Simeone, D., Tagliaro, C. H., and Beasley, C. R. (2021). Amazonian freshwater mussel density: A useful indicator of macroinvertebrate assemblage and habitat quality. Ecol. Indic. 122, 107300. doi:10.1016/j.ecolind.2020.107300
Song, S., Liu, Z., He, C., and Lu, W. (2020). Evaluating the effects of urban expansion on natural habitat quality by coupling localized shared socioeconomic pathways and the land use scenario dynamics-urban model. Ecol. Indic. 112, 106071. doi:10.1016/j.ecolind.2020.106071
Terrado, M., Sabater, S., Chaplin-Kramer, B., Mandle, L., Ziv, G., and Acuña, V. (2016). Model development for the assessment of terrestrial and aquatic habitat quality in conservation planning. Sci. Total Environ. 540, 63–70. doi:10.1016/j.scitotenv.2015.03.064
Thiel, R. P. (1985). Relationship between road densities and wolf habitat suitability in Wisconsin. Am. Midl. Nat. 113, 404–407. doi:10.2307/2425590
Vitousek, P. M., Mooney, H. A., Lubchenco, J., and Melillo, J. M. (1997). Human domination of Earth's ecosystems. Science 277, 494–499. doi:10.1126/science.277.5325.494
Wagner, M., and de Vries, W. T. (2019). Comparative review of methods supporting decision-making in urban development and land management. Land 8, 123. doi:10.3390/land8080123
Wang, B., and Cheng, W. (2022). Effects of land use/cover on regional habitat quality under different geomorphic types based on InVEST model. Remote Sens. 14 (5), 1279. doi:10.3390/rs14051279
Watson, K. B., Galford, G. L., Sonter, L. J., Koh, I., and Ricketts, T. H. (2019). Effects of human demand on conservation planning for biodiversity and ecosystem services. Conserv. Biol. 33, 942–952. doi:10.1111/cobi.13276
Wilcove, D. S., Rothstein, D., Dubow, J., Phillips, A., and Losos, E. (1998). Quantifying threats to imperiled species in the United States. BioScience 48, 607–615. doi:10.2307/1313420
Wu, L., Sun, C., and Fan, F. (2021). Estimating the characteristic spatiotemporal variation in habitat quality using the invest model—a case study from Guangdong–Hong Kong–Macao greater Bay area. Remote Sens. 13 (5), 1008. doi:10.3390/rs13051008
Xu, L., Liu, X., Tong, D., Liu, Z., Yin, L., and Zheng, W. (2022). Forecasting urban land use change based on cellular automata and the PLUS model. Land 11 (5), 652. doi:10.3390/land11050652
Yang, H., Huang, Q., Zhang, J., Songer, M., and Liu, J. (2021). Range-wide assessment of the impact of China's nature reserves on giant panda habitat quality. Sci. Total Environ. 769, 145081. doi:10.1016/j.scitotenv.2021.145081
Zhang, X., Liao, L., Xu, Z., Zhang, J., Chi, M., Lan, S., et al. (2022). Interactive effects on habitat quality using InVEST and GeoDetector models in wenzhou, China. Land 11, 630. doi:10.3390/land11050630
Zhang, Y., Xu, X., Li, Z., Xu, C., and Luo, W. (2021). Improvements in soil quality with vegetation succession in subtropical China karst. Sci. Total Environ. 775, 145876. doi:10.1016/j.scitotenv.2021.145876
Zhou, Y., Li, X., and Liu, Y. (2021). Cultivated land protection and rational use in China. Land Use Policy 106, 105454. doi:10.1016/j.landusepol.2021.105454
Keywords: land use change, plus model, habitat quality, driving factors, geographical detector, spatial distribution
Citation: Zhang G, Roslan SNA, Quan L and Yuan P (2023) Simulation of spatiotemporal patterns of habitat quality and driving mechanism in Anhui province, China. Front. Environ. Sci. 11:1145626. doi: 10.3389/fenvs.2023.1145626
Received: 16 January 2023; Accepted: 06 April 2023;
Published: 14 April 2023.
Edited by:
Erhan Sener, Süleyman Demirel University, TürkiyeReviewed by:
Wenfeng Zheng, University of Electronic Science and Technology of China, ChinaKai Zhu, Hubei University, China
Copyright © 2023 Zhang, Roslan, Quan and Yuan. This is an open-access article distributed under the terms of the Creative Commons Attribution License (CC BY). The use, distribution or reproduction in other forums is permitted, provided the original author(s) and the copyright owner(s) are credited and that the original publication in this journal is cited, in accordance with accepted academic practice. No use, distribution or reproduction is permitted which does not comply with these terms.
*Correspondence: Guanjin Zhang, 1006030817@qq.com