The last quarter for sustainable environment in basketball: the carbon footprint of basketball teams in Türkiye and Lithuania
 Milita Vienažindienė1
  Dalia Perkumienė
- 1Business and Rural Development Research Institute, Faculty of Bioeconomic Development, Vytautas Magnus University, Kaunas, Lithuania
- 2Department of Sport Management, School of Physical Education and Sport, Ardahan University, Ardahan, Türkiye
- 3Department of Sport Management, Economics and Sociology, Faculty of Sport Education, Lithuanian Sport University, Kaunas, Lithuania
Today, the sports industry is one of the most important sources of concern due to its negative environmental effects. Especially due to the intense competition schedule, teams and fans have to travel constantly. In this context, the aim of this study, which aims to fill the gap in the literature, is to calculate the carbon footprints of the teams in the Turkish and Lithuanian national basketball leagues based on their travels in the 2021–22 season. The research was limited to Turkey and Basketball national basketball league teams. In the study, the travel distances of the teams in both countries during the 2021–22 basketball season were used as a data set. In the study, the values used in the carbon footprint calculation of 2022 by the United Kingdom Government GHG Conversion Factors for Company Reporting and accepted as the IPCC carbon dioxide emission factor were used. While the carbon footprint, which is obtained by multiplying the emission factor directly by the distance covered by the vehicle type, is presented in tons; The average value calculated for each person was calculated in kg. In the sports sector, basketball is one of the most important sources of transportation-related carbon footprint due to its being one of the team sports and its intense competition schedule. According to the results of this research conducted specifically for Turkey and Lithuania, the total carbon footprint calculated for both countries is 53,029 tons. To make an assessment for both countries, in order to reduce travel based on sports; Arranging league calendars to include less travel, dissemination of green and clean energy-using (electric) vehicles, raising the awareness of club managers, developing environmental assessment policies specific to basketball federations, and increasing cooperation through awareness and training activities seem feasible for sustainable environment and basketball goals.
1 Introduction
Climate change probably represents the greatest challenge facing humanity this century (Eichinger, 2019). Therefore, climate change, global warming, carbon footprint, etc. environmental problems have been frequently discussed in recent years and scientific studies have been carried out on solution proposals. Dolf and Teehan (2015) state that climate change problems arising from people’s attitudes and behaviors may cause social, economic and ecological deterioration in the future. Carbon dioxide emissions, mainly caused by human activities, are considered to be the most important part of the climate change problem. Carbon emission production can cause climate change and cause 82% of environmental degradation (United States Environmental Protection Agency, 2022).
The acceleration of social life, the increase and diversification of people’s vital activities, and the unconscious continuation of consumption cause the carbon footprint to grow day by day. This situation also raises concerns about environmental sustainability. In recent years, these environmental concerns have been associated with the sports industry (Mallen and Chard, 2011; Martins et al., 2021). One of the most important parts of the climate change problem due to carbon footprint is the sports sector (Wicker, 2019; Cooper, 2020; Wilby et al., 2023). Because the sports sector is one of the areas where human activities are most intense. As in all areas of vital activity, sports and recreation activities are inextricably linked with the natural environment and environmental problems related to participation are inevitable (Casper and Pfahl, 2012; Thormann and Wicker, 2021). Perira et al. (2019) states that the negative environmental effects caused by sports have become evident, the carbon footprint has grown, and measures should be taken within the sports sector.
It can be said that one of the most important carbon footprint sources in the sports sector is the transportation and travel of active and passive participants (Chard and Mallen, 2012; Triantafyllidis, et al., 2018). Especially in large and international sports organizations, the travels of the participants and spectators to the host country to participate in the organization appear as an important carbon footprint source (Du Preez and Heatth, 2016; Pereira et al., 2017). In addition, transportation preferences preferred for participation in local events and organizations organized within the country are another environmental threat. The most popular and top 200 stadiums in the United States attract approximately 200 million fans each year due to different sports events. Therefore, this athlete and fan mobility is responsible for 85% of the resulting carbon footprint. However, in 2018, about 5 million participants traveled to the World Cup held in Russia, causing almost 1.6 million tons of carbon emissions. This value is equivalent to the carbon footprint of 500,000 residences in 1 year (Henczel, 2022).
Travel in the sports sector poses a significant threat to sustainable environmental goals. Especially the travels of teams and fans to participate in national and international competitions can cause a high amount of carbon emissions. Air travel, in particular, is one of the largest sources of carbon emissions in the world, and like many industries, the sports industry is constantly using the alternative of air travel, especially for participating in competitions (Wynes, 2022). It is observed that the location of sports events organized in many sports branches, especially team sports such as basketball, is determined by the relevant institutions, and sports facilities are increasingly located away from population centers, and accordingly, the behavior of traveling by personal vehicle increases (Bunds and Casper, 2018). In particular, carbon footprint studies revealed by basketball competitions show that transportation is the most important carbon footprint source. The image below shows the distribution of the carbon footprint caused by basketball competitions. Figure 1.
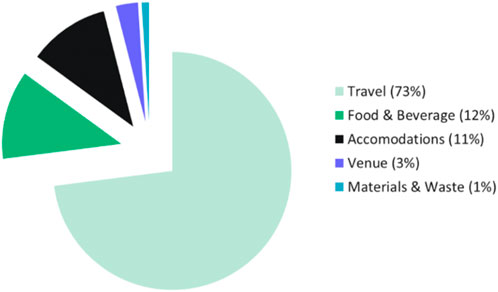
FIGURE 1. Carbon footprint of basketball game (Watson, 2015).
As can be seen in the graph, the travels of the participants (players and spectators) for the competition represent 73% of the total carbon footprint of the event. Food and beverage (12%) and overnight accommodation (11%) represent other important areas of influence. The remaining areas—space and materials/waste represent a relatively small portion (4%) of the event’s total carbon footprint (Watson, 2015). Hjorthol and Fyhri (2009) reveal that most of the organized activities take place outside the immediate environment and the most typical means of transportation to these activities are air and road transport. The human activity that contributes the most to environmental degradation, especially in sports branches with a busy competition schedule such as basketball, is the preference of land and air transportation vehicles (Barkenbus, 2009).
Environmental sustainability has emerged as an important issue among societies, researchers, policymakers and many different industries. Environmental impacts are evaluated through various indicators based on the life cycle assessment approach (Cucek et al., 2012). However, it is not possible to say that the handling and evaluation of negative environmental effects within the sports industry is very efficient when compared to other sectors. Therefore, it can be said that the action plans created against environmental effects are weak and overshadowed by economic concerns and sportive competition. In this context, the aim of this study, which aims to fill the gap in the literature, is to calculate the carbon footprints of the teams in the national basketball leagues in Turkey and Lithuania, depending on their travels during the 2021–22 season. For this purpose, an answer was sought for the following research question:
• What is the carbon footprint of the travels of the teams in the national basketball leagues in Turkey and Lithuania during the 2021–22 season?
The research consists of 6 steps. The first step is the introduction which is intended to give the reader an idea about the general scope of the study. The second step includes a comprehensive literature review in accordance with the scope and purpose of the research. Here, firstly, the concept of carbon footprint is presented, and then previous studies that reveal the relationship between sport and environmental problems are included. Then, the relationship between the right to a clean environment and the sports sector is emphasized. The third step includes a detailed explanation of the methodological setup of the research, data collection, and analysis processes. In the fourth step, the findings obtained from the data analyses are visualized and presented in figures and tables. In the fifth step, the results of the research are associated with previous studies and discussed in terms of their contribution to the literature. In the sixth and last step, the results of the research are summarized and recommendations are presented in relation to the results.
2 Literature review
2.1 Concept of carbon footprint
Since 1960 s, carbon footprint studies have been carried out and tried to be revealed in the scientific literature. Especially in the recent period, concerns about climate change and environmental problems have brought the concept of carbon footprint to the forefront. In recent years, it has been associated with sectors such as politics, economy, media and tourism (Wiedmann and Minx, 2008). According to the legal scope of the European Parliament, carbon footprint is accepted as the greenhouse gas resulting from the product of the coefficient of the mass of greenhouse gases in tons per tons of carbon dioxide equivalent. The carbon footprint refers to the total amount of greenhouse gas emissions, specifically carbon dioxide (CO2) and other greenhouse gases like methane (CH4), nitrous oxide (N2O), and fluorinated gases, produced directly or indirectly by an individual, organization, product, event, or location during a specific period. It is often expressed in terms of equivalent CO2 emissions and is measured in units of carbon dioxide equivalent (CO2e). (European Environment Agency, 2014). What stands out here is that carbon footprint measurements refer to emissions of Sulphur, hexafluoride, carbon dioxide, nitrous oxide and methane as well as other greenhouse gases (Konieczny et al., 2013; Danish and Wang, 2019).
Carbon footprint is defined as a measure of the damage caused by human activities to the environment in terms of the amount of greenhouse gas produced, measured in unit carbon dioxide (Atabey, 2013:84). Carbon footprint can be expressed as the effect of people’s attitudes and behaviors on the natural environment in order to meet their basic needs in the environment they live in. From a broader perspective, carbon footprint can be defined as a decisive and important detection and solution tool in determining and comparing the impact of consumption activities of individuals or societies on nature and in producing solutions to emerging global and local problems (Şahin, 2019:48).
In other words, carbon footprint is a concept that defines environmental pollution, greenhouse gas and carbon dioxide emissions caused by people, institutions, businesses and organizations and expresses a dimension of environmental problems. And this concept emerges as a result of all vital activities, as seen in the image below (Global Footprint Network, 2017). Figure 2.
FIGURE 2. Concept of carbon footprint.
In developing societies, the attitudes and behaviors of people and the activities they are engaged in have gradually intensified. This situation has enlarged the carbon footprint of societies, and the natural environment and resources have been destroyed. In particular, the carbon footprint of mass human behavior is increasing day by day. As a matter of fact, it is obvious that every activity of every individual, institution and organization has an impact on nature. In other words, carbon footprint is defined as the measure of the damage done to the environment in terms of the carbon footprint of people’s attitudes and behaviors measured in carbon dioxide and the amount of greenhouse gases produced (Bekiroğlu, 2022).
2.2 The scientific evidences of carbon footprint in the sports industry
The International Olympic Committee has gathered the negative effects of sports on the environment under two main headings. These are the negative effects of sports organizations and facilities. Depending on the organizations, negative environmental effects arise from production, consumption, transportation and accommodation. Depending on the installation, the emergence of air, water and soil pollution, carbon dioxide and greenhouse gas emissions caused by the energy use of new and existing facilities are reported (IOC, 2009).
One of the rapidly growing sectors in the economic and commercial climate of the modern world is sports (Akşar, 2006:54). However, with these developments in sports, negative outcomes have also started to be discovered gradually. In particular, the damage caused by the establishment and organized events and organizations to the environment and natural resources has been frequently discussed in recent years. The environmental effects of carbon dioxide and greenhouse gas emissions originating from sports have begun to be evaluated in theory and practice. The negative environmental effects of sports have become so widespread that global organizations such as the United Nations and the International Olympic Committee point out that necessary precautions should be taken and emergency action plans should be prepared (IOC, 2022).
The transportation and energy needs in the sports sector are met from fossil fuel sources, which causes carbon and greenhouse gas emissions, which causes negative environmental effects (Chard and Mallen, 2012). Why are fossil fuels and their environmental effects important in sports? For example, an international sports organization such as the FIFA World Cup causes an electricity consumption of 3 million kilowatt-hours originating from fossil fuels, which is equivalent to the electricity need of 700 households for 1 year (Schmidt, 2006).
The environmental effects caused by the electricity consumption of only 1 month of organization can be quite destructive. Especially in football, it is worrying that it produces excessive energy consumption, significant water use and negative environmental consequences that cause very high pollution (Collins et al., 2007). While the greenhouse gas emission caused by a large sports organization held in 2005 was calculated as 210,000 tons, it was reported that the athletes in the organization caused a total of 60,000 tons of emissions (Ahmed and Pretorious, 2010). It has also been reported that approximately 70,000 tons of waste is generated due to a sports organization, and only 1% of them is recyclable (Thibault, 2009). These reported numerical data are considered quite high according to the United Nations Environmental sustainability criteria. In addition, it is stated that air pollution, which occurs as a result of these environmental effects, seriously affects vital functions (UNEP, 2020).
The most important carbon footprint source in many sports branches, especially basketball and football, is transportation and travel. The literature on revealing this environmental problem presents scientific evidence. In the study carried out by Collins and Flynn. (2008), it was calculated that the “Tour de France”, an international organization organized in the bicycle branch, produced 144.120 tons of CO2 emissions, approximately 50,5 kg per participant. However, in a study on the Wales Rally, a total of approximately 1,389 tons of CO2 emissions were calculated and it was found to be approximately 20.2 kg per spectator (Collins et al., 2009). Negative environmental concerns are increasing due to the growing competitive sports structure in America. In the years 208–2019, the American National Basketball League is the largest source of travel-related carbon footprint in America Because teams and fans travel thousands of kilometres to participate in competitions. (Del Bello, 2022). All-season travel contributes to global climate change and is the source of other environmental problems. Because these travels for basketball competitions cause high amounts of carbon emissions. There are 30 teams in the basketball league and 82 matches are played. The long basketball season causes a lot of carbon emissions. Traveling by air and land transport to different cities across the country requires a significant amount of energy, resulting in greenhouse gas emissions that contribute to climate change (Green, 2023).
Another study by Pereira et al. (2019) focused on the carbon footprint of English Premier League teams over a season. According to the results of the conducted research, EPL clubs produced approximately 1,134 tons of CO2-equivalent in the 2016/17 season. In addition, it is stated that 61% of the resulting carbon footprint is composed of travels. At the 2010 World Cup held in South Africa, transportation accounted for 86% of total emissions and contributed to 2.8 million ton of CO2 emissions (Cornelissen and Wolfgang, 2010). In a study conducted by Loewen and Wicker (2021), focusing on the carbon footprint of football fans in Germany, the average seasonal carbon footprint of a Bundesliga supporter was calculated as 311.1 kg of carbon dioxide equivalent emissions (CO2-e), and 70% of the emissions were driven by cars. reached the conclusion of his journey. The total carbon footprint of all fans during the entire Bundesliga season has been calculated as 369,765.2 t CO2-e.
2.3 The implementation of persons’ right to a clean environment in sport sector towards sustainability
In debating the concept of a clean environment, scholars and lawyers have examined the relationship between human rights in general and the right to a clean environment from different positions. For example, Lansdown, (2005) and Fitzmaurice, (1999) emphasized children’s rights to a clean environment. Dogaru, (2014), states that the right to a clean environment is a natural and fundamental human right. the right to a clean environment, understood as the relationship between the environment and a person, should help regulate individual rights and the opportunity to live in a clean and safe environment (Perkumienė et al., 2020). Due to the huge emission of carbon, the rapid increase in the amount of harmful waste, pollution and the emergence of serious threats to the environment. The last decades have changed the priorities of business, as well as the sports sector, and turned their attention to the conservation of natural resources and the protection of the environment in order to ensure the right of individuals to a safe and healthy environment (Kim and Lin, 2017; Perkumienė, et al., 2020).
These problems, while ensuring the rights of individuals to a clean environment, can be partially overcome by green motives, which create a solid basis for the implementation of green business strategies (Preuss, 2013). Green business strategies refer to strategies that are interested in the safety and protection of the environment. These strategies, derived from ecological motives, are related to the provision of environmentally safe and sustainable production and services over time (Chen et al., 2016). More and more business sectors are also actively applying green strategies, guided by the green moral motive of business in terms of environmental protection (Dino, et al., 2018; Yousaf et al., 2021).
Under Thibault. (2009), a negative influence for the environmental has all sports sectors has, but at the same time there are positive steps seeking the reducing these negative environmental impacts. Sports has an important social role as it attracts attention from all segments of society. Arguably, all stakeholders in sports, including athletes, fans and managers, accept the negative effects of the environment and are seen to be trying to take responsibility for solving this problem (Perkumienė et al., 2023).
One of the main requirements for ensuring human health and the right to a safe and clean environment is clean air. Human rights and safe environment norms are powerful tools in the fight against air pollution and its health effects (Guillerm and Cesari, 2015). Dependence of human rights on environmental quality is recognized both nationally and internationally. One of the main international legal documents ensuring the right of individuals to a clean environment is the Universal Declaration of Human Rights, which emphasizes the rights of individuals to a clean environment (United Union, 1948). In this context also should be mentioned the importance of the Stockholm Declaration on the Human Environment, (United Unions, 1972) as well as the Rio Declaration on Environment and Development, (United Nations, 1992), which emphasizes the human right to a “healthy and fulfilling life in harmony with nature”. The Rio Declaration is closely related to the Stockholm Declaration and is a key piece of environmental legislation. The Rio Declaration emphasizes that people have the right to a healthy and productive life in harmony with nature (Handl, 2019).
The human right to a clean environment is also emphasized in the Maastricht Treaty. The preamble to the EU Treaty states that Member States “shall promote the economic and social development of their peoples in order to promote greater cohesion and environmental protection” (Treaty on European Union, 1992). It is also important to mention the Kyoto Protocol, which aims to reduce the greenhouse effect by limiting CO2 emissions (United Unions, 1992). The persons’ right to a clean environment is also highlighted the Treaty of Amsterdam (European Union, 1997). When analyzing international environmental documents, attention should also be paid to the importance of the Aarhus Convention (United Nations, 1998). In summary, the aim of legal instruments is to ensure the implementation of persons’ rights in solving the environmental challenges and ensuring the right to a clean environment. This area remains problematic in both national and international law. In such a situation, the question arises whether the implementation of legal norms can be strengthened in the sports sector.
3 Methods
3.1 Data collection process
In this study, which is limited to the teams in the Turkish and Lithuanian national basketball leagues, the travel distances of the teams in the Turkish Basketball Super League and the Lithuanian Basketball League for the regular season of the 2021–22 basketball season were used as a data set. There are 16 teams in the Turkish league and 11 teams in the Lithuanian league. While the teams in Turkey consisted of an average of 27 staff, 432 people travelled in total (Turkish Basketball Federation, 2022). Teams in Lithuania consist of an average of 22 people and have travelled a total of 242 (Lithuanian Basketball Federation, 2022). In total, 27 teams and 674 people from both countries travelled throughout the season for the competitions.
In the study, the type of vehicle used by each team in the 2021–22 season and the total distance travelled were used as a data set. As in all countries, fixtures are determined every year in Turkey and Lithuania, which are the subject of the research, to play the competitions and organize the leagues. These fixtures indicate when and where teams will play. In addition, this information is also available on the official web pages of the teams. In addition, the official web pages of the teams have travel information and information about when and by which vehicle they will travel to the city where the match will be played. This information, which is open data and suitable for use for scientific studies, constitutes the data set of the research. However, these data on distances were checked by the researchers and the calculations were made again.
The transportation and distances and preferred vehicle information of the relevant basketball federations and teams were checked again by the researchers. In this process, the calculation of the distances travelled by the teams in Turkey consists of two steps. In the first step, the distances travelled by the teams by plane were determined in the unit of measurement “mile” and then converted into kilometres. In the second step, the distances travelled by the teams from the official club addresses to the airport and from the airport to the facilities where the matches are played were calculated in the highway category. In Lithuania, the distances travelled between the official club addresses and the venues where the competitions are played are included in the calculation, as the team’s only travel by bus.
In obtaining these data, first of all, 2021–22 Season fixtures were obtained. Later, information about the cities and sports facilities where the matches are played was obtained from the websites of the Turkish and Lithuanian Basketball Federations (Lithuanian Basketball Federation, 2022; Turkish Basketball Federation, 2022). In this process, the distances covered by the home and away teams in and out of the city were reached via “Google maps”. In order to eliminate the uncertainties regarding the preferred vehicle type and the distances covered during the data compilation process, the information obtained regarding the vehicle type preferred especially for travel was confirmed by the relevant federation and clubs. The types of vehicles preferred by the teams to go to the competitions during the season and the distances they cover are presented in the table and graphic below:
According to the information received from the officials and airline companies, there is no air transportation within the Lithuania. Since Lithuania is a much smaller country compared to Turkey and the distance between cities is quite short, teams prefer to travel only by bus. In addition, the distance covered by the teams in Lithuania during a season is less than in Turkey, which is also related to the very small area of Lithuania. While the total distance travelled in Turkey is calculated as 228,157 km; 176,564 km of this distance was realized by plane and 51,593 km by bus. The calculated distance for Lithuania is 50,424 km. In Lithuania, for the reasons mentioned above, the teams made all their trips by bus.
3.2 Calculating carbon footprint
In line with the data obtained from the websites of the basketball federations of the two countries and from the teams, it was understood that the teams participating in the competitions travelled by plane and bus throughout the season, and the emission factors of these two vehicles were used in the carbon footprint calculation process.
In the study, the values used in the carbon footprint calculation of 2022 by the United Kingdom Government GHG Conversion Factors for Company Reporting (GOV.UK, 2023) and accepted as the IPCC carbon dioxide emission factor were used. These data express the emission factors and average capacity utilization degrees of the vehicles used according to the transportation averages. These emission factors also include direct emissions from carbon dioxide emissions and other greenhouse gases (i.e., methane and nitrous oxide) that are converted to CO2-e. United Kingdom Government GHG Conversion Factors for Company Reporting data was used to calculate the carbon footprint. In the related report, the carbon footprint resulting from the travels in all sectors is considered as scope 3. And as an example of Scope 3 emissions, the carbon emissions that occur due to the travels of the organizations are included in this calculation (GOV.UK, 2023).
The emission factors by vehicle type presented in this report are designed to assist all industries in complying with “Modern Energy and Carbon Reporting” (SECR) regulations. The GWPs used in the CO2e calculation are based on the Intergovernmental Panel on Climate Change (IPCC)’s Fourth Assessment Report covering a 100-year period. All emission factors presented in the report are in terms of ‘kg CO2-e of Y per X’ (kg CO2-e of Y per X). CO2-e is the universal unit of measurement for the global warming potential (GWP) of greenhouse gases, expressed in GWP per unit of carbon dioxide. The emission factors of the airplane and bus, which are included in the emission factors according to the vehicle type, prepared by the United Kingdom Government GHG Conversion Factors for Company Reporting, are as follows. The emission factor for the airplane is 0.2445 per kilometre for each passenger, while this value is 0.0965 for the bus (GOV.UK, 2023).
In the 2021–22 basketball season, the average carbon footprint of each member of the teams from both countries in a season was calculated using the formula and emission factors arranged in accordance with the purpose of the study. While the carbon footprint, which is obtained by multiplying the emission factor directly by the distance covered by the vehicle type, is presented in tons; The average value calculated for each person was calculated in kg. The formula used in the carbon footprint calculation process is given below:
4 Results
In this part of the research, findings regarding the carbon footprint of the travels of 27 basketball teams in the Turkish and Lithuanian national basketball leagues during the 2021–22 season are presented. While the carbon footprint calculations were made separately for both countries, the total and average per capita carbon footprint calculations were made for both countries. While the total distance covered by the Turkish basketball league teams during the 2021–22 season is calculated as 228,157 km, the total number of people traveling is 432. Findings regarding the carbon footprint calculated for Turkey are presented in Tables 1, 2 below:
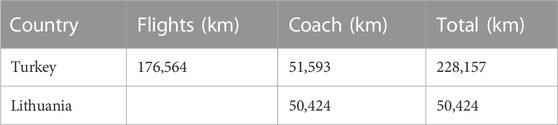
TABLE 1. Travel type and distance in Turkey and Lithuania.

TABLE 2. The carbon footprint calculated for the Turkish basketball league.
The total carbon footprint of the Turkish basketball league teams calculated based on the total distance covered for the competitions during the 2021–22 season is 48,164 tons. The average carbon footprint calculated for each person is 0.11148 kg. 43,179 tons of the total calculated carbon footprint was due to travel by plane. This corresponds to 89.64% of the total carbon footprint.
While the total distance covered by the Lithuanian basketball league teams during the 2021–22 season is calculated as 50,424 km, the total number of people traveling is 242. Basketball teams in Lithuania prefer to travel only by bus for competitions. In this case, as stated above, the fact that Lithuania is a much smaller country and the distance between the cities where the teams are located was very short. Findings regarding the carbon footprint calculated for Lithuania are presented in Table 3 below:

TABLE 3. Calculated carbon footprint for the Lithuanian basketball league.
The total carbon footprint calculated based on the total distance traveled by the Lithuanian basketball league teams for the competitions during the 2021–22 season is 4,865 tons. The average carbon footprint calculated for each person is 0.02010 kg.
The total and per capita carbon footprint calculations based on the travels of the teams of both countries in the Turkish and Lithuanian basketball leagues during the 2021–22 season were also carried out, and the results are presented in Table 4 below.
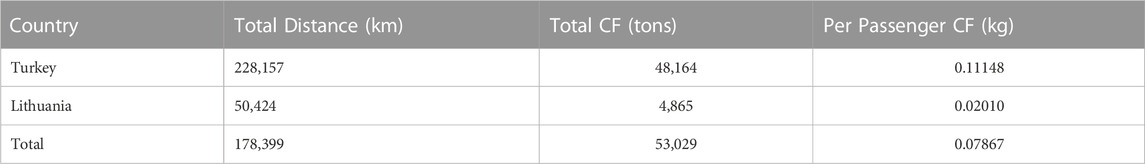
TABLE 4. Total carbon footprint calculated for Turkish and Lithuanian basketball leagues.
While the carbon footprint resulting from the travels of 27 teams and 674 people in both countries during the 2021–22 season is calculated as 53,029 tons in total; The average carbon footprint calculated for each person traveling is 0.07867 kg. Findings regarding the total carbon footprint calculated for both countries are also presented in the chart below: Figure 3.
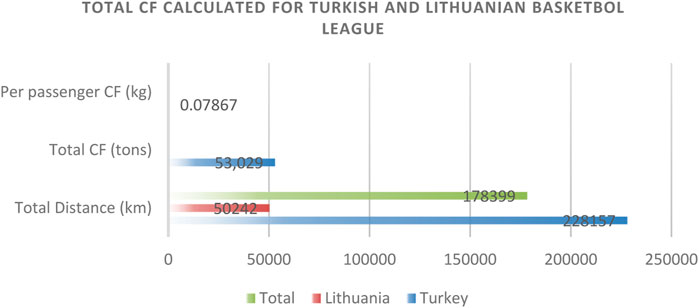
FIGURE 3. Total CF calculated for Turkish and Lithuanian basketball league.
5 Discussion
The basketball industry is a growing industry, both sportingly and commercially. This growth has also led to the emergence of environmental concerns. It is possible to see concrete reflections of basic carbon footprint sources such as transportation, energy consumption and waste production, especially depending on human mobility, in basketball events and organizations. Increasing environmental concerns in other sports branches, especially basketball, are revealed by scientific researches. Carbon footprint studies related to different sports branches are becoming more and more common. As a result of this research, which focuses on the carbon footprint of the teams in the national basketball leagues in Turkey and Lithuania in the basketball branch, due to their travels; While the carbon footprint resulting from the travels of 27 teams and 674 people in both countries during the 2021–22 season is calculated as 53,029 tons in total; The average carbon footprint calculated for each person traveling is 0.07867 kg. The total carbon footprint of the Turkish basketball league teams calculated based on the total distance covered for the competitions during the 2021–22 season is 48,164 tons. The average carbon footprint calculated for each person is 0.11148 kg. 43,179 tons of the total calculated carbon footprint was due to travel by plane. This corresponds to 89.64% of the total carbon footprint. The total carbon footprint calculated based on the total distance traveled by the Lithuanian basketball league teams for the competitions during the 2021–22 season is 4,865 tons. The average carbon footprint calculated for each person is 0.02010 kg. The fact that the carbon footprint calculated for the basketball teams in Lithuania is much lower than in Turkey, has been decisive because the teams in the country prefer to travel only by bus for the competitions. The fact that Lithuania is a much smaller country and the distance between the cities where the teams are located is also very short.
Since hosting sports events is important for many different reasons for countries and sports clubs today, environmental effects have become particularly evident when it comes to carbon footprints and the sports sector has become an important part of the climate change problem (Manfredi, et al., 2009). Sports is one of the sectors where measures should be taken against threats related to environmental sustainability. As a matter of fact, the intensification of carbon and greenhouse gas emissions at the beginning of these threats, in other words, means the growth of the carbon footprint (Pereira, et al., 2017). Sport is the catalyst of human behavior that has negative effects on all segments of society and the environment due to its characteristics (Mann and Kump, 2008:43). Regarding these negative effects of the sports industry, the United Nations reports that the carbon footprint in the sports industry is growing gradually due to the production of sports events, sports facilities, sports activities and sports equipment (United Nations Environment Program, 2022).
The evaluations made in the literature are also similar to the findings of the United Nations. The estimated amount of carbon footprints (Babiak and Trendafilova, 2011) arising from travel and transportation within the sports sector is considered as a significant threat to sustainable environmental goals (McCullough, et al., 2016; Triantafyllidis et al., 2018). For example, sports competitions involving universities involve an intense travel schedule. In a study conducted by Edwards et al. (2016), it was concluded that a total of 3.80 tons of CO2 emissions were produced during travels within the scope of university sports. Again, in the carbon footprint study of small-scale sports events conducted by Dolf and Teehan (2015) on university sports and hosted by the University of British Columbia, a calculation of 1,058 tons was made, while the carbon footprint per person was found to be 24 kg.
The negative environmental effects of mobility related to sports activities are known. Travels of athletes and fans are an important source of carbon footprint. In the research conducted by Cooper and McCullough (2021), in which the carbon footprint calculations of the national intercollegiate men’s basketball competitions in 2019 were made, the average seasonal carbon footprint due to travel was calculated as 201 million kg, while it was found to be 500 kg per person. In the sports industry, it is known that fans travel as much as athletes. In a study focusing on the carbon footprint of fans attending sporting events for a year in South Carolina in the United States, it was found that the participants travelled more than 150 miles and the most important carbon footprint source was long-distance travel. In addition, the average carbon footprint of these long distance journeys was calculated as 338 million kg (Triantafyllidis and Davakos, 2019).
The same problem continues and even grows in football, which has been one of the most popular sports branches in recent years. National and international football organizations are considered as an environmental threat. It is understood that travels in football are the most important carbon footprint source. According to Dosumu et al. (2017), in the carbon footprint study of the lower league fans in England due to travel, the annual greenhouse gas emission of the 8-level spectators for the 2012/13 season was calculated as 56,237 tons of CO2e. One of the studies on larger and more comprehensive sports organizations is Collins et al. (2007) conducted by the related research is about the carbon footprint of the FA cup final organization held in the United Kingdom. A fan group of 70,000 people was included in the research, and as a result, 617 tons of CO2 emissions were calculated depending on the travels of the fans and it was concluded that each spectator contributed approximately 7.67 kg of CO2 emissions. Due to the popularity of football and high participation, the carbon footprint risks are greater. Being aware of this risk, FIFA is trying to take necessary measures for the 2030 World Cup. Pereira et al. (2020) point out that in order to combat the carbon footprint threat, FIFA should apply criteria such as clean energy, environmental certificates, climate-friendly transport and accommodation in the process of determining host countries (Pereira et al., 2020).
The study conducted by Wicker (2019), focusing on the carbon footprint of active sports participants in Germany, revealed an annual average of 844 kg carbon dioxide equivalent emission carbon footprint. Another study by Pereira et al. (2019) focused on the carbon footprint of English Premier League teams over a season. According to the results of the conducted research, EPL clubs produced approximately 1,134 tons of CO2-equivalent in the 2016/17 season. In the research conducted by Jones (2008), which focused on the carbon footprint of the 2004 Wales Rally, one of the most important races of motor sports, the average per capita carbon footprint was calculated as 20.2 kg. However, the average carbon footprint per person calculated at the 2014 World Orienteering Championships is 25.4 kg (Scrucca, et al., 2016).
In team sports, the high number of teams and the intense schedules of competitions make travel inevitable. For example, in a study conducted by Perkumiene et al. (2023) on ice sports, the carbon footprint due to the travels of the national ice hockey league teams of Turkey and Lithuania for the competitions throughout the season was calculated as “88.23 kg per person” on average. In a study conducted by Chard and Mallen (2012), the carbon footprint resulting from the travel of ice hockey teams due to the use of vehicles to participate in the competitions was calculated as approximately 20 tons of carbon dioxide (CO2). In the study conducted by Wicker (2018) and focusing on the annual carbon footprint measurements of individuals traveling in Germany for snow and winter sports, the carbon footprint resulting from winter sports was calculated as 431.6 kg in the study conducted with 523 participants.
It is not possible to cancel or not organize national and international sports events and organizations. However, these events and organizations may be carried out with an environmentally friendly management approach. For example, significant reductions in carbon footprint can be achieved by optimizing schedules to minimize the amount of travel for competitions (Johnson, 2015; Wynes, 2021). Using better logistics to shape the Formula 1 calendar, one of the most important events for motorsport, shows that it can reduce carbon emissions by 44% (Ross, 2020). This includes all air, sea and road transport of equipment and tires (but excludes business travel, facilities, factories and event operations). Improved logistics around food supply chains and distribution points for sporting events can also minimize carbon emissions (Cai et al., 2018). However, the English football administration has developed a rating policy against the negative environmental effects of transportation in football. According to this policy, in a research conducted on the concept of environmentally friendly sports management (sustainable transport and clean energy in transport), the most successful clubs in the English Premier League as of February 2022 were Liverpool and Tottenham Hotspur. In stark contrast, Aston Villa and Leeds United stand out as the clubs contributing the most pre-season air travel emissions in 2022 (BBC Sport, 2022).
6 Conclusion
In the sports sector, basketball is one of the most important sources of transportation-related carbon footprint due to its being one of the team sports and its intense competition schedule. According to the results of this research conducted specifically for Turkey and Lithuania, the total carbon footprint calculated for both countries is 53,029 tons. Even this calculation made for only two countries gives important clues for the negative environmental effects caused by a one-season travel. Due to the increasing interest and demand, intense competition schedules can cause teams to travel constantly. This is a huge threat to sustainable environmental goals.
Considering the area of Turkey and the number of teams, it is a much larger country than Lithuania and it is inevitable for teams in Turkey to travel by plane, since there are teams in different parts of the country. However, in Turkey, it is possible to provide urban travel with clean and green energy sourced vehicles. Especially with the measures to be taken by the basketball federation, the carbon emissions caused by the transportation of the teams can be minimized. In addition, the creation of a league calendar that will include less travel while organizing the competition calendars in the country may also be beneficial for sustainable environmental goals.
Lithuania is a smaller country compared to Turkey in terms of both its area and the number of teams. Also, the distance between teams and cities is quite short. For this reason, teams in Lithuania travel by bus. With this information about Lithuania, it can be said that it may be easier to reduce the carbon footprint originating from basketball compared to Turkey. Traveling only by road and bus indicates that precautions can be taken more easily. For example, electric and environmentally friendly vehicles can be provided by the basketball federation and allocated to the teams in the country. Other vehicles using green and clean energy can be provided for sports clubs in the country and their use can be encouraged.
To make an assessment for both countries, in order to reduce travel based on sports; Arranging league calendars to include less travel, dissemination of green and clean energy-using (electric) vehicles, raising the awareness of club managers, developing environmental assessment policies specific to basketball federations, and increasing cooperation through awareness and training activities seem feasible for sustainable environment and basketball goals. Traveling by plane is inevitable in other sports branches, especially basketball, due to international competitions. However, the relevant federations may make adjustments in the competition calendars that require less travel. In addition, scheduled flights can be used instead of private plane trips. In this way, the emergence of an extra travel cost can be avoided. In addition, the number of groups of teams can be brought to the optimum level, so that fewer people can travel. However, with the globalization of sports, it can be said that travel by plane is inevitable. Taking measures to shorten event and competition travels over long distances can provide significant benefits for environmental sustainability. Reducing carbon footprint related to traveling in sport is essential for mitigating climate change and promoting sustainable lifestyles. Here are some suggestions to help you reduce your carbon footprint when traveling:
• Choose sustainable modes of transportation: For public transportation, such as buses, trains, or trams, whenever possible. They are more energy-efficient and emit fewer emissions per passenger compared to private vehicles.
• Carpool or rideshare: When traveling with others to the same destination, consider carpooling or ridesharing. This reduces the number of vehicles on the road, resulting in lower carbon emissions.
• Walk or cycle for short distances: If your destination is nearby, consider walking or cycling instead of driving. It not only reduces carbon emissions but also promotes a healthier lifestyle.
• Choose fuel-efficient vehicles: If you need to use a private vehicle, choose a fuel-efficient or hybrid car. Electric vehicles (EVs) are an even better choice as they produce zero tailpipe emissions.
• Combine trips and plan efficiently: Whenever possible, combine multiple errands or activities into a single trip. This reduces the total distance traveled and minimizes fuel consumption.
• Eco-friendly airlines: If flying is unavoidable, choose airlines that have made efforts to reduce their carbon footprint. Some airlines invest in carbon offset programs or use more fuel-efficient aircraft.
• Pack light: Extra weight in a vehicle or airplane increases fuel consumption. Pack only what you need for your trip to reduce the weight and consequently the carbon emissions.
• Offset your carbon emissions: Consider purchasing carbon offsets for the emissions generated during your travel. Carbon offsets fund projects that reduce greenhouse gas emissions, helping to balance out your carbon footprint.
Data availability statement
The original contributions presented in the study are included in the article/Supplementary Material, further inquiries can be directed to the corresponding author.
Author contributions
For research articles with several authors, a short paragraph specifying their individual contributions must be provided. The following statements should be used “Conceptualization, MV, AA, and BS; methodology, AA, MV, and DP; software, AA and DP; validation, BS and DP; formal analysis, AA and DP; investigation, MV, DP, and BS; resources, DP, AA, and BS; data curation, AA, DP, and BS writing—original draft preparation, DP, BS, and AA; writing—review and editing, DP; visualization, AA and DP; supervision, AA, MV, and DP; project administration, BS, DP, and BS; funding acquisition, MV and DP. All authors contributed to the article and approved the submitted version.”
Funding
This article has been prepared in the light of the data and evaluations obtained in the project titled “Development of Decision Support System for Carbon Friendly Sports Management” supported by the “Turkish Scientific and Technological Research Council (TUBITAK) 2219 International Postdoctoral Research Fellowship Program for Turkish Citizenship” and carried out by AA.
Conflict of interest
The authors declare that the research was conducted in the absence of any commercial or financial relationships that could be construed as a potential conflict of interest.
Publisher’s note
All claims expressed in this article are solely those of the authors and do not necessarily represent those of their affiliated organizations, or those of the publisher, the editors and the reviewers. Any product that may be evaluated in this article, or claim that may be made by its manufacturer, is not guaranteed or endorsed by the publisher.
References
Ahmed, F., and Pretorius, L. (2010). Mega-events and environmental impacts: The 2010 FIFA world cup in South Africa. Alternation 17 (2), 274–296.
Atabey, T. (2013). Karbon ayak izinin hesaplanması: Diyarbakır örneği. [master's thesis]. [Elazığ, Turkey]: Fırat University.
Babiak, K., and Trendafilova, S. (2011). CSR and environmental responsibility: Motives and pressures to adopt green management practices. Corp. Soc. Responsib. Environ. Mgmt 18, 11–24. doi:10.1002/csr.229
Barkenbus, J. (2009). Eco-driving: An overlooked climate change initiative. Energy Policy 38, 762–769. doi:10.1016/j.enpol.2009.10.021
BBC Sport (2022). Should Premier League football clubs travel so far for pre-season? Avaliable At: https://www.bbc.co.uk/sport/football/62280394 (Accessed March 16, 2023).
Bekiroğlu, O. (2022). Sürdürülebilir kalkınmanın yeni kuralı: Karbon ayak i?zi. Avaliable At: https://www.emo.org.tr/ekler/49c17cab08ed10e_ek.pdf (Accessed March 15, 2023).
Bunds, K., and Casper, J. (2018). Sport, physical culture, and the environment: An introduction. Sociol. Sport J. 35 (1), 1–7. doi:10.1123/ssj.2018-0007
Cai, Y., Lin, Z., Liu, L., and Wang, Y. (2018). “Demand forecast for Winter Olympic Games food cold chain logistics with carbon emissions consideration,” in Proceedings of the 2018 10th international conference on information management and engineering (Salford: The Association for Computing Machinery), 177–182.
Casper, J. M., and Pfahl, M. E. (2012). Environmental behavior frameworks of sport and recreation undergraduate students. Sport Manag. Educ. J. 6, 8–20. doi:10.1123/smej.6.1.8
Chard, C., and Mallen, C. (2012). Examining the linkages between automobile use and carbon impacts of community-based ice hockey. Sport Manag. Rev. 15 (4), 476–484. doi:10.1016/j.smr.2012.02.002
Chen, A., Wu, M., Chen, K. Q., Sun, Z. Y., Shen, C., and Wang, P. Y. (2016). Main issues in research and practice of environmental protection for water conservancy and hydropower projects in China. Water Sci. Eng. 9, 312–323. doi:10.1016/j.wse.2017.01.008
Collins, A., and Flynn, A. (2008). Measuring the environmental sustainability of a major sporting event: A case study of the FA cup final. Tour. Econ. 14, 751–768. doi:10.5367/000000008786440120
Collins, A., Flynn, A., Munday, M., and Roberts, A. (2007). Assessing the environmental consequences of major sporting events: The 2003-04 FA Cup Final. Urban Stud. 44, 457–476. doi:10.1080/00420980601131878
Collins, A., Jones, C., and Munday, M. (2009). Assessing the environmental impacts of mega sporting events: Two options? Tour. Manag. 30 (6), 828–837. doi:10.1016/j.tourman.2008.12.006
Cooper, J. A. (2020). Making orange green? A critical carbon footprinting of Tennessee football gameday tourism. J. Sport and Tour. 24 (1), 31–51. doi:10.1080/14775085.2020.1726802
Cooper, J. A., and McCullough, B. P. (2021). Bracketing sustainability: Carbon footprinting March Madness to rethink sustainable tourism approaches and measurements. J. Clean. Prod. 318, 128475. doi:10.1016/j.jclepro.2021.128475
Cornelissen, S., and Wolfgang, M. (2010). On the political economy of 'feel good' effects at sport mega-events: Experiences from FIFA Germany 2006 and prospects for South Africa 2010. Alternation 17 (2), 96–120.
Cucek, L., Klemes, J. J., and Kravanja, Z. A. (2012). A Review of Footprint analysis tools for monitoring impacts on sustainability. J. Clean. Prod. 34, 9–20. doi:10.1016/j.jclepro.2012.02.036
Danish, W., and Wang, Z. (2019). Investigation of the ecological footprint's driving factors: What we learn from the experience of emerging economies. Sustain. Cities Soc. 49, 101626. doi:10.1016/j.scs.2019.101626
Del Bello, R. (2022). The NBA takes action to reduce its carbon footprint. Avaliable At: https://www.lemonde.fr/en/sports/article/2022/08/24/the-nba-takes-action-to-reduce-its-carbon-footprint_5994611_9.html (Accessed June 01, 2023).
Dino, M., Mark, M. H. G., and Aidan, W. M. (2018). Are sport tourists of an environmental mindset to drive the green? The case of golfers. Tour. Manag. Perspect. 25, 71–79. doi:10.1016/j.tmp.2017.11.007
Dogaru, L. (2014). Preserving the right to a healthy environment: European jurisprudence. Procedia Soc. Behav. Sci. 141, 1346–1352. doi:10.1016/j.sbspro.2014.05.232
Dolf, M., and Teehan, P. (2015). Reducing the carbon footprint of spectator and team travel at the University of British Columbia’s varsity sports events. Sport Manag. Rev. 18 (2), 244–255. doi:10.1016/j.smr.2014.06.003
Dosumu, A., Colbeck, I., and Bragg, R. (2017). Greenhouse gas emissions as a result of spectators travelling to football in England. Sci. Rep. 7, 6986–6987. doi:10.1038/s41598-017-06141-y
Du Preez, E., and Heath, E. (2016). Determining the influence of the social versus physical context on environmentally responsible behaviour among cycling spectators. J. Sport Tour. 20, 123–143. doi:10.1080/14775085.2016.1227274
Edwards, L., Knight, J., Handler, R., Abraham, J., and Blowers, P. (2016). The methodology and results of using life cycle assessment to measure and reduce the greenhouse gas emissions footprint of “Major Events” at the University of Arizona. J. Life Cycle Assess. 21, 536–554. doi:10.1007/s11367-016-1038-4
Eichinger, M. (2019). Transformational change in the Anthropocene epoch. Lancet Planet. Health 3 (3), e116–e117. doi:10.1016/S2542-5196(18)30280-8
European Envionment Agency (2014). Regulation (EU) No 517/2014 of the European parliament and of the Council of 16 april 2014 on fluorinated greenhouse gases and repealing regulation (EC) No 842/2006. Avaliable At: https://www.eea.europa.eu/policy-documents/regulation-eu-no-517-2014 (accessed on July 28, 2023).
European Union (1997). Treaty of Amsterdam amending the treaty on European union, the treaties establishing the European communities and certain related acts. Avaliable At: https://www.europarl.europa.eu/topics/treaty/pdf/amst-en.pdf (Accessed March 18, 2023).
Fitzmaurice, M. (1999). The right of the child to a clean environment. South. Ill. Univ. Law J. 23, 611–656.
Global Footprint Network (2007). Executive summary: Turkey’s ecological footprint report. Avaliable At: https://www.footprintnetwork.org/content/images/uploads/Turkey_Ecological_Footprint_Report_Executive_Summary-Conclusion.pdf (Accessed March 15, 2023).
GOV.UK (2023). Government conversion factors for company reporting of greenhouse gas emissions. Avaliable At: https://www.gov.uk/government/collections/government-conversion-factors-for-company-reporting (Accessed March 15, 2023).
Green, B. (2023). Sustainability and the NBA. Avaliable At: https://bethesdagreen.org/sustainability-the-nba/(Accessed June 02, 2023).
Guillerm, N., and Cesari, G. (2015). Fighting ambient air pollution and its impact on health: From human rights to the right to a clean environment. Int. J. Tuberc. Lung Dis. 19 (8), 887–897. doi:10.5588/ijtld.14.0660
Handl, G. (2019). Rio declaration on environment and development. Tulane: Tulane University Law School Press.
Henczel, T. (2022). The environmental impact of professional sports. Avaliable At: https://blog.tentree.com/the-environmental-impact-of-professional-sports/(Accessed February 26, 2023).
Hjorthol, R., and Fyhri, A. (2009). Do organized leisure activities for children encourage car-use? Trans. Res. Part A Policy Pract. 43 (2), 209–218. doi:10.1016/j.tra.2008.11.005
International Olympic Committee (2009). Manuel on sport and the environment. Avaliable At: https://www.olympic.org/en/Home/Documents/Documents/Olympism%20in%20Action/Olympism%20in%20Action/Environment/Manual%20on%20Sport%20and%20the%20Environment (Accessed March 15, 2023).
International Olympic Committee (2022). Sustainability. Avaliable At: https://olympics.com/ioc/sustainability (Accessed March 15, 2023).
Johnson, G. (2015). Striking out excess travel in major League Baseball: Reducing CO2 emissions due to the MLB schedule. Avaliable At: https://nature.berkeley.edu/classes/es196/projects/2015final/JohnsonG_2015.pdf (Accessed March 16, 2023).
Jones, C. (2008). Assessing the impact of a major sporting event: The role of environmental accounting. Tour. Econ. 14 (2), 343–360. doi:10.5367/000000008784460382
Kim, D. H., and Lin, S. C. (2017). Human capital and natural resource dependence. Struct. Chang. Econ. Dyn. 40, 92–102. doi:10.1016/j.strueco.2017.01.002
Konieczny, P., Mroczek, E., and Kucharska, M. (2013). Ślad węglowy w zrównoważonym łańcuchu żywnościowym i jego znaczenie dla konsumenta żywności. J. Agribus. Rural. Dev. 03, S51–S64.
Lansdown, G. (2005). “Children's welfare and children's rights,” in Child welfare and social policy: An essential reader (Bristol: The Policy Press).
Lithuanian Basketball Federation (2022). League fixtures for 2021-22 season. Avaliable At: https://ltu.basketball/dokumentai/bendrieji/(Accessed March 15, 2023).
Loewen, C., and Wicker, P. (2021). Travelling to Bundesliga matches: The carbon footprint of football fans. J. Sport and Tour. 25 (3), 253–272. doi:10.1080/14775085.2021.1932562
Mallen, C., and Chard, C. (2011). A framework for debating the future of environmental sustainability in the sport Academy. Sport Manag. Rev. 14 (4), 424–433. doi:10.1016/j.smr.2010.12.002
Manfredi, S., Tonini, D., Christensen, T. H., and Scharff, H. (2009). Landfilling of waste: Accounting of greenhouse gases and global warming contributions. Waste Manag. Res. 27, 825–836. doi:10.1177/0734242x09348529
Mann, M. E., and Kump, L. R. (2008). Dire predictions: Understanding global warming. New York: DK Publishing.
Martins, R., Pereira, E., Rosado, A., and Mascarenhas, M. (2021). Exploring the relationship between sport demand's key players and environmental sustainability: Pointers from a systematic review. J. Outdoor Recreat. Tour. 35, 100419–100780. doi:10.1016/j.jort.2021.100419
McCullough, B. P., Pfahl, M., and Nguyen, S. N. (2016). The green waves of environmental sustainability in sport. Sport Soc. 19, 1040–1065. doi:10.1080/17430437.2015.1096251
Pereira, R. P. T., Camara, M. V. O., Ribeiro, G. M., and Filimonau, V. (2017). Applying the facility location problem model for selection of more climate benign mega sporting event hosts: A case of the FIFA world cups. J. Clean. Prod. 159, 147–157. doi:10.1016/j.jclepro.2017.05.053
Pereira, R. P. T., Filimonau, V., and Ribeiro, G. M. (2020). Projecting the carbon footprint of tourist accommodation at the 2030 FIFA World CupTM. Clean. Responsible Consum. 1, 100004. doi:10.1016/j.clrc.2020.100004
Pereira, R. P. T., Filimonau, V., and Ribeiro, G. M. (2019). Score a goal for climate: Assessing the carbon footprint of travel patterns of the English Premier League clubs. J. Clean. Prod. 227, 167–177. doi:10.1016/j.jclepro.2019.04.138
Perkumiene, D., Atalay, A., and Švagždiene, B. (2023). Carbon footprint stemming from ice sports on the Turkey and Lithuanian scale. Energies 16, 1476. doi:10.3390/en16031476
Perkumienė, D., Pranskūnienė, R., Vienažindienė, M., and Grigienė, J. (2020). The right to a clean environment: Considering green logistics and sustainable tourism. Int. J. Environ. Res. Public Health 17, 3254. doi:10.3390/ijerph17093254
Preuss, H. (2013). The contribution of the FIFA world cup and the olympic games to green economy. Sustainability 5, 3581–3600. doi:10.3390/su5083581
Ross, H. (2020). Future sustainable practice for formula 1 logistics. [Doctoral dissertation]. [Glasgow, Scotland]: University of Strathclyde.
Şahin, M. T. (2019). Karbon ayak Tzi uygulamalari: Cimento fabrikasi ornegi. [master's thesis]. [Gebze, Turkey]: Gebze University.
Schmidt, C. (2006). Putting the earth in play: Environmental awareness and sports. Environ. Health Perspect. 114 (5), A286–A295. doi:10.1289/ehp.114-a286
Scrucca, F., Severi, C., Galvan, N., and Brunori, A. (2016). A new method to assess the sustainability performance of events: Application to the 2014 world orienteering championship. Environ. Impact Assess. Rev. 56, 1–11. doi:10.1016/j.eiar.2015.08.002
Thibault, L. (2009). Globalization of sport: An inconvenient truth. J. Sport Manag. Hum. Kinet. 23, 1–20. doi:10.1123/jsm.23.1.1
Thormann, T. F., and Wicker, P. (2021). Willingness-to-Pay for environmental measures in non-profit sport clubs. Sustainability 13, 2841. doi:10.3390/su13052841
Treaty on European Union (1992). Official journal of the European communities. Avaliable At: https://eur-lex.europa.eu/legal-content/EN/TXT/PDF/?uri=CELEX:11992M/TXT&from=EN (Accessed March 18, 2023).
Triantafyllidis, S., and Davakos, H. (2019). Growing cities and mass participant sport events: Traveling behaviors and carbon dioxide emissions. J. Carbon Res. 5 (3), 49. doi:10.3390/c5030049
Triantafyllidis, S., Ries, R., and Kaplanidou, K. (2018). Carbon dioxide emissions of spectators’ transportation in collegiate sporting events: Comparing on-campus and off-campus stadium locations. Sustainability 10 (1), 241. doi:10.3390/su10010241
Turkish Basketball Federation (2022). League fixtures for 2021-22 season. Avaliable At: https://www.tbf.org.tr/ligler/bsl-2021-2022 (Accessed March 15, 2023).
UNEP (2020). Environmental governance update october. Avaliable At: https://www.unep.org/resources/report/environmental-governance-update-october-2020 (Accessed March 17, 2023).
United Nations (1998). Aarhus Convention on access to information, public participation in decision-making and access to justice in environmental matters. Avaliable At: https://treaties.un.org/Pages/ViewDetails.aspx?src=IND&mtdsg_no=XXVII-13&chapter=27 (Accessed March 18, 2023).
United Nations Environment Program (2022). Sport and the environment. Avaliable At: https://www.unep.org/news-and-stories/press-release/sports-organisations-commit-safeguarding-nature-under-new-framework (Accessed March 17, 2023).
United Nations (1992). Kyoto Protocol to the united Nations framework convention on climate change. Avaliable At: https://unfccc.int/resource/docs/convkp/kpeng.pdf (Accessed March 19, 2023).20
United States Environmental Protection Agency (2022). Greenhouse gas emissions and removals. Avaliable At: https://www.epa.gov/ghgemissions (Accessed February 26, 2023).
United Union (1948). Universal declaration of human rights. Avaliable At: https://www.un.org/en/udhrbook/pdf/udhr_booklet_en_web.pdf (Accessed March 18, 2023).
United Unions (1992). Rio declaration on environment and development, in report of the united Nations conference on environment and development. Avaliable At: https://www.un.org/en/development/desa/population/migration/generalassembly/docs/globalcompact/A_CONF.151_26_Vol.I_Declaration.pdf (Accessed March 18, 2023).
United Unions (1972). Stockholm declaration on the human environment, in report of the united Nations conference on the human environment. Avaliable At: https://documents-dds-ny.un.org/doc/UNDOC/GEN/NL7/300/05/IMG/NL730005.pdf?OpenElement (Accessed March 18, 2023).
Watson, J. (2015). A Revealing look at the carbon footprint of an event. Avaliable At: https://greeneventninjas.com/the-dojo/revealing-look-carbon-footprint-of-an-event/(Accessed March 16, 2023).
Wicker, P. (2019). The carbon footprint of active sport participants. Sport Manag. Rev. 22 (4), 513–526. doi:10.1016/j.smr.2018.07.001
Wicker, P. (2018). The carbon footprint of active sport tourists: An empirical analysis of skiers and boarders. J. Sport and Tour. 22 (2), 151–171. doi:10.1080/14775085.2017.1313706
Wiedmann, T., and Minx, J. (2008). A definition of ‘carbon footprint. Ecol. Econ. Res. Trends 1, 1–11.
Wilby, R. L., Orr, M., Depledge, D., Giulianotti, R., Havenith, G., Kenyon, J. A., et al. (2023). The impacts of sport emissions on climate: Measurement, mitigation, and making a difference. Ann. N. Y. Acad. Sci. 1519 (1), 20–33. doi:10.1111/nyas.14925
Wynes, S. (2021). COVID-19 disruption demonstrates win-win climate solutions for major league sports. Environ. Sci. Technol. 55, 15609–15615. doi:10.1021/acs.est.1c03422
Wynes, S. (2022). The Pandemic blueprint for sport to cut back on carbon emissions. Avaliable At: https://globalsportmatters.com/business/2022/04/05/pandemic-blueprint-sports-air-travel-carbon-emissions/(Accessed March 15, 2023).
Keywords: environment, sports, right to clean environment, carbon footprint, basketball, sustainability
Citation: Vienažindienė M, Perkumienė D, Atalay A and Švagždiene B (2023) The last quarter for sustainable environment in basketball: the carbon footprint of basketball teams in Türkiye and Lithuania. Front. Environ. Sci. 11:1197798. doi: 10.3389/fenvs.2023.1197798
Received: 31 March 2023; Accepted: 14 August 2023;
Published: 24 August 2023.
Edited by:
Maria Alzira Pimenta Dinis, Fernando Pessoa University, PortugalReviewed by:
Rui Wang, Westlake University, ChinaMartin Munashe Chari, University of Fort Hare, South Africa
Copyright © 2023 Vienažindienė, Perkumienė, Atalay and Švagždiene. This is an open-access article distributed under the terms of the Creative Commons Attribution License (CC BY). The use, distribution or reproduction in other forums is permitted, provided the original author(s) and the copyright owner(s) are credited and that the original publication in this journal is cited, in accordance with accepted academic practice. No use, distribution or reproduction is permitted which does not comply with these terms.
*Correspondence: Dalia Perkumienė, dalia.perkumiene@vdu.lt