Research and evaluation of spatiotemporal dynamic of network green innovation efficiency in China—based on meta-Frontier theory
 Yueming Han
 Shiyou Qu1*
 - 1School of Management, Harbin Institute of Technology, Harbin, Heilongjiang, China
- 2Business School, Lingnan Normal University, Zhanjiang, Guangdong, China
Green innovation has emerged as a crucial driver for advancing green and high-quality development. Exploring the evolutionary patterns of green innovation efficiency is crucial for achieving the “dual carbon” goals and realizing the benefits of both economic growth and environmental sustainability under the framework of new development concepts. This study employs the network SBM-DEA model under meta-Frontier and group-Frontier. Additionally, it considers the GML index and Moran’s I to conduct a comprehensive analysis of the evolving efficiency of green innovation in Chinese provinces from 2008 to 2020, then uses the Tobit regression model to verify the influencing indicators for green innovation efficiency. The examination covers various aspects, including the stage of green innovation, the diversity of technology accumulation, the comparability of pre- and post-development, the spillover effects in geographical space, and the diversity of influencing factors. The research findings indicate the following: 1) The group division exhibit a high level of geographical correlation, and the efficiency of green innovation in the two-stage and network displays heterogeneity across distinct frontiers. The efficiency loss in the Green Achievement Transformation stage is bigger than that in the Green Technology Research and Development stage. 2) There is an overall increase in green innovation efficiency of each type during most years, and the spatial correlation and stability of the two-stage and network green innovation efficiency have improved year by year. Provinces with higher Green Innovation Environment Composite Index have the highest concentration of “high-high” efficiency agglomeration. 3) Environmental regulation intensity, factor endowment, property rights structure, foreign direct investment and energy consumption have varying degrees of constraints on green innovation, and the regional economic development level can significantly improve the efficiency of various green innovations. Finally, this paper provides some suggestions, including stimulating innovation vitality, formulating differentiated policies, strengthening regional innovation collaboration, and mobilizing resources from various stakeholders. These recommendations aim to provide guidance and reference for promoting green innovation and achieving sustainable development in different regions.
1 Introduction
With the advent of the “green revolution” characterized by energy and industrial transformation around the world, carbon emissions peak and carbon neutrality have gradually become the strategic focus of all countries, including China. Meanwhile, scientific and technological innovation has emerged as the primary means of realizing the ‘green revolution’. Green innovation incorporates considerations of green development and integrates the two essential elements of the new development concepts, namely ‘green’ and ‘innovation’. Building on innovation-led development, green innovation further prioritizes the sustainable development of the economy, society, and environment that ‘green’ entails. This is a crucial driver for promoting green and high-quality development, and plays a critical role in achieving a balance between environmental protection and the pursuit of economic progress. The fundamental and central aspect of green and high-quality development is the efficiency and advantages of green innovation. The pursuit of effective distribution of resources for green innovation and the attainment of the objective of a “win-win” situation between environmental protection and economic growth hold significant theoretical and practical importance.
Improving the efficiency of green innovation requires not only increasing input, but also focusing on the configuration structure and efficiency of each link in the process of transforming input into output. Due to the different infrastructures such as geographical location, resource endowment, economic development level, environmental regulation strength and the degree of opening up to the external world, there exist discernable variations in the production technology level in the green innovation among regions, which may lead to varying degrees of impact and inaccurate estimation of green innovation efficiency. Furthermore, innovation factors are characterized by scarcity and pursuit of their self-value maximization, which may flow from regions with low marginal returns to regions with high marginal returns through regional innovation coordination and inter-governmental competition. This tendency selection mechanism makes green innovation factors flow among regions, forming a spatial spillover effect. Based on the above analysis, this study introduces the following innovations in the study of green innovation efficiency:
1) In terms of research perspective, this study examines the evolving characteristics of green innovation efficiency from multiple angles. It constructs a multidimensional dynamic analytical framework that considers the stage of green innovation, the heterogeneity of technology collection, the comparability of pre- and post-development, the spillover of geographical space, and the diversity of influencing factors. By unveiling the “black box” of green innovation efficiency, this study provides new insights for targeted improvements in green innovation efficiency from the perspective of regional development heterogeneity.
2) In terms of research content and methods, this study employs a meta-Frontier approach and a non-radial network SBM-DEA model considering unexpected outputs to measure regional green innovation efficiency in two stages and two types of frontiers, which helps to uncover specific stages and reasons for efficiency losses at a deeper level. Additionally, the study conducts a dynamic analysis of the spatiotemporal leapfrogging effects of green innovation efficiency using the GML index and Moran’s I, thereby depicting the spatiotemporal patterns of green innovation efficiency evolution. Finally, the study employs the Tobit regression model to verify the impact of external factors such as environmental regulation intensity, factor endowment, property rights structure, industrial agglomeration, foreign direct investment, regional economic development level, and energy consumption on regional green innovation efficiency. The research content mentioned above provides theoretical support and practical reference for improving local green innovation capacity, exploring the potential value of green innovation, and playing a leading role of green innovation in high-quality development.
The structure is as follows: the literature review is introduced in Section 2. The applied material, method and data are presented in Section 3. The analyzes and discussion of empirical findings are presented in Section 4. Conclusions and discussion are covered in Section 5.
2 Literature review
Compared to conventional innovation, green innovation incorporates environmental consciousness or “green” elements in its input-output process, making it a dynamic and complex system engineering. In the past, the measurement of green innovation efficiency was approached from a holistic perspective using the traditional single-stage DEA model. This method evaluated green innovation activities as a singular entity and treated the efficiency transformation process as a “black box”. As a result, the stage differences in innovation and the multi-stage linkage mechanism in the efficiency transformation process were ignored. Moreover, it failed to analyze the internal composition and operation mechanism that led to the improvement of development quality, which made it inconvenient to further analyze the deep-rooted causes of efficiency loss. In this regard, Färe and Grosskopf (2000) proposed the concept of network DEA, which specifies the efficiency analyzes to multiple stages and considers the correlation between sub-stages with intermediate products. On this basis, Zha et al. (2008) constructed a two-stage cooperative efficiency model in terms of geometric average to measure the influence of scale and technical factors on the overall efficiency of the network and the efficiency of different stages, and practically verified the superiority of geometric average over arithmetic average for measuring cooperative efficiency. Tone and Tsutsui (2009) further constructed a non-radial network SBM-DEA model to solve the intermediate product problem and thus evaluate the network efficiency and stage efficiency. Such methods are widely used in efficiency measurement, such as Wang et al. (2021) constructed a dynamic network DEA evaluation model to evaluate the eco-efficiency of industrial enterprises in China at both the production and treatment stages.
Regarding the selection of the efficiency Frontier, green innovation needs to be guided by government through apropriate regulatory behavior because of its significant dual externality characteristics (Porter, 1990; Porter and Linde, 1995). Differences in the intensity and nature of regulation across regions, as well as differences in compliance performance, can greatly affect the available technology set for green innovation activities. In this regard, if external environmental factors that affect the level of production technology are not taken into consideration, and the green innovation efficiency of all regions is measured under the same Frontier, the research findings may deviate to some extent, making it impossible to truly compare the local green innovation efficiency and determine the real source of green innovation inefficiency. Some scholars combine the meta-Frontier and group-Frontier theories proposed by Battese et al. (2004) and O’Donnel et al. (2008), and use the Technology Gap Ratio (TGR) to measure the efficiency gap between the internal optimal production technology within a particular group/decision-making unit and the regional optimal production technology at different Frontier levels. For example, Zou et al. (2022) used the meta-Frontier approach to measure the innovation efficiency in high-tech industry in China, and then used the Technology Gap Ratio (TGR) to check the potential for technological improvement in the central, eastern, and western regions of China.
When comparing efficiency results, although the Network SBM-DEA model can horizontally compare the input-output efficiency of different decision-making units in the same year by constructing the same Frontier, it cannot dynamically compare the efficiency of decision-making units in different years. In response, the Malmquist method, proposed by Swedish economist and statistician Malmquist (1953) to investigate the dynamic production efficiency between multiple input and output variables across periods, which can solve this problem. Since then, the method of measuring dynamic productivity based on the Malmquist method has been improved several times. Among them, Oh (2010) further proposed a Global Malmquist Luenberger (GML) index method, which makes the measured GML index comparable and transferable across all decision-making units in each period by aggregating all current production technologies into a global technology set. Mao et al. (2023) applied the SBM-GML model to analyze green total factor productivity change in Chinese urban agglomerations, and applied a spatial convergence model to explore the spatial convergence of GTFP on this basis, while Xia et al. (2023) used the SBM-DEA model to measure and analyze the Malmquist index of regional environmental governance performance, then used the Sys-GMM model to explore the impact of fiscal decentralization on environmental governance performance.
In terms of the factors influencing green innovation, scholars focus on the effects of different factors such as regulation, economy, structure, and foreign openness on the efficiency of relevant green innovation. For example, the study conducted by Yang et al. (2023) provides further evidence for the application of the “Porter hypothesis” in China. They found that both central and local environmental regulations significantly promote green innovation in heavily polluting enterprises, with central environmental regulation enhancing the effectiveness of local environmental regulation in driving green innovation. In terms of policy implementation, the green credit policies, which is one manifestation of environmental regulation, can also enhance the green innovation capacity of enterprises (Zhang et al., 2022a; Zhang et al., 2022b). Zhao and Lin (2020) constructed a simultaneous equation model including the Tobit model to demonstrate that foreign trade, R&D investment, ownership structure and energy prices seriously affect the energy efficiency of the Chinese textile industry; Tang et al. (2020) divided the industrial system into two stages, clean production and waste treatment, and established a network slacks-based model, and accordingly analyzed the changes of the two types of efficiency and their influencing factors. The results show that the level of economic development can significantly increase the efficiency of clean production and waste treatment, while industrial concentration significantly reduces both types of efficiency, and the intensity of environmental protection only positively affects the efficiency of waste treatment. Su and Zhang (2020) used a panel Tobit model to verify the negative effect of environmental regulation, industrial structure and energy consumption structure on green economic efficiency, and the promotion of GDP on green economic efficiency. Liu et al. (2022) used the two-way fixed-effect model to examine the non-linear effects of environmental regulation on green innovation in China, and explored the mechanisms of influence through the mediation effect model.
To sum up, the relevant literature provides important theoretical and empirical reference for subsequent studies, but there are still some research areas to be expanded: the existing studies on green innovation efficiency are mostly limited to a single stage, which is not conducive to exploring the specific links that lead to the inefficiency of green innovation and the deep reasons that lead to its inefficiency. In contrast, the multi-stage network model can more effectively open the “black box” of green innovation efficiency, find the root causes of inefficiency and reflect the real efficiency value of green innovation. In addition, the differences in the level of production technology caused by environmental regulatory strength and other factors also deviate the results of green innovation efficiency under different frontiers. In view of this, this paper takes provinces, autonomous regions and municipalities directly under the central government as the research objects. Based on the value chain theory, the process of green innovation is divided into two stages: Green Technology Research and Development (GTRD) and Green Achievement Transformation (GAT). By using the network SBM-DEA model proposed by Tone (2002), the radial and slack problems existing in the traditional two-stage DEA method are overcome, and the by-products are included as unexpected outputs, then a non-radial network SBM-DEA model is constructed, which takes into account the cooperative relationship of serial work within the organization under the continuous operation state, and calculates the overall network efficiency in the form of a geometric average of the efficiency of each stage. Meanwhile, a composite index is constructed to divide the decision-making units into groups, the overall and each stage efficiency of green innovation in different regions under the meta-Frontier and the group-Frontier are evaluated. Combined with the technology gap ratio (TGR), the gap between each group and the optimal efficiency under the meta-Frontier level is compared and analyzed. In addition, considering the vertical incomparability of green innovation efficiency calculated by the network SBM-DEA model and the characteristics of strong spatial correlation within groups, this paper introduces the GML dynamic index and the global Moran’s I to explore the dynamic evolution trend of green innovation efficiency in different regions in continuous periods from a global perspective, and to compare the spatiotemporal dynamic changes of the two-stage and network green innovation efficiency. Finally, a panel Tobit regression model is established to verify the influence of external factors such as environmental regulation intensity on the efficiency of green innovation in each stage.
3 Materials and methods
3.1 Green innovation efficiency model framework based on network SBM-DEA model
According to the Innovation Value Chain (IVC) theory, green innovation can be divided into the green technology research and development (GTRD) stage, which generates a green innovation portfolio, and the green achievement transformation (GAT) stage, which transforms innovation achievements into economic benefits (Hansen and Birkinshaw, 2007; Yu, 2009; Fu and Ma, 2011; Li et al., 2014). Among them, the first stage of green technology R&D process mainly involves independent R&D, design, innovation achievement generation and other activities, which reflects the ability of enterprises to transform R&D funds, human resources and other inputs into green independent innovation achievements; while the second stage of green achievement transformation mainly involves the external introduction of green innovation, and the use of imported innovation and the independent innovation achievements in the previous stage for new product production, which finally reflects the economic and environmental outputs.
Based on the two-stage process of green innovation, the network SBM-DEA model considering unexpected output is used to decompose the complex business process of the decision-making unit, and the impact of each stage efficiency on the overall efficiency is investigated. The non-radial network SBM-DEA model based on unexpected output has been constructed, and its basic framework is shown in Figure 1.
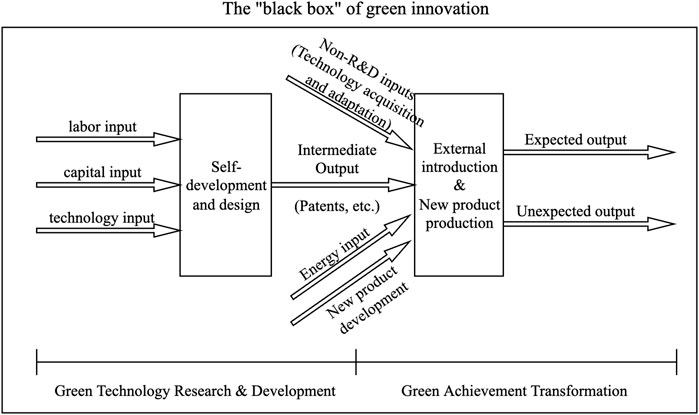
FIGURE 1. Two-stage input-output model of green innovation.
According to the method of the network SBM-DEA model that can deal with unexpected output proposed by Tone (2002), this paper divides the green innovation process into two sub-stages, and reflects the cooperative relationship of series work within the organization under continuous operation state in a geometric average. Based on the input slack variable
Among them,
3.2 Meta-Frontier and group-Frontier
O’Donnell (2008) established group-Frontier and non-parametric meta-Frontier model to calculate the technical efficiency under group-Frontier and meta-Frontier, and the technical gap ratio between different decision-making units. As shown in Figure 2, the primary contrast between the two relates to the utilization of distinct technology sets: Meta-Frontier pertains to the conceivable technological capabilities of all entities involved in making decisions, whereas the group-Frontier serves to differentiate decision-making units into multiple groups based on the amalgamation of intrinsic and extrinsic features of regions, forming a multi-layer Frontier, with the intention of examining the actual technical level of each group of decision-making units. This paper selects several external factors that affect green innovation behavior, such as environmental regulation intensity, factor endowment, property rights structure, industrial agglomeration, and foreign direct investment, as measurement indicators, and then calculates the regional green innovation environment comprehensive index (GIECI) by using the entropy value method. Based on the findings of the index measurements, it can be inferred that each decision-making unit is divided into three group frontiers of higher, medium and lower GIECI, and the green innovation efficiency under the meta-Frontier and group-Frontier of each region is calculated and compared, so that it can truly reflect the change of green innovation efficiency (He et al., 2016; Li and Wu, 2017; Xie et al., 2017; Du et al., 2019; Shao, 2019; Peng, 2020). The results showed that the clustering results have a strong spatial correlation.
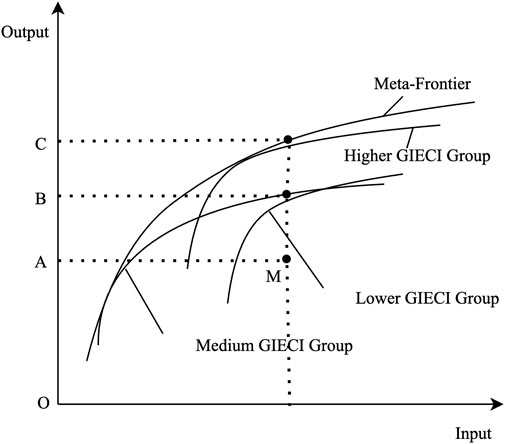
FIGURE 2. Group-Frontier and meta-Frontier of green innovation efficiency.
Since the meta-Frontier is constructed by the envelope curve of each group-Frontier, it is possible for the green innovation efficiency of a specific decision-making unit to be lower under the meta-Frontier than it is under the group-Frontier. This discrepancy can also be captured by the technology gap ratio (TGR). As an important indicator to investigate technological heterogeneity, the value range of TGR is between [0,1] (Battese et al., 2004). As the TGR increases, the production technology utilized by the decision-making unit or group becomes closer to the level of co-production technology, and the higher its actual production technology level; on the contrary, as the TGR decreases, the distance between the group production level and the meta-Frontier technology production level increases.
As shown in Figure 2, under the meta-Frontier boundary of convexity, a point M is selected to represent the position of a decision-making unit, and the technology gap ratio (TGR) can be derived (Battese and Rao, 2002):
3.3 GML index
This paper uses the GML index to measure the dynamic changes of two-stage and network green innovation efficiency. Its representative formula is as follows (Zhang and Wang, 2022):
Among them,
3.4 Spatial Moran’s I
To analyze the spatiotemporal transition features of the green innovation efficiency, this study employs a spatial autocorrelation measure known as the global Moran’s I. The formula is expressed as follows (Oden, 1995):
Among them,
Moran’s I ranges from -1 to 1. When Moran’s I > 0, it means that there is a positive spatial correlation between decision-making units, whereas there is a negative spatial correlation. The closer the absolute value is to 1, the stronger the dependence between the units (Li and Du, 2021).
3.5 Balanced panel Tobit multiple regression model
The green innovation efficiency value is generally between 0 and 1, which is consistent with the characteristics of a limited dependent variable, and is suitable for empirical analysis of the factors influencing regional green innovation efficiency using a panel Tobit model based on the maximum likelihood estimation (MLE) method (Amirteioori et al., 2020). This paper integrates various factors affecting green innovation, such as environmental regulation intensity (ERI), factor endowment (FE), property rights structure (PR), industrial agglomeration (Agg), foreign direct investment (FDI), regional economic development level (pGDP) and energy consumption (EC). The specific representation of the variables is shown in Table 1. The data of the above influencing factors are logarithmically processed in this paper. The specific regression equation is as follows:
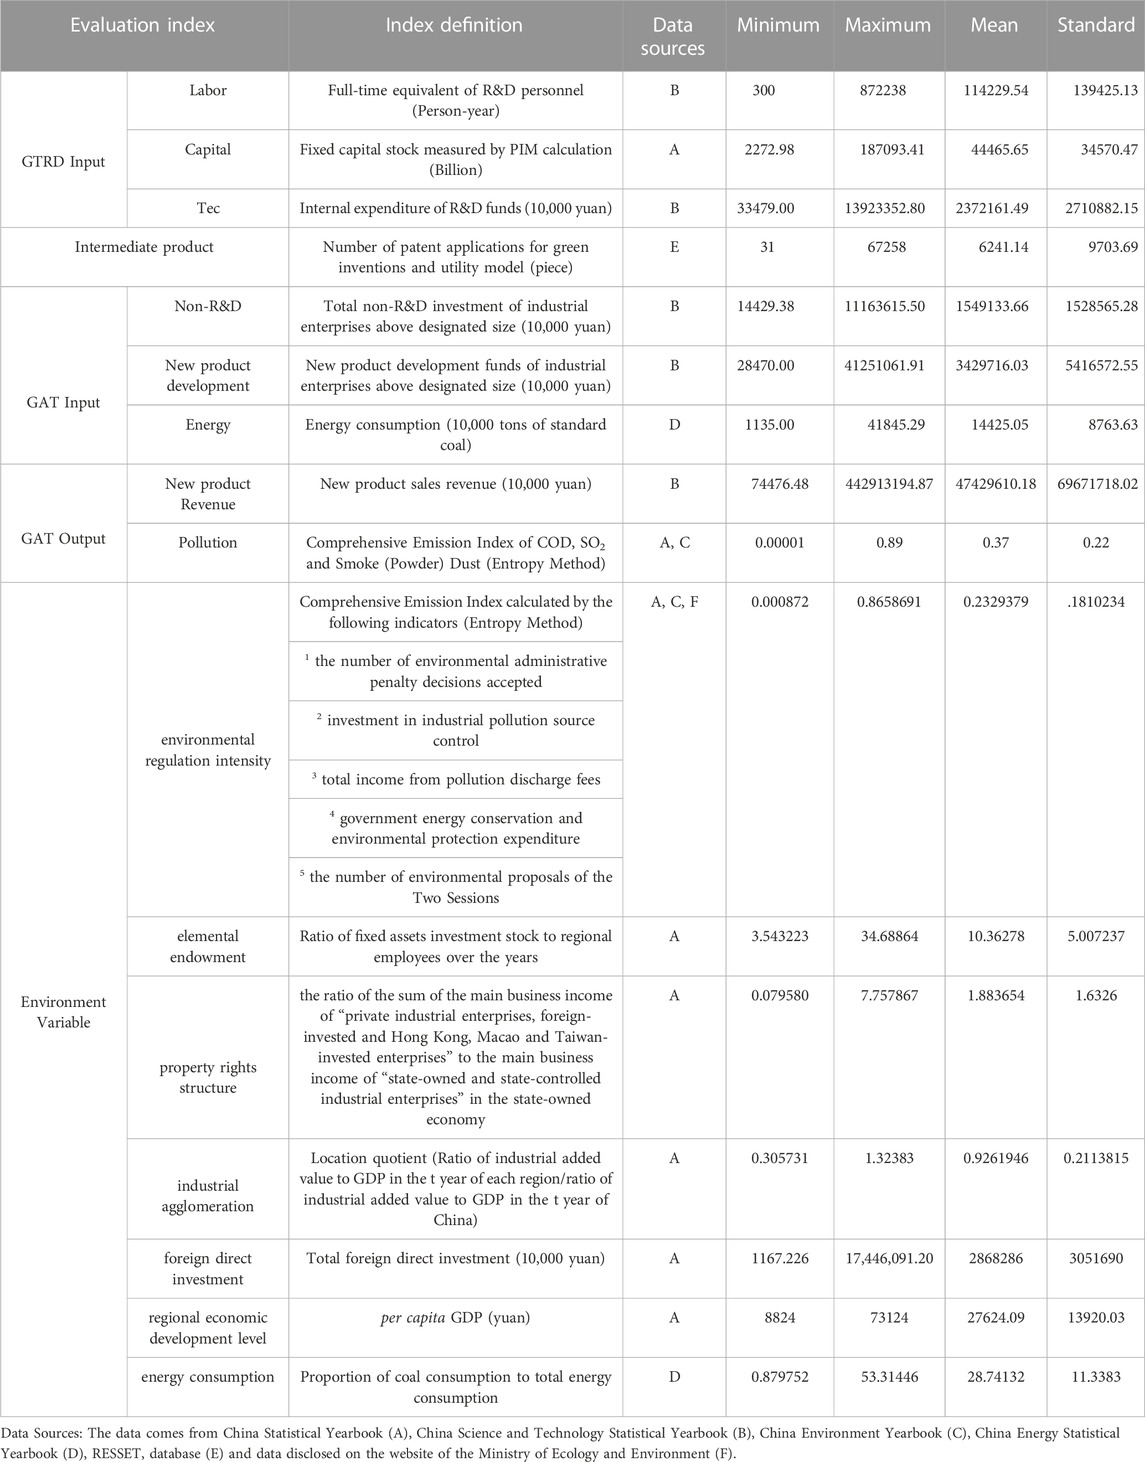
TABLE 1. Descriptive statistical results of input-output variables.
Where
3.6 Variable selection and data description
The Green Technology Research and Development stage reflects the independent innovation ability of the enterprise, and the input index mainly considers the three aspects of capital, labor and technology. In terms of capital investment, the fix capital stock calculated by Perpetual inventory system (PIM) is selected (Zhang et al., 2004). The labor and technology input are expressed by full-time equivalent of R&D personnel and internal expenditure of R&D funds, respectively. For the innovation output at this stage, we choose the number of green invention and utility model patent applications, which are less restricted by patent examination and granting agencies, to represent the output of the Green Technology R&D stage, which is also used as an input variable of Green Achievement Transformation stage. The Green Achievement Transformation stage mainly reflects the process of enterprises transforming the independent R&D and imported knowledge and technology into achievements with practical economic benefits. In addition to the green patent application produced in previous stage, non-R&D funds and new product development investment are also selected as the input in achievement transformation stage, and takes the total non-R&D investment and new product development funds of industrial enterprises above designated size as agency indicators respectively. In addition, energy consumption is taken as the input index of Green Achievement Transformation stage. Correspondingly, the comprehensive emission index of COD, SO2 and smoke (powder) dust calculated by the entropy weight method will be used as the unexpected output indicator to comprehensively calculate the green innovation efficiency.
For the key indicators affecting the green innovation efficiency, combining the existing literature and the actual situation of green innovation, this paper introduces environmental regulation intensity, factor endowment, property rights structure, industrial agglomeration. Foreign direct investment, regional economic development level and energy consumption to verify the impact of external environment on green innovation efficiency. Among them, referring to the studies of Yuan and Zhang (2020) and Wu et al. (2020), the existing environmental regulation is classified into five types: command-and-control, market incentive-investment, market incentive-cost, market incentive-subsidy and autonomous participation, and the entropy weight method is used to measure the comprehensive index of environmental regulation intensity; Elemental endowment is expressed by the ratio of fixed assets investment stock to regional employees over the years (Shao et al., 2022); Property rights structure is expressed as the ratio of the sum of the main business income of “private industrial enterprises, foreign-invested and Hong Kong, Macao and Taiwan-invested enterprises” to the main business income of “state-owned and state-controlled industrial enterprises” in the state-owned economy. (Du et al., 2019); Industrial agglomeration is measured by location quotient (Zhang et al., 2021); Foreign direct investment is directly measured by total foreign direct investment; Select per capita GDP to represent the regional economic development level (Su and Zhang, 2020; Qian et al., 2021); Energy consumption is referred to Su and Zhang (2020), characterized by the proportion of coal consumption to total energy consumption.
Considering the availability, comparability and timeliness of the data, the panel data of 30 provinces, autonomous regions and municipalities directly under the central government in China (excluding Hong Kong, Macao, Taiwan and Tibet) from 2008 to 2020 were selected as the sample. The specific indicators and data sources reflecting the green innovation efficiency inputs and outputs and the influencing factors are shown in Table 1. Among them, Missing data for individual provinces in individual years were managed by using interpolation, exponential smoothing, and the mean method. Considering the effect of price, we convert all price-related indicators to constant prices uniformly.
4 Results
4.1 Results and difference of green innovation efficiency
4.1.1 Results and difference of green innovation efficiency
According to the network SBM-DEA model, MaxDEA software is used to calculate the efficiency of GTRD, GAT and the network green innovation efficiency under the meta-Frontier and group-Frontier models for each region from 2008 to 2020. The results are presented in Table 2.
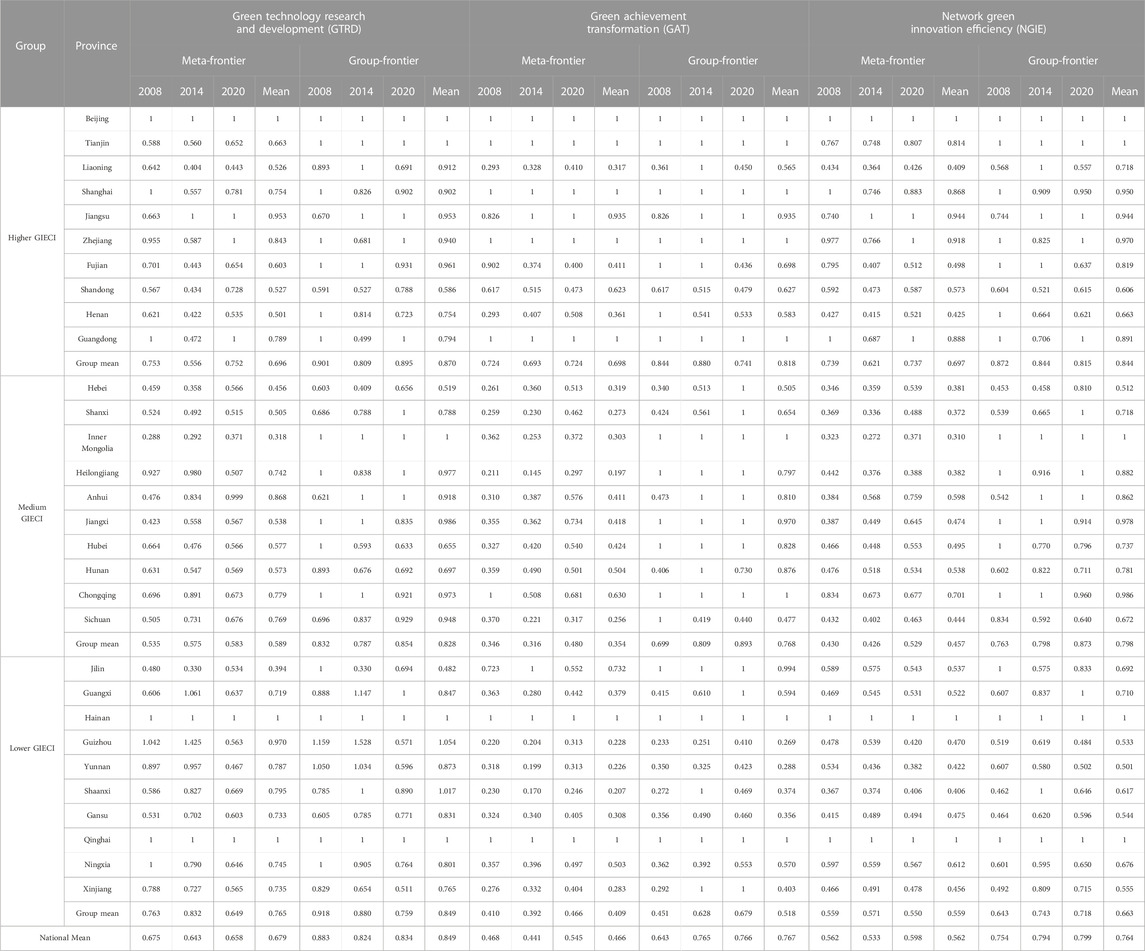
TABLE 2. Efficiency value of green innovation in two-stage and network under two frontiers.
The data presented in Table 2 indicates that the national average efficiency of the GTRD stage, the GAT stage, and the network green innovation under the meta-Frontier is smaller than the corresponding three types of efficiency under the group-Frontier. On one hand, although the average values of the three types of green innovation efficiency are gradually approaching the Frontier, there are still losses in the two-stage green innovation resource allocation and utilization process in most provinces. On the other hand, the group-Frontier takes the optimal technology level within each group as the reference, and the average efficiency will be overestimated due to the different resource endowments that promote green innovation, which leads to the failure of the three types of efficiency averages under the meta-Frontier to break through the corresponding efficiency averages under the restriction of the group-Frontier.
This paper will mainly analyze the three types of green innovation efficiency utilizing the meta-Frontier and takes the green innovation efficiency under the group-Frontier as a comparison. Firstly, from the stage perspective, there are more provinces at the forefront of the GAT stage (the efficiency value is 1) compared to the GTRD stage, but the variation coefficient of green achievement technology efficiency is relatively large, leading to the average efficiency at the GAT stage being lower than at the GTRD stage. From the comparison between groups in Figure 3, the strength of GIECI does not necessarily have a linear relationship with the fluctuation of efficiency values. The average efficiency of the three types of green innovation in the medium GIECI group is lower than that of the other two groups, which may be related to the low level of the two-stage green innovation efficiency in traditional industrial provinces in GIECI medium group such as Hebei, Shanxi, Inner Mongolia, and Heilongjiang (as shown in Figure 4). The average efficiency of each group fluctuates widely in the GTRD stage, which can be explained by the contingency generated by patent achievements. In the GAT stage, the average efficiency of each group in the GAT stage tends to move closer to the Frontier are becoming more and more clearly, and the efficiency of higher GIECI group remains stable at a relatively high level, while those with medium and lower GIECI show a fluctuating upward trend. The reason for this trend is that the higher GIECI areas are superior in the transformation of green advanced technology due to factors such as the more thorough implementation of regulatory policies and the more mature market-oriented environment that stimulate innovation. At the same time, the central and western regions have progressed, and urban agglomeration strategies have been implemented. These factors have led to noteworthy advancements in the efficiency of the GAT stage in provinces situated in the medium and lower GIECI groups predominantly located in the central and western regions. The fluctuation of network green innovation efficiency in each group is similar to that of the GAT stage.
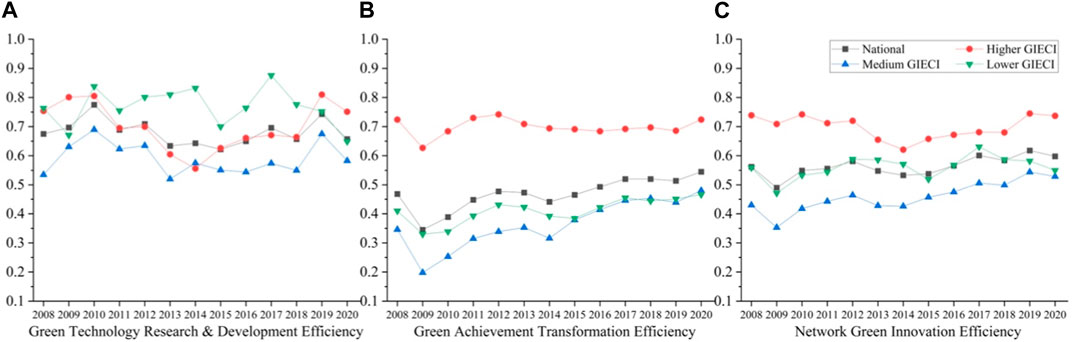
FIGURE 3. Average evolution of two-stage and network green innovation efficiency in the national and groups under the meta-frontier. (A) Average evolution of GTRD efficiency (B) Average evolution of GAT efficiency (C) Average evolution of NGI efficiency.
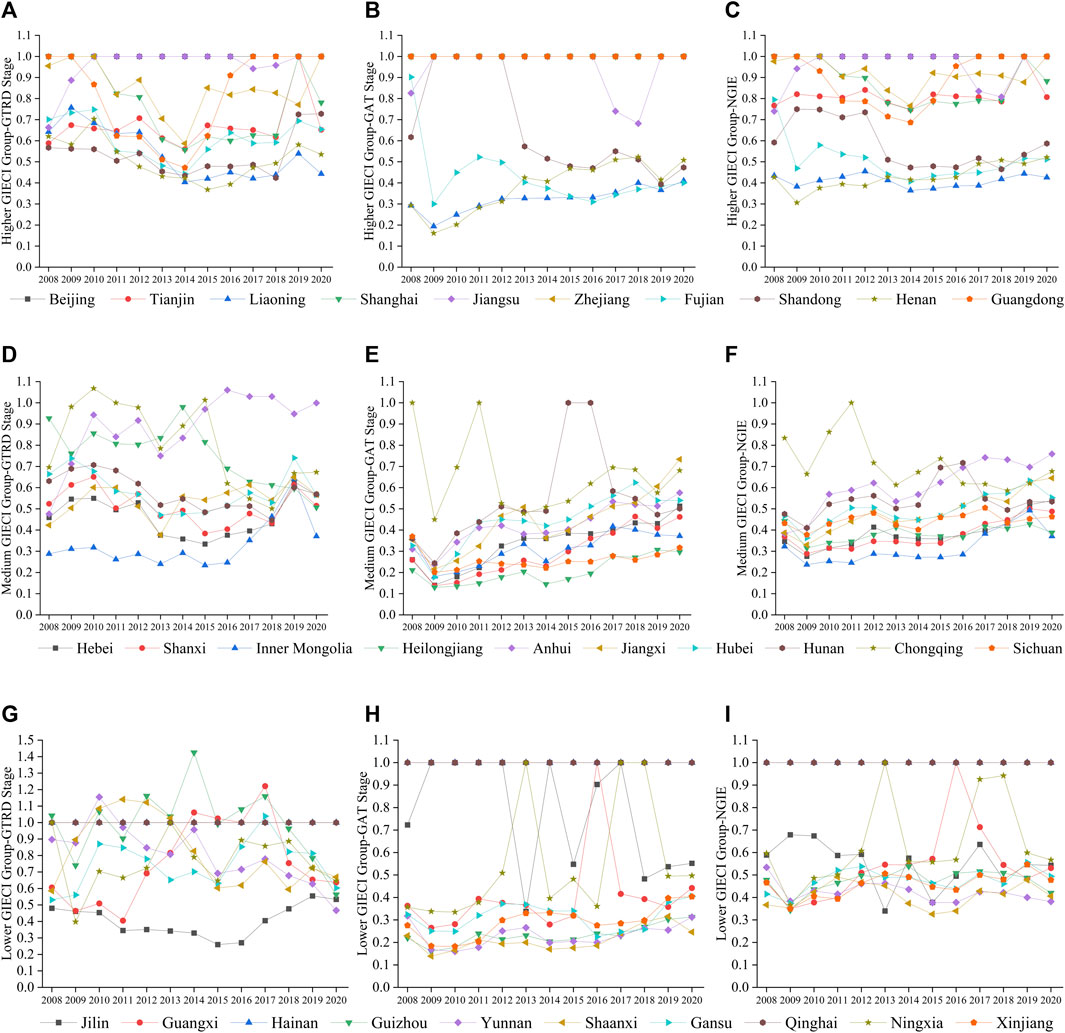
FIGURE 4. Evolution of two-stage and network green innovation efficiency in provinces under the meta-frontier. (A) GTRD efficiency evolution in provinces within the higher GIECI group. (B) GAT efficiency evolution in provinces within the higher GIECI group. (C) NGI efficiency evolution in provinces within the higher GIECI group. (D) GTRD efficiency evolution in provinces within the medium GIECI group. (E) GAT efficiency evolution in provinces within the medium GIECI group. (F) NGI efficiency evolution in provinces within the medium GIECI group. (G) GTRD efficiency evolution in provinces within the lower GIECI group. (H) GAT efficiency evolution in provinces within the medium GIECI group (I). NGI efficiency evolution in provinces within the medium GIECI group
Second, at the individual provincial level, according to Figure 4, most provinces in the Beijing-Tianjin region and the Yangtze River Delta have reached or approached the meta-Frontier in the GTRD stage, indicating that the input-output structure of green innovation at this stage has gradually become reasonable, and it is imperative to optimize resource utilization and strive towards sustained progress. In the GAT stage, most provinces show a more obvious efficiency improvement pattern than the previous stage. Among the provinces that have reached or basically reached the Frontier level, except for Hainan and Qinghai, all others belong to higher GIECI areas, indicating that at this stage, external environmental factors such as environmental regulation intensity and regional resource endowment can effectively promote the resource utilization efficiency of green achievement transformation. From the perspective of the connection between the two stages, Tianjin, Shandong and Jilin have lower efficiency of the GTRD stage but higher efficiency of the GAT stage, representing a situation of “inferior before and superior after”, with a strong industrialization ability of scientific and technological achievements but a relatively insufficient level of independent R&D. Attention should be paid to optimizing the resource allocation in the GTRD stage and then promoting R&D efficiency while maintaining the advantages of back-end industrial development. Heilongjiang, Anhui and Sichuan in the medium GIECI group and Guangxi, Guizhou, Yunnan, Shaanxi, Gansu and Xinjiang in the lower GIECI group have higher GTRD efficiency but lower GAT efficiency, showing the characteristics of “superior before and inferior after”. The ability of industrialization and commercialization of scientific and technological achievements in these provinces is not obvious due to location factors, and the early scientific and technological R&D and the later transformation of achievements have failed to form an effective connecting chain. Therefore, more attention needs to be paid to improving the application of innovative achievements. The green innovation efficiency of the two stages in Liaoning, Henan, Hebei, Shanxi, Inner Mongolia and Fujian is lower than the national average. The reason for the “simultaneously inferior” phenomenon may be the dependence on traditional heavy industries in the past and the “resource curse” effect of resource-based provinces, leading to low concentration of innovation resources. Among the 17 provinces with lower-than-average network green innovation efficiency, most of the provinces lacking in the transformation of innovation results are located in regions with lower GIECI, while most of the provinces located in regions with medium GIECI have certain distance from the Frontier in two-stage efficiency and need further improvement.
4.1.2 Analyzes on the technology gap ratio of green innovation
Table 3 displays the differences in the average TGR of three groups’ green innovation. Among them, the average TGR in the medium GIECI is obviously lower than that of the other two groups, which mainly reflects the disadvantages of technology introduction and the insignificant effect of patented technology put into production in the GAT stage. Combined with the development background of each province, several provinces with lower TGR in the GTRD stage may be due to the neglect of social and environmental benefits in pursuit of economic benefits in the development process, resulting in a relatively insufficient awareness of green independent R&D, and the output of green patent results does not match the investment of R&D resources. Among the group with higher GIECI, the TGR of each province in the GAT stage is close to 1. Most of these provinces are located in the core areas of developed economic circles such as Beijing-Tianjin-Hebei, or Yangtze River Delta and Pearl River Delta. These areas, while leading the economic development, pay more attention to the rational allocation of resources and the implementation of social and environmental responsibilities, and also have more advantages in technology introduction and development. Most of the provinces with smaller TGR are concentrated in the medium GIECI group, which is mostly located in the inland areas and give relative importance to traditional industries/agriculture, resulting in failure to prepare for the long-term, uncertain and high-risk factors associated with the complex process of scientific and technological achievement transformation. In terms of network green innovation efficiency, the fluctuations observed in each province/group are roughly similar to those observed in the GAT stage. Results from the non-parametric test (K-W test) indicate that the corresponding p-values for the TGR of the three types of green innovation efficiency are less than 0.001. This suggests that a significant test has been passed, indicating that the technical gap between the groups is evident.
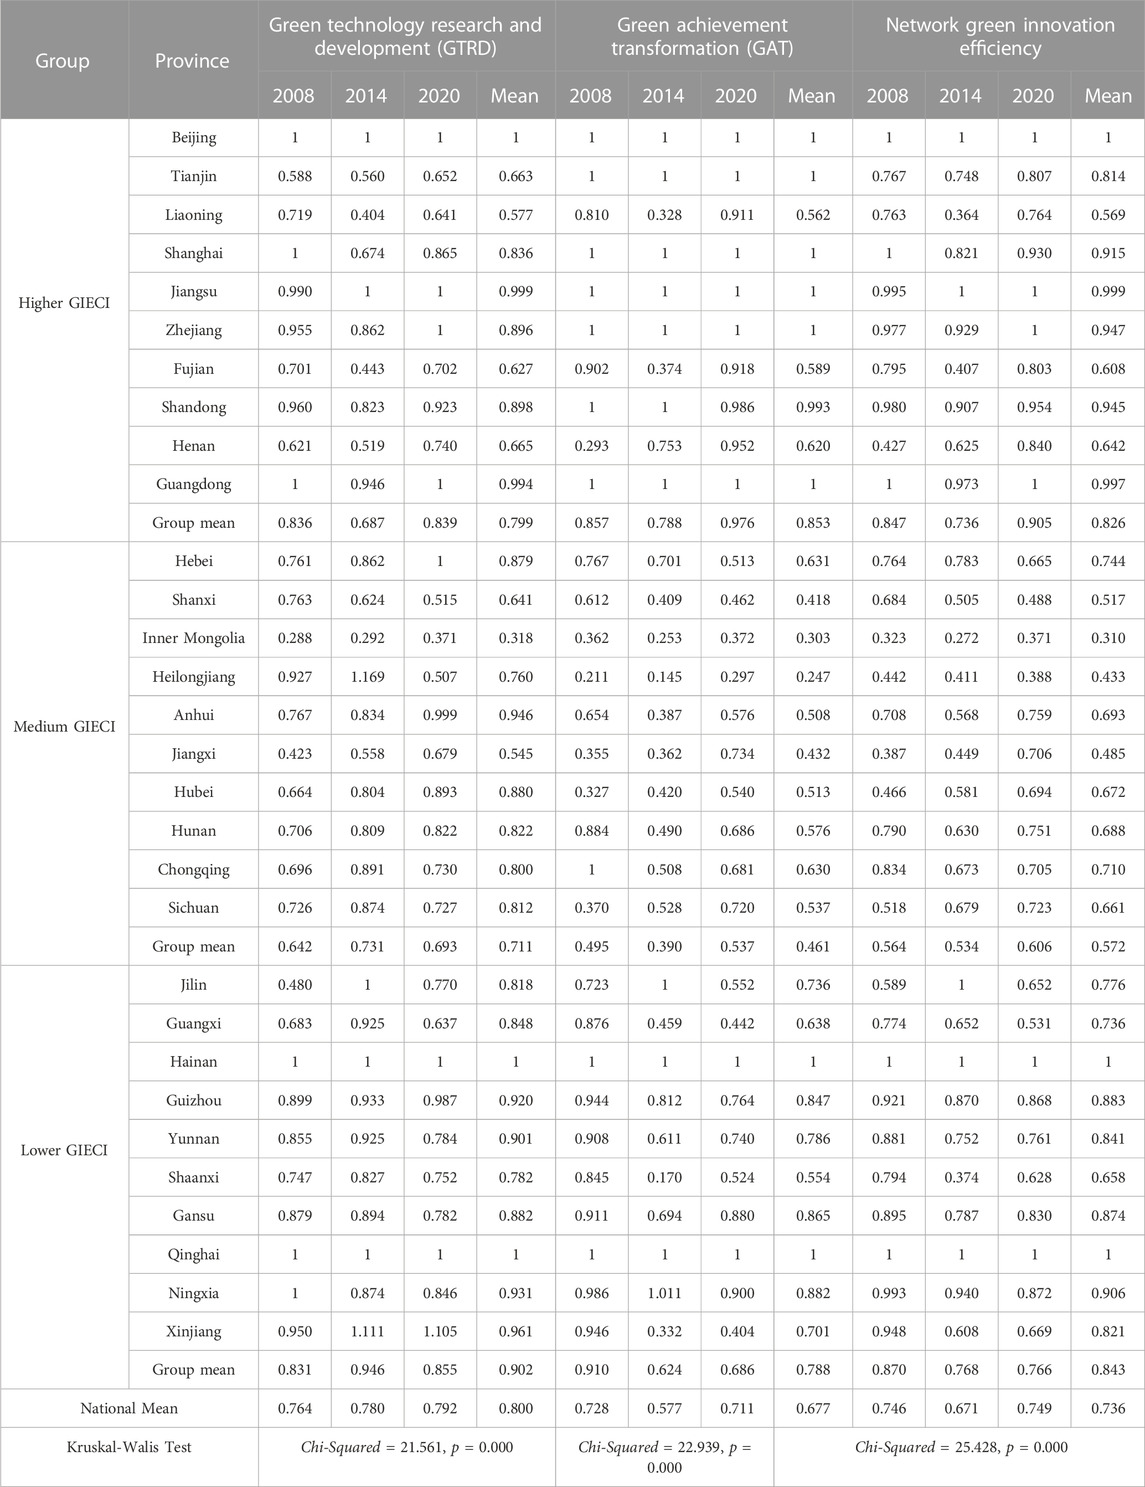
TABLE 3. TGR of two-stage and network green innovation in each province.
4.2 Results and discussion of spatiotemporal dynamic evolution
4.2.1 Analyzes on the time evolution of green innovation efficiency based on GML index
The GML index represents the fluctuation in the efficiency of green innovation over time. As illustrated in Table 4, an examination of the evolution of temporal trends reveals that, in the GTRD stage, apart from a decline in national average efficiency in individual periods, the GML index in other periods is greater than 1. The highest increase in range is observed from 2014 to 2015. However, overall, the efficiency improvement has been counteracted by the efficiency decline. In the GAT stage, the GML index shows that the overall efficiency has slightly improved. The GML index changes of the three types of green innovation in the three groups generally follow the fluctuation of the national GML index. In the GTRD stage, efficiency change is mainly influenced by technical efficiency in the early stage, but after 2010, technological progress became an important factor in improving the efficiency of GTRD. In the GAT stage, efficiency improvement is primarily due to the alternating impact of technological progress and technical efficiency.
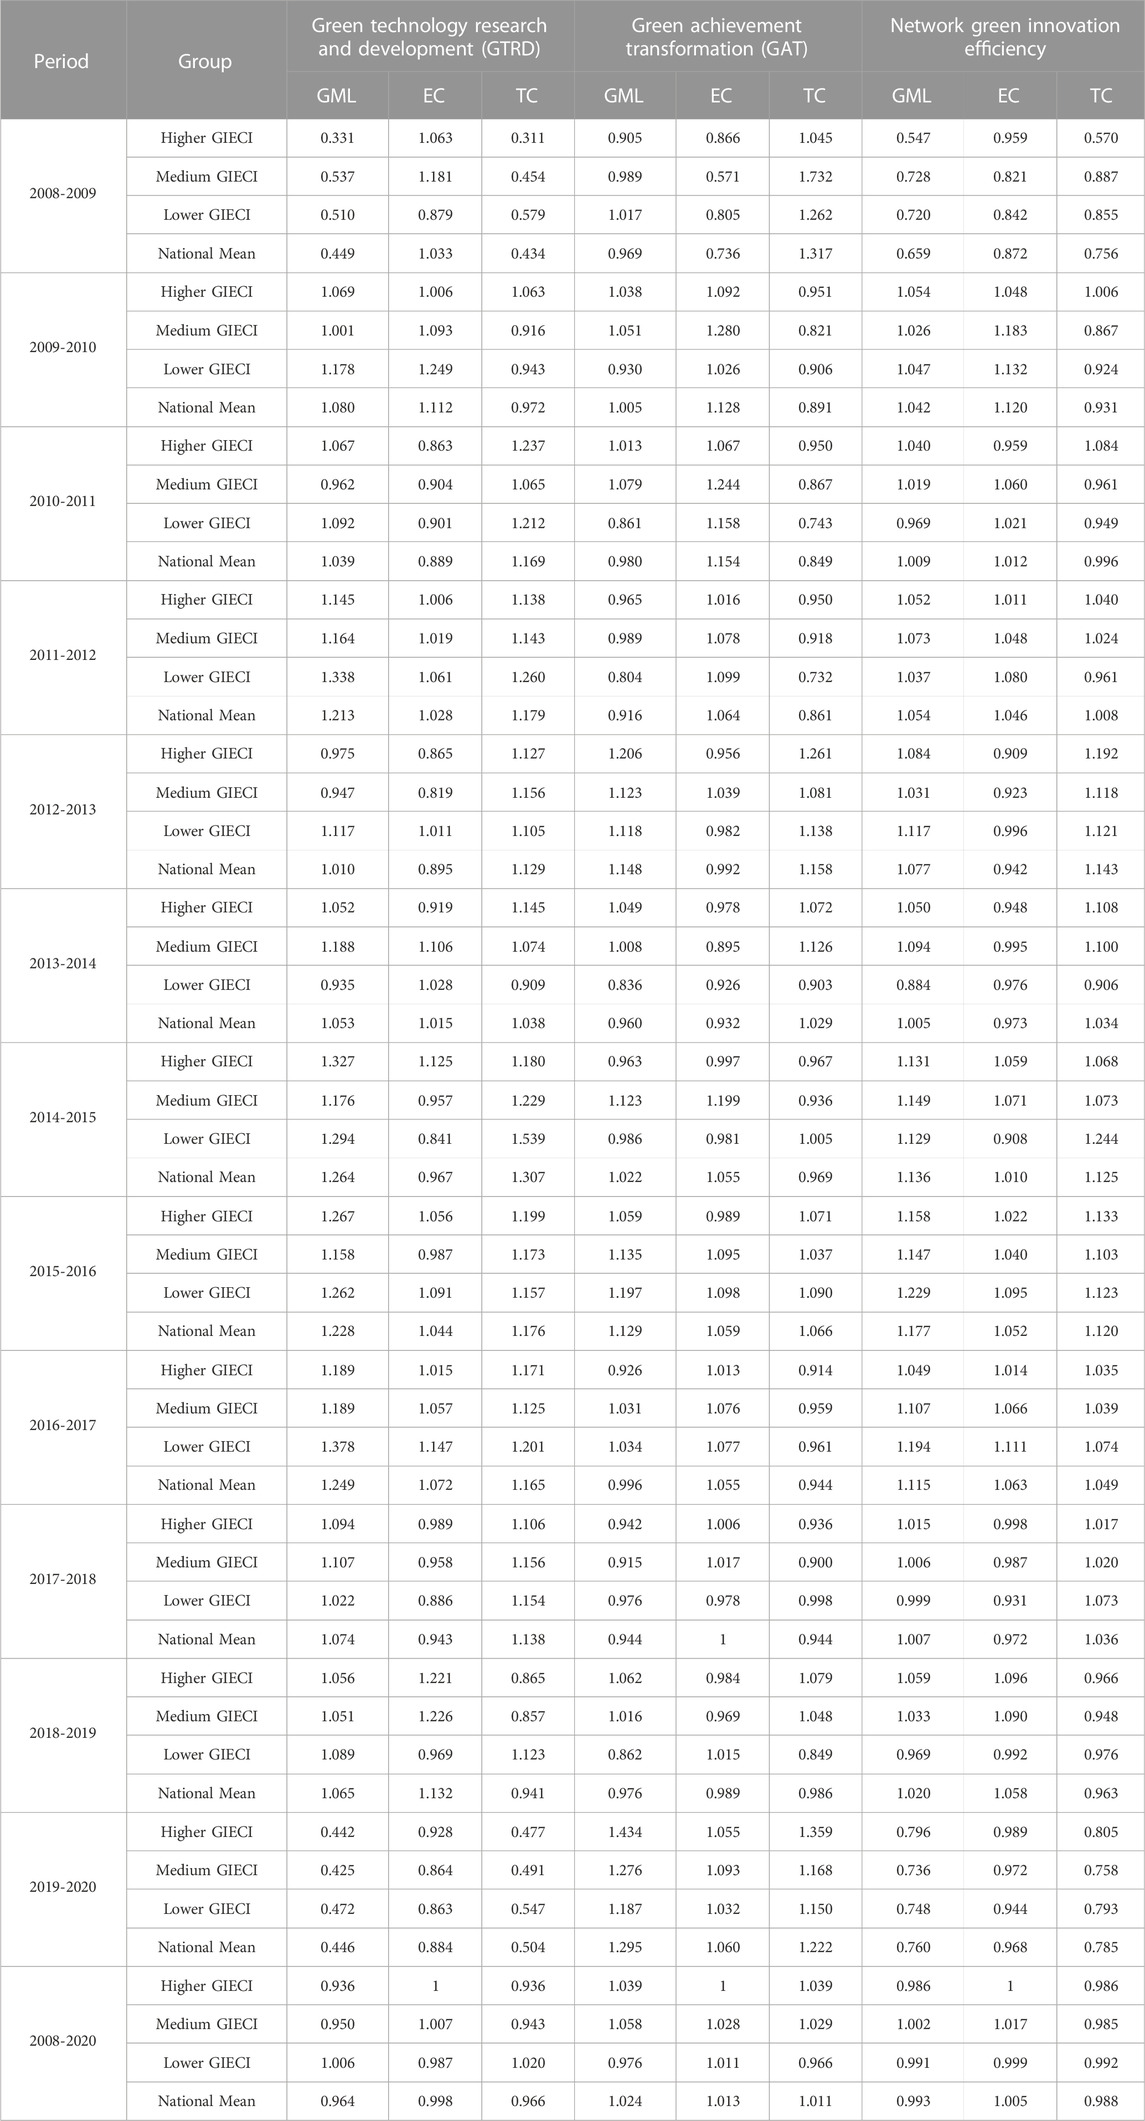
TABLE 4. GML index Changes of two-stage and network green innovation in each group.
In cooperation with the individual level of the sample, as shown in Table 5, in the GTRD stage, only seven provinces have an average GML index greater than 1, of which 5 provinces are in the lower GIECI group. However, in the GAT stage, 22 provinces’ GML index is greater than 1. Therefore, the two-stage structural configuration of “one increase and one decrease” causes a small-scale growth trend in the national network green innovation efficiency. Provinces with GML indices greater than 1 in both the GTRD stage and the GAT stage include Beijing, Inner Mongolia, and Guizhou. Provinces with GML indices greater than 1 in the former stage and less than 1 in the latter stage include Hainan, Gansu, Qinghai, and Xinjiang in the lower GIECI group. Provinces with GML indices less than 1 in both stages include Tianjin and Fujian in the higher GIECI group and Yunnan and Ningxia in the lower GIECI group. Apart from the above-mentioned provinces, the GML index results of other provinces indicate that efficiency decreases in the GTRD stage, while efficiency increases in the GAT stage. Combining the green innovation efficiency results calculated by the network SBM-DEA model, all of them exhibit unstable results in the GTRD stage and certain randomness in the input-output ratio. However, in the GAT stage, due to the continuous attention to the transformation of scientific and technological achievements and the joint promotion of the “dual subjects” of government and market, the application conditions of patented achievements to the production stage are more complete, resulting in an improvement in the efficiency of green achievement transformation.
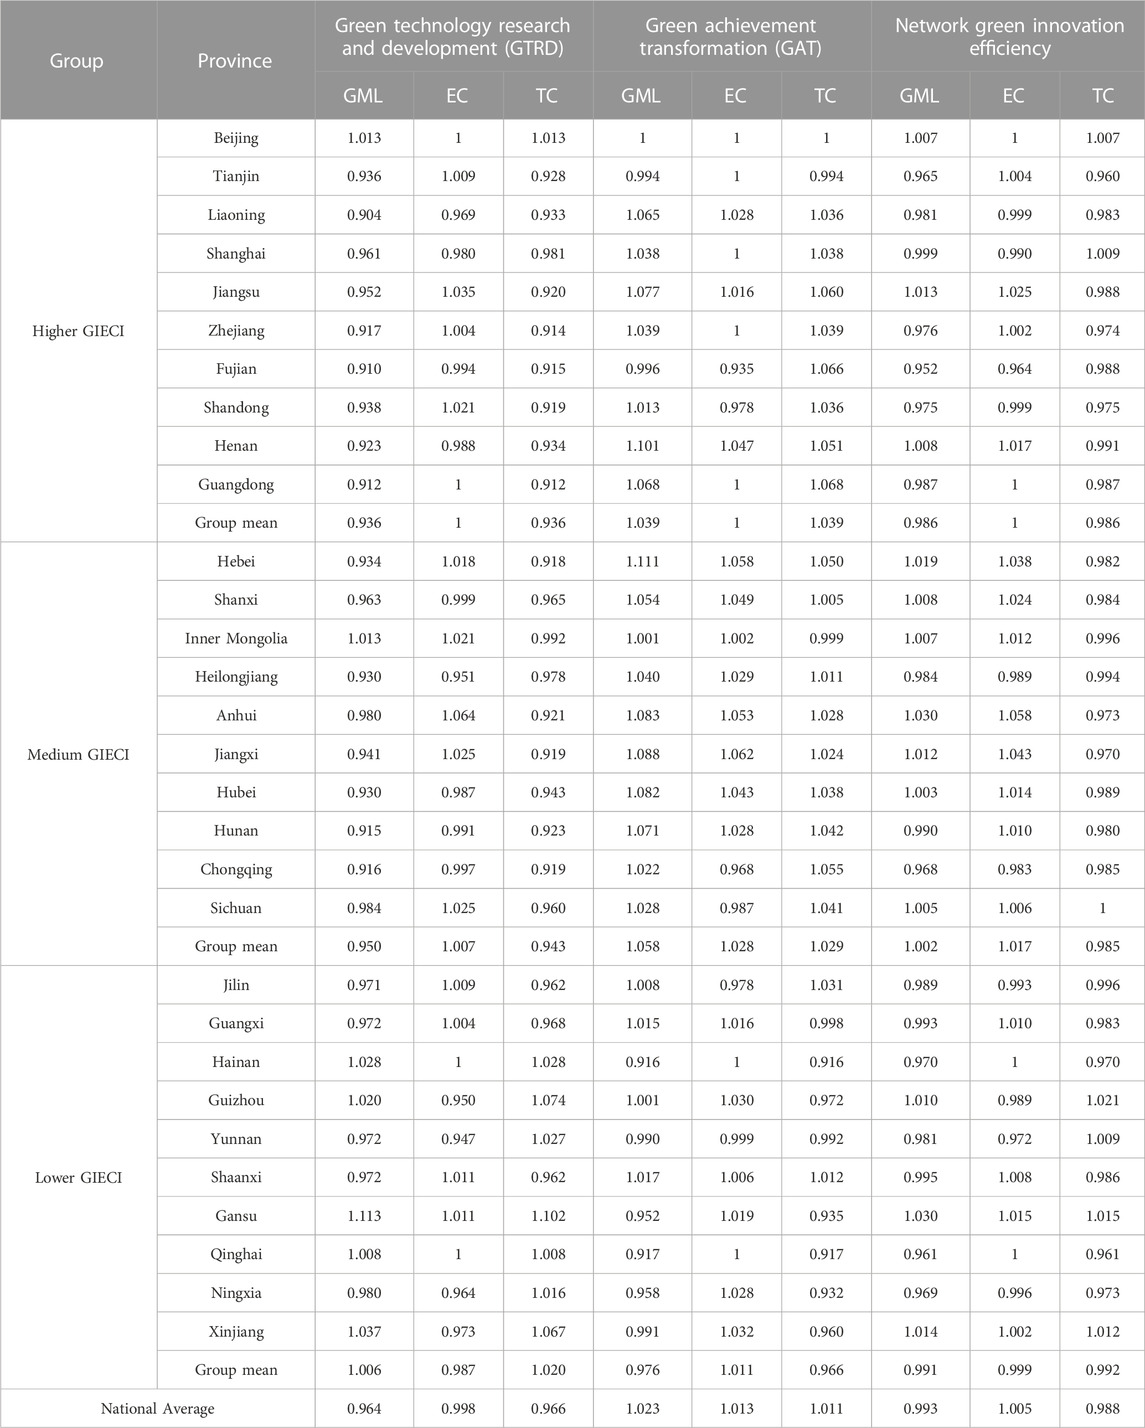
TABLE 5. Variation and decomposition of average GML index of two-stage and network green innovation in each province
4.2.2 Analyzes on the spatial evolution of green innovation efficiency based on Moran’s I
To examine spatial correlation in green innovation efficiency, we utilized Stata 17.0 software to calculate the Moran’s I statistic and its distribution for each province between 2008 and 2020. As shown in Table 6, the Moran’s I was greater than 0 for all years during the sample observation period, and the spatial correlation of regional green innovation efficiency is more stable and significant in the Green Achievement Transformation stage than in the Green Technology R&D stage. Specifically, the Moran’s I of innovation efficiency in the GTRD stage stabilized after 2014, indicating an emphasis on independent R&D capability and increased interaction and technical dependence of green innovation between urban agglomerations and provinces, resulting in improved spatial correlation with the phenomenon of “high-high” and “low-low” agglomeration. In the GAT stage, the Moran’s I passed the significance test in all years except 2017, while the Moran’s I of network green innovation was significant in every year. In the GTRD stage, the global Moran’s I showed an annual upward trend, with the lowest value of 0.174 in 2010 and the highest value of 0.366 in 2019, indicating increasing spatial correlation over time. In the GAT stage, the Moran’s I fluctuated over time, with the lowest value of 0.181 in 2011 and the highest value of 0.381 in 2020. The Moran’s I of network green innovation increased and reached a peak of 0.412 by 2020.

TABLE 6. Global Moran’s I of two-stage and network green innovation efficiency.
As shown in Figure 5, spatiotemporal aggregation maps of Moran’s I for the two stages and network green innovation efficiency are drawn, respectively, for the maximum and minimum values of the sample observation period to analyze the spatiotemporal transition of green innovation efficiency. In the GTRD stage, when Moran’s I was at its lowest in 2010, the distribution of provinces in quadrants was relatively even, and clustering was not apparent. By 2019, 21 provinces were located in the first and third quadrants, indicating that the efficiency of the GTRD stage exhibits “high-high” agglomeration or “low-low” aggregation in the same direction. Compared to 2009, the linear slope in the figure has increased, indicating further improvement in spatial correlation. The efficiency value of the GAT stage has also shown increasingly obvious agglomeration characteristics over time. On the one hand, there are fewer provinces in the second and fourth quadrants, and more provinces are concentrated in the first and third quadrants. On the other hand, the linear slope increases, and spatial correlation is further enhanced. From the change in the Moran’s I scatter plot of network green innovation efficiency, it can also be concluded that spatial agglomeration is enhanced toward the first or third quadrants. From the Moran’s I distribution of the three types of green innovation efficiency, it is obvious that the provinces gathered in the first quadrant are mostly developed provinces such as Beijing, Tianjin, Shanghai, Jiangsu, and Guangdong, and the spatial correlation of green innovation efficiency in these provinces is relatively stable, which can form a synergistic situation with neighboring provinces. However, provinces in medium and lower GIECI groups, such as Heilongjiang, Jilin, Shanxi, Inner Mongolia, Henan, Guangxi, and Ningxia, are mostly concentrated in the third quadrant. These provinces are relatively backward in innovation development, and their technology and management levels are somewhat different from those of developed provinces.
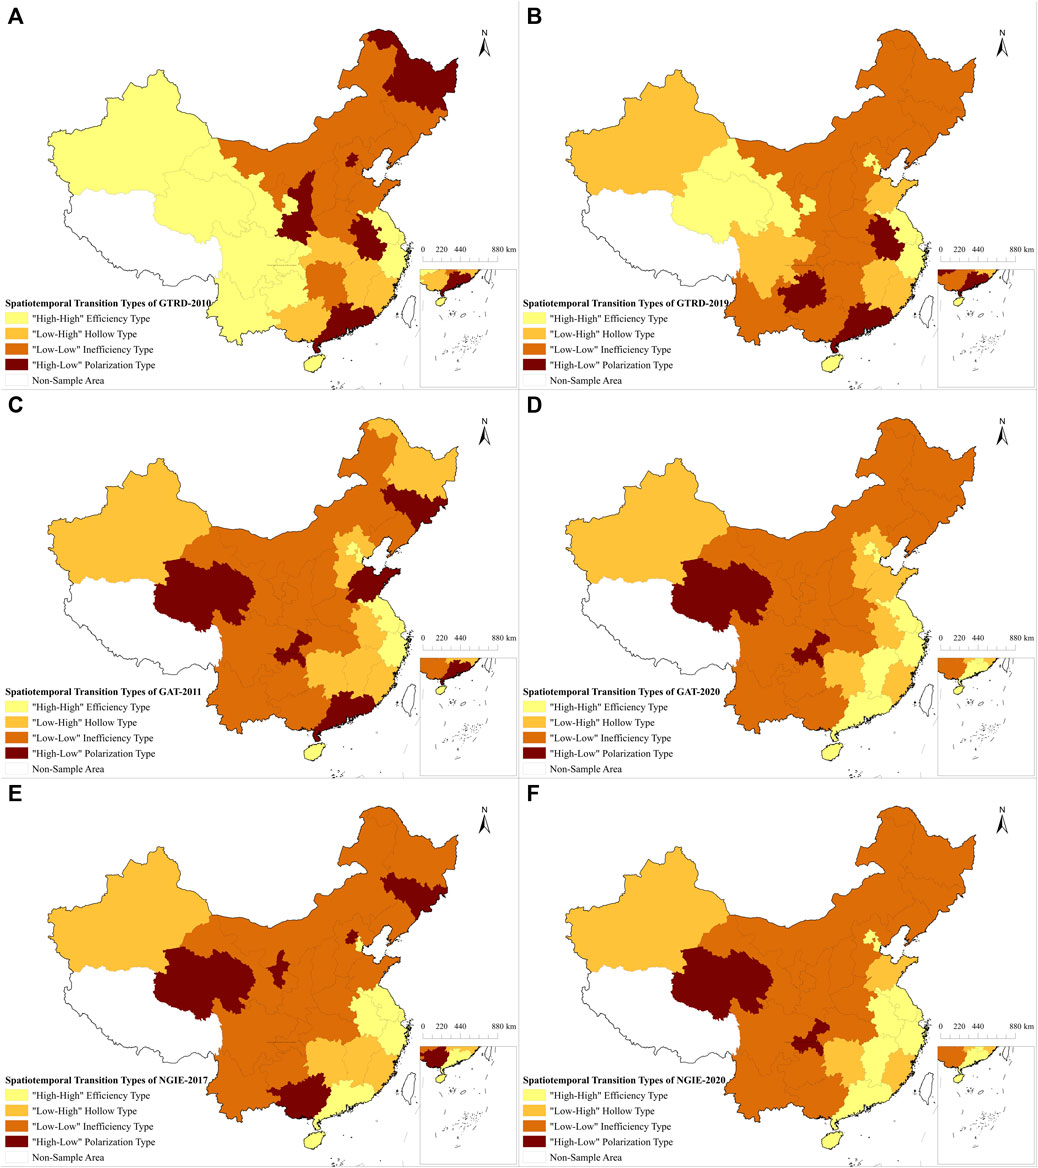
FIGURE 5. Spatiotemporal aggregation maps of two-stage and network green innovation efficiency. (A) Spatiotemporal transition of GTRD in 2010. (B) Spatiotemporal transition of GTRD in 2019. (C) Spatiotemporal transition of GAT in 2011. (D) Spatiotemporal transition of GAT in 2020. (E) Spatiotemporal transition of NGI in 2017. (F) Spatiotemporal transition of NGI in 2020. Note: This figure is created based on the standard map from the Map Technical Review Center of the Ministry of Natural Resources (Map Approval No. GS (2019)1822). The base map has not been modified.
Referring to the spatiotemporal dynamic analyzes method of regional systems by Rey and Janikas (2004), this paper classifies the spatiotemporal transition types of green innovation into four categories according to the specific changes of Moran’s I in different regions. As shown in Table 7, in the GTRD stage, the provinces belonging to the transition type I are Guizhou, Guangxi, Hubei, Shandong and Beijing, among which Guizhou has jumped from the first quadrant to the fourth quadrant due to the decline of GTRD efficiency in neighboring provinces; Guangxi and Hubei have low efficiency at the GTRD stage, which is further affected by the “siphon effect” of Guangdong and Anhui in the development process, then forms a “low-low” inefficiency agglomeration of GTRD efficiency with other neighboring provinces such as Yunnan and Hunan, forming a “reverse” driving situation; the GTRD efficiency of the provinces around Shandong and Beijing has been greatly improved, forming a “high-high” agglomeration situation. The provinces belonging to the transition type II are Yunnan, Chongqing and Tianjin, which have a large transition scale, in which Yunnan, Chongqing and their neighboring provinces have transitioned from “high-high” agglomeration to “low-low” agglomeration. The development of such provinces is relatively slow, and the neighboring provinces (such as Sichuan, Shaanxi, etc.) have failed to form a benign interaction. Tianjin benefits from the favorable influence of the development strategy of the Beijing-Tianjin-Hebei urban agglomeration and realizes the spatial agglomeration of “high-high” efficiency type. There are four provinces belonging to the transition type III, among which Sichuan and Xinjiang has developed at a relatively slow space, while the neighboring provinces, such as Guizhou, Gansu and Qinghai, are in the first echelon of innovation, forming an evolution from “high-high” efficiency type to “low-high” hollow type; Heilongjiang and Shaanxi, with the continuous upgrading and development of industries, have no longer show the original advantages of industrialization and lack of innovative vitality, thus shifting to the direction of “low-low” inefficiency type. The other 18 provinces have relatively strong spatial stability and have not experienced significant spatiotemporal transitions. In summary, the mutual driving effect of neighboring units in the process of green innovation and development in various provinces in the GTRD stage is still unstable. To achieve higher efficiency, it is necessary to strengthen the connection of urban agglomerations and economic zones to form a virtuous development cycle. This can help overcome the challenges faced by provinces that have shifted towards “low-low” inefficiency type and support the continued improvement of green innovation efficiency in other provinces that have shown strong spatial stability.
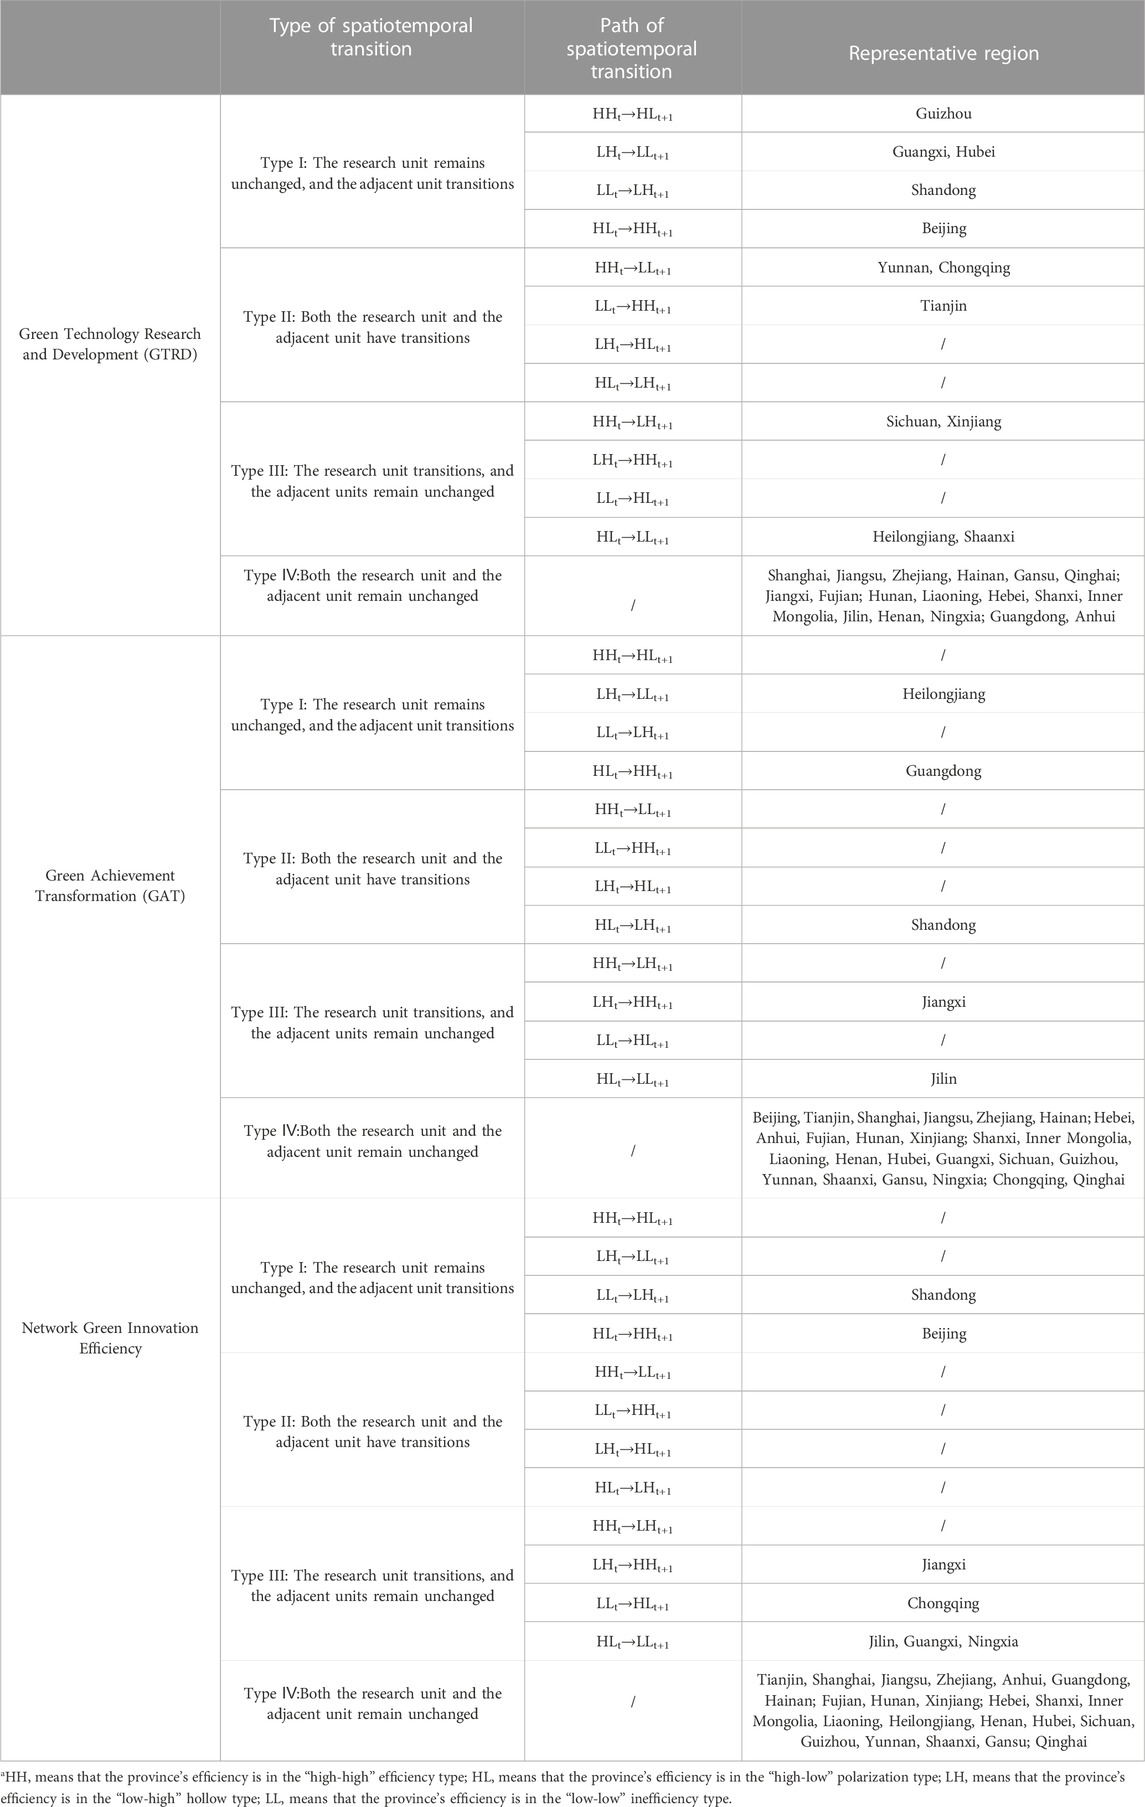
TABLE 7. Spatiotemporal transition path and type of two-stage and network green innovation efficiency.
In the GAT stage, 25 provinces and their neighboring units did not experience any transition, belonging to type IV. It can be observed that at this stage, relatively stable spatial agglomeration and spatiotemporal transition path dependence have been formed. Among the provinces where spatiotemporal transition occurred, Heilongjiang and Guangdong belong to type I transition. The reason for the transition in Heilongjiang is mainly due to the decline in GAT efficiency in neighboring provinces, such as Inner Mongolia and Jilin. On the other hand, Guangdong has played a crucial role in space radiation, utilizing the central advantages of the Pearl River Delta and the Greater Bay Area, to drive neighboring provinces towards improved efficiency in the GAT stage, resulting in the spatiotemporal transition from the “high-low” polarization type to the “high-high” efficiency type. Shandong belongs to the spatiotemporal transition of type II, and its GAT efficiency has not kept up with the development growth rate of neighboring provinces, leading to the reversal of the spatial correlation type. Jiangxi, which underwent a type III transition, has almost all neighboring provinces in the first quadrant, belonging to the “high-high” efficiency type. By absorbing the spillover resources of neighboring provinces, Jiangxi has achieved the optimal allocation and rational utilization of resources, resulting in a noticeable improvement in GAT efficiency and spatiotemporal transition. As a former old industrial base, Jilin no longer shows its former advantages and has even become an obstacle to green transformation to some extent. Similar problems exist in neighboring provinces, resulting in a transition from the “high-low” polarization type to the “low-low” inefficiency type. Due to the joint influence of the two stages, the network green innovation efficiency obtained by integrating the two-stage green innovation efficiency shows that the spatiotemporal transition path of network green innovation in some provinces has changed compared to the sub-stage. However, most provinces still exhibit a high degree of spatial stability, and spatial relevance has increasingly improved. Among the three types of green innovation efficiency, most provinces with spatiotemporal transition have transitioned from the second/fourth quadrant to the first/third quadrant. This indicates that the green innovation efficiency of each province is increasingly consistent with the spatial theoretical framework of “core-edge”, which once again proves the spatial correlation of green innovation efficiency.
4.3 Results and discussion on the impact of two-stage green innovation efficiency by Tobit model
By using the Stata 17.0 software, the panel Tobit regression results are shown in Table 8.
(1) Environmental Regulation Intensity: According to Table 8, the intensity of environmental regulation has significantly reduced the enthusiasm and effectiveness of enterprises in conducting green technology R&D and achievement transformation. This confirms the cost crowding-out effect of environmental regulation on green innovation, whereby environmental regulations increase compliance costs and penalties for non-compliance, inevitably squeezing out normal production investments of enterprises. As a result, the marginal returns on technological innovation decrease, and the R&D investment and proactiveness of green innovation are greatly weakened. However, some argue that continuous green innovation allows companies to gain differentiation and premium pricing. The resulting profit compensation partially or fully offsets the aforementioned negative effects, thereby encouraging further investment in green innovation and creating a virtuous cycle (Porter, 1995). Nevertheless, based on the results of this study, this long-term trend still requires further verification over time.
(2) Elemental Endowment: The existing elemental structure significantly negatively affects the green technology R&D efficiency, indicating that material capital inputs in the current stage have not completely shifted away from traditional extensive growth tendencies. Repetitive investments made to meet the needs of expanding reproduction lead to excess production capacity, which hinders the widespread development of green innovation by enterprises. In the green achievement transformation stage, in conjunction with actual circumstances, apart from the autonomous innovation results generated in the previous stage, the main innovation comes from technology introduction. This stage is less affected by the crowding-out effect of local endowment structures, which sets it apart from the Tobit results of the previous stage.
(3) Property Rights Structure: The ownership structure has a more significant positive effect on the promotion of the green achievement transformation stage. The reason behind this is that non-state-owned enterprises are more inclined to achieve breakthroughs in green innovation through the introduction of technology compared to state-owned industrial enterprises. However, when considering the results by group, it reveals conclusions opposite to the overall sample direction. An analysis in conjunction with the actual circumstances shows that in the higher GIECI group, the majority of provinces are located in developed eastern coastal areas. These regions face stricter environmental regulation constraints, have more comprehensive supervision mechanisms, and are more sensitive to market reactions to policies. Additionally, due to the unique market position of state-owned enterprises and their subordinate relationship with government departments, enable the effective implementation of green innovation concepts within them.
(4) Industrial Agglomeration: Although industrial agglomeration coefficients have mostly positive effects on the green innovation efficiency in both the national and group samples, they only produce significant effects in specific group situations compared to other influencing factors. The effects about scale economies, resource sharing, knowledge spillover, and green innovation collaboration brought about by industrial agglomeration are not yet apparent, and their related potentials require further exploration.
(5) Foreign Direct Investment: Foreign direct investment has to some extent reduced the enthusiasm and effectiveness of enterprises in conducting autonomous green technological R&D. The “pollution haven hypothesis” suggests that differences in the environmental regulation intensity among regions alter the comparative advantage of their industrial sectors, thereby promoting the relocation of production activities from regions with high environmental regulation intensity to areas with looser environmental regulation standards to reduce pollution control costs (Ahmed, 2012). However, the resulting industrial relocation is detrimental to the local development of green innovation. The results of this study validate this viewpoint.
(6) Regional Economic Development Level: The improvement of the regional economic development level significantly enhances the efficiency of green technology R&D and achievement transformation. Specifically, regional economic development contributes to providing high-quality capital and labor for green innovation. Moreover, regions with higher levels of economic development exhibit stronger public awareness of environmental protection and a greater inclination toward green products, thus creating motivation or pressure for enterprises to engage in green innovation.
(7) Energy Consumption: Energy consumption to some extent reduces the enthusiasm and effectiveness of enterprises in conducting green technology R&D and achievement transformation. It is generally recognized that energy consumption has adverse impacts on the economy, society, and ecology from various aspects such as resource depletion and environmental pollution. This negative externality similarly affects green innovation activities of enterprises.
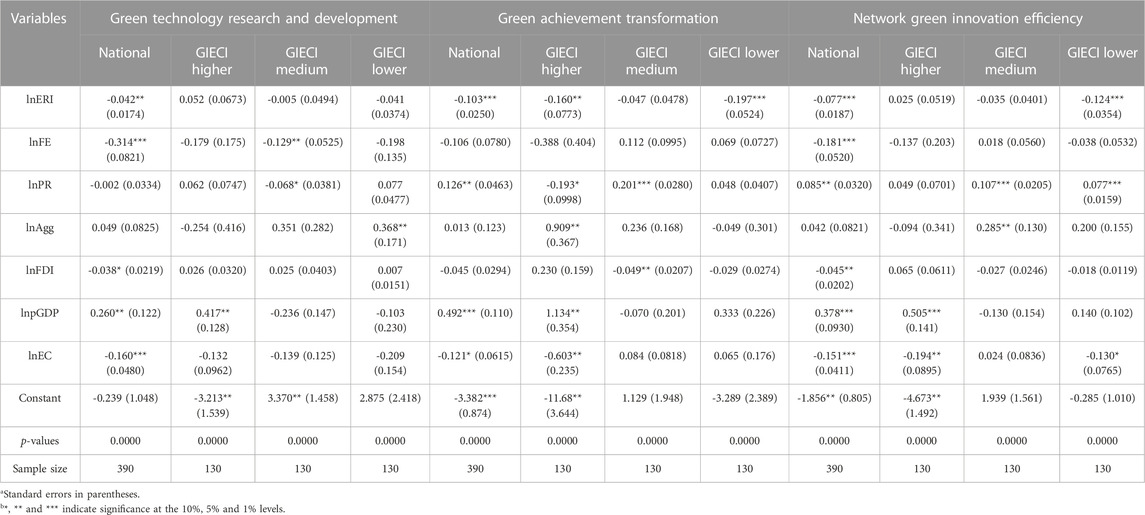
TABLE 8. Tobit regression results of two-stage and network green innovation efficiency.
5 Conclusion and discussion
5.1 Conclusion
Based on an expansion of existing research in this field, comprehensively examine the dynamic changes of green innovation efficiency from the stage of green innovation, the heterogeneity of technology collection, the comparability of pre- and post-development, the spillover of geographical space, and the diversity of influencing factors, so as to reveal the regional disparities and variances of green innovation efficiency, and reveal the “black box” of green innovation efficiency. This study uses a multi-stage network SBM-DEA model that considers unexpected output to measure the staged efficiency of green innovation under the heterogeneity of external environment, and deeply analyze the root cause of efficiency loss. By combining the GML index and global Moran’s I of green innovation efficiency in each stage, we draw the dynamic path of green innovation efficiency and spatiotemporal changes, and verify the factors affecting the efficiency of regional green innovation by Tobit regression model. The conclusions are as follows:
(1) From the stage of green innovation, most provinces have efficiency losses in the process of allocating and using green innovation resources under two stages. Although there are more leading provinces in the GAT stage, the difference of green innovation efficiency among provinces in this stage is relatively large, so the average efficiency in this stage is lower than that in the GTRD stage. Since there is a certain accident in the production of patent achievements, the improvement of the efficiency level of the national and groups in the GTRD stage is less obvious than that in the GAT stage. Provinces with low network green innovation efficiency are mainly composed of medium and lower GIECI groups.
(2) Due to the heterogeneity of technology collection, there are differences in the innovation efficiency of decision-making units in each green innovation stage under the group-Frontier and the meta-Frontier. The intra-group differences within the medium GIECI group with more traditional industrial provinces in the group are more obvious than in the other two groups. Similar results are confirmed when comparing the TGR index.
(3) From the comparability of pre- and post-development, the efficiency of GTRD stage has decreased during the sample observation period, while the efficiency of GAT stage has improved. The two-stage structural configuration of “one increase and one decrease” causes a small-scale growth trend in the national network green innovation efficiency. The improvement range of technical efficiency of each group is different. Based on the GML index, in the GTRD stage, the lower GIECI group has obvious catch-up trend; while in the GAT stage, the advantages of medium GIECI group, where the main provinces in the group are located in the central region, are more prominent.
(4) From the spillover of geographical space, the spatial correlation and stability of the two-stage and network green innovation efficiency are increasing year by year, and the phenomenon of “high-high” agglomeration and “low-low” agglomeration is becoming increasingly pronounced. The provinces in the higher GIECI group are almost “high-high” agglomeration, while some provinces in the lower and medium GIECI group are clustered mostly in the third quadrant, which is in a “low-low” inefficiency agglomeration state. The spatiotemporal transition in a small number of provinces is in the “high-low” polarization or “low-high” hollow aggregation (as shown in Figure 5), which is because the first-mover advantage of advanced regions will further squeeze out and hinder the innovation behavior of regions lagging behind in the green innovation development, forming a “siphon effect”. However, with the passage of time, the synergy of green innovation among provinces has been strengthened, forming a green innovation development cycle that drives and promotes each other, which makes the spatial agglomeration of green innovation increase, and the number of such provinces has decreased year by year.
(5) From the diversity of influencing factors, the crowding-out effect caused by environmental regulations, the excessive inefficient and repetitive investment under the existing factor structure, the “pollution refuge” effect caused by foreign direct investment, and the negative externality of energy consumption have more inhibitory effects on green innovation efficiency, while the improvement of regional economic development can have a positive impact on green innovation efficiency by raising public awareness of environmental protection and increasing high-quality intellectual capital investment.
5.2 Discussion
On the basis of considering the problems above, and combined with the research conclusions of this article, the following suggestions are put forward:
(1) Enhancing the height of green innovation strategy, Stimulating the proactiveness of Market Entities. The green innovation strategy should be regarded as a crucial cornerstone for improving quality and efficiency, the strategic priorities for planning green technology research and development and the achievements transformation should be determined from a long-term and sustainable perspective. Targeted efforts should be made to improve the efficiency levels of different stages of green innovation in various regions. Specifically, for the stage of green technology research and development with high efficiency losses, attention should be given to the dual enhancement of technology and management. This includes strengthening support and providing technical guidance for green innovation R&D, encouraging enterprises to actively engage in substantial green innovation. Furthermore, it is essential to enhance the cultural atmosphere of green innovation and improve relevant management systems, thereby reinforcing the intrinsic driving force behind green innovation, and transforming the “accidental” output of patents into “inevitable” outcomes. Regarding the stage of green outcomes transformation, it is important to strengthen the connection with the previous stage, accelerate the process of patent technology industrialization, and facilitate the flow of green patent licenses between high-quality domestic enterprises and medium-to-low-quality enterprises. Concurrently, efforts should be made to encourage the application and promotion of green technologies and products, thereby strengthening the proactive engagement of market entities in green innovation.
(2) Adopting targeted and differentiated policy measures according to local conditions. There are differences in the technological foundations of green innovation across different regions, and the impact of exogenous factors on the efficiency of green innovation varies. It is crucial to fully leverage the government’s role in guiding, coordinating, regulating, and supporting activities. In regions with a strong foundation, on the one hand, independent innovation should be encouraged to ensure the driving force of their first-mover advantage. Concurrently, efforts should be made to advance the role of digital technology and industrial internet initiatives in driving green innovation, while emphasizing the efficient conversion of green technological achievements. These two processes should mutually reinforce each other, collectively promoting the healthy development of the green innovation cycle. Measures such as establishing special funds for green innovation can be implemented to enhance the leading role of key regions, key sectors, and key enterprises in green innovation. Conversely, for regions with weaker innovation environments, it is possible to address the deficiencies by employing policy preferences and financial support. By employing measures such as government subsidies and establishing guarantee funds, targeted policy support can be provided to attract talent, carry out scientific and technological research projects, and facilitate technology transfer. These approaches encourage the development of local technological advantages based on local conditions, and narrowing the technological gap.
(3) Fully utilizing spillover effects and enhancing regional synergy in green innovation. The positive spatial correlation in regions green innovation has been increasing year by year, with the influence of adjacent provinces on the level of green innovation becoming more evident. This can be achieved by establishing platforms for exchange and collaboration through industry associations and technical exchange forums, thereby creating spatial linkages and mutually beneficial sharing mechanisms for regional green innovation activities. At the same time, it is important to avoid inefficient clustering of green innovation in specific regions by breaking the path dependency through nurturing internal strengths in industries and regions. For regions characterized by “high-low” polarization and “low-high” hollow types, it is important to encourage the driving behavior of advantaged regions, and promote the proactive acceptance of spillover effects from neighboring areas by disadvantaged regions. By capitalizing on the diffusion effect of efficient provinces and the learning and catch-up effect of less efficient provinces, the positive impact of spillover effects can be fully utilized, thereby achieving regional synergy in green innovation.
(4) Leveraging multiple advantages and continuously optimizing the green innovation environment. Various resources should be mobilized to form a collaborative force driven by innovation, aiming to achieve high-quality green development. Governments need to coordinate the use of regulatory approaches, such as command and control, market incentives, and voluntary participation, based on the actual conditions of regions and enterprises. They should also coordinate other resources and policies, such as energy consumption, green finance, innovation guidance and incentives, and intellectual property protection, to promote compensatory and incentive effects of environmental regulations on green innovation, while reducing the inhibitory effects of cost crowding-out on green innovation. Efforts should be made to reduce inefficient and duplicative investments and concentrate the advantages of economic development on enhancing public environmental awareness and increasing high-quality intellectual capital, thus stimulating green innovation from the demand side. Additionally, attention should be paid to the introduction and regulation of external capital while strictly guarding against the occurrence of “pollution havens” phenomenon. Lastly, it is necessary to accelerate the reform of state-owned enterprises towards a shareholder system, simultaneously fulfilling social responsibilities and stimulating the vitality of green innovation while addressing the issue of overcapacity.
Data availability statement
The original contributions presented in the study are included in the article/supplementary material, further inquiries can be directed to the corresponding author.
Author contributions
YH and SQ created the study’s research design and theoretical model. YH examined and analyzed the data, completed the manuscript. SQ and FH revised and directed the writing of the paper. The publication was accepted by three authors. All authors contributed to the article and approved the submitted version.
Funding
This research was supported by General Project of Philosophy and Social Sciences in Guangdong Province “Carbon sinks in the offshore areas of Guangdong: spatiotemporal evolution, impact effects, and amplification strategies” (GD22CYJ08); Lingnan Normal University talent project “Research on dynamic core competence emergence of high-endequipment manufacturing enterprises based on organizational innovation” (ZW 2024).
Conflict of interest
The authors declare that the research was conducted in the absence of any commercial or financial relationships that could be construed as a potential conflict of interest.
Publisher’s note
All claims expressed in this article are solely those of the authors and do not necessarily represent those of their affiliated organizations, or those of the publisher, the editors and the reviewers. Any product that may be evaluated in this article, or claim that may be made by its manufacturer, is not guaranteed or endorsed by the publisher.
Abbreviations
GIECI, Green Innovation Environment Composite Index; GTRD, Green Technology Research and Development; GAT, Green Achievement Transformation; TGR, Technology Gap Ratio.
References
Ahmed, E. M. (2012). Are the FDI inflow spillover effects on Malaysia’s economic growth input driven? Econ. Model 29 (4), 1498–1504. doi:10.1016/j.econmod.2012.04.010
Amirteimoori, H., Amirteimoori, A., and Karbasian, M. (2020). Performance measurement of gas companies with fixed-sum inputs: a DEA-based model. J. Econ. Stud. 47 (7), 1591–1603. doi:10.1108/jes-06-2019-0285
Battese, G. E., O´Donnell, C. J., and Rao, D. S. P. (2004). A metafrontier production function for estimation of technical efficiencies and technology gaps for firms operating under different technologies. J. Prod. Analysis 21 (1), 91–103. doi:10.1023/b:prod.0000012454.06094.29
Battese, G. E., and Rao, D. S. P. (2002). Technology Gap,Efficiency and a stochastic metafrontier function. Int. J. Bus. Econ. 1 (2), 87–93. http://espace.library.uq.edu.au/view/UQ:170794
Du, L., Zhao, Y., Tao, K., and Lin, W. (2019). Compound effects of environmental regulation and governance transformation in enhancing green competitiveness. Econ. Res. J. 54 (10), 106–120. dehttps://kns.cnki.net/kcms/detail/11.1081.f.20191016.1644.028.html
Färe, R., and Grosskopf, S. (2000). Network DEA. Socio-Economic Plan. Sci. 34 (1), 35–49. doi:10.1016/s0038-0121(99)00012-9
Fu, Q., and Ma, Y. (2011). Double-efficiency research of technological innovation of high-tech industry in China based on value chain. Sci. Sci. Manag. S T 32 (08), 93–97. https://d.wanfangdata.com.cn/periodical/kxxykxjsgl201108015
Hansen, M. T., and Birkinshaw, J. (2007). The innovation value chain. Harv. Bus. Rev. 85 (6), 121–130, 142. https://pubmed.ncbi.nlm.nih.gov/17580654/
He, F., Ma, D., and Zhu, L. (2016). Measurement and factors of environmental technology efficiency in China under the constraint of haze: provincial panel data based on the SBM-Undesirable model. R D Manag. 28 (05), 34–43. doi:10.13581/j.cnki.rdm.20160906.004
Li, B., and Wu, S. (2017). Effects of local and civil environmental regulation on green total factor productivity in China: a spatial durbin econometric analysis. J. Clean. Prod. 153, 342–353. doi:10.1016/j.jclepro.2016.10.042
Li, J., and Du, Y. (2021). Spatial effect of environmental regulation on green innovation efficiency—evidence from prefectural-level cities in China. J. Clean. Prod. 286, 125032. doi:10.1016/j.jclepro.2020.125032
Li, Y., Dang, X., Han, X., and Song, W. (2014). The study on heterogeneity effect of environmental regulation’s long-term & short-term influence on technology innovation—Two stages analysis based on value chain perspective. Stud. Sci. Sci. 32 (06), 937–949. doi:10.16192/j.cnki.1003-2053.2014.06.015
Liu, B., Wang, J., Li, R. Y. M., Peng, L., and Mi, L. (2022). Achieving carbon neutrality – the role of heterogeneous environmental regulations on urban green innovation. Front. Ecol. Evol. 10, 923354. doi:10.3389/fevo.2022.923354
Lozano, S. (2015). Alternative SBM model for network DEA. Comput. Industrial Eng. 82, 33–40. doi:10.1016/j.cie.2015.01.008
Malmquist, S. (1953). Index numbers and indifference surfaces. Trab. Estad. 4 (2), 209–242. doi:10.1007/bf03006863
Mao, J., Yu, Z., Wang, Y., Wang, L., and Wang, M. (2023). Spatial convergence and influencing factors of green total factor productivity of China’s urban agglomerations. Front. Environ. Sci. 11, 1138396. doi:10.3389/fenvs.2023.1138396
Oden, N. (1995). Adjusting Moran’s I for population density. Statistics Med. 14 (1), 17–26. doi:10.1002/sim.4780140104
O’Donnell, C. J., Rao, D. S. P., and Battese, G. E. (2008). Metafrontier frameworks for the study of firm-level efficiencies and technology ratios. Empir. Econ. 34 (2), 231–255. doi:10.1007/s00181-007-0119-4
Oh, D. (2010). A global Malmquist-Luenberger productivity index. J. Prod. Analysis 34 (3), 183–197. doi:10.1007/s11123-010-0178-y
Peng, X. (2020). Strategic interaction of environmental regulation and green productivity growth in China: green innovation or pollution refuge? Sci. Total Environ. 732, 139200. doi:10.1016/j.scitotenv.2020.139200
Porter, M. E., and Linde, C. (1995). Toward a new conception of the environment-competitiveness relationship. J. Econ. Perspect. 9 (4), 97–118. doi:10.1257/jep.9.4.97
Qian, X., Wang, D., Wang, J., and Chen, S. (2021). Resource curse, environmental regulation and transformation of coal-mining cities in China. Resour. Policy 74, 101447. doi:10.1016/j.resourpol.2019.101447
Rey, S. J., and Janikas, M. V. (2006). Stars: space-time analysis of regional systems. Geogr. Anal. 38 (1), 67–86. doi:10.1111/j.0016-7363.2005.00675.x
Shao, S., Fan, M., and Yang, L. (2022). Economic restructuring, green technical progress, and low-carbon transition development in China: an empirical investigation based on the overall technology frontier and spatial spillover effect. J. Manag. World 38 (02), 46–69+4–10. https://kns.cnki.net/kcms2/article/abstract?v=3uoqIhG8C44YLTlOAiTRKibYlV5Vjs7iJTKGjg9uTdeTsOI_ra5_XTmxs1aAVspAwgy5Rejf7JIYKa5cVEa1Xrpu1hlRY4cXanduniplatform=NZKPTandsrc=copy
Shao, S., Yang, Z., Yang, L., and Ma, S. (2019). Can China’s energy intensity constraint policy promote total factor energy efficiency? Evidence from the industrial sector. Energy J. 40 (4). doi:10.5547/01956574.40.4.ssha
Su, S., and Zhang, F. (2020). Modeling the role of environmental regulations in regional green economy efficiency of China: empirical evidence from super efficiency DEA-Tobit model. J. Environ. Manag. 261, 110227. doi:10.1016/j.jenvman.2020.110227
Tang, J., Wang, Q., and Chang, Y. T. (2020). China’s regional industrial two-stage system – efficiencies and their influencing factors. J. Clean. Prod. 249, 119420. doi:10.1016/j.jclepro.2019.119420
Tone, K. (2002). A slacks-based measure of super-efficiency in data envelopment analysis. Eur. J. Operational Res. 143 (1), 32–41. doi:10.1016/s0377-2217(01)00324-1
Tone, K., and Tsutsui, M. (2009). Network DEA: a slacks-based measure approach. Eur. J. Operational Res. 197 (1), 243–252. doi:10.1016/j.ejor.2008.05.027
Wang, Q., Tang, J., and Choi, G. (2021). a two-stage eco-efficiency evaluation of China’s industrial sectors: A dynamic network data envelopment analysis (dndea) approach. Process Saf. Environ. Prot. 148, 879–892. doi:10.1016/j.psep.2021.02.005
Wu, H., Xu, L., Ren, S., Hao, Y., and Yan, G. (2020). How do energy consumption and environmental regulation affect carbon emissions in China? Resour. Policy 67, 101678. doi:10.1016/j.resourpol.2020.101678
Xia, J., Zhan, X., Li, R. Y. M., and Song, L. (2023). The relationship between fiscal decentralization and China’s low carbon environmental governance performance: the malmquist index, an SBM-DEA and systematic GMM approaches. Front. Environ. Sci. 10, 945922. doi:10.3389/fenvs.2022.945922
Xie, R., Yuan, Y., and Huang, J. (2017). Different types of environmental regulations and heterogeneous influence on “green” productivity: evidence from China. Ecol. Econ. 132, 104–112. doi:10.1016/j.ecolecon.2016.10.019
Yang, G., Zhang, J., and Zhang, J. (2023). Can central and local forces promote green innovation of heavily polluting enterprises? Evidence from China. Front. Energy Res. 11, 1194543. doi:10.3389/fenrg.2023.1194543
Yu, Y. (2009). Based on the two-phase innovation value chain of China’s high technology industry technology innovation efficiency and its influencing factors. Econ. Sci. 04, 62–74. doi:10.19523/j.jjkx.2009.04.006
Yuan, B., and Zhang, Y. (2020). Flexible environmental policy, technological innovation and sustainable development of China’s industry: the moderating effect of environment regulatory enforcement. J. Clean. Prod. 243, 118543. doi:10.1016/j.jclepro.2019.118543
Zha, Y., Liang, L., and Xu, C. (2008). Two-stage BCC model for cooperative efficiency evaluation using a geometric mean method. Syst. Eng. Theory Pract. 28 (10), 53–58. doi:10.1016/s1874-8651(10)60001-4
Zhang, C., and Wang, Z. (2022). Analysis of spatiotemporal difference and driving factors of green total factor energy efficiency in RCEP members: insights from SBM-GML and Tobit models. Environ. Sci. Pollut. Res. 30 (6), 15623–15640. doi:10.1007/s11356-022-23270-8
Zhang, J., Liu, X., Zhang, X., Chang, Y., Wang, C., and Zhang, L. (2021). Enhancing the green efficiency of fundamental sectors in China’s industrial system: a spatial-temporal analysis. J. Manag. Sci. Eng. 6 (4), 393–412. doi:10.1016/j.jmse.2021.03.002
Zhang, J., Luo, Y., and Ding, X. (2022a). Can green credit policy improve the overseas investment efficiency of enterprises in China? J. Clean. Prod. 340, 130785. doi:10.1016/j.jclepro.2022.130785
Zhang, J., Wu, G., and Zhang, J. (2004). The estimation of China’s provincial capital stock: 1952—2000. Energy J. (10), 35–44.
Zhang, J., Yang, G., Ding, X., and Qin, J. (2022b). Can green bonds empower green technology innovation of enterprises? Environ. Sci. Pollut. Res. doi:10.1007/s11356-022-23192-5
Zhao, H., and Lin, B. (2020). Impact of foreign trade on energy efficiency in China’s textile industry. J. Clean. Prod. 245, 118878. doi:10.1016/j.jclepro.2019.118878
Keywords: meta-Frontier, two-stage network SBM model, green innovation efficiency, GML index, spatial correlation, Tobit regression
Citation: Han Y, Qu S and Han F (2023) Research and evaluation of spatiotemporal dynamic of network green innovation efficiency in China—based on meta-Frontier theory. Front. Environ. Sci. 11:1209883. doi: 10.3389/fenvs.2023.1209883
Received: 21 April 2023; Accepted: 31 July 2023;
Published: 14 August 2023.
Edited by:
Rita Yi Man Li, Hong Kong Shue Yan University, Hong Kong SAR, ChinaReviewed by:
Fangrong Ren, Nanjing Forestry University, ChinaJijian Zhang, Jiangsu University, China
Copyright © 2023 Han, Qu and Han. This is an open-access article distributed under the terms of the Creative Commons Attribution License (CC BY). The use, distribution or reproduction in other forums is permitted, provided the original author(s) and the copyright owner(s) are credited and that the original publication in this journal is cited, in accordance with accepted academic practice. No use, distribution or reproduction is permitted which does not comply with these terms.
*Correspondence: Shiyou Qu, qushiyou@hit.edu.cn