Integrated framework for hydrologic modelling in data-sparse watersheds and climate change impact on projected green and blue water sustainability
 I. M. Lawal
 D. Bertram
 C. J. White1
 - 1Department of Civil and Environmental Engineering, University of Strathclyde, Glasgow, United Kingdom
- 2Department of Civil Engineering, Abubakar Tafawa Balewa University Bauchi, Bauchi State, Nigeria
Climate and hydrologic hazards pose a threat to the distribution of watersheds’ water resources in time and space, necessitating planning for sustainable resilience and adaptation. Hydrologic modelling has emerged as a potential solution for understanding watershed responses to projected climate change, and a prediction model that can deliver actionable information is necessary, although it requires basin-scale observations to calibrate the model to reliably predict basin-scale water resources hazards. Such luxury is not always tenable in watersheds with inadequate ground-based observation. However, satellite-based evapotranspiration (ET) data coupled with a machine learning feature selection as a data refinement process has made integrated water balance modelling widely regarded as a viable alternative for improving the capability of watershed modelling processes in data-sparse regions. This study developed a convincing hydrologic model framework to sufficiently calibrate and provide accurate behavioural solutions for all model responses. The framework was applied to four sub-basins that form the larger Lake Chad basin. The model results were applied to assess the dynamic changes in projected blue and green water resource sustainability in response to climate change in one of the sub-basins. Study findings indicate that hydrologic fluxes can be simulated accurately with varying degrees of acceptability, with R2 and NSE values in the range of 0.69–0.88 and 0.45–0.77 for calibration and 0.69–0.79 and 0.34–0.63 for validation, respectively, and captured within a satisfactory uncertainty range of P-factor and R-factor values of 0.68–0.93 and 0.73–1.31, respectively, in 83%, 67%, 85.7%, and 81.3% of the sub-watersheds based on multi-site simulation despite distinct watershed morphology, although there are significant trade-offs in parameter sensitivity. Whilst green water is the dominant freshwater component across the basin relative to blue water, climate change may be a significant factor influencing changes in the projected green water sustainability status, and the combination of socioeconomic drivers and climate change may significantly impact the projected blue water sustainability status across the basin. Projected changes in the green and blue water sustainability status have shown that more than 50% of the watershed will become ecologically fragile. In addition, the identified freshwater geographic sustainability hotspots may be beyond restoration without adequate long-term river basin water resource plans.
1 Introduction
Water resource planning must find a solution to the issue of achieving judicious and effective use of water, particularly in light of the growing population, climate change, and depleting water supplies (Novoa et al., 2019). Water is the cornerstone of community development since it provides such a wide range of ecological functions. This enables its efficient, fair, and sustainable distribution in order to eradicate poverty, promote economic development, and protect the environment (Hu et al., 2016).
The rate and amount of time required to store water in various storage reservoirs, including surface and groundwater, seas, atmosphere, snow, and ice, has been altered due to human use (Keys et al., 2016). Consequently, attaining water sustainability, which is defined as meeting everyone’s present water needs without compromising the supply in the future while advancing societal goals and preserving the environment, remains one of the greatest difficulties worldwide (Hu et al., 2016; Chouchane et al., 2018). Many administrative authorities have made the sustainable management of water resources a top priority to ensure that all residents and economic sectors have access to water sufficiently in the right quality and quantity (Martinsen et al., 2019; Tortajada et al., 2019). The sustainability of water in a basin can only be achieved if it is possible to sustain ecosystems’ hydrological, ecological, biological, and chemical processes while providing an equitable and effective water supply over time (Pfister et al., 2009; Wang et al., 2016). The water footprint (WF) concept addresses these needs by providing an assessment of water resources that accounts for natural variability and usage across sectors (Hejazi et al., 2014).
A multi-dimensional indicator called the water footprint (WF) reveals the characteristics of anthropogenic stresses on water supplies and the amount of freshwater consumed. This offers insights into water-related challenges, aids in understanding present patterns of water allocation across different river basin sectors (Muratoglu et al., 2022), and enables decision-makers to take advantage of the substantial data on water use supplied by the WF technique by improving water management, hotspot identification, and the development of appropriate responses to changes (Pellicer-Martínez and Martínez-Paz, 2018). The approach is excellent for comparing water resources across different administrative boundaries relative to their quantity and quality (Li et al., 2018).
Blue and green water are the two categories into which the freshwater cycle can be separated based on the hydrological processes and types of storage involved. Green water is the portion of precipitation that seeps into the ground and changes into soil moisture or momentarily stays on top of the ground or vegetation and, subsequently, evaporates and transpires back into the atmosphere. Blue water is the term for precipitation that accumulates in aquifers, lakes, and reservoirs and flows through or below the land surface (Rockström et al., 2009; Rodrigues et al., 2014). The consumption of both blue and green water by various sectors is included in the water footprint concept, according to Hoekstra et al. (2011). The concept indicates that the green water footprint (GWF) represents the estimated amount of green water required and used by plants (i.e., evapotranspiration (ET) from crop and pastureland), which is frequently referred to as productive vapour flows), whereas the blue water footprint represents the consumptive use of freshwater water resources from rivers, lakes, and overland flow.
Hydrologic models created for various time and spatial scales have started to become more complicated, and as a result, the use of WF as an indicator of sustainability is essential in order to determine environmental water consumption restrictions (Shrestha et al., 2017). This indicator is particularly essential in regions susceptible to water variabilities, such as basins in Mediterranean and tropical climates, where the demand for water for irrigation rises during decreased precipitation, limiting runoff and downstream flows (Novoa et al., 2019).
Previous studies have demonstrated that extreme hydrological events are rising in terms of frequency and severity due to the deepening of global climate change, creating new problems for managing water resources and the regional water cycle (Vicente-Serrano et al., 2017; Tabari, 2020). Global attention has been drawn to changes in climate patterns and their possible effects on water resources. However, there are uncertainties in future climate change estimates (e.g., changes in temperature and precipitation), which makes it difficult to decide on appropriate adaptation measures by planning authorities (Dessai and Hulme, 2007; Gosling and Arnell, 2016). The main sources of these uncertainties are changes in the initialisations and parameterisations used in climate models to explain physical processes as well as downscaling methods (Zhuang et al., 2016). It has been posited that water resources are vulnerable to these uncertainties, and it is challenging to anticipate with precision in a changing environment. Therefore, it is crucial to create water management plans in an environment that is complex and uncertain during a period of global climate change (Wang et al., 2016).
Multiple climate models have been used in an evaluation framework to find effective ways to manage basin water resources under the effects of climate change; the results showed that these plans are extremely vulnerable to climatic changes. Some conclusions drawn from other studies revealed that water resources in various regions are sensitive to climate change, and the relative influence varies significantly around the world. Accumulating evidence reveals that the sources and types of uncertainties affect the selection of adaption strategies (Dessai and Hulme, 2007; Arnell et al., 2011; Refsgaard et al., 2013; Cai et al., 2015; Tzabiras et al., 2016; Sun et al., 2017). Identification of effective corporate strategies and policy actions requires uncertainty analysis (e.g., climate adaptation, resilience, and mitigation measures). When stakeholders, decision-makers, and researchers are aware of the sources, types, and characteristics of uncertainty, their trust in scientific analysis is increased (Gabbert et al., 2010; Kirchner et al., 2021). Accounting for uncertainty is typically necessary for the scientific publishing of model-generated quantitative assessments and is regarded as excellent modeling practice (Troost et al., 2015).
Observational data are the foundation of our understanding of environmental systems, but their scarcity and unpredictability limit their study and practical applications. The accuracy of atmospheric data is crucial for the validity of hydro-meteorological and climatological investigations, among other factors (Zandler et al., 2019). The flaws in the input rainfall data utilised might be reduced or amplified by the non-linearity of hydrological modelling processes, which can lead to a good or bad depiction of the hydrological responses and, consequently, lead to inadequate water resource policy and adaptation measures (Maggioni and Massari, 2018). In order to improve the spatiotemporal process representation, distributed observational datasets must be used to inform and assess distributed hydrological models, created to enable large watershed forecasts (Baroni et al., 2019; Ocio et al., 2019). In this instance, determining whether meteorological data are adequate and coherent to accurately reproduce basin-scale hydrology is a requirement before choosing data for managing water resources (Laiti et al., 2018). Integrated modelling is useful in many areas of study on global climate change, and in this article, we define integrated modelling as an interdisciplinary technique of linking accurately curated empirical data and mathematical models that are founded on disciplinary notions to present a more thorough and precise picture of interactions between people and their environment (Moss et al., 2010; Laniak et al., 2013).
Uncertainty can manifest and build up across any chosen modelling framework, which makes it a significant problem for integrated modelling. Uncertainty is mostly dealt with in two ways using existing integrated modelling frameworks (IMFs). The first is by using scenarios to measure the uncertainty of future changes, e.g., various alternative descriptions of how the future might look are provided, which are internally consistent with projections (Reilly and Willenbockel, 2010; Mitter et al., 2019). Second, contributions from research teams of how outputs of hydrologic models are compared with observations defined based on recommended key performance indicators across the scientific community and the techniques are utilised to address uncertainty due to the application of various alternative data with designed models (Elliott et al., 2014; Folberth et al., 2019). The full identification and tracking of uncertainties in integrated modelling, i.e., the manner in which uncertainty spreads among climate models as applied to hydrologic modelling in data-sparse regions, has received very little attention (Holzkämper et al., 2015; Karner et al., 2019; Mitter and Schmid, 2019). Such analysis was previously acknowledged as a serious research quest in the early phases of integrated modelling, particularly for the propagation of uncertainty from land use optimisation models to the construction of hydrologic models.
In connection with this effort, numerous studies that provide a unique methodology to define and understand the various hydrologic model processes and the relationships between the various hydrological variables are important (Bierkens et al., 2015). It was also emphasised that one of the major scientific difficulties is continually refining the depiction of hydrologic model processes in the model design (Clark et al., 2015). The hydrologic community has agreed on the necessity for additional datasets along with associated signature measurements to enhance the portrayal of the key physical model processes (Clark et al., 2016). The fact that climate models still struggle to accurately replicate important climate processes is of greater concern. While precipitation estimates are widely variable, temperature projections are similar across all climate models and are thought to be more reliable, and future hydro-meteorological conditions can be uncertainly predicted because of the significant degree of variability in general circulation model (GCM) outputs.
In order to create an integrated modelling framework, it is often necessary to work on individual model modifications, model connections that are improved, and the application of the integrated modelling framework to particular research issues, whose outcome can be relied upon for the basin-scale assessment of water security, sustainability, and other related applications to achieve better water policy decisions in response to projected climate change. For a meaningful comprehension of basin weather patterns and their future trends based on feature extraction by training the historical dataset using artificial intelligence to track water resource indicators, a prediction model that can deliver actionable information is necessary (Kratzert et al., 2018; Ali et al., 2020). In this study, we created a convincing framework or strategy to deal with the difficulties of modelling in areas with little or sparse data, appropriate ways to use alternative research datasets to evaluate models, and considerations for data uncertainty and incompatibility between models and measurements. The framework integrates a machine learning technique, Boruta random forest (BRF) optimiser, and a hydrologic model, Soil and Water Assessment Tool (SWAT), to refine the data input process mechanism for the creation of a reliable model for basin water resource assessment. The methodology will be applied to four sub-watersheds that encompass the Lake Chad hydrologic basin in Sub-Saharan Africa, with variable morphological properties.
The objective is to provide a novel pathway to increase transparency and improve uncertainty communication of long-term water balance models in an easily understood way without compromising scientific accuracy in data-sparse watersheds, which have not been adequately studied. This idea seeks to be general and adaptable enough within the allowable uncertainty band to permit its use in other basins with comparable modelling problems. Finally, the integrated model framework will provide a crucial link between hydrology and human activities at local watershed levels to assess and monitor the implications and dynamic changes from baseline, the projected blue and green water resources and their sustainability, in response to changes in climate at annual and monthly timescales in the Yobe-Komadugu sub-watershed.
2 Case study area and data
2.1 Case study area
The Lake Chad basin, with an estimated area of over 2,500,000 km2, is one of the largest endorheic basins in the world (Coe and Foley, 2001; Gao et al., 2011). It is located between the Sahara and the Sudano-Sahelian areas of West Africa, between latitudes of 5.2⁰–25.3⁰ N and longitudes of 6.9⁰–24.5⁰ E (Figure 1). The basin receives the majority of its annual rainfall between July and September. The region is renowned for being particularly susceptible to climate change, which frequently results in severe drought and water shortage circumstances (Ndehedehe et al., 2018), and the lake is a freshwater source for livestock grazing, fish farming, and other socioeconomic activities (Buma et al., 2016). The major contributors of discharge to the lake are the Chari River (∼90%), with an annual streamflow of 860 m3/s between 1960 and 2013, and the Yobe River (∼2–5%), with an annual streamflow of 18 m3/s between 1961 and 2013 (Lemoalle, 2014). Other rivers that contribute supplies of between 1% and 2% are Gubio, Yedseram, Ngadda, and El-Beid. However, there are a few rivers like the Batha River and other rivers situated in the Saharan zone that do not have an outlet to Lake Chad (Figure 1). The precipitation in the basin varies geographically and seasonally between <100 and 1,500 mm/yr (Nkiaka et al., 2018).
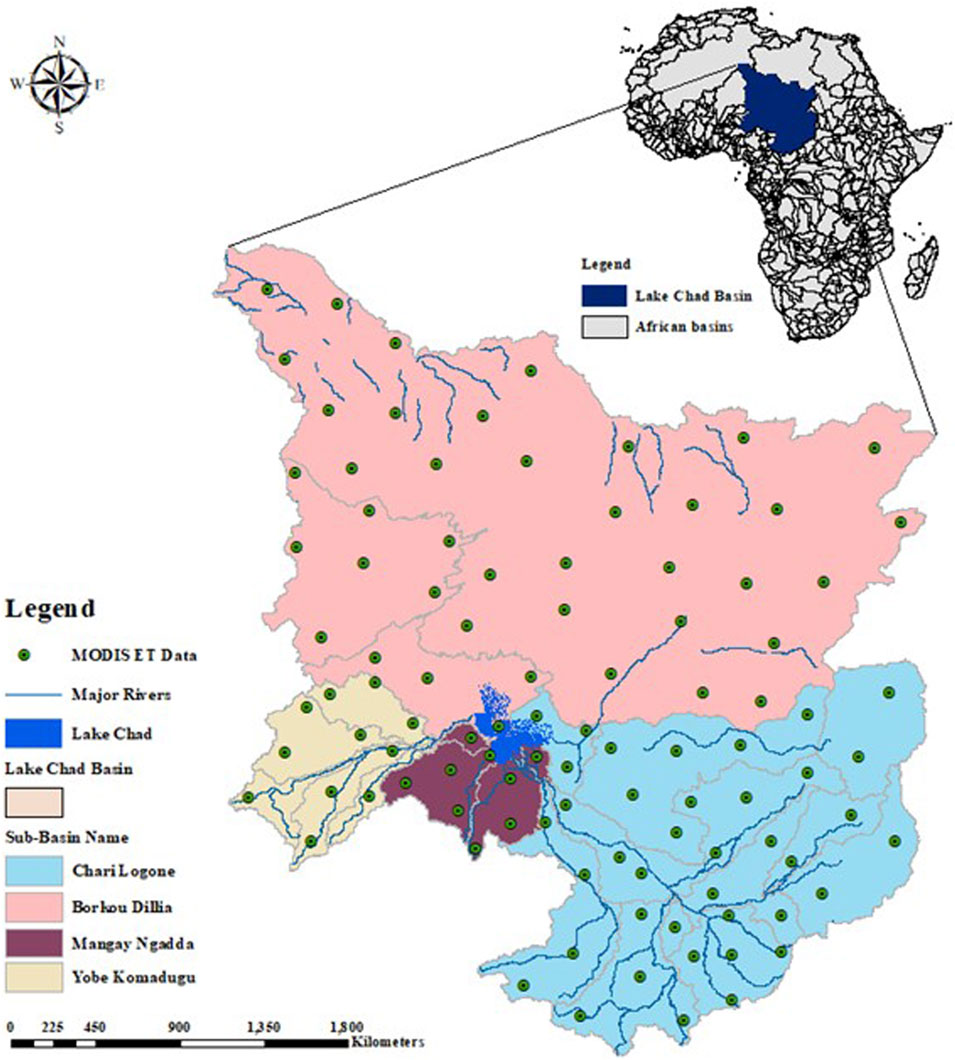
FIGURE 1. Lake Chad basin showing sub-basins, lake, major river networks, and MODIS Evapotranspiration (ET) data points.
2.2 Dataset description
2.2.1 MODIS evapotranspiration
The state of observed streamflow data is quite poor and inadequate, with many missing data points, which undermines the confidence in the output of hydrologic modelling results temporally and spatially in the entire basin. Alternatively, the availability of high spatial variability of satellite-derived land surface MODIS-NASA Evapotranspiration data at a monthly timescale was extracted by overlaying the 1.0 × 1.0 grids with the basin map. A total of 100 observation points (Figure 1) were generated and aggregated to develop 59 simulation sub-basin points across the entire watershed, as recommended by Abbaspour et al. (2019), and the data were divided into 1983–1998 for calibration and 1999–2006 for validation of the models. A more accurate hydrologic model simulation may be obtained by taking into account the geographical distribution of the AET throughout the watershed. The MODIS-NASA ET data also takes into account factors like plant transpiration and the evaporation of soil moisture (Autovino et al., 2016).
2.2.2 Digital elevation model and soil, land use, and land cover data
The watershed was delineated using the ArcSWAT program in the ArcMap 10.8 environment using the topography information from the basin that was collected from the ASTER Global Digital Elevation Model version 3, with a spatial resolution of 30 m. The soil data were obtained from the Harmonized World Soil Database (HWSD) (Table 1), with a 1 km resolution, founded by the Food and Agricultural Organization (FAO) and notable research centres (Abbaspour et al., 2019). Land use and land cover data were obtained from the European Space Agency (Table 1), which was an initiative that was developed from global composite land cover maps using observations from the 300-m MERIS sensor onboard the ENVISAT satellite mission. The GlobeCover map contains 23 land cover types (Bontemps et al., 2011). The description, resolution, and data source are shown in Table 1, and the links to the source can be found in Abbaspour et al. (2019).
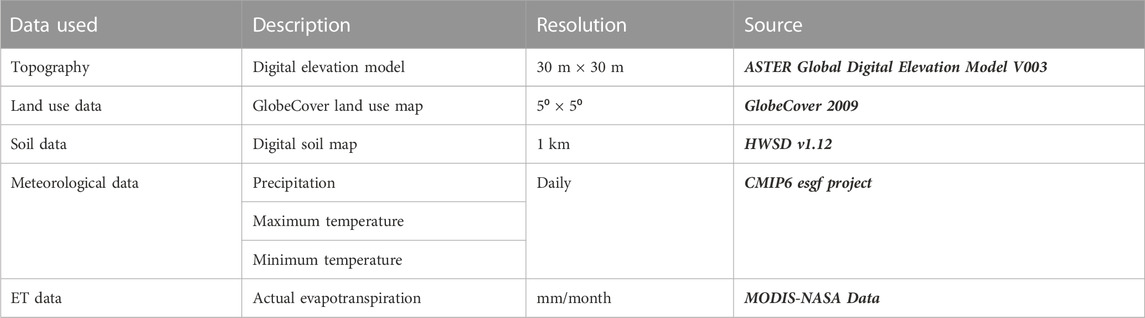
TABLE 1. Input data required for hydrologic model development.
2.2.3 Climate data
The gridded precipitation and temperature data used here were recommended from a previous study by Lawal et al. (2021) at a daily time-step between 1979 and 2011 and were extracted at a 1° × 1° grid resolution for the pre-processing of general circulation models for baseline (1979–2011) and projected (2021–2080) climate change scenario data considering two shared socioeconomic pathways based on carbon dioxide emission scenarios SSP2(4.5) and SSP5(8.5), supported by the World Climate Research Programme in the ESGF database, and the data are available and can be extracted from the source provided in Table 1.
3 Research methodology
3.1 Pre-processing of input data
The dataset required for the integrated model framework needs to be checked and prepared to fit the model specifications for efficient and accurate output of the model hydrologic variables. The primary input data required are pre-processed to depict the status of the watershed land management and vegetation properties.
3.1.1 Climate models, downscaling, and bias correction
The general circulation models (GCMs) used in this assessment were the ensemble of four (MPI-ESM1.2-LR, INM-CM4.8, MRI-ESM2.0, and INM-CM5.0) Coupled Model Intercomparison Project Phase 6 (CMIP6) models and were extracted at 210 data points (Figure 2A) for the historical (1979–2011) and projected climate change scenarios (2021–2080) for two shared socioeconomic pathways (SSP4.5 and SSP8.5) corresponding to total radiative forcings of 4.5 and 8.5 W/m2 (approximately equal to mean CO2 emission concentrations of 650 and 1,370 ppm), respectively, in 2100. Before predicting the future climate, it was necessary to modify the climate model’s outputs because they contain biases. The delta and quantile mapping methods were used to downscale and correct the known biases in the precipitation and temperature data, respectively, based on a study conducted in the basin using CPC and PGF gridded data in line with study requirements (Lawal et al., 2023). The methods are non-parametric and corrected the predicted climate data based on point-wise empirical cumulative distribution functions. The downscaling strategies were found to significantly improve the forms of the linked frequency distributions and minimise systematic biases and indices of extreme events by approximately one order of magnitude (Themeßl et al., 2012).
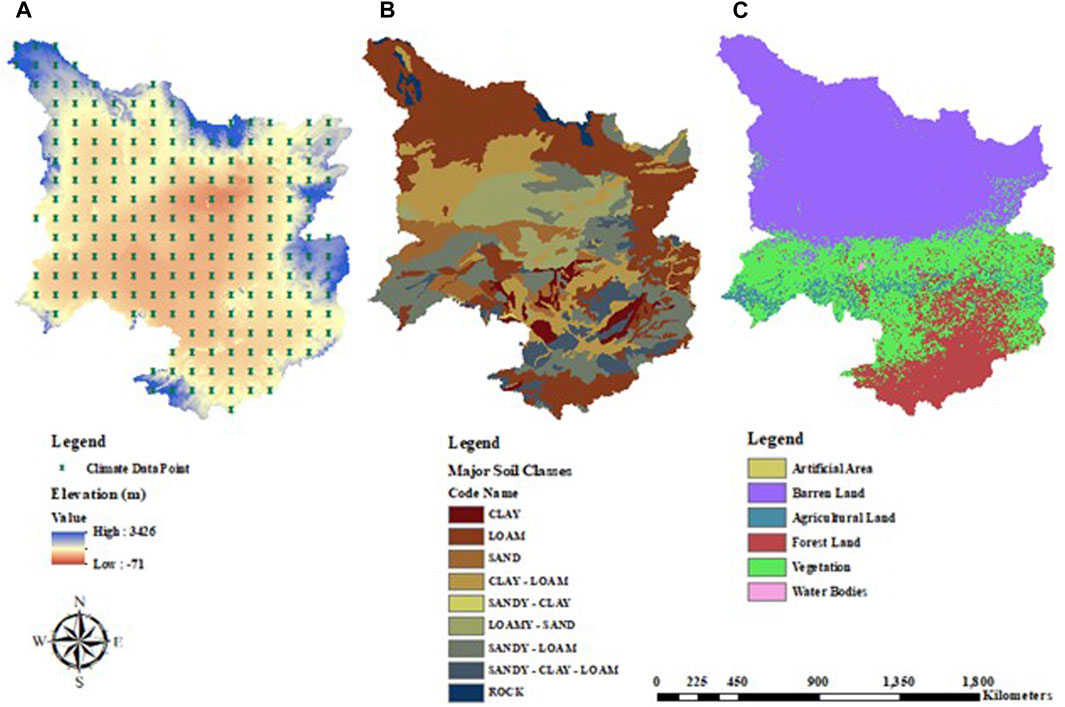
FIGURE 2. Description of morphological data in the study: (A) digital elevation model and meteorological points, (B) soil types, and (C) land use and cover data.
3.1.2 Land use, soil, and DEM data
The soil characteristics for the entire watershed were extracted from the world HWSD dataset and include two soil profiles (0–30 cm and 30–100 cm depths), the available water capacity, and the bulk density, along with the majority of the soil information needed for the SWAT model. The majority of the primary soil classifications include clay, loam, sand, clay–loam, sandy-clay, loamy-sand, sandy-loam, sandy-clay-loam, and rock that make up the watershed (Figure 2B). The watershed’s land use and land cover data were extracted to match the sub-watershed extent and categorised into six different land uses that work with the SWAT model (Figure 2C), including artificial area (URMD) 0.013%, barren land (BARR) 52.873%, agricultural land (AGRL) 3.743%, forest land (FRST) 15.636%, vegetation (PAST) 27.842%, and water bodies (WATR) 0.166%. In order to extract the topographic features of the terrain, which are a necessity for hydrological research, basin elevation information is crucial. The 30 m spatial resolution digital elevation model (DEM) was extracted (Figure 2A) and transformed into a Universal Transverse Mercator system of coordinate representation to aid the delineation of the watershed boundary.
3.2 Integrated modelling framework
We combined a machine learning optimiser (BRF) and SWAT model to refine the input process of the baseline and projected climate data to reduce input uncertainties in the modelling process (i.e., technical uncertainties) to enhance the simulation process and improve the confidence in the modelling output for the reliable assessment of basin-scale hydrologic features. This approach is necessary to further lower the danger of misinterpreting climate signals and improve adaptation assessments. Our goal is to create an integrated modelling framework that satisfies these criteria for evaluating the effects of anticipated regional water balance changes brought on by climate-projected scenarios on the sustainability of green and blue water in data-sparse regions under uncertainty. The two integrated processes are discussed briefly in the following sub-section, and the schematic overview is shown in Figure 3.
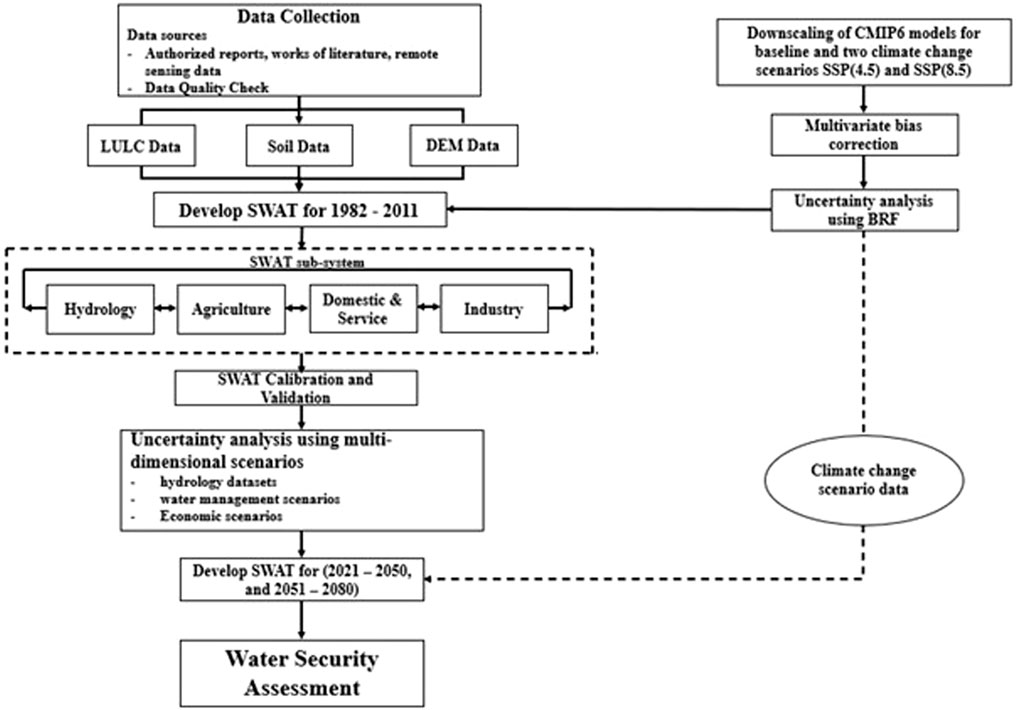
FIGURE 3. Schematic overview of the integrated SWAT and BRF modelling framework (IMF) for reliable water balance modelling in data-sparse regions.
3.2.1 Boruta random forest optimizer
The Boruta feature selection method was created as a wrapper for the random forest algorithm, which is used to identify important features of the predictors. Every input predictor’s Z-score distribution relative to the shadow property is calculated. The distribution of the Z-score metrics establishes the key components of the predictors (Kursa and Rudnicki, 2010). It involves developing a stepwise model using a minimal-optimal feature selection technique that rates the salient features of the model and the residual according to the optimization-determined factors (Kursa, 2016). It is an effective feature selection technique that makes it easier to categorize high-dimensional data. Information gain is used to gauge each feature’s contribution and establish its association using a novel extension of balanced information gain. This is very significant when analyzing a vast amount of data to achieve high generalization accuracy.
The methodology of the optimization process of the input dataset is discussed in Lawal et al. (2023). The proposed strategy is required to address potential shortcomings of the conventional modelling methodologies, such as their incapacity to analyze stochastic aspects, complicated variable input features, and interrelated climatic and hydrological properties that restrict the process’ ability to address crucial temporal behaviour (Adamowski et al., 2012). As demonstrated in Lawal et al. (2023), the BRF feature selection technique has been proven to retain the climatic signals by filtering out redundant downscaled GCMs that may create a dip in the capability of selected ensembles developed to accurately represent basin-scale hydrologic features like extreme events (return period of flood and drought) and their trends and magnitudes. Thus, integrating the feature extraction algorithms with SWAT modelling may provide an improved output of calibrated and validated water balance models for a reliable and accurate prediction of baseline and projected hydrologic features in data-sparse watersheds for water security assessment.
3.2.2 SWAT hydrologic model
The model is a semi-distributed and continuous time-step hydrological model known as SWAT. The model is utilised to study water quality (sediment load and nutrient flow), water quantity (streamflow, evapotranspiration, water yield, aquifer recharge, etc.), and crop growth processes in different watersheds (Veettil and Mishra, 2018; Gesualdo et al., 2019). Surface runoff in the model is generated by the use of the SCS curve number method, and ET is estimated by various approaches based on the source of the data and basin conditions, such as the Priestley–Taylor, Penman–Monteith, or Hargreaves methods. All flow variables are evaluated using the mass balance equation of the model system (Swain et al., 2020). The water balance equation conceptualises SWAT’s simulation of the hydrological processes as
where
SWAT primarily analyses each hydrologic response unit (HRU), which is a division of the sub-basin with similar groups of soil and vegetation types, to estimate the water availability at each sub-main basin’s channel for a particular time phase. To regulate the flow of water, the water is subsequently channelled to the basin exit via the river and subsurface systems. SWAT’s model optimisation process and analysis are often performed using SWAT-CUP or calibration and uncertainty programs (Abbaspour et al., 2015). The Sequential Uncertainty Fitting version 2 (SUFI-2) tool, an optimisation algorithm based on stochastic procedures within the SWAT-CUP interface, was utilised for adjusting independent parameter sets by Latin hypercube sampling (LHS). The interface used global or one-factor-at-a-time sensitivity analysis during calibration and validation. The model performance was evaluated by the statistical metrics coefficient of determination (R2) and Nash–Sutcliffe efficiency coefficient (NSE), whose equations are as follows:
where
3.3 Integrated model setup and calibration, validation, and uncertainty analysis
3.3.1 Integrated model simulation
The model was set up by importing the DEM to the ArcSWAT interface, and the watershed boundary was delineated. However, the basin was divided into four major watersheds based on the climatic zones: the Yobe-Komadugu, Magay–Ngadda, Chari–Logone, and Bodou–Dillia sub-basins (Figure 1). The main river networks and tributaries were generated based on a threshold drainage area of 3,000 km2, and all were connected to Lake Chad. The HRUs’ adjusted threshold of soil type, land use, and slope were set at 15% to fairly retain the characteristics of the land use features and slope classes of 0%–2%, 2%–8%, 8%–15%, and >15%. The catchment was discretised into 315 sub-basins, with a sub-division of 1,702 HRUs (Table 2).
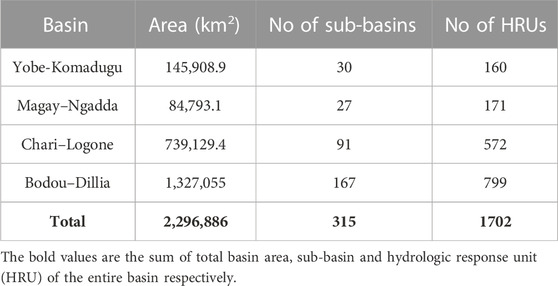
TABLE 2. SWAT model basin parametrisation.
The Boruta random forest filter was integrated to optimise the climate dataset used in this study. Initially, 16 GCM datasets at a daily time-step were parsed through the algorithms by utilising the observed gridded and GCM datasets as the target and dependent features, respectively, at the 210 grid points considered, to screen and extract the significant input features (GCMs). The optimisation process (i.e., dependent and target) features are considered to be statistically significant if the lagged values delay them. All input predictors’ Z-scores are computed by the algorithm, and the distribution defines the shadow characteristics derived from the target variable. At each grid point, an input feature is deemed important if and only if the feature importance score (Z-score) is greater than the shadow attributes generated from the target feature after 500 iterations.
The ensemble of the four best GCMs at each grid point was formed for both baseline 1979–2011 and the projected scenarios SSP2(4.5) and SSP5(8.5) at two-time slices of 2021–2050 and 2051–2080 and integrated into the hydrologic model. The optimisation process is important to screen through antecedent lagged memories within the datasets (GCM inputs) after the application of the algorithms to potentially correlate the time series arising from meteorological factors without necessarily misrepresenting the basin climate features. Owing to the lack of observation data, like wind speed, solar radiation, relative humidity, and reservoir operation data, default model values were maintained, and the influence of the reservoir was neglected. The Hargreaves temperature-based approach was set up within the model in the simulation of the evapotranspiration variable to prevent the influence of the aforementioned weather data in the ET simulation.
3.3.2 Model calibration, validation, and uncertainty analysis
The four watershed models were optimised using SUFI-2 algorithms against the observed ET data extracted at 100 points and reaggregated to form 59 test points based on the delineated watershed boundaries and with a balanced spatial distribution that covers the entire basin to increase confidence in the model output. The primary objective was to identify sensitive model parameters in the watershed that controls the basin hydrology. Preselection of sensitive parameters was performed in accordance with the recommendation by Abbaspour et al. (2017), Jiang et al. (2020), and López et al. (2017), and a one-parameter-at-a-time sensitivity analysis using five simulation runs was conducted. The observed ET data were sub-divided for calibration and validation at a point having a homogeneous representation of ET characteristics capturing wet, moderate, and dry years across the available data period. The sensitivity analysis was used to assess the statistical significance of the model parameters based on the t-stat and p-value analysed.
The uncertainty in the simulation was estimated by adjusting the model parameters determined at 97.5% and 2.5% levels of confidence. The integrated model capability was determined by the efficiency criteria in Eqs (2) and (3), and the uncertainty range was quantified by the P-factor and R-factor. The P-factor indicates the percentage of observed data enclosed within the 95PPU band, and the R-factor is the ratio of the average thickness of the 95PPU band to the standard deviation of the observed and simulated data. The optimum values of 1 and 0 indicated a perfect model. The analysis was conducted for the period 1982–1999 for calibration and 2000–2006 for validation. The model results of the calibrated and validated ET and the most sensitive parameter for each watershed are presented and explained in Section 4.
3.4 Assessment of water footprint environmental sustainability
The output of the hydrologic model was used to evaluate the impact of climate change on spatial and temporal variations in green and blue water footprint environmental sustainability of the Yobe-Komadugu watershed. The watershed is dominated by agricultural land and situated within the two-climate extreme of the basin. The sustainability index (Supporting Material) is a summary index that assesses the sustainability of water resource systems (da Cunha e Silva et al., 2022). It can be used to calculate the sustainability for water consumers and determine changes in sustainability by comparing the index among various suggested water policies (de O. Vieira and Sandoval-Solis, 2018). The sustainability index will help decision-makers to highlight policies that will maintain or enhance the basin’s desired future water management characteristics (Sandoval-Solis et al., 2011).
Geographic hotspots that lead to water resource conflict were identified by defining the environmental sustainability of blue and green water at the basin size in relation to freshwater provision levels (threshold available water for human use). To evaluate the environmental sustainability, we used a sustainability index (Supporting Material), which compared specific sub-basin WF to its corresponding water availability (WA) in terms of the water footprint concept, as demonstrated in Liu et al. (2020) based on the following equation:
Here,
3.4.1 Blue water footprint and availability assessment
Blue water is determined from the output of the modelling framework (Figure 3). Blue water is the sum of groundwater storage and water yield (WYLD), referred to as blue water flow (BWF). The water yield (WYLD) defines the threshold amount of water that leaves the HRU and enters the main channel, and groundwater storage is the difference between aquifer recharge (GW_RCHG) and the main channel flow (GW-Q) (Rodrigues et al., 2014). The basin blue water security is evaluated by the sustainability indicators in terms of the blue water footprint or water abstraction restriction based on satisfying absolute environmental demand, i.e., the concept of both abstraction (demand) and consumption (withdrawal minus return flow). The blue water footprints were referred to as water appropriated or consumed by different sectors at the river basin scale, and the spatial distribution of water uses was determined by sectoral water demand information (Table 3), 1-km gridded world population density (CIESIN) data for baseline and projected future periods consistent with the CO2 emission scenarios related to the middle of the road (SSP2) and fossil-fuelled development (SSP5) available at http://sedac.ciesin.columbia.edu/gpw (Balk et al., 2006; Jones and O’Neill, 2016), and a conservative value of 92 L/capita/day was used to quantify absolute basic water consumption for the domestic blue water footprint to meet the minimum target during stringent water restrictions (Crouch et al., 2021). This concept was adopted here and can be applied to basins where actual sectoral water demand information cannot be established or is inadequate for long-term water security assessment at the basin scale.
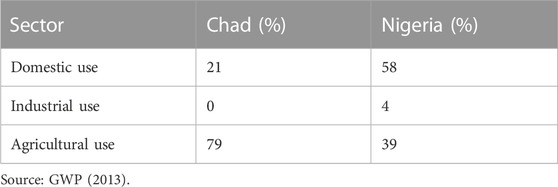
TABLE 3. Sectoral water use information in Chad and Nigeria.
The basin’s annual blue water footprint was determined based on the following equation:
where
The blue water availability was estimated as proposed in Hoekstra et al. (2011), where
where Q represents the long-term sub-basin natural runoff (streamflow) (m3/s) and EFR is the environmental flow requirement to maintain a healthy river ecosystem. In this case, EFR was estimated using the presumed standard method proposed in Richter et al. (2012), stating that 20% of the long-term mean monthly natural runoff can be made available and considered appropriate for withdrawal.
3.4.2 Green water footprint and availability assessment
Green water has two components defined as green water flow (withdrawal) and green water storage (availability). According to the HRU output of the SWAT model, the green water withdrawal represents actual evapotranspiration and is defined as the green water footprint (Rodrigues et al., 2014; Veettil and Mishra, 2016). The amount of soil moisture or green water storage (GWS) that can support crop development and soil evapotranspiration, which represents the original soil water (SW) content, is referred to as “green water availability.” It was acquired from the output of the SWAT model and applied to the water sustainability assessment (Abbaspour et al., 2015; Veettil and Mishra, 2018).
4 Results
4.1 Calibration and validation of the integrated model
The model optimisation process is quite challenging and, to a certain extent, subjective in complex hydrology, especially in a region with inadequate multi-variable observed data. We therefore aim to produce a model whose simulation reflects the natural conditions of the watershed. As a first step, we integrated the Boruta random forest feature selection approach as an interface to assess and filter out redundant downscaled GCM data across the 210 selected grid points of the entire watershed. According to Lawal et al. (2023), this procedure was required to improve and preserve the internal variability of climate data signals that may be affected by reparameterisation to utilise the right number of GCM ensembles capable of evaluating the complex interactions within hydrologic models and ensure all uncertainty (conceptual model, input data, and parameters) ranges are mapped onto and bracketed by most of the observed data within the accepted range of uncertainty (Abbaspour et al., 2007), for an accurate understanding of long-term changes in baseline and projected watershed hydrology, especially in data-sparse and climate-sensitive regions, which are not adequately studied.
The one-at-a-time sensitivity analysis adopted for the preselection of sensitive model parameters was relied on here, partly due to the use of different observed data for calibration and validation processes from previous hydrologic studies of watersheds with similar features around the world (Abbaspour et al., 2017; 2015; López et al., 2017; Jiang et al., 2020), variations in watershed features, and a homogeneous representation of the evapotranspiration characteristics capturing wet, moderate, and dry years across the available data period. The built-in sensitivity analysis tool utilised algorithms (SUFI-2) in SWAT-CUP and identified 19 parameters in the four sub-watersheds analysed, with different levels of sensitivities outlined in Table 4, and this may have alluded to the variations in land use and land cover and terrain and slope features across the watershed.
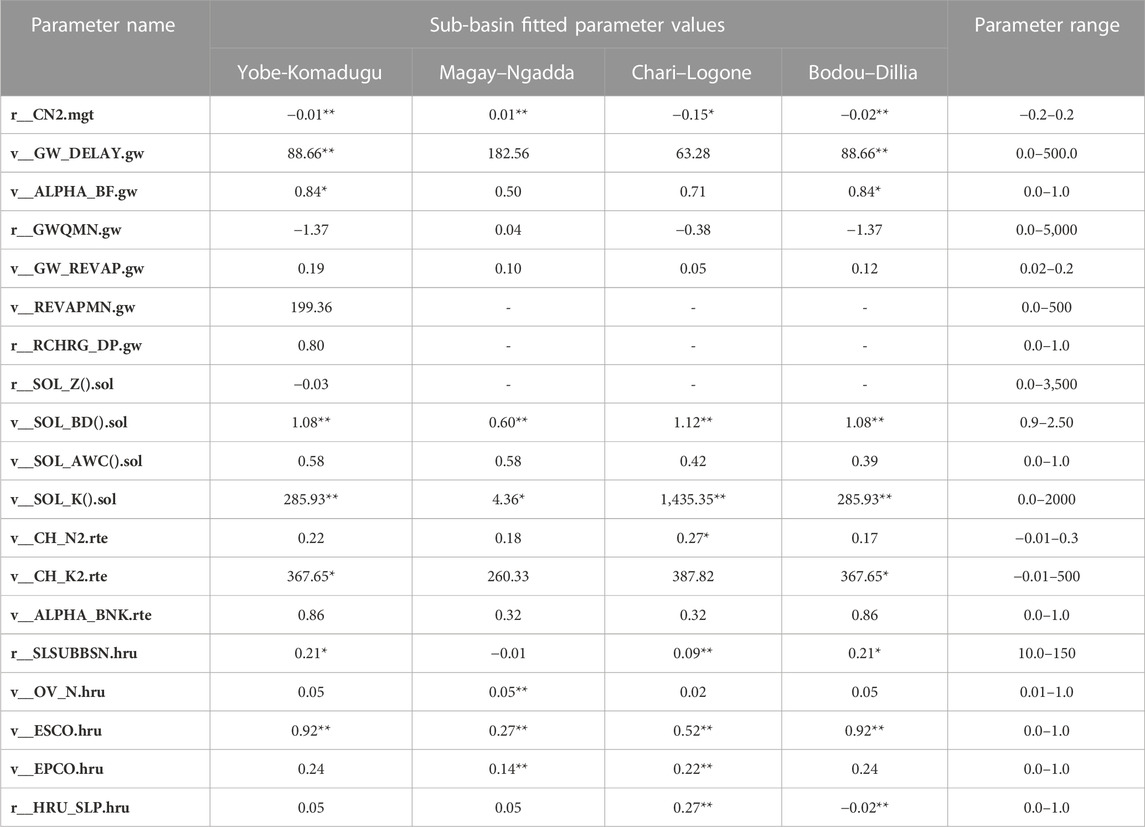
TABLE 4. Model sensitive parameters, ranges, and best-fitted values at sub-watersheds.
The result of the model global sensitivity analysis of the calibration process across the four sub-watersheds analysed indicated that the combination of the parameters rendered some less sensitive in the simulation run. Thus, we categorised the level of parameter sensitivity based on the p-value of the model run as (p-value = 0) highly sensitive (**), (0 < p-value ≤10−5) moderately sensitive (*), and (p-value > 10−5) less sensitive. The sensitivity threshold applied indicated that the SCS runoff curve number for average moisture condition (CN2.mgt), moist bulk density (SOL_BD().sol), saturated hydraulic conductivity (SOL_K().sol), and soil evaporation compensation factor (ESCO.hru) are the most important modelling parameters in the entire watershed, as shown in Table 4.
Other important sensitive parameters to note based on the sub-watershed modelling process are highlighted with a single asterisk, and they differ across the watersheds, which may be related to the distinct morphological features that change the hydrologic behaviour. However, the optimised watershed’s sensitive parameter ranges were varied, and this lack of uniqueness is a characteristic of the calibration of hydrologic models. This assertion was supported in Abbaspour et al. (2009), stating that there will be numerous such models with various parameter ranges if a model that fits the measurements exists.
The sub-watershed performance of the simulation process, as shown in Figures 4A–D, was calculated based on the observed and “best” simulated monthly actual evapotranspiration values of the objective function across the 59 measured points spatially distributed across the basin. The calibrated and validated model results depicted by the correlation coefficient (R2) and Nash–Sutcliffe efficiency (NSE) criteria were in the range of R2 = 0.69–0.88, NSE = 0.45–0.77 and R2 = 0.62–0.79, NSE = 0.34–0.63 across all the watersheds, respectively. Moreover, a large number of the achieved model results fell within a satisfactory uncertainty range, with P-factor and R-factor values in the range of 0.68–0.93 and 0.73–1.31 in 83%, 67%, 85.7%, and 81.3% of the sub-watershed, respectively. There are a few sub-basins with poor simulated output whose R2 and NSE values are as low as 0.25 and 0.14, respectively, although they exhibited a good representation of the data uncertainty band with encouraging P-factor and R-factor values in the range of 0.53–0.78 and 1.21–1.95, respectively. Even the region with better objective functions faces difficulty in simulating and matching the peak values of the observed evapotranspiration values, and this may be due to simplification of the model by reaggregation of the land use features and inadequate data that account for some of the important basin-scale processes like lack of sufficient information, such as reservoir operations, dams, water transfers, and irrigation process, and this is generally classed as technical modelling uncertainties and natural heterogeneity in the hydrologic modelling process and has been corroborated in Schuol et al. (2008) and Abbaspour et al. (2015). However, our results are generally quite realistic for the basin-scale assessment of water-related hazards.
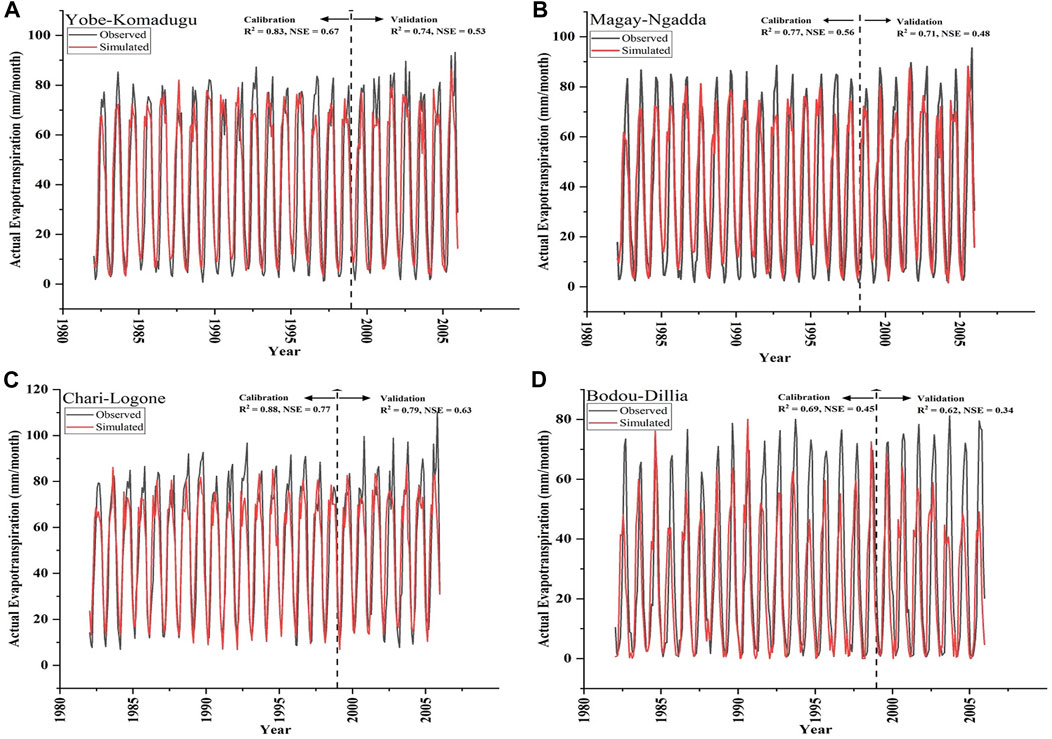
FIGURE 4. Comparison of the observed and simulated results (95% prediction uncertainty band) of actual evapotranspiration between 1983 and 2006) in the basin. (A) Yobe-Komadugu watershed, (B) Magay–Ngadda watershed, (C) Chari–Logone watershed, and (D) Bodou–Dillia Watershed.
The obvious reason for the large variability in NSE estimates across the four basins or model results could be related to the “actual evapotranspiration only” calibrations. The modelling issue can be significantly “improved” by incorporating additional observation datasets into the distributed calibration modelling schemes (Kunnath-Poovakka et al., 2016; Rajib et al., 2016), where reliable data are made available. However, Koppa et al. (2019) argued that the ability of a model to simultaneously reproduce the included water balance components is not assessed by any limits of acceptability or error thresholds in multivariate calibration.
The result presented here is a step forward and improvement to earlier studies by Faramarzi et al. (2013) and Schuol et al. (2008), using a stand-alone SWAT model with the direct use of climate data, where the results from the studies indicate a poor watershed representation of the portion of the Lake Chad basin, which depicted a large uncertainty range with a correlation value greater than 0.6 at only 38% of the calibration point and poor objective function value (NSE) of between 0 and 0.2 in the larger Lake Chad region, and this may be attributed to the use of climate data with coarse resolution and distorted signals of watershed features where the complex orographic and land–sea distribution was not accounted for and may lead to local variation in basin water balance outputs and affect projected climate change assessment studies. Our result has shown a wider spatial coverage of good P-factor and R-factor values relative to the previous study, which was reported to be 0.6 or higher at only 61% and 1.5 at only 69% of the basin area. However, there are differences in model variables and parameters adopted for calibration, and these studies are conducted on a wider scale. Interestingly, the optimisation approach used here by incorporating machine learning into the integrated modelling strategy could reduce large model uncertainty propagation and provide a new direction to modelling issues in data-sparse regions with variable morphological features by providing high-valued water resource information at the local basin scale to drive sustainable water policy decisions.
4.2 Assessment of climate change impact on projected green and blue water resources
The assessment of climate change impact on the spatial and temporal distribution of blue and green water resources will be of great significance at the sub-watershed level to provide the necessary information for decision support for water authorities. The confidence in the output of the model results was reinforced by investigating variations in the projected mean changes in the near future (2021–2050) and far future (2051–2080) annual precipitation and average temperature from baseline (1982–2011) of the ensemble GCM refined by the Boruta random forest feature selection approach of the Yobe-Komadugu watershed. The results of the projected changes in annual precipitation and temperature for the two scenarios based on shared socioeconomic pathways are shown in Table 5.
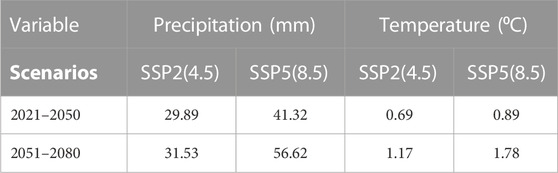
TABLE 5. Median of the projected changes in annual precipitation and temperature in the Yobe-Komadugu watershed.
The results of the projected changes in precipitation indicated an increasing trend with an annual shift of 7.1% and 7.40% in the near future to 13.25% and 27.68% in the far future, associated with the increased warming scenario of average temperature in the range of 0.69 ± 0.15°C and 0.89 ± 0.11°C between 2021 and 2050 and 1.17 ± 0.22°C and 1.78 ± 0.24°C between 2051 and 2080 for SSP2(4.5) and SSP5(8.5), respectively. The range of projection here is similar and consistent with the reported findings of previous studies (Vizy et al., 2013; Sylla et al., 2016; Almazroui et al., 2020), and the projected changes may be linked to variability and changes in West African Monsoon features, like changes in the intensity and localisation of the African easterly waves and jets, monsoon flows, and integrated moisture flux divergence (Teichmann et al., 2013; Mariotti et al., 2014; Sylla et al., 2015).
The result of the changes in spatial and temporal distributions from the baseline of projected green and blue water components under the two climate change emission scenarios SSP2(4.5) and SSP5(8.5) for the near future (2021–2050) and far future (2051–2080) periods of the Yobe-Komadugu watershed is displayed in Figures 6–11, respectively. The watershed was chosen because it is characterised by incidences of climate extremes. The most recent and notable events were the reported heavy windstorm in April 2022 and the downpour in May 2022 that affected approximately 180 communities and resulted in the loss of lives, food, buildings, livestock, and farmlands (SEMA, 2022). In addition, it is an important agriculture production region and, as a main contributor of water resources to replenish the larger Lake Chad, understanding the hydrologic variability and present and future water resource environmental footprint sustainability status at the desired watershed levels will enhance adequate river basin planning and management. The delineated watershed boundary and the sub-basins are shown in Figure 5.
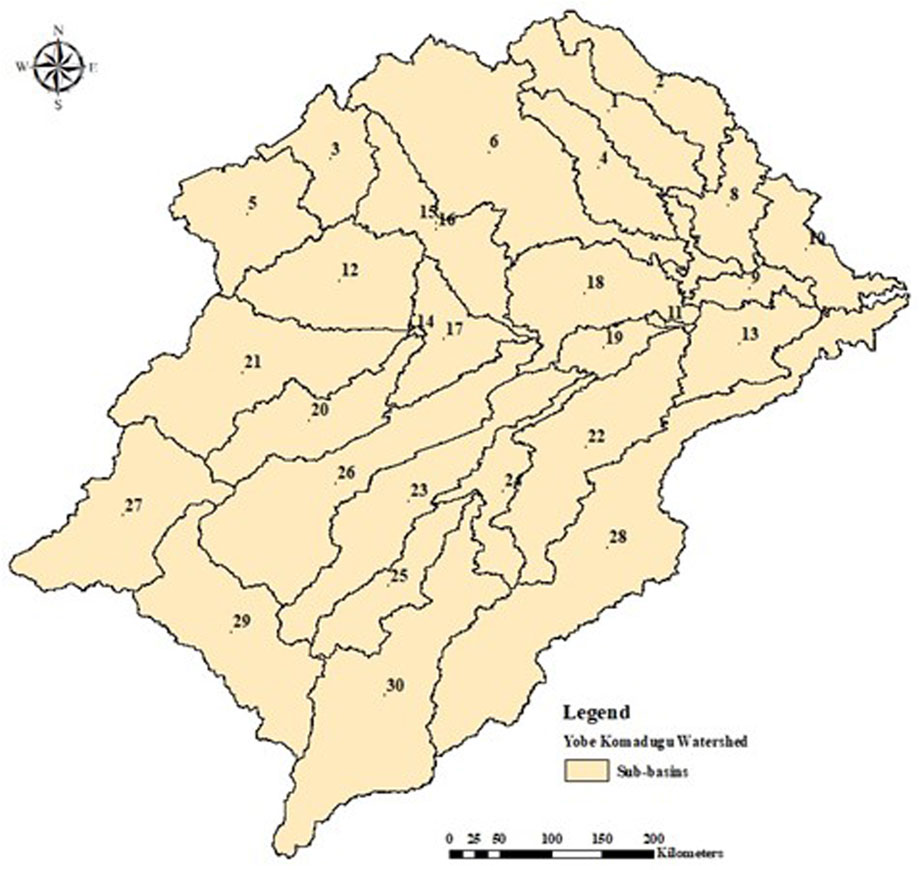
FIGURE 5. Delineated Yobe-Komadugu watershed with sub-basin locations.
4.2.1 Spatial and temporal variations in green water flow under different climate change scenarios
The hydrological cycle is expected to intensify due to increased rainfall and a warmer atmosphere, as evidenced by the projected increase in atmospheric temperature as a result of CO2 emissions, which indicates a greater evaporative demand and increases GWF, consistent with the findings of Ogutu et al. (2021), Pham-Duc et al. (2020), and Todzo et al. (2020). It is projected to increase at different levels based on the emission scenario and time slices, e.g., the baseline period (1982–2011) depicted a mean annual GWF of 393.55 mm for the entire basin, as shown in Figure 6A. Assessment of the climate change emission scenarios indicated a projected increase in the spatial changes in mean GWF of 417.02 mm and 425.03 mm for SSP2(4.5), as shown in Figures 6B,D, accounting for 6.0% and 8.0% relative to the baseline period, while a projected increase was observed in spatial changes of mean GWF of 418.75 mm and 457.86 mm for SSP5(8.5), as shown in Figures 6C,E, accounting for 6.4% and 16.34% mean increases relative to the baseline period in near and far future time slices, respectively. Few exceptions were noted with contrasting GWF hydrologic features where declining GWF was predicted, especially in the downstream (sub-basin 20, 21, and 25–30) of the watershed.
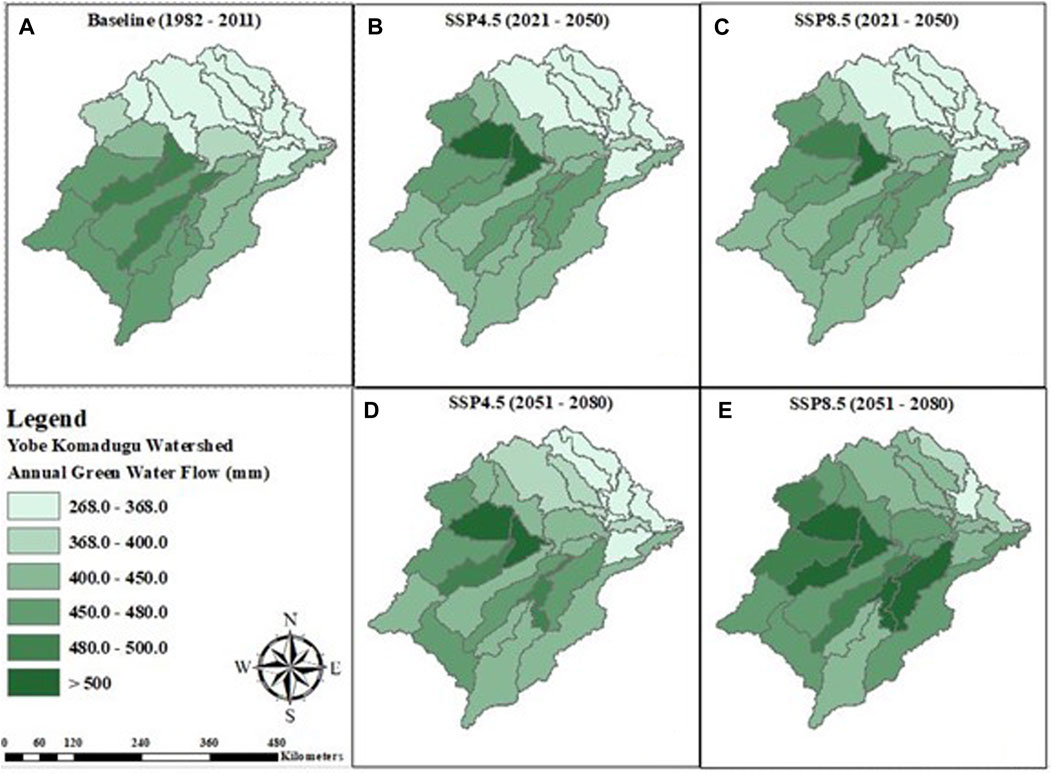
FIGURE 6. Changes in the spatial distribution of annual green water flow in the Yobe-Komadugu watershed.
Analysis of the distribution and changes in the mean monthly variation of GWF in the near (2021–2050) and far future (2051–2080) relative to the baseline (1982–2011) period, as depicted in Figure 7, showed a consistent projected increase between spring and summer months in the range of 12.95%–33.54% and 5.93%–31.02% (Figure 7A) in the near future for SSP2(4.5) and SSP5(8.5), respectively, while a projected increase in the mean monthly GWF in the range of 23.25%–65.76% and 26.39%–87.43%, as shown in Figure 7B, in the far future was estimated for SSP2(4.5) and SSP5(8.5), respectively. However, there is generally a projected sharp decline of GWF in autumn and winter seasons across the basin, projected to be approximately 53.38% and 54.10% in the near future and 54.72% and 36.0% in the far future for SSP2(4.5) and SSP5(8.5), respectively. The reason for the enhanced projected GWF may be related to the increased temperature in the tropical regions between April and September due to an increase in CO2 emission concentration. The projected increase in precipitation events also enhances vegetation cover and the activity of actual plant transpiration.
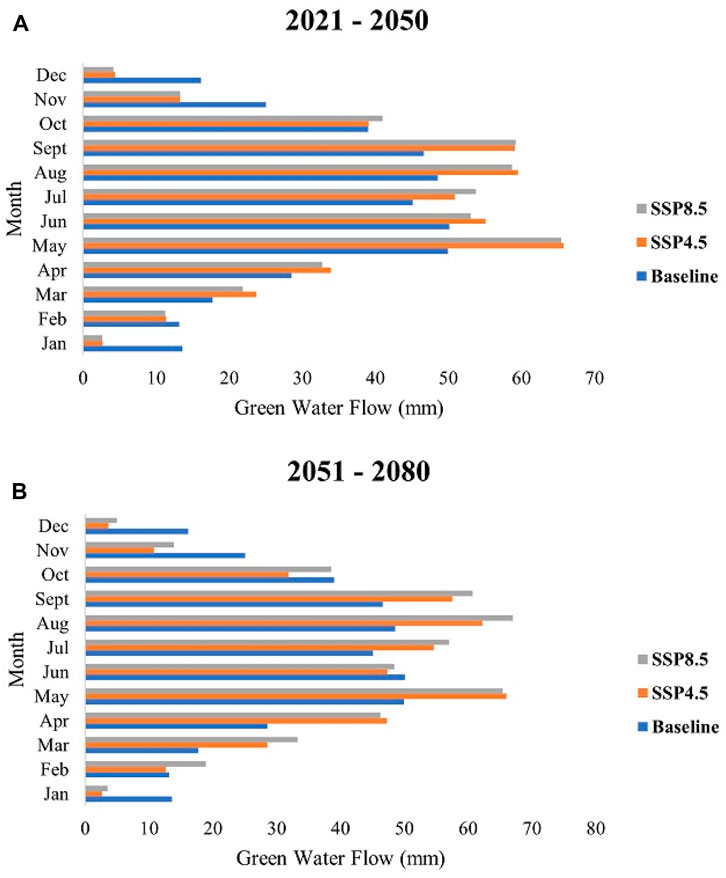
FIGURE 7. Changes in the temporal distribution of mean monthly green water flow during (A) 2021–2050 and (B) 2051–2080 in the Yobe-Komadugu watershed.
4.2.2 Spatial and temporal variations in green water storage under different climate change scenarios
The result of the mean annual GWS, represented by the soil moisture conditions, which changes over time, indicated a substantial projected decline in all sub-basins of the watershed from the baseline period, with an annual average value of 341.89–324.79 mm (Figure 8A) and 302.43 mm for SSP2(4.5), as shown in Figures 8B, D, and 299.45 mm and 293.45 mm for SSP5(8.5) in Figures 8C,E, accounting for the projected decline of 4.99% and 11.54% in basin GWS for SSP2(4.5) and 12.41% and 14.17% for SSP5(8.5) in the near and far future periods, respectively. This decline may not be unconnected to the huge overexploitation of groundwater resources for irrigation practices by further lowering the water table level in the basin, and possibly increasing surface air temperature could also affect soil water flow regimes, thereby increasing the groundwater evaporative demands.
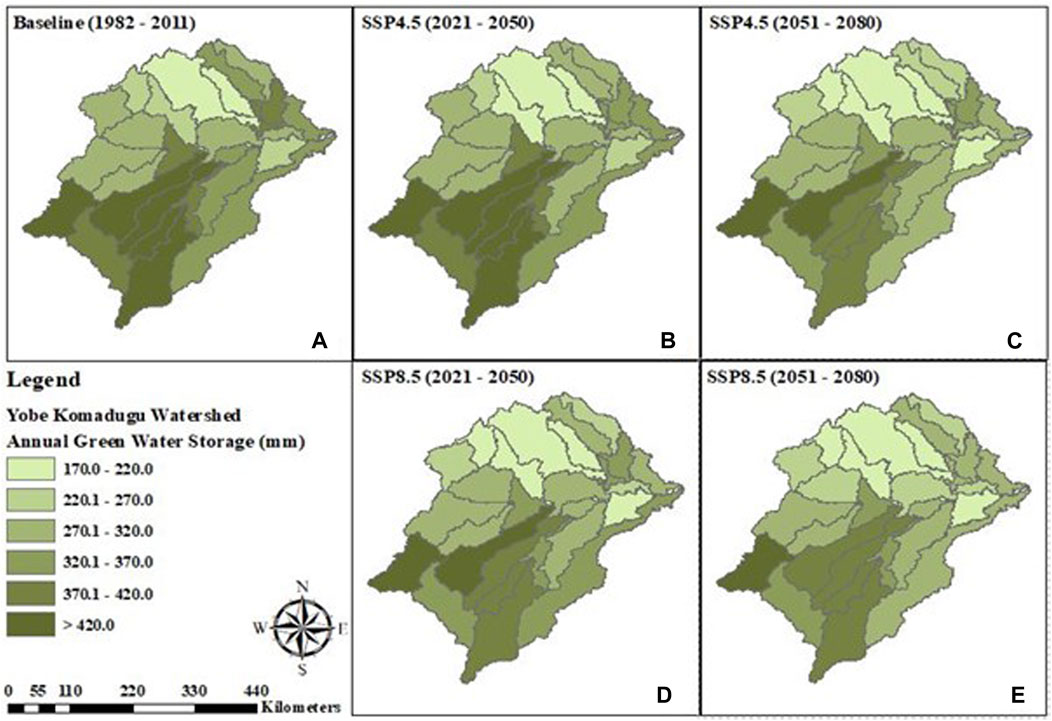
FIGURE 8. Changes in the spatial distribution of green water storage in the Yobe-Komadugu watershed.
Analysis of the distribution and changes in the mean monthly variation of GWS of the near and far future periods relative to the baseline scenario, as depicted in Figure 9, showed a consistent projected decline in most months in the range of 2.75%–44.11% at a mean rate of 6.95 mm/month and 24.97%–69.99% at a mean rate of 15.65 mm/month (Figure 9A) in 2021–2050 and 5.47%–54.45% at a mean rate of 6.28 mm/month and 26.47%–70.59% at a mean rate of 15.85 mm/month (Figure 9B) in 2051–2080 for SSP2(4.5) and SSP5(8.5), respectively. However, there is an exception in the monsoon season across the basin, with projected increases in GWS of approximately 53.28% (18.58 mm/month) and 60.02% (20.71 mm/month) in 2021–2050 and 15.87% (5.72 mm/month) and 56.83% (23.91 mm/month) in 2051–2080 based on the two emission scenarios, respectively. The projected increase in the monsoon season is generally significant between the month of July and September, which is associated with high rainfall intensities and interannual seasonal variability, as corroborated by Almazroui et al. (2020).
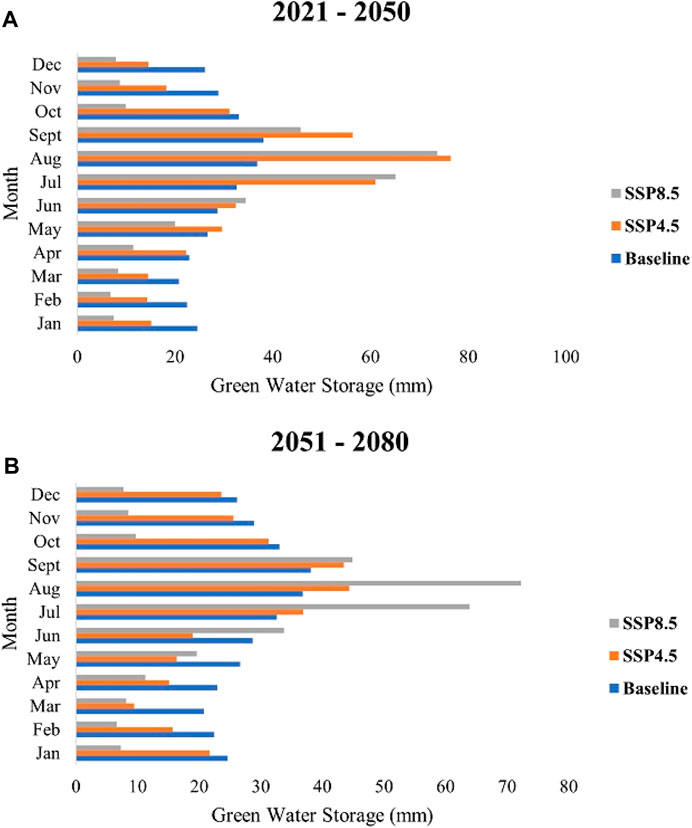
FIGURE 9. Changes in the temporal distribution of the mean monthly green water storage during (A) 2021–2050 and (B) 2051–2080 in the Yobe-Komadugu watershed.
4.2.3 Spatial and temporal variations in blue water flow in different climate change scenarios
The climate change impact on spatial and temporal variations in blue water flow was quantified at the sub-basin level in the watershed. BWF showed high variability, and the dynamics are quite distinct in the upstream and downstream parts of the watershed. For example, BWF is projected to decline at mean annual rates of 38.9 mm/year and 37.25 mm/year at the sub-basin (1–13, 15, 18, and 22) upstream, while associated projected increases of 54.66 mm/year and 55.27 mm/year at sub-basin (14, 16, 17, 19–21, and 23–30) downstream, in 2021–2050, as shown in Figures 10B,C, for SSP2(4.5) and SSP5(8.5), respectively, from the baseline period (1982–2011) depicted a mean annual BWF of 37.83 mm for the entire basin (Figure 10A). Similarly, the dynamics remain the same for the far future but with reduced magnitudes of decline from the baseline of 25.98 mm/year and 29.69 mm/year upstream and increased magnitudes of 77.23 mm/year and 98.97 mm/year downstream in 2051–2080 (Figures 10D, E) for SSP2(4.5) and SSP5(8.5) emission scenarios, respectively. However, analysis of changes in BWF in the entire watershed depicted projected increases from the baseline period of 2.85 mm/year and 4.76 mm/year in 2021–2050 and 20.21 mm/year and 52.01 mm/year in 2051–2080 for the CO2 emission scenarios, respectively.
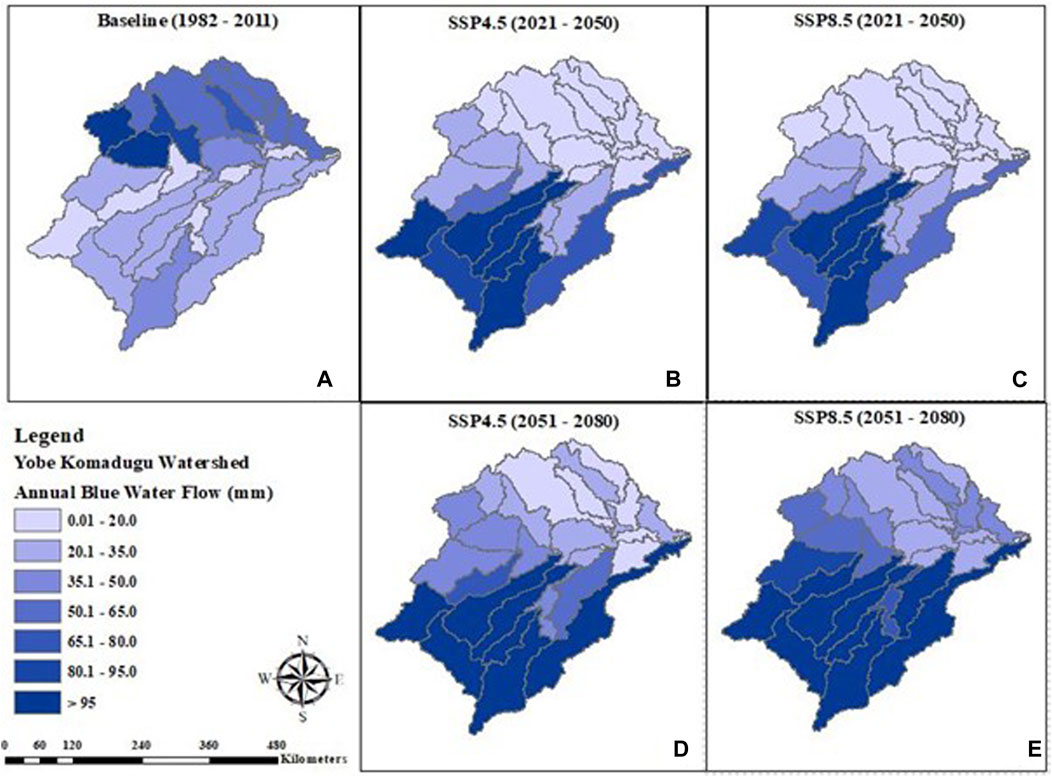
FIGURE 10. Changes in the spatial distribution of blue water flow in the Yobe-Komadugu watershed.
Analysis of the distribution and changes in the mean monthly variation in BWF of the near and far future periods relative to the baseline scenario (Figure 11) showed that the projected decline is prevalent between months in the winter and spring seasons (Figures 11A, B), where precipitation events are non-existent or sub-optimal in the tropical regions. However, the summer and autumn months showed a projected increase in BWF relative to the baseline period, which may be associated with increased monsoon rainfall events and intensities, thereby intensifying wet extremes and dry spell lengths by shortening the Sahel rainy seasons, as predicted in previous studies (Sarr, 2012; Sylla et al., 2016; Almazroui et al., 2020).
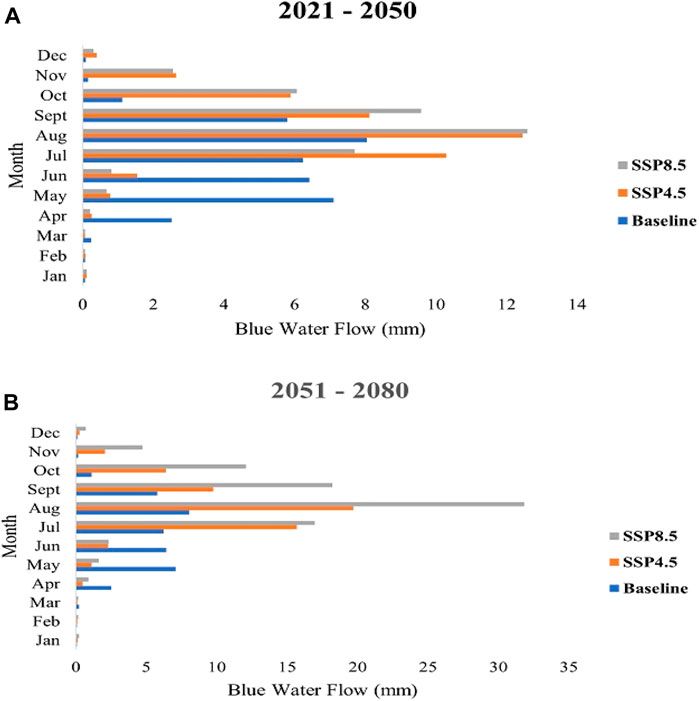
FIGURE 11. Changes in the temporal distribution of the mean monthly blue water flow during (A) 2021–2050 and (B) 2051–2080 in the Yobe-Komadugu watershed.
The projected declines oinBWF are in the range of 0.17–4.88 mm/month and 0.17–6.42 mm/month (Figure 11A) between 2021–2050 and 0.13–6.0 mm/month and 0.07–5.49 mm/month (Figure 11B) between 2051–2080 for SSP2(4.5) and SSP5(8.5), respectively. However, there is a generally sharp increase in BWF in the monsoon season across the basin, especially in August, with a projected p of up to 4.76 and 4.96 mm/month between 2021–2050 and 11.66 and 23.8 mm/month between 2051–2080 based on the two emission scenarios. These sharp changes in BWF across the months validate the significant increase in heavy rainfall events and changes in seasonality that exacerbated incidences of frequent weather extremes, i.e., flooding and droughts in the Sahel region (Boko et al., 2007; Niang et al., 2014).
4.3 Climate change impact on and socioeconomic drivers of spatial variation in projected green and blue water sustainability
Green and blue water sustainability was determined at the sub-basin scale for baseline (1982–2011) and projected changes in the near (2021–2050) and far (2051–2080) future based on the two CO2 emission scenarios using the Sustainability index, as shown by the spatial maps in Figure 12 and Figure 13, respectively. The baseline period showed that green water is moderate to extremely sustainable (ES) in seven sub-basins, accounting for 16.50% of the watershed area, with Sustainability index (SI) ranging from 0.19 to 0.3, 0.5 to 0.71, and 0.81 to 1.0 in sub-basins (10 and 27), (7 and 26), and (1, 2, and 8) (Figure 12A), respectively. The remainder of the watershed was characterized by a low level of green water sustainability, except sub-basins 3, 20, and 24, which are high-risk geographic hotspots. The favourable Sustainability index of the sub-basins located upstream of the watershed may be due to land use and land cover features, which are a mixture of scanty vegetation and bare land with associated low green water footprints as a result of little to non-existent rainfed agricultural practices.
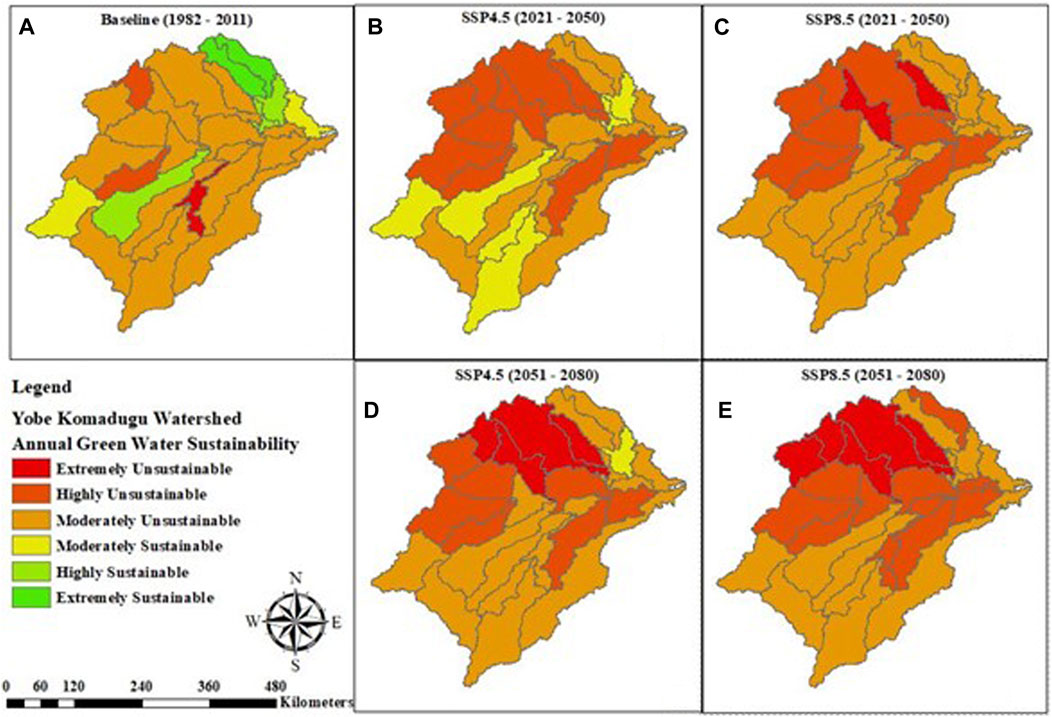
FIGURE 12. Spatial risk map of changes in baseline and projected green water environmental sustainability in the Yobe-Komadugu watershed.
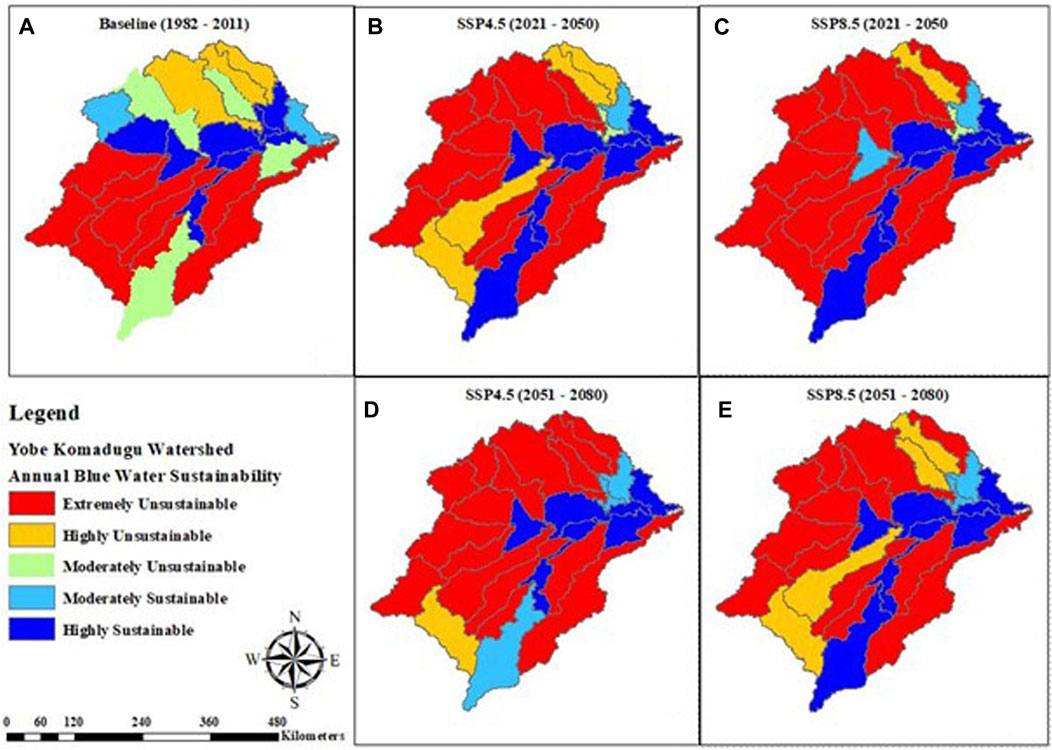
FIGURE 13. Spatial risk map of changes in baseline and projected blue water environmental sustainability in the Yobe-Komadugu watershed.
Analysis of the projected green water sustainability indicated that there is a 1–2-fold shift in the sustainability threshold across the basin, with a steady to sharp decline of the favourable basin green water sustainability status from the baseline of 16.50% to 15.9% for SSP2(4.5) (Figure 12B) and 0% for SSP5(8.5) in 2021–2050 (Figure 12C), and the far future also indicated a decline of the watershed green water sustainability threshold of 1.86% for SSP2(4.5) (Figure 12D) and 0% for SSP5(8.5) (Figure 12E) in 2051–2080 of the watershed area. The geographic hotspots (
The changes in blue water sustainability in the watershed for the baseline period in Figure 13A were assessed to be 15.61% HS, 5.4% MS, 15.65% MU, and 63.34% HU–EU (potential blue water geographic hotspots) of the watershed area. The high level of blue water sustainability is predominant upstream of the watershed; however, sub-basins 1, 2, and 6 are shown to be highly unsustainable, which may be related to the absence of viable stream channels and the high rate of evaporative demands, which characterized the basin as semi-arid with severe drought events and high interannual rainfall variability due to the effect of Intertropical Convergence Zone (ITCZ) migration (Thompson and Polet, 2000).
Analysis of the influence of climate change and changes in socioeconomic activities on projected blue water sustainability indicated further increases in blue water geographic hotspots across the watershed area of 71.53% and 75.38% (Figures 13B, C) between 2021 and 2050 and 73.51% and 76.35% (Figures 13D, E) between 2051 and 2080 for SSP2(4.5) and SSP5(8.5), respectively. Our model results showed that the blue water security hotspots regions have negative SIs ranging from 0.5 up to as high as 16.58 for both SSP2(4.5) and SSP5(8.5), respectively. The blue water’s continued unviability may be caused by major river systems drying up and reduced flows brought on by the overuse of groundwater and surface water resources as a result of intensive irrigation practices. These consistent patterns could be scaled with the SSP emission scenarios, which have shown a strong correlation between anthropogenic GHG emissions and potential environmental impacts, as corroborated by Adeyeri et al. (2019). Some of the viable blue water sustainable sub-basins are characterised by interconnected large streams that form the Komadugu-Yobe and Komadugu-Gana river sub-systems that support different ecological processes and socioeconomic activities, such as fish production, pastoralism, and forest regeneration, with a population of over 20 million people depending on these activities in the basin. The continued decline in sustainable blue water may be worrisome to local and national strategic freshwater management plans and a threat to diplomatic relationships among countries that share the basins.
4.4 Climate change impact on and socioeconomic drivers of the temporal variability of projected changes in green and blue water sustainability
The green and blue water sustainability assessment at the local basin scale will require an understanding of the temporal pattern of freshwater circulation at a monthly timescale to improve and stabilize the basin ecosystems. Figures 14A–E show a heat map of the severity of the baseline and projected monthly changes in green water sustainability across the 30 sub-basins of the watershed. The results indicated that green water is more sustainable in the pre- and post-monsoon months, with indices in the range of 0.15–0.95 (Figure 14A), although there is a consistent projected change in the sustainability status from moderately unsustainable to highly and extremely unsustainable green water in the monsoon months between April and June, indicating a transition to potential geographic water sustainability hotspots across all the climate change scenarios, as shown in Figures 14B–E.
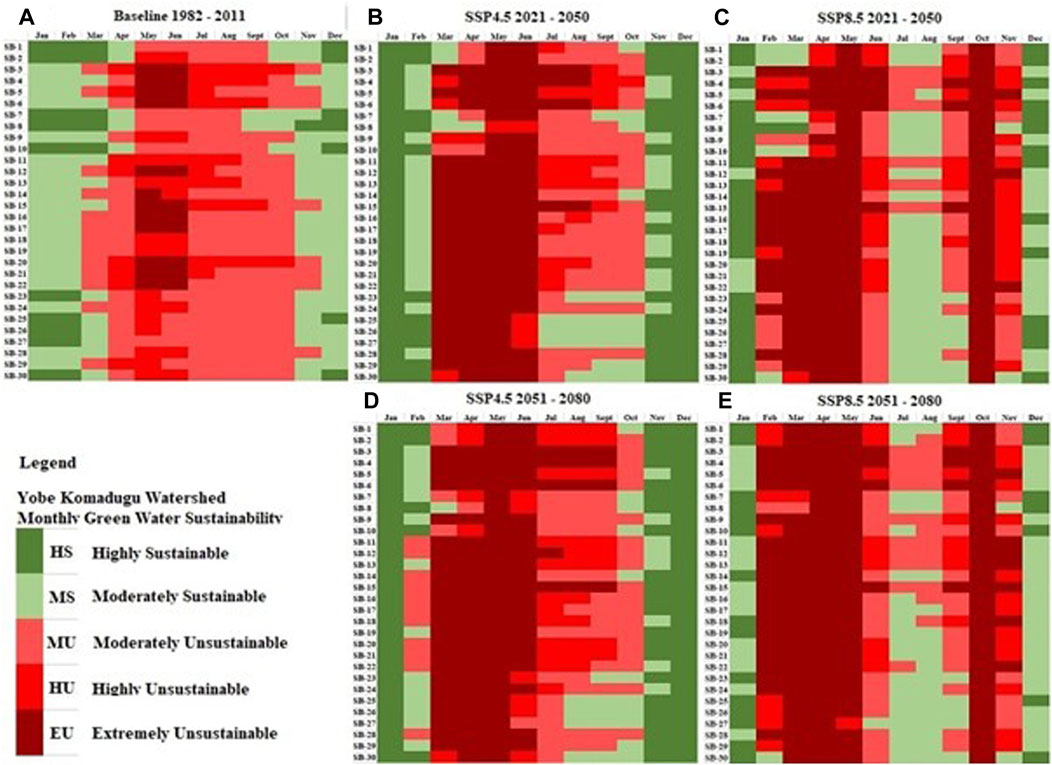
FIGURE 14. Heat map showing temporal changes in mean monthly baseline and projected green water environmental sustainability in the Yobe-Komadugu watershed.
However, a gradual change in the favourable green water sustainability status emerges in the July–August with 23% (Figure 14B) and 80% (Figure 14C) in the near future and 16.7% (Figure 14D) and 70% (Figure 14E) in the far future for SSP2(4.5) and SSP5(8.5) emission scenarios, respectively, across the entire watershed, and this may be connected to the sudden projected increase in rainfall events and intensities in the semi-arid climate. Assessment of the baseline blue water sustainability status (Figure 15A) indicated that sub-basins 1–19 (upstream) showed a moderate-to-high blue water sustainability in the monsoon months of May–September, with indices that ranged from 0.47 to 0.98; conversely, sub-basins 20–30 (downstream) generally exhibit the potential for geographic blue water sustainability hotspots, indicating highly to extremely unsustainable status 92.2% of the time during the monsoon period with indices in the range of 0.78 to–4.2. However, our analysis of monthly blue water availability indicated that the environmental flow requirement to maintain a healthy aquatic ecosystem cannot be met in 60.3% of the months in the baseline period and have been generally identified during the low-flow periods between the months of November and March and should have been classed as a “no abstraction period,” and streams should be protected across the basin.
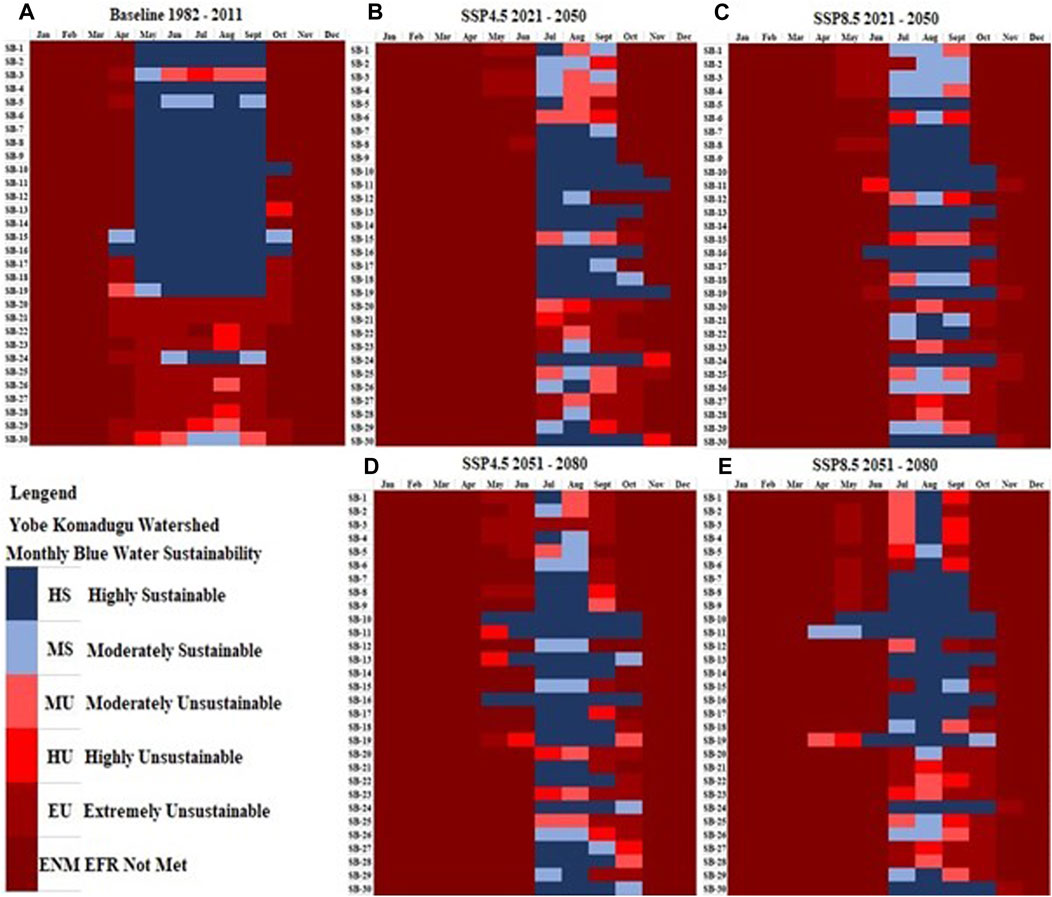
FIGURE 15. Heat map showing temporal changes in mean monthly baseline and projected blue water environmental sustainability in the Yobe-Komadugu watershed.
The unsustainable blue water status may be closely related to the mass exploitation of ground and surface water for domestic and agricultural (irrigation) practices, high rate of surface water evaporation, and plant transpiration due to increased surface air temperature that triggered declining runoff contribution and shrinkage to the major Lake Chad, which is consistent with the findings of Lemoalle et al. (2012) and Zhu et al. (2017). The assessment of the model output for blue water sustainability status showed projected increases in the “no abstraction period” to 74.4% (Figure 15B) and 65% (Figure 15C) for the near future and 66.11% (Figure 15D) and 65.3% (Figure 15E) in the far future for CO2 emission scenarios SSP2(4.5) and SSP5(8.5), respectively.
The projections here indicate that the gradual increase in precipitations may have a direct impact on the sustainability of green water resources, where the monsoon months of July–August experienced a projected change in green water sustainability status from MU to MS, as shown in Figures 14C, E. However, blue water sustainability status tends to be degraded relative to the baseline in all emission scenarios considered, and a favourable blue water status may only be achieved through enforcing regulations to protect intense groundwater withdrawal, especially during low-flow periods, and exploring innovative river basin water conservation strategies. According to the anticipated changes in the sustainability of green and blue water, more than half of the watershed will be ecologically fragile. Without prompt action by water authorities to improve ecological resilience and adaptation to reduce the shrinkage of wetlands and larger Lake Chad in the face of changing climate and socioeconomic activities, some regions’ freshwater geographic sustainability hotspot statuses may be beyond the recovery points, which will make restoration quite difficult.
5 Discussion
This study has demonstrated that the introduction of data pruning through machine learning in the hydrologic modelling process to enhance the previous frameworks will be beneficial, especially in data-sparse watersheds, where the climatological dynamics are highly variable and vulnerable to climate change. Although it is a challenge to understand the model stage that provides the majority of the overall uncertainty, as alluded to by Martin et al. (2020), various sources of uncertainty in climate impact modelling for water resource assessment include GHG concentration pathways (scenario uncertainty), GCM parameterisation (input uncertainty), and hydrologic model internal processes (structural uncertainty) and their interlinkages. According to Schewe et al. (2014), regional or local application may vary across different parts of the globe. The modelling scheme objective of managing scenarios and input uncertainty was prioritised in this study because they are generally classed as medium to high contributors of error propagation (Fang et al., 2018) and their management can cover for the limitations of inadequate data in order to prevent amplifying structural model uncertainty, although these uncertainties will inevitably remain and need to be addressed in practice through appropriate management actions by improved process understanding and adequate implementation of expert feedback on parameter calibration and model sensitivity mapping to narrow their effect in impact studies, as corroborated by Smith et al. (2018).
The relationship between the simulated and observation data based on the calibration statistics showed a satisfactory performance, although varied across the sub-watersheds. The result showed that a better uncertainty range (Figures 4A–D) was achieved with wider spatial coverage represented by the P-factor and R-factor values in the basin relative to the regionalisation modelling approach adopted in previous studies (Schuol et al., 2008; Faramarzi et al., 2013), which tend to be unrealistic and produce unsatisfactory performance and uncertainty range. This approach has often produced contradictory results, as suggested by Oudin et al. (2008), which may portray poor water resource dynamics and lead to a policy decision that affects resilience planning, especially in watersheds characterised by high climate variability.
The spatial variation in the green and blue water flow and storage in this study, as illustrated in Section 3.2, are quite intensified downstream, and this may be attributed to the presence of arable land, high population density, and intense agricultural activities, and the trends in the temporal variation in monthly changes are synonymous with semi-arid regions, as corroborated by Muratoglu et al. (2022) in the Euphrates. The projected unsustainable green and blue water status necessitates the review of water use policies, especially awareness programmes for local farmers on the willingness to change and adopt farming practices and strategies that lessen pressure on green water resources to prevent further intensification of current local basin water conflicts, as suggested by Li et al. (2020), failure of which will undoubtedly perpetuate the great uncertainty over how water availability and demand will change in the future (Sorg et al., 2014), and appropriate environmental flow regulations are critical for improving projected blue water sustainability status, especially in critical periods of the year, as suggested in previous studies (e.g., Hejazi et al., 2014).
6 Conclusion and future work
In this study, we developed a framework by integrating machine learning-based Boruta random feature selection as an input data refining process with process-based SWAT hydrologic models to optimise the calibration process. The accepted or rejected model parameter solutions based on a set error threshold were used to test whether models developed based on this framework can simultaneously improve baseline and future climate projections and accurately simulate water balance components in watersheds with insufficient ground-based modelling data, which is necessary for successful and reliable hydrologic modelling at the local scale.
Applying the framework to four sub-watersheds that form the larger Lake Chad basin defined by distinct morphological properties, we found that the model simulates the hydrologic fluxes of ET with varying degrees of acceptability. While ET can be simulated accurately, there are significant trade-offs in parameter sensitivity ranges in the calibration process across the sub-watersheds. Some of the key findings and conclusions in the research are summarized in this section. The integrated hydrologic modelling process in this study can reliably represent the spatiotemporal distribution of the watershed hydrology, irrespective of the different morphological characteristics of the four sub-watersheds, and reduce uncertainty from the input data (e.g., precipitation and temperature), which are the main drivers of water balance models. The feature selection mechanism could reduce uncertainty propagation within acceptable thresholds in the data input process and provide ensembles whose projections can be relied upon and consistent with previous studies for water security assessment.
Green water is the dominant freshwater component across the basin relative to blue water, and climate change may be a significant factor influencing the spatial and temporal changes in projected green water sustainability status. The combination of socioeconomic drivers and climate change may have a significant impact on the projected blue water sustainability status across the basin. High GWF (ET), temperature, and the flat terrain in the Yobe-Komadugu watershed may affect the spatial distribution of projected natural runoff distribution, and thus, the projected blue water footprint exceeds the blue water availability, and human water use can only be met by using up the environmental flows, resulting in the degradation of rivers and groundwater potential. Additionally, given the WF hotspots found in this study, new appropriate water abstraction targets should be quantified as part of future research, as well as its impact on blue water, which has a higher opportunity cost due to its potential as an input in many supply chains for emerging industries other than agriculture to help improve water management efforts at the local river basin scale.
We should also point out that the results and conclusions reported in this study are based on certain configurations of the model parameters, input dataset, reference data, and hydrologic model. The established modelling framework, however, is independent of model and data type and may be used to assess the effectiveness of hydrologic state variables and fluxes at small-scale watershed levels. Nevertheless, some obvious limitations are that the study does not consider the effects of some watershed management practices like irrigation withdrawals and reservoir regulations due to unavailability of data and future topographic changes in terrain and slope, which will be significant driving factors governing the hydrologic response to land use and land cover changes.
This research focuses on blue and green water sustainability; however, efforts are required to extend the current work to grey water assessment by developing innovative ways and building observation datasets to further extend the model calibration and validation efforts to increase the confidence of hydrologic variable outputs required to reliably measure and quantify grey water footprint and sustainability for managing wastewater discharge and the application of fertilizers and pesticides for water pollution control. The water Sustainability index and status could be useful in the development of effective local river basin policies and regulations. Future work should involve addressing some of the limitations identified by extending the current study through the incorporation of more water balance variables into the optimisation process and analysing their effects on the general trade-offs in the accuracy of modelling output.
Data availability statement
Publicly available datasets were analysed in this study. These data can be found at: https://www.esrl.noaa.gov/psd/data/gridded/data.cpc.globalprecip.html http://hydrology.princeton.edu/data.pgf.php https://search.earthdata.nasa.gov/search/granules http://due.esrin.esa.int/page_globcover.php http://webarchive.iiasa.ac.at/Research/LUC/External-World-soil-database https://esgf-node.llnl.gov/projects/esgf-llnl/CMIP6 http://files.ntsg.umt.edu/data/ET_global_monthly http://sedac.ciesin.columbia.edu/gpw.
Author contributions
All authors listed have made a substantial, direct, and intellectual contribution to the work and approved it for publication.
Funding
This research was undertaken during the PhD studentship funded by the Petroleum Technology Development Fund (award number PTDF/ED/OSS/PHD/IML/1537/19), Nigeria, and the University of Strathclyde.
Conflict of interest
The authors declare that the research was conducted in the absence of any commercial or financial relationships that could be construed as a potential conflict of interest.
Publisher’s note
All claims expressed in this article are solely those of the authors and do not necessarily represent those of their affiliated organizations, or those of the publisher, the editors, and the reviewers. Any product that may be evaluated in this article, or claim that may be made by its manufacturer, is not guaranteed or endorsed by the publisher.
Supplementary material
The Supplementary Material for this article can be found online at: https://www.frontiersin.org/articles/10.3389/fenvs.2023.1233216/full#supplementary-material
References
Abbaspour, K. C., Faramarzi, M., Ghasemi, S. S., and Yang, H. (2009). Assessing the impact of climate change on water resources in Iran. Water Resour. Res. 45, 1–16. doi:10.1029/2008WR007615
Abbaspour, K. C., Rouholahnejad, E., Vaghefi, S., Srinivasan, R., Yang, H., and Kløve, B. (2015). A continental-scale hydrology and water quality model for Europe: calibration and uncertainty of a high-resolution large-scale SWAT model. J. Hydrology 524, 733–752. doi:10.1016/j.jhydrol.2015.03.027
Abbaspour, K. C., Vaghefi, S. A., and Srinivasan, R. (2017). A guideline for successful calibration and uncertainty analysis for soil and water assessment: a review of papers from the 2016 international SWAT conference. Water 10, 6. doi:10.3390/w10010006
Abbaspour, K. C., Vaghefi, S. A., Yang, H., and Srinivasan, R. (2019). Global soil, landuse, evapotranspiration, historical and future weather databases for SWAT Applications. Sci. Data 6, 263–311. doi:10.1038/s41597-019-0282-4
Adamowski, J., Fung Chan, H., Prasher, S. O., Ozga-Zielinski, B., and Sliusarieva, A. (2012). Comparison of multiple linear and nonlinear regression, autoregressive integrated moving average, artificial neural network, and wavelet artificial neural network methods for urban water demand forecasting in Montreal, Canada. Water Resour. Res. 48, 1–14. doi:10.1029/2010WR009945
Adeyeri, O. E., Lawin, A. E., Laux, P., Ishola, K. A., and Ige, S. O. (2019). Analysis of climate extreme indices over the Komadugu-Yobe basin, Lake Chad region: past and future occurrences. Weather Clim. Extrem. 23, 100194–100221. doi:10.1016/j.wace.2019.100194
Ali, M., Deo, R. C., Xiang, Y., Li, Y., and Yaseen, Z. M. (2020). Forecasting long-term precipitation for water resource management: a new multi-step data-intelligent modelling approach. Hydrological Sci. J. 65, 2693–2708. doi:10.1080/02626667.2020.1808219
Almazroui, M., Saeed, F., Saeed, S., Nazrul Islam, M., Ismail, M., Klutse, N. A. B., et al. (2020). Projected change in temperature and precipitation over Africa from CMIP6. Earth Syst. Environ. 4, 455–475. doi:10.1007/s41748-020-00161-x
Arnell, N. W., van Vuuren, D. P., and Isaac, M. (2011). The implications of climate policy for the impacts of climate change on global water resources. Glob. Environ. Change 21, 592–603. doi:10.1016/j.gloenvcha.2011.01.015
Autovino, D., Minacapilli, M., and Provenzano, G. (2016). Modelling bulk surface resistance by MODIS data and assessment of MOD16A2 evapotranspiration product in an irrigation district of Southern Italy. Agric. Water Manag. 167, 86–94. doi:10.1016/j.agwat.2016.01.006
Balk, D. L., Deichmann, U., Yetman, G., Pozzi, F., Hay, S. I., and Nelson, A. (2006). Determining global population distribution: methods, applications and data. Adv. Parasitol. 62, 119–156. doi:10.1016/S0065-308X(05)62004-0
Baroni, G., Schalge, B., Rakovec, O., Kumar, R., Schüler, L., Samaniego, L., et al. (2019). A comprehensive distributed hydrological modeling intercomparison to support process representation and data collection strategies. Water Resour. Res. 55, 990–1010. doi:10.1029/2018WR023941
Bierkens, M. F. P., Bell, V. A., Burek, P., Chaney, N., Condon, L. E., David, C. H., et al. (2015). Hyper-resolution global hydrological modelling: what is next?: “Everywhere and locally relevant” M. F. P. Bierkens et al. Invited Commentary. Hydrol. Process. 29, 310–320. doi:10.1002/hyp.10391
Boko, M., Niang, I., Nyong, A., Vogel, C., Githeko, A., Medany, M., et al. (2007). “Africa,” in Climate change 2007: impacts, adaptation and vulnerability. Contribution OfWorking group II to the fourth assessment report of the intergovernmental panel on climate change. Editors S. Frederick, and S. Mohamed (Cambridge, United Kingdom: Cambridge University Press), 433–467.
Bontemps, S., Defourny, P., Bogaert, E. V., Kalogirou, V., and Perez, J. R. (2011). ESA Bulletin. http://due.esrin.esa.int/files/GLOBCOVER2009_Validation_Report_2.2.pdf.GLOBCOVER 2009 products description and validation report.
Buma, W. G., Lee, S., and Seo, J. Y. (2016). Hydrological evaluation of Lake Chad basin using space borne and hydrological model observations. WaterSwitzerl. 8, 205–215. doi:10.3390/w8050205
Cai, X., Zeng, R., Kang, W. H., Song, J., and Valocchi, A. J. (2015). Strategic planning for drought mitigation under climate change. J. Water Resour. Plan. Manag. 141, 1–10. doi:10.1061/(asce)wr.1943-5452.0000510
Chouchane, H., Krol, M. S., and Hoekstra, A. Y. (2018). Virtual water trade patterns in relation to environmental and socioeconomic factors: a case study for Tunisia. Sci. Total Environ. 613, 287–297. doi:10.1016/j.scitotenv.2017.09.032
Clark, M. P., Fan, Y., Lawrence, D. M., Adam, J. C., Bolster, D., Gochis, D. J., et al. (2015). Improving the representation of hydrologic processes in earth system models. Water Resour. Res. 51, 5929–5956. doi:10.1002/2015WR017096
Clark, M. P., Schaefli, B., Schymanski, S. J., Samaniego, L., Luce, C. H., Jackson, B. M., et al. (2016). Improving the theoretical underpinnings of process-based hydrologic models. Water Resour. Res. 52, 2350–2365. doi:10.1002/2015WR017910
Coe, M. T., and Foley, J. A. (2001). Human and natural impacts on the water resources of the Lake Chad basin. J. Geophys. Res. Atmos. 106, 3349–3356. doi:10.1029/2000JD900587
Crouch, M. L., Jacobs, H. E., and Speight, V. L. (2021). Defining domestic water consumption based on personal water use activities. Aqua Water Infrastructure, Ecosyst. Soc. 70, 1002–1011. doi:10.2166/aqua.2021.056
da Cunha e Silva, D. C., Oliveira, R. A., Simonetti, V. C., Toniolo, B. P., Sales, J. C. A., and Lourenço, R. W. (2022). Creation of an environmental sustainability index for water resources applied to watersheds. Environ. Dev. Sustain. 25, 11285–11305. doi:10.1007/s10668-022-02527-9
de O. Vieira, E., and Sandoval-Solis, S. (2018). Water resources sustainability index for a water-stressed basin in Brazil. J. Hydrology Regional Stud. 19, 97–109. doi:10.1016/j.ejrh.2018.08.003
Dessai, S., and Hulme, M. (2007). Assessing the robustness of adaptation decisions to climate change uncertainties: a case study on water resources management in the East of England. Glob. Environ. Change 17, 59–72. doi:10.1016/j.gloenvcha.2006.11.005
Donohue, R. J., Roderick, M. L., McVicar, T. R., and Yang, Y. (2017). A simple hypothesis of how leaf and canopy-level transpiration and assimilation respond to elevated CO2 reveals distinct response patterns between disturbed and undisturbed vegetation. J. Geophys. Res. Biogeosciences 122, 168–184. doi:10.1002/2016JG003505
Du, L., Rajib, A., and Merwade, V. (2018). Large scale spatially explicit modeling of blue and green water dynamics in a temperate mid-latitude basin. J. Hydrology 562, 84–102. doi:10.1016/j.jhydrol.2018.02.071
Elliott, J., Deryng, D., Müller, C., Frieler, K., Konzmann, M., Gerten, D., et al. (2014). Constraints and potentials of future irrigation water availability on agricultural production under climate change. Proc. Natl. Acad. Sci. U. S. A. 111, 3239–3244. doi:10.1073/pnas.1222474110
Fang, G., Yang, J., Chen, Y., Li, Z., and De Maeyer, P. (2018). Impact of GCM structure uncertainty on hydrological processes in an arid area of China. Hydrology Res. 49, 893–907. doi:10.2166/nh.2017.227
Faramarzi, M., Abbaspour, K. C., Ashraf Vaghefi, S., Farzaneh, M. R., Zehnder, A. J. B., Srinivasan, R., et al. (2013). Modeling impacts of climate change on freshwater availability in Africa. J. Hydrology 480, 85–101. doi:10.1016/j.jhydrol.2012.12.016
Folberth, C., Elliott, J., Müller, C., Balkovič, J., Chryssanthacopoulos, J., Izaurralde, R. C., et al. (2019). Parameterization-induced uncertainties and impacts of crop management harmonization in a global gridded crop model ensemble. PLoS ONE 14, e0221862. doi:10.1371/journal.pone.0221862
Gabbert, S., van Ittersum, M., Kroeze, C., Stalpers, S., Ewert, F., and Alkan Olsson, J. A. (2010). Uncertainty analysis in integrated assessment: the users’ perspective. Reg. Environ. Change 10, 131–143. doi:10.1007/s10113-009-0100-1
Gao, H., Bohn, T. J., Podest, E., McDonald, K. C., and Lettenmaier, D. P. (2011). On the causes of the shrinking of Lake Chad. Environ. Res. Lett. 6, 034021–034027. doi:10.1088/1748-9326/6/3/034021
Gesualdo, G. C., Oliveira, P. T. S., Rodrigues, D. B. B., and Gupta, H. V. (2019). Assessing water security in the sao paulo metropolitan region under projected climate change. Hydrology Earth Syst. Sci. 23, 4955–4968. doi:10.5194/hess-23-4955-2019
Gosling, S. N., and Arnell, N. W. (2016). A global assessment of the impact of climate change on water scarcity. Clim. Change 134, 371–385. doi:10.1007/s10584-013-0853-x
Gwp, (2013). The Lake Chad basin aquifer system, transboundary groundwater factsheet. https://www.gwp.org/lake_chad_fact_sheet.pdf.
Hejazi, M. I., Edmonds, J., Clarke, L., Kyle, P., Davies, E., Chaturvedi, V., et al. (2014). Integrated assessment of global water scarcity over the 21st century under multiple climate change mitigation policies. Hydrology Earth Syst. Sci. 18, 2859–2883. doi:10.5194/hess-18-2859-2014
Hoekstra, A. Y., Chapagain, A. K., Aldaya, M. M., and Mekonnen, M. M. (2011). The water footprint assessment manual. Setting the global standard. Water Footpr. Netw. Earthscan 31, 181–182. doi:10.1080/0969160x.2011.593864
Holzkämper, A., Klein, T., Seppelt, R., and Fuhrer, J. (2015). Assessing the propagation of uncertainties in multi-objective optimization for agro-ecosystem adaptation to climate change. Environ. Model. Softw. 66, 27–35. doi:10.1016/j.envsoft.2014.12.012
Hu, Z., Chen, Y., Yao, L., Wei, C., and Li, C. (2016). Optimal allocation of regional water resources: from a perspective of equity-efficiency tradeoff. Resour. Conservation Recycl. 109, 102–113. doi:10.1016/j.resconrec.2016.02.001
Jiang, L., Wu, H., Tao, J., Kimball, J. S., Alfieri, L., and Chen, X. (2020). Satellite-based evapotranspiration in hydrological model calibration. Remote Sens. 12, 428. doi:10.3390/rs12030428
Jones, B., and O’Neill, B. C. (2016). Spatially explicit global population scenarios consistent with the Shared Socioeconomic Pathways. Environ. Res. Lett. 11, 084003. doi:10.1088/1748-9326/11/8/084003
Karner, K., Mitter, H., and Schmid, E. (2019). The economic value of stochastic climate information for agricultural adaptation in a semi-arid region in Austria. J. Environ. Manag. 249, 109431. doi:10.1016/j.jenvman.2019.109431
Keys, P. W., Wang-Erlandsson, L., and Gordon, L. J. (2016). Revealing invisible Water: moisture recycling as an ecosystem service. PLoS ONE 11, 01519933–e152016. doi:10.1371/journal.pone.0151993
Kirchner, M., Mitter, H., Schneider, U. A., Sommer, M., Falkner, K., and Schmid, E. (2021). Uncertainty concepts for integrated modeling - review and application for identifying uncertainties and uncertainty propagation pathways. Environ. Model. Softw. 135, 104905. doi:10.1016/j.envsoft.2020.104905
Koppa, A., Gebremichael, M., and Yeh, W. W. G. (2019). Multivariate calibration of large scale hydrologic models: the necessity and value of a Pareto optimal approach. Adv. Water Resour. 130, 129–146. doi:10.1016/j.advwatres.2019.06.005
Kratzert, F., Klotz, D., Brenner, C., Schulz, K., and Herrnegger, M. (2018). Rainfall-runoff modelling using long short-term memory (LSTM) networks. Hydrology Earth Syst. Sci. 22, 6005–6022. doi:10.5194/hess-22-6005-2018
Kunnath-Poovakka, A., Ryu, D., Renzullo, L. J., and George, B. (2016). The efficacy of calibrating hydrologic model using remotely sensed evapotranspiration and soil moisture for streamflow prediction. J. Hydrology 535, 509–524. doi:10.1016/j.jhydrol.2016.02.018
Kursa, M. B. (2016). Embedded all relevant feature selection with random ferns. https://arxiv.org/abs/1604.06133.
Kursa, M. B., and Rudnicki, W. R. (2010). Feature selection with the boruta package. J. Stat. Softw. 36, 1–13. doi:10.18637/jss.v036.i11
Laiti, L., Mallucci, S., Piccolroaz, S., Bellin, A., Zardi, D., Fiori, A., et al. (2018). Testing the hydrological coherence of high-resolution gridded precipitation and temperature data sets. Water Resour. Res. 54, 1999–2016. doi:10.1002/2017WR021633
Laniak, G. F., Olchin, G., Goodall, J., Voinov, A., Hill, M., Glynn, P., et al. (2013). Integrated environmental modeling: a vision and roadmap for the future. Environ. Model. Softw. 39, 3–23. doi:10.1016/j.envsoft.2012.09.006
Lawal, I. M., Bertram, D., White, C. J., Jagaba, A. H., Hassan, I., and Shuaibu, A. (2021). Multi-criteria performance evaluation of gridded precipitation and temperature products in data-sparse regions. Atmosphere 12, 1597. doi:10.3390/atmos12121597
Lawal, I. M., Bertram, D., White, C. J., Kutty, S. R. M., Hassan, I., and Jagaba, A. H. (2023). Application of Boruta algorithms as a robust methodology for performance evaluation of CMIP6 general circulation models for hydro - climatic studies. Theor. Appl. Climatol. 153, 113–135. doi:10.1007/s00704-023-04466-5
Lemoalle, J. (2014). “Le développement du lac Tchad/Development of Lake Chad: situation actuelle et futurs possibles/Current Situation and Possible Outcomes,” in Expertise collégiale (Marseille, France: France Institut de Recherche pour le Développement IRD). doi:10.4000/books.irdeditions.11648
Lemoalle, J., Bader, J. C., Leblanc, M., and Sedick, A. (2012). Recent changes in Lake Chad: observations, simulations and management options (1973-2011). Glob. Planet. Change 80, 247–254. doi:10.1016/j.gloplacha.2011.07.004
Li, C., Wang, L., Wanrui, W., Qi, J., Linshan, Y., Zhang, Y., et al. (2018). An analytical approach to separate climate and human contributions to basin streamflow variability. J. Hydrology 559, 30–42. doi:10.1016/j.jhydrol.2018.02.019
Li, Z., Fang, G., Chen, Y., Duan, W., and Mukanov, Y. (2020). Agricultural water demands in Central Asia under 1.5 °C and 2.0 °C global warming. Agric. Water Manag. 231, 106020. doi:10.1016/j.agwat.2020.106020
Liu, J., Zhao, D., Mao, G., Cui, W., Chen, H., and Yang, H. (2020). Environmental sustainability of water footprint in mainland China. Geogr. Sustain. 1, 8–17. doi:10.1016/j.geosus.2020.02.002
López, P. L., Sutanudjaja, E. H., Schellekens, J., Sterk, G., and Bierkens, M. F. P. (2017). Calibration of a large-scale hydrological model using satellite-based soil moisture and evapotranspiration products. Hydrology Earth Syst. Sci. 21, 3125–3144. doi:10.5194/hess-21-3125-2017
Maggioni, V., and Massari, C. (2018). On the performance of satellite precipitation products in riverine flood modeling: a review. J. Hydrology 558, 214–224. doi:10.1016/j.jhydrol.2018.01.039
Mariotti, L., Diallo, I., Coppola, E., and Giorgi, F. (2014). Seasonal and intraseasonal changes of African monsoon climates in 21st century CORDEX projections. Clim. Change 125, 53–65. doi:10.1007/s10584-014-1097-0
Martin, K., Marcel, S., Annika, K., Fred, H., Dennis, T., Tobias, P., et al. (2020). Water and climate change – interlinkages and prospects for future action. https://www.everydrop-counts.org/imglib/pdf/Water%20Climate%20Report%202020.pdf.
Martinsen, G., Liu, S., Mo, X., and Bauer-Gottwein, P. (2019). Joint optimization of water allocation and water quality management in Haihe River basin. Sci. Total Environ. 654, 72–84. doi:10.1016/j.scitotenv.2018.11.036
Mitter, H., and Schmid, E. (2019). Computing the economic value of climate information for water stress management exemplified by crop production in Austria. Agric. Water Manag. 221, 430–448. doi:10.1016/j.agwat.2019.04.005
Mitter, H., Techen, A. K., Sinabell, F., Helming, K., Kok, K., Priess, J. A., et al. (2019). A protocol to develop Shared Socio-economic Pathways for European agriculture. J. Environ. Manag. 252, 109701. doi:10.1016/j.jenvman.2019.109701
Moss, R. H., Edmonds, J. A., Hibbard, K. A., Manning, M. R., Rose, S. K., Van Vuuren, D. P., et al. (2010). The next generation of scenarios for climate change research and assessment. Nature 463, 747–756. doi:10.1038/nature08823
Muratoglu, A., Iraz, E., and Ercin, E. (2022). Water resources management of large hydrological basins in semi-arid regions: spatial and temporal variability of water footprint of the Upper Euphrates River basin. Sci. Total Environ. 846, 157396. doi:10.1016/j.scitotenv.2022.157396
Ndehedehe, C. E., Awange, J. L., Agutu, N. O., and Okwuashi, O. (2018). Changes in hydro-meteorological conditions over tropical West Africa (1980–2015) and links to global climate. Glob. Planet. Change 162, 321–341. doi:10.1016/j.gloplacha.2018.01.020
Niang, I., Ruppel, O. C., Abdrabo, M. A., Essel, A., Lennard, C., Padgham, J., et al. (2014). “Africa,” in Climate change 2014: impacts, adaptation, and vulnerability. Part B: regional aspects. Contribution of working group II to the fifth assessment report of the intergovernmental panel on climate change. Editors P. Dube, and N. Leary (Cambridge, United Kingdom and New York, NY, USA: Cambridge University Press), 1199–1265. https://www.ipcc.chapter22/WGIIAR5-Chap22_FINAL.pdf.
Nkiaka, E., Nawaz, R., and Lovett, J. C. (2018). Assessing the reliability and uncertainties of projected changes in precipitation and temperature in Coupled Model Intercomparison Project phase 5 models over the Lake Chad basin. Int. J. Climatol. 38, 5136–5152. doi:10.1002/joc.5717
Novoa, V., Ahumada-Rudolph, R., Rojas, O., Munizaga, J., Sáez, K., and Arumí, J. L. (2019). Sustainability assessment of the agricultural water footprint in the Cachapoal River basin, Chile. Ecol. Indic. 98, 19–28. doi:10.1016/j.ecolind.2018.10.048
Ocio, D., Beskeen, T., and Smart, K. (2019). Fully distributed hydrological modelling for catchmentwide hydrological data verification. Hydrology Res. 50, 1520–1534. doi:10.2166/nh.2019.006
Ogutu, B. O., D’Adamo, F., and Dash, J. (2021). Impact of vegetation greening on carbon and water cycle in the African Sahel-Sudano-Guinean region. Glob. Planet. Change 202, 103524. doi:10.1016/j.gloplacha.2021.103524
Oudin, L., Andre, V., Perrin, C., and Michel, C. (2008). Spatial proximity, physical similarity, regression and ungaged catchments: a comparison of regionalization approaches based on 913 French catchments. Water Resour. Res. 44, W03413. doi:10.1029/2007WR006240
Pellicer-Martínez, F., and Martínez-Paz, J. M. (2018). Probabilistic evaluation of the water footprint of a river basin: accounting method and case study in the Segura River Basin, Spain. Sci. Total Environ. 627, 28–38. doi:10.1016/j.scitotenv.2018.01.223
Pfister, S., Koehler, A., and Hellweg, S. (2009). Assessing the environmental impacts of freshwater consumption in LCA. Environ. Sci. Technol. 43, 4098–4104. doi:10.1021/es802423e
Pham-Duc, B., Sylvestre, F., Papa, F., Frappart, F., Bouchez, C., and Crétaux, J. F. (2020). The Lake Chad hydrology under current climate change. Sci. Rep. 10, 5498–5510. doi:10.1038/s41598-020-62417-w
Rajib, M. A., Merwade, V., and Yu, Z. (2016). Multi-objective calibration of a hydrologic model using spatially distributed remotely sensed/in-situ soil moisture. J. Hydrology 536, 192–207. doi:10.1016/j.jhydrol.2016.02.037
Refsgaard, J. C., Arnbjerg-Nielsen, K., Drews, M., Halsnæs, K., Jeppesen, E., Madsen, H., et al. (2013). The role of uncertainty in climate change adaptation strategies-A Danish water management example. Mitig. Adapt. Strategies Glob. Change 18, 337–359. doi:10.1007/s11027-012-9366-6
Reilly, M., and Willenbockel, D. (2010). Managing uncertainty: a review of food system scenario analysis and modelling. Philosophical Trans. R. Soc. B Biol. Sci. 365, 3049–3063. doi:10.1098/rstb.2010.0141
Richter, B. D., Davis, M. M., Apse, C., and Konrad, C. (2012). A presumptive standard for environmental flow protection. River Res. Appl. 28, 1312–1321. doi:10.1002/rra.1511
Rockström, J., Falkenmark, M., Karlberg, L., Hoff, H., Rost, S., and Gerten, D. (2009). Future water availability for global food production: the potential of green water for increasing resilience to global change. Water Resour. Res. 45, 1–16. doi:10.1029/2007WR006767
Rodrigues, D. B. B., Gupta, H. V., and Mendiondo, E. M. (2014). A blue/green water-based accounting framework for assessment of water security. Water Resour. Res. 50, 7187–7205. doi:10.1002/2013WR014274
Sandoval-Solis, S., McKinney, D. C., and Loucks, D. P. (2011). Sustainability index for water resources planning and management. J. Water Resour. Plan. Manag. 137, 381–390. doi:10.1061/(asce)wr.1943-5452.0000134
Sarr, B. (2012). Present and future climate change in the semi-arid region of West Africa: a crucial input for practical adaptation in agriculture. Atmos. Sci. Lett. 13, 108–112. doi:10.1002/asl.368
Schewe, J., Heinke, J., Gerten, D., Haddeland, I., Arnell, N. W., Clark, D. B., et al. (2014). Multimodel assessment of water scarcity under climate change. Proc. Natl. Acad. Sci. U. S. A. 111, 3245–3250. doi:10.1073/pnas.1222460110
Schuol, J., Abbaspour, K. C., Yang, H., Srinivasan, R., and Zehnder, A. J. B. (2008). Modeling blue and green water availability in Africa. Water Resour. Res. 44, 1–18. doi:10.1029/2007WR006609
Sema, (2022). Flood Updates: general overview of flood incidences across the state. Yobe, Nigeria. https://fscluster.org/ne_nigeria/document/general-overview-flood-incidents-across.
Shrestha, S., Chapagain, R., and Babel, M. S. (2017). Quantifying the impact of climate change on crop yield and water footprint of rice in the Nam Oon Irrigation Project, Thailand. Sci. Total Environ. 599, 689–699. doi:10.1016/j.scitotenv.2017.05.028
Smith, K. A., Wilby, R. L., Broderick, C., Prudhomme, C., Matthews, T., Harrigan, S., et al. (2018). Navigating cascades of uncertainty — as easy as ABC ? Not quite. J. Extreme Events 5, 1850007–1850008. doi:10.1142/S2345737618500070
Sorg, A., Mosello, B., Shalpykova, G., Allan, A., Hill Clarvis, M., and Stoffel, M. (2014). Coping with changing water resources: the case of the Syr Darya river basin in Central Asia. Environ. Sci. Policy 43, 68–77. doi:10.1016/j.envsci.2013.11.003
Sun, G., Peng, F., and Mu, M. (2017). Uncertainty assessment and sensitivity analysis of soil moisture based on model parameter errors – results from four regions in China. J. Hydrology 555, 347–360. doi:10.1016/j.jhydrol.2017.09.059
Swain, S. S., Mishra, A., Sahoo, B., and Chatterjee, C. (2020). Water scarcity-risk assessment in data-scarce river basins under decadal climate change using a hydrological modelling approach. J. Hydrology 590, 125260. doi:10.1016/j.jhydrol.2020.125260
Sylla, M. B., Giorgi, F., Pal, J. S., Gibba, P., Kebe, I., and Nikiema, M. (2015). Projected changes in the annual cycle of high-intensity precipitation events over West Africa for the late twenty-first century. J. Clim. 28, 6475–6488. doi:10.1175/JCLI-D-14-00854.1
Sylla, M. B., Pinghouinde, M. N., Peter, G., Ibourahima, K., and Nana, A. B. K. (2016). “Climate change over West Africa: recent trends and future projections,” in Adaptation to climate change and variability in rural West Africa (Switzerland: Springer), 25–40. doi:10.1007/978-3-319-31499-0
Tabari, H. (2020). Climate change impact on flood and extreme precipitation increases with water availability. Sci. Rep. 10, 13768–13810. doi:10.1038/s41598-020-70816-2
Teichmann, C., Eggert, B., Elizalde, A., Haensler, A., Jacob, D., Kumar, P., et al. (2013). How does a regional climate model modify the projected climate change signal of the driving GCM: a study over different CORDEX regions using REMO. Atmosphere 4, 214–236. doi:10.3390/atmos4020214
Themeßl, M. J., Gobiet, A., and Heinrich, G. (2012). Empirical-statistical downscaling and error correction of regional climate models and its impact on the climate change signal. Clim. Change 112, 449–468. doi:10.1007/s10584-011-0224-4
Thompson, J. R., and Polet, G. (2000). Hydrology and land use in a sahelian floodplain Wetland. Wetlands 20, 639–659. doi:10.1672/0277-5212(2000)020[0639:HALUIA]2.0.CO;2
Todzo, S., Bichet, A., and Diedhiou, A. (2020). Intensification of the hydrological cycle expected in West Africa over the 21st century. Earth Syst. Dyn. 11, 319–328. doi:10.5194/esd-11-319-2020
Tortajada, C., González-Gómez, F., Biswas, A. K., and Buurman, J. (2019). Water demand management strategies for water-scarce cities: the case of Spain. Sustain. Cities Soc. 45, 649–656. doi:10.1016/j.scs.2018.11.044
Troost, C., Walter, T., and Berger, T. (2015). Climate, energy and environmental policies in agriculture: simulating likely farmer responses in Southwest Germany. Land Use Policy 46, 50–64. doi:10.1016/j.landusepol.2015.01.028
Tzabiras, J., Vasiliades, L., Sidiropoulos, P., Loukas, A., and Mylopoulos, N. (2016). Evaluation of water resources management strategies to overturn climate change impacts on lake karla watershed. Water Resour. Manag. 30, 5819–5844. doi:10.1007/s11269-016-1536-y
Veettil, A. V., and Mishra, A. K. (2016). Water security assessment using blue and green water footprint concepts. J. Hydrology 542, 589–602. doi:10.1016/j.jhydrol.2016.09.032
Veettil, A. V., and Mishra, A. K. (2018). Potential influence of climate and anthropogenic variables on water security using blue and green water scarcity, Falkenmark index, and freshwater provision indicator. J. Environ. Manag. 228, 346–362. doi:10.1016/j.jenvman.2018.09.012
Vicente-Serrano, S. M., Zabalza-Martínez, J., Borràs, G., López-Moreno, J. I., Pla, E., Pascual, D., et al. (2017). Extreme hydrological events and the influence of reservoirs in a highly regulated river basin of northeastern Spain. J. Hydrology Regional Stud. 12, 13–32. doi:10.1016/j.ejrh.2017.01.004
Vizy, E. K., Cook, K. H., Crétat, J., and Neupane, N. (2013). Projections of a wetter sahel in the twenty-first century from global and regional models. J. Clim. 26, 4664–4687. doi:10.1175/JCLI-D-12-00533.1
Wang, X., Zhang, J., Shahid, S., Guan, E., Wu, Y., Gao, J., et al. (2016). Adaptation to climate change impacts on water demand. Mitig. Adapt. Strategies Glob. Change 21, 81–99. doi:10.1007/s11027-014-9571-6
Zandler, H., Haag, I., and Samimi, C. (2019). Evaluation needs and temporal performance differences of gridded precipitation products in peripheral mountain regions. Sci. Rep. 9, 15118–15215. doi:10.1038/s41598-019-51666-z
Zhu, W., Yan, J., and Jia, S. (2017). Monitoring recent fluctuations of the southern pool of lake Chad using multiple remote sensing data: implications for water balance analysis. Remote Sens. 9, 1032. doi:10.3390/rs9101032
Keywords: data uncertainty, feature selection, integrated modelling, ungauged watershed, climate change, water footprint, freshwater sustainability
Citation: Lawal IM, Bertram D, White CJ and Jagaba AH (2023) Integrated framework for hydrologic modelling in data-sparse watersheds and climate change impact on projected green and blue water sustainability. Front. Environ. Sci. 11:1233216. doi: 10.3389/fenvs.2023.1233216
Received: 01 June 2023; Accepted: 17 October 2023;
Published: 02 November 2023.
Edited by:
Zhiyuan Hu, Sun Yat-sen University, ChinaReviewed by:
Guojie Wang, Nanjing University of Information Science and Technology, ChinaQianrong Ma, Yangzhou University, China
Mohammed Magdy Hamed, Technology and Maritime Transport (AASTMT), Egypt
Copyright © 2023 Lawal, Bertram, White and Jagaba. This is an open-access article distributed under the terms of the Creative Commons Attribution License (CC BY). The use, distribution or reproduction in other forums is permitted, provided the original author(s) and the copyright owner(s) are credited and that the original publication in this journal is cited, in accordance with accepted academic practice. No use, distribution or reproduction is permitted which does not comply with these terms.
*Correspondence: I. M. Lawal, ibrahim.lawal@strath.ac.uk, mlibrahim@atbu.edu.ng
†These authors share senior authorship