Study on multi-scenarios regulating strategy of land use conflict in urban agglomerations under the perspective of “three-zone space”: a case study of Harbin-Changchun urban agglomerations, China
 Wei Zheng1*
  Bin Guo
 Hao Su
- 1School of Public Administration, Xi’an University of Architecture and Technology, Xi’an, China
- 2School of Public Policy and Administration, Xi’an Jiaotong University, Xi’an, China
Introduction: Against the background of rapid global urbanization, the urban space expansion has led to increasingly acute land-use conflicts. Accurately understanding the spatial and temporal evolution characteristics of land-use conflict patterns and measuring the level of spatial conflicts are crucial for intensifying sustainable use and management of land resources. Existing research focuses on analyzing the current status of land-use conflicts, while there is limited discussion on tracking spatial-temporal dynamic patterns and simulating future conflict trends.
Method: In this paper, the level of spatial conflict was measured by constructing a spatial comprehensive conflict index (SCCI) model, and the spatio-temporal evolution characteristics of land use conflict in Harbin-Changchun urban agglomeration from 2000 to 2020 are discussed. In addition, the PLUS model is used to simulate and predict the pattern of land use conflict in 2030, finally put forward the control strategy.
Results: Result shows that: (1) Over the past 20 years, urban space has expanded rapidly with two provincial capitals as growth poles. Land-use conflicts generally exhibit a distribution pattern of “high in the west and low in the east, high in the core and low in the periphery.” (2) During the past 20 years, conflicts have intensified initially and then eased. Severe uncontrolled conflicts are concentrated in the transition zone between urban and rural areas of urban agglomerations. (3) Agricultural space is the core resource and key area contested by different interest subjects in the process of land development and utilization.
Discussion: The agricultural space priority scenario proves to be the most effective in controlling spatial conflicts. However, a single space priority scenario cannot adequately address multiple spatial rights and interests. Therefore, different spatial management modes should be implemented in different areas. The purpose of this paper is to provide scientific strategies and suggestions for controlling land-use conflicts in urban agglomerations and achieving sustainable development of regional land use.
1 Introduction
Land, as a comprehensive resource that carries human production and life, social and economic development, and ecological civilization protection, plays a crucial role in realizing the interests of various stakeholders (Von Der Dunk et al., 2011). With the rapid advancement of global urbanization, original urban land is unable to meet the growing needs of human survival and development, leading to the disorderly outward expansion of cities (Liu et al., 2023). The increasing intensity of use of space resources has led to frequent land use conflicts, which not only pose a serious threat to food and ecological security, but also pose a major challenge to sustainable land planning and management.
The issue of land use conflicts gained early attention from foreign scholars, with the British Countryside Association highlighting it as one of the key themes in a 1977 conference (Yu and, 2006). They identified the disharmony between land use allocation and the regional needs of social, economic, and ecological development as the essence of these conflicts (Wehrmann, 2008). However, foreign scholars have never formed a unified definition of the concept of land use conflict. Compared with foreign countries, domestic research on land use conflicts is relatively late. Relevant research only began in 2000. Yu Bohua, Lu Changhe introduced the concept of stakeholders and defining land use conflicts as “The various stakeholders have inconsistencies and uncoordinated views on land use methods and quantities, as well as the contradictory status between various land use methods and the environment” (Yu and, 2006; Chen et al., 2012).
The so-called three-area space (hereinafter referred to as “three-area space”) refers to the urban space, agricultural space, and ecological space that directly to the geographical function division and development strategy requirements of urban development, food security, and ecological environmental protection in the provincial main function zones (Wang et al., 2023; Wang et al., 2019), they serve as important technology approach for undertaking macro-scale (main function zones) and micro-scale (land use). Moreover, it aligns with the 11th goal of United Nations’ Sustainable Development Goals (SDGs) “Build inclusive, safe, risk-resistant and sustainable cities and human settlements” released in 2015 (Allen et al., 2020).
From the perspective of research, the studies on urban-rural land use conflicts, ecological resources-land use conflicts are more extensive (WuBie et al., 2021), Some scholars have measured land use conflicts from the perspective of the Production-Life-Ecological Space which is called “three-life space” (Yang et al., 2020), while the “three-life space” focuses on the assessment of a single function and lacks a comprehensive consideration of the functions of the region (Chen H et al., 2021). The “three-zone space” is a further deepening of the “three-life space,” which is not only integrating the functional aspects of land use, but also evolving the objective spatial pattern of land into a basic consensus linking the evaluation of the carrying capacity of resources and the environment and the evaluation of the appropriateness of spatial development of the national territory. Therefore, this paper selects the three-zone space as a research perspective to carry out the research on the management and control strategy for the land use conflicts. Which not only aligns with the national land spatial control system, but also take into account the production, ecological and social benefits, making the research content more comprehensive and persuasive.
Regarding research content, with the continuous aggravation of land use conflicts, the research on this issue at home and abroad has become more extensive. At the theoretical level, the existing research on land use conflict mainly focuses on the internal mechanism of conflict occurrence (Andrew, 2003), the causes of generation (Dong et al., 2021), the type identification and diagnosis of conflict (De Groot, 2006; De Groot, 2006; Chen W et al., 2021), etc. Empirical studies have explored spatial spillover effect of land use conflict and the conflict relationship between different elemental objects from a multi-factor perspective, mainly focusing on urban-rural land use conflict, the conflict between economic development and food protection, and land use conflict related to water resources and green resources (Wang et al., 2022), There are also scholars from the perspective of ecology and geography, using landscape ecology and ecosystem services and other related theories to explore the relationship between spatial development and utilization and regional ecological environmental protection (Ma et al., 2020), based on the landscape pattern to analyze the spatial distribution heterogeneity characteristics of the land use conflict (Jiang et al., 2021; Xie et al., 2023), in order to identify and coordinate land use conflicts. (Ran et al., 2018).
In terms of research scale, regional urban agglomerations and city and county levels have been studied more extensively, characterization of spatial conflicts in urban agglomerations and simulation of future expansion of land use are the hot spots of land use conflict research in recent years, Bao chose the Beijing-Tianjin-Hebei urban agglomeration as the research area to identify and evaluate land use conflicts by constructing the Spatial Comprehensive Conflict Index (SCCI), and simulated land use conflicts under the 2030 adaptation scenario. The results prove that in 2030, land use conflicts in Beijing will show an overall mitigating trend under the ecological security (ES) scenario, while showing an intensifying trend under the normal business (BAU) scenario and cultivated land protection (CP) scenario (Bao et al., 2021); Wang used the Spatial Comprehensive Conflict Index (SCCI) and the Pythagorean Fuzzy Conflict Information System (PFCI) to measure the absolute and relative conflicts of land use in the Lanzhou-Xining urban agglomeration under different scenarios (Meimei et al., 2023); Jiang drew on the conceptual framework of ecological risk assessment and the theories in landscape ecology, and developed a methodology to derive the spatio-temporal patterns of land use conflict in China urban agglomeration from 2001 to 2017, used multilevel regression model to identify the driving factors of land use conflict at different levels (Jiang et al., 2021). Zhou taking the Hangzhou Bay Ring urban agglomeration as an example to explore the spatial conflicts and complexity of land use. The Yangtze River Delta urban agglomeration (Qiao et al., 2023) and so on also have been taken as research areas for quantitative measurement of conflicts; some scholars have also selected economic development zones to carry out the identification and evaluation of land use conflict zones.
Compared with the urban agglomeration regions selected in these studies, the Harbin-Changchun urban agglomeration is a national key regional city cluster approved by China’s central government in 2016, an important gateway for opening up to Northeast Asia, and an important growth pole leading the revitalization of the Northeast’s economic development. In terms of agricultural space, the Harbin-Changchun urban agglomeration has the most important agricultural production base and the largest commercial grain base in the country, with the Sanjiang Plain and Songnen Plain providing sufficient and fertile land resources for agricultural production and grain cultivation. In terms of ecological space, the Harbin-Changchun urban agglomeration has a number of national forest parks, national nature reserves and key ecological function areas within the urban agglomeration. However, the northeast region urban agglomeration expansion is rapid, the phenomenon of disorderly spread is serious, land use conflicts occur frequently, and the ecological environment is poor in nature, and the control and optimization of land space is imminent. Based on this, we focuses on the Harbin-Changchun urban agglomeration, the only national-level urban agglomeration in Northeast China, from the perspective of the “three-zone space.”
Regarding research methods, both qualitative and quantitative approaches have been employed. 1) Qualitative methods such as public participation and game theory have been effective in exploring the evolution process and driving mechanisms of land use conflicts (Alston et al., 2000; Brown and Raymond, 2014; Adam et al., 2015), but which cannot effectively quantify conflict levels. 2) Quantitative measurement methods include multi-criteria evaluation (MCE) methods (Rahman et al., 2014; Kim and Arnhold, 2018), pressure-state-response (PSR) models (Nyangena, 2000) and land system complexity-Vulnerability-dynamic landscape ecological risk assessment method (Peterseil et al., 2004; Wang et al., 2023). Among them, the landscape ecological risk assessment method of land system complexity-vulnerability-dynamics can be updated and implemented in detail at the grid level, and is more suitable for flexible integration with land use simulation models.
In summary, from a research perspective, the three-zone space not only focuses on the spatial leading function of land use, but also emphasizes the macro-main functional zoning layout and micro-land use, which aligns with the framework of the current domestic and foreign land spatial regulation systems. In terms of content, there are relatively abundant studies on land use conflicts at home and abroad, and have provided rich insights into the definition, causes, classification types, driving mechanisms and control strategies of land use conflicts. Due to the mediation process of land use conflicts has obvious the regional differences and stages, it not only needs to pay attention to the impact of the conflict, but also needs to track its evolution. Otherwise, it will be impossible to comprehensively analyze and resolve potential land use conflicts in the future. However, existing quantitative research focuses more on static research at a certain point in time. There is a lack of describing the dynamic evolution of land use conflicts from a long time series, as well as simulating and predicting future development trends. It is difficult to accurately understand future land use evolution trends only in this way.
Therefore, the objectives of this study are as follows: 1) Portray the spatial-temporal evolution characteristics of the land-use conflict pattern in terms of both deformation and quantitative changes in the period of 2000-2020, and analyze the change rules. 2) Construct a spatial comprehensive conflict index (SCCI), using the grid as the evaluation unit to assess the level of land-use conflicts, and identify areas with uncontrolled conflicts. 3) Conduct multi-scenario simulations to predict land-use conflict trends in 2030 by employing the PLUS model, and propose conflict control strategies under different scenarios based on the prediction results. This study can not only provide data reference for the scientific delineation of the “three zones and three lines,” but also provide new ideas for the optimization of the land space layout of urban agglomerations and the control of land use conflicts in China and even in the world (Figure 1).
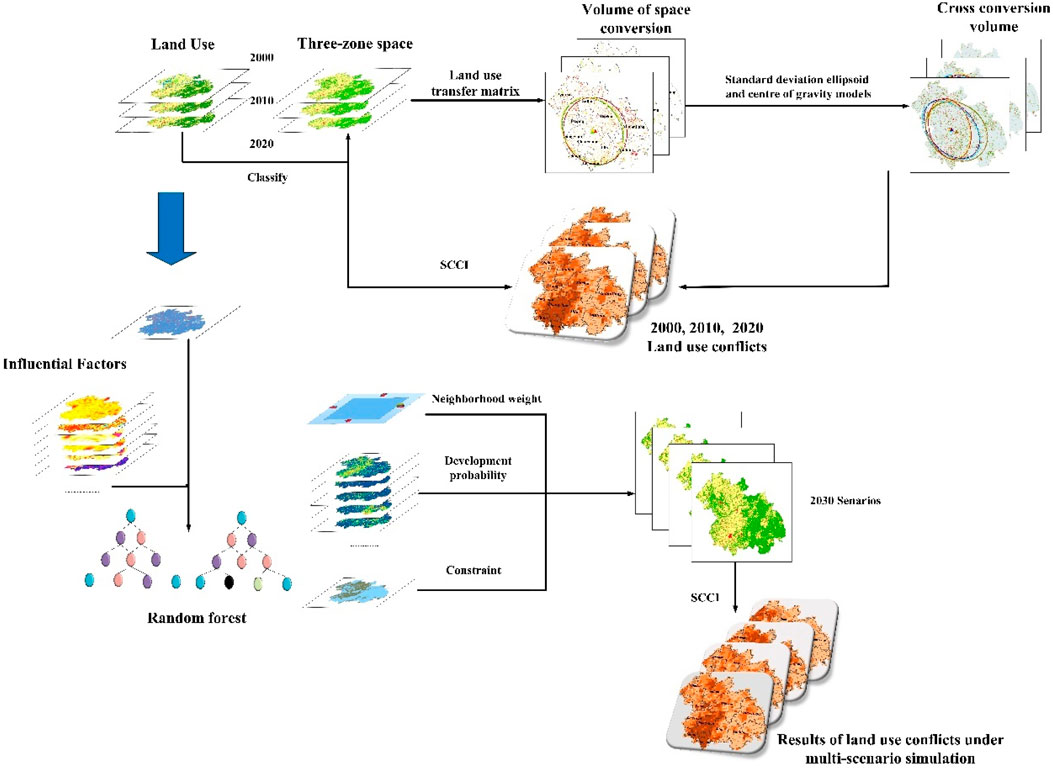
FIGURE 1. Flowchart of the proposed method.
2 Study area and data sources
2.1 Overview of the study area
The Harbin-Changchun urban agglomeration is a geographical -level urban agglomeration approved by the State Council in the context of promoting the construction of the Belt and Road and the revitalization strategy of the new round of old industrial bases in the northeastern region, as well as the in-depth development of new urbanization. It consists of 11 prefecture-level cities (states) and 63 counties (county-level cities) in Harbin, Daqing, Qiqihar, Suihua, and Mudanjiang in Heilongjiang Province, and Changchun, Jilin, Siping, Liaoyuan, Songyuan, and Yanbian Korean Autonomous Prefecture in Jilin Province (Figure 2). The land area is 336,100 square kilometers, with a core area of about 51,100 square kilometers, a resident population of about 42.6 million, and a combined gross regional product of about RMB 2.09 trillion.
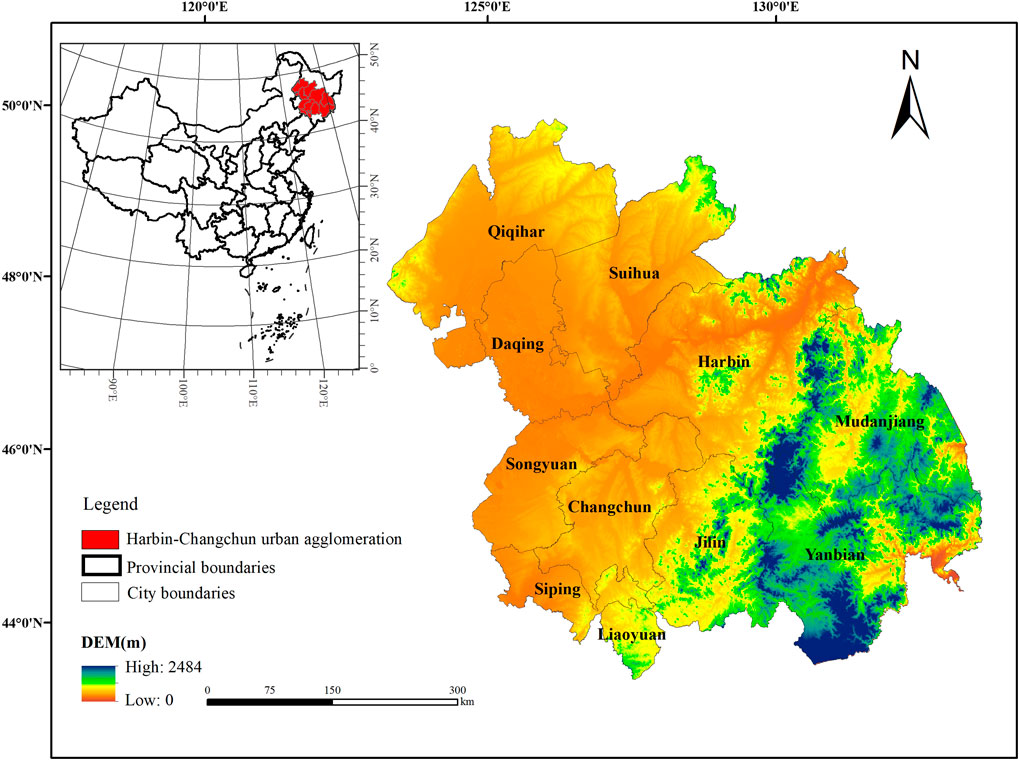
FIGURE 2. Geographical location of the Harbin-Changchun urban agglomeration.
2.2 Data sources and spatial classification systems
2.2.1 Data sources and processing
The data used in this study mainly include the surface cover dataset, physical geographic factor dataset, socio-economic factor dataset, and policy factor dataset. The surface cover raster data used to extract the three phases of the “three-zone space” (2000, 2010, and 2020) are mainly obtained from the Geoscience and Resources Data Centre of the Chinese Academy of Sciences (https://www.resdc.cn/), which is based on Landsat series satellite remote sensing images. The data is based on Landsat satellite remote sensing images, processed by ENVI 5.1 and interpreted by manual interactive visual interpretation, with a spatial resolution of 30 × 30 m and a resolution of 93% or more for the first level of land class interpretation, which is highly reliable.
The Harbin-Changchun urban agglomeration has a temperate continental monsoon climate, with a high topography in the east and a low topography in the west. Topographic relief, precipitation, temperature, and other basic natural geographical factors have a significant impact on the ecological and spatial environment of the study area. At the same time, as an important growth pole for the revitalization and development of the old industrial bases in Northeast China and an important gateway for the construction of the “China-Mongolia-Russia Economic Corridor” land and sea Silk Road Economic Belt, the regional spatial changes of the Harbin-Changchun urban agglomeration are closely linked to multiple factors such as the level of socio-economic development, population density, distance from roads and enterprises. In particular, land development policies play a crucial role in driving the evolution of the pattern of the “three-zone space” (Wei and Yin, 2023). Therefore, in this study, the 30 drivers that have a strong correlation with the changes in the “three zones” were selected, and the sources of the data set are shown in Table 1. Considering that some of the data are updated and iterated rapidly, some of the socio-economic and physical-geographical drivers were selected from 2005 to 2015 respectively to ensure the timeliness of the drivers. The various data sets were resampled to 100 m × 100 m resolution before being imported into the PLUS model.
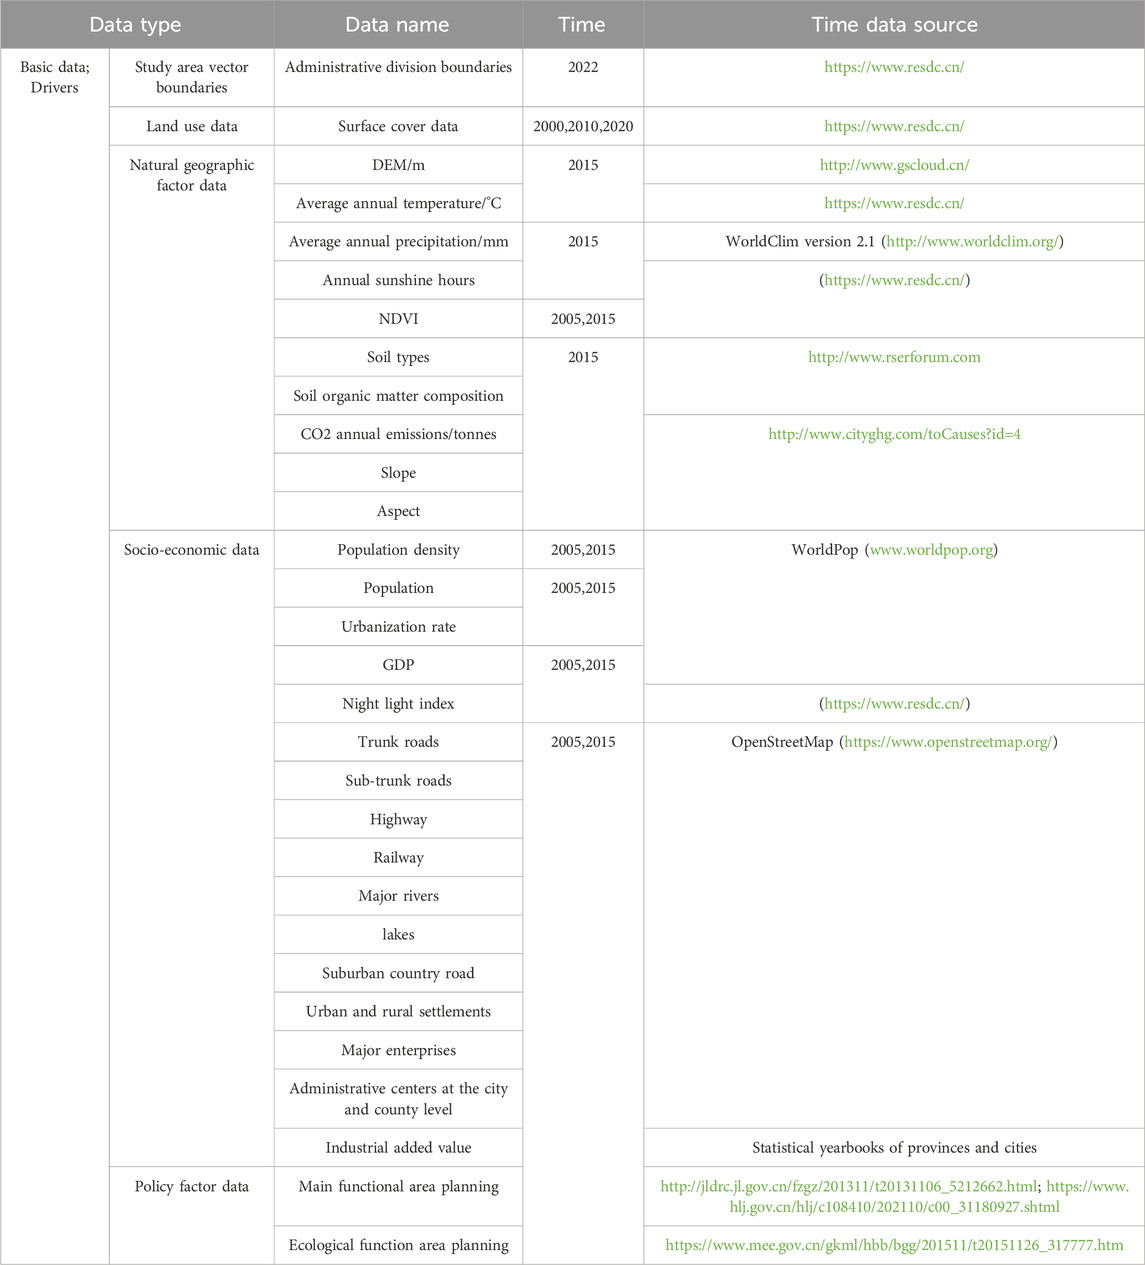
TABLE 1. Source of data.
2.2.2 Classification system of “three-zone space”
By the “Guidelines for the Evaluation of the Carrying Capacity of Resources and Environment and the Suitability of Land Spatial Development (for Trial Implementation)” (hereinafter referred to as the dual evaluation guidelines) and the CNLUCC data classification system standards issued by the State Council, and taking into account the current situation of land use in the urban agglomeration, the land use types of the “three-zone space” of the Harbin-Changchun urban agglomeration are classified. To effectively connect the dominant land functions with the technical path of land spatial planning and management, the spatial pattern of the three zones and three lines in the outline of land spatial planning is taken as the basis for classification, and the classification system of the “three zones and spaces” of the land of the Harbin-Changchun urban agglomeration is established concerning the relevant literature (Wei et al., 2022) as shown in Table 2.
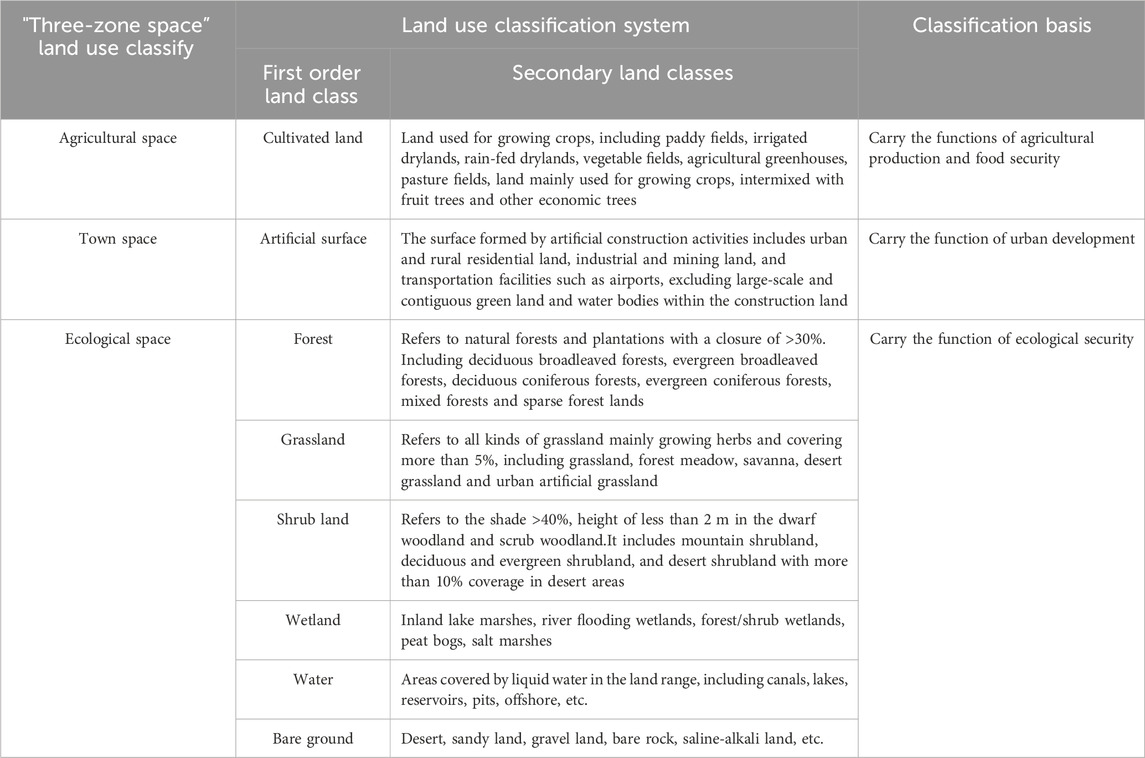
TABLE 2. Classification of land use types in the “three-zone space” of the Harbin-Changchun urban agglomeration.
3 Methodology
3.1 Land use transfer matrix
The land use transfer matrix was used to analyze the quantity, structure, and transformation of various land use types in the Harbin-Changchun urban agglomeration based on the “three spatial zones” land use classification system. With the help of ArcGIS10.8 software, the three phases of land use data were spatially overlaid to obtain cross-transformation data tables for the periods 2000–2010, 2010–2020, and 2000–2020, based on which a land use cross-transformation matrix was constructed. Its mathematical form is shown as follows (Eq. 1):
In this equation, where S is the area; I, and j are the land use types at the beginning and end of the study period respectively; n is the number of land use types.
3.2 Standard deviation ellipsoid and centre of gravity models
Standard Distance Elipse (SDE) (Also known as a directional distribution tool) It is mainly used to identify the distribution characteristics of the spatial elements of the country, where SDE represents the spatial distribution characteristics of economic factors, the long-axis direction and short-axis direction represent the primary and secondary trend directions of the spatial distribution of the factors respectively, and the long- and short-axis distances represent the extent to which the factors deviate from the centre of gravity in the primary and secondary trend directions (Zhang et al., 2022). The elliptical standard deviation equation is as follows Eqs 2–3:
In these equations P (xj, yj) are the coordinates of the centre of gravity of region j; the angle of rotation of the ellipse characterising the standard deviation is obtained from tanθ, i.e., the angle formed by a clockwise rotation in the due north direction to the long axis of the ellipse;
3.3 Construction of a comprehensive conflict index model for the “three-zone space”
In the process of rapid urbanization, the spatial changes of urban agglomerations are mainly characterized by two forms neighborhood advancement and urban area expansion (Yang et al., 2023). The land use conflict and the resulting landscape fragmentation are the spatial epitome of the conflict of interests and the transformation of the spatial carrying function of the country. Land use conflict systems are complex, fragile, and dynamic in nature (Jiang et al., 2021). Based on the existing research results, this paper constructs a comprehensive conflict index model based on the landscape pattern index of land use patches and measures the land use conflict degree (SCCI) from the complexity, vulnerability, and stability of the land use system with the help of Fragstats 4.2 software moving window method. The spatial conflict composite index is abstractly expressed as “complexity + vulnerability—stability” of the land use system, and all the indicators are normalized (Wang et al., 2022).
1) Spatial complexity index (CI): The intensification of land use conflict makes the spatial pattern of the natural landscape and the shape of various types of land patches tend to be complex, and a fractal is an effective tool and an important language to describe the spatial complexity of the spatial pattern of nature and the development of urban geographic phenomena (Zhou et al., 2015a), so the area-weighted average patch fractal dimension index (AWMPFD) is usually used as a measure of land use complexity. This is used to characterize the degree of disturbance to the measured patches by the process of land use change in neighboring patches, with the index ranging from [1,2], with larger values indicating more complex landscape patterns and more intense land use conflicts (Table 3).
2) Spatial vulnerability index (FI): The vulnerability of land use types reflects the degree of response and resistance of patches when they are subjected to internal and external pressures such as the degree and frequency of type conversion, and is usually measured by the landscape vulnerability index (Xu et al., 2021); the higher the vulnerability, the stronger the land use conflict. Existing studies have shown that ecosystems with simple food chain structures and low biodiversity indices are relatively vulnerable (Peng et al., 2020). From the perspective of landscape ecology and concerning existing results (Zhou et al., 2015a), the landscape vulnerability of the “three-zone spaces” is ranked from strong to weak as urban space, agricultural space, and ecological space (Wang et al., 2023); (Table 3).
3) Spatial stability index (SI): In general, the higher the degree of fragmentation of the spatial pattern of the landscape, the less stable and the stronger the spatial conflict (Jiang S et al., 2021), while the fragmentation of land use type patches is reflected in the clustering and increasing density of point-like space or the diffusion of linear space and the fragmentation of face-like patch space (Wang et al., 2023). Therefore, patch density (PD) is usually chosen to measure the land use stability index, with higher patch density leading to higher spatial fragmentation and therefore lower spatial stability (Table 3).
4) Analysis scale selection: The landscape pattern index is dependent on the scale of the patch cells, to avoid the loss of spatial information due to the large scale and the inaccuracy of the landscape index due to the small scale due to subjective selection, this paper takes into account the scale of the study area, the number of spatial patches and the information characteristics of the raster data, and selects 10,000, 15,000, 20,000, 25,000 In this paper, we select 10,000, 15,000, 20,000, 25,000, 30,000 and 30,000 m window cells and construct a fishing net, measure the landscape pattern index at each spatial scale and substitute it into the semi-variance function model (Bao et al., 2021), calculate the ratio of Nugget (C0) to Sill (C + C0) (C0/(C + C0)), refer to the conclusion of previous studies (Li et al., 2014), keep narrowing the interval for calculation, and finally select 18,000m, which is the first to reach a stable point, as the window cell. As a window unit, the study area was divided into 1224 fishnet units for the analysis and calculation of the spatial land use conflict index.
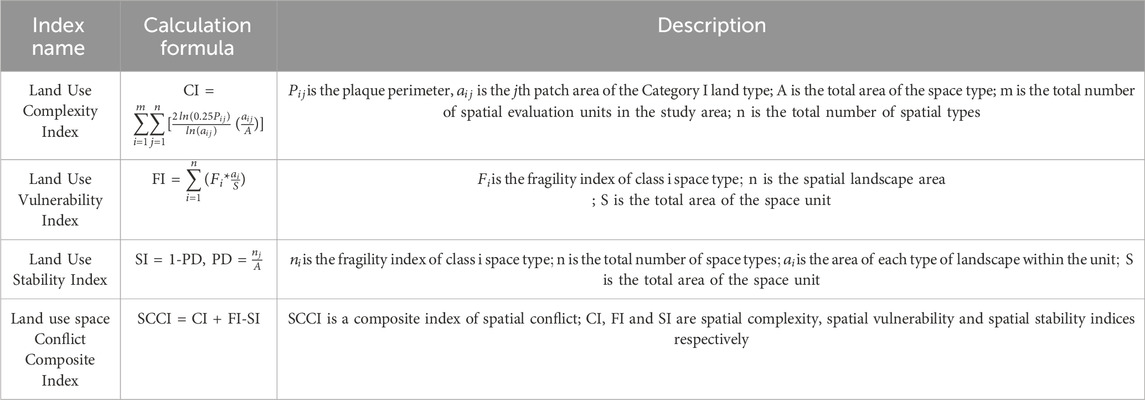
TABLE 3. Calculation of the composite land use spatial conflict index.
3.4 PLUS model
3.4.1 PLUS model core algorithm
The PLUS model is a CA model that integrates Land Expansion Strategy Analysis (LEAS) and multi-type random patch seeding (CARS) (Yang et al., 2023). The model is based on raster data and obtains the development probability of each type of land use within a unit image element and the contribution of drivers to land use expansion by mining land expansion transition principles and drivers, and predicts land use over time with the help of the Markov chain module. The Markov chain module is used to forecast the land use change matrix over time, and the spatiotemporal dynamic slab is automatically generated under the mechanism of seed generation and decreasing threshold. Compared with the traditional linear prediction and typical spatial causal models, the PLUS model with multiple types of patches effectively compensates for the difficulty of obtaining land use rules at specific time intervals and the lack of spatiotemporal dynamics and can simulate the simultaneous evolution of land use patches over time in a more realistic way (Liang et al., 2021).
3.4.2 Scenario setting
To effectively connect the dual evaluation technical paths, accelerate the optimal zoning of the geographical functions of urban, agricultural, and ecological spatial land use under the spatial pattern of the country, and then guide the descending scale of the main functional areas to conduct the task of promoting the delineation of the three zones and three lines (Fan, 2019), and achieve many of the visionary goals put forward in the “UN 2030 Agenda for Sustainable Development” (Guo et al., 2022). In this study, four scenarios of natural development: the priority of agricultural space, the priority of urban space, and the priority of ecological space are set up to simulate the spatial pattern of land use and changes in the Harbin-Changchun urban agglomeration in 2030, to realize the analysis of the diversity of scenarios of spatial conflicts in land use, and the scenarios are described as follows:
① Scenario A: Land use change under the natural development scenario does not take into account any human plans and public planning policies that limit and interfere with land use change, and by default evolves according to the characteristics of land use conversion under the historical scenario, with the transfer probability of each land use type remaining unchanged, without adjusting the parameters, and without setting any constraints in the simulation experiment, and using Markov chains to predict the demand for each type of land use in 2030, extending the original land weighting coefficients of the n weights from 2010 to 2020.
②Scenario B:Under the scenario of prioritizing agricultural space, starting from two parts of space, agricultural production and agricultural life, and in accordance with the “Double Evaluation Guidelines” (https://www.gov.cn/zhengce/zhengceku/2020-01/22/content_5471523.htm) and the “Harbin-Changchun urban agglomeration Development Plan” (https://www.ndrc.gov.cn/xxgk/zcfb/ghwb/201603/t20160311_962177.html), “All high-quality black soil arable land will be designated as permanent basic agricultural land, and special protection and spatial layout adjustment and optimisation will be carried out for it” “To establish a modern agricultural industry system, promote the integrated development of grain, warp and feed, agriculture, forestry, animal husbandry and fishery, and the integration of breeding, raising and processing, and optimize the agricultural industry structure and regional layout”, the permanent basic farmland and the main production areas of agricultural and forestry products shown in the documents of the Main Functional Area Planning of Heilongjiang Province and the Main Functional Area Planning of Jilin Province were vectorisation process to make them consistent with the scope of the study area, and merge them as prohibited development areas into the model; take the amount of high-standard arable land area in 2020 as the lower limit of land use demand, and the predicted value as the upper limit; in the setting of land use transfer rules, significantly increase the probability of transferring grassland, shrubland and wetland into arable land, appropriately increase the probability of transferring forest, bare land and artificial land surface, and restrict the transfer of arable land to other. In order to realise the principle of giving priority to agricultural space.
③Scenario C: Under the town space priority scenario, the national and provincial key development town clusters are vectorized in accordance with the scope of town spatial development suitability delineated in the “Dual Evaluation Guidelines”, so that they are consistent with the scope of the study area, and data on land use types closely related to human development activities, such as man-made surfaces and reservoir pits within the scope, are extracted as the functional areas of urban clusters, which are combined with national nature reserves and jointly set as Prohibited development zones are entered into the model. In the “Development Plan for the Harbin-Changchun Urban Agglomeration,” the spatial strategy of “developing in the same direction, upgrading the twin cores, extending north and south, expanding one axis, expanding openness and growing two belts” is followed. In the setting of land use rules, the probability of transferring arable land, shrub land, and forest land to man-made land is significantly increased, and the probability of transferring grassland and bare land is appropriately increased. Reduce or restrict the transfer of man-made surfaces to other land types, while increasing the value of man-made surface neighborhood weights. Realize the principle of prioritizing urban space for development.
④ Scenario D: Under the priority ecological space scenario, the first thing to ensure is that ecological space is not occupied. The Harbin-Changchun Urban Cluster Development Plan clearly emphasizes “the protection of arable ecological sub-regions, soil erosion control, wind and sand control, urban ecological landscape pattern, accelerated ecological restoration of old industrial areas and land reclamation.” In accordance with the classification of ecological service functional areas by the ecological protection importance assessment in the Dual Evaluation Guide, this study relies on the National Ecological Function Zoning (https://www.mee.gov.cn/gkml/hbb/bgg/201511/t20151126_317777.htm) to vectorize the national nature reserves and key ecological In this study, the land in national nature reserves and key ecological function zones was vectorized according to the National Ecological Function Zone Zoning (https://www.mee.gov.cn/xxgk2018/xxgk/xxgk06/202112/t20211215_964234.html), and the three types of land in provincial key ecological function zones, namely, forests, shrublands and water bodies, were extracted according to the Technical Guidelines for the Protection and Restoration of Ecological Buffer Zones of Rivers and Lakes (https://www.mee.gov.cn/xxgk2018/xxgk/xxgk06/202112/t20211215_964234.html). The three types of primary land within the provincial key ecological function areas were extracted, and a 60-m range around the site area was set as the ecological buffer zone (Su et al., 2022). The final scope is consistent with the scope of the study area, and the ecological function areas, nature reserves, and ecological buffer zones are finally combined into the input model of the prohibited development zone; the forest coverage rate is set to be no less than the 2020 standard (greater than 43.8%), and the area of grassland and bare land is constrained to account for no less than 2.5% of the total land area from the perspective of biodiversity. In the rule-setting, the probability of transferring arable land into ecological space is increased significantly, the probability of transferring man-made land into ecological space is increased appropriately, and the conversion between land types within ecological space follows the principle of transferring land types with low economic benefits to land types with high economic benefits. Strictly control the transfer of ecological space land to other land categories to realize the principle of prioritizing the development of ecological space.
3.4.3 Neighbourhood weight parameter setting
The neighborhood weight parameter represents the ability of the land type to expand itself as driven by external factors, with a threshold range of [0,1]. It is believed that the historical expansion pattern of each land type is the best representation of their respective expansion capacity. This paper draws on the historical scenario approach (Wang et al., 2019) from existing studies to set the neighborhood weights, calculated as follows (Eq. 4):
In this equation Where
4 Results
4.1 Analysis of the characteristics of the evolution of the spatial-temporal pattern of the three regions from 2000 to 2020
4.1.1 Changes in the structure and scale of the spatio-temporal pattern of the “three-zones space”
From the land use distribution map for 2000–2020 (Figure 3), it can be seen that the distribution of the “three-zone space” in the Harbin-Changzhou urban agglomeration has significant geographical and functional structural characteristics: 1) urban space formed along the Harbin-Daqing-Qiqihaer-Mudanjiang development belt and the Changchun-Jilin-Tumen development belt, with the cities of Harbin and Changchun as the main development axis. 2) The agricultural space formed by the Songnen Plain and the Sanjiang Plain, which provide agricultural and forestry products; 3)The ecological space formed around the Great and Small Xing’an Mountains, the Changbai Mountains and the Zhang Guangcai Ridge, with the wind and sand control, water conservation and soil conservation as the main functions, There is also some ecological space located at the confluence of the Nengjiang, Songhua, and Ussuri Rivers, with biodiversity conservation and flood storage as the main functions.
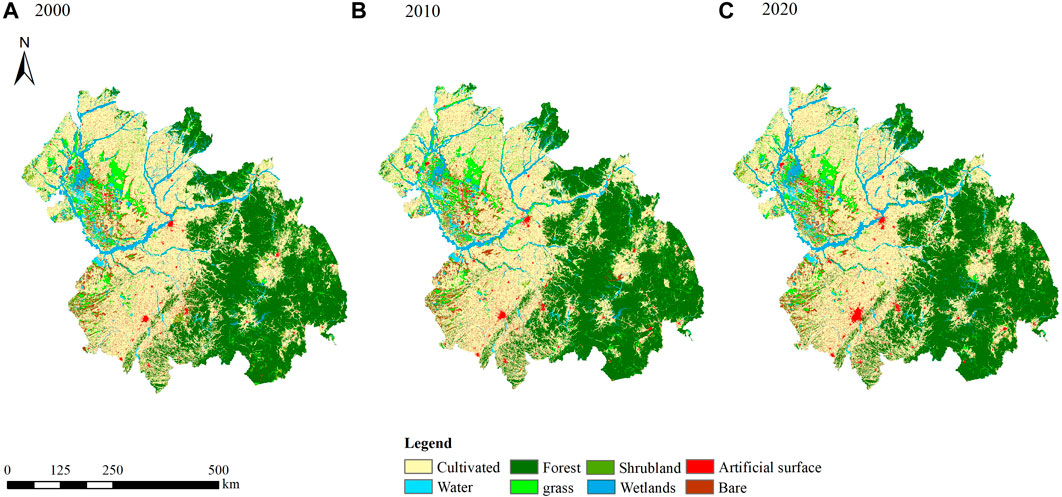
FIGURE 3. Land use classification maps for 2000 (A), 2010 (B) and 2020 (C).
In general, ecological space and agricultural space occupy the main part of the space, and the proportion of the two types of space in the total area is about 86%, while urban space accounts for a relatively small proportion, except for the urban space around the main axis of development of Harbin and Changchun city, which is distributed in agglomeration, the rest of the area as a whole shows a scattered dotted layout.
It can be seen from Figure 4 that the overall distribution structure of the “three-zone space” of the Harbin-Changchun urban agglomeration did not change significantly during the period 2000–2020, while the spatial evolution of various types of space is more characteristic.
1) Unlike other regions in Northeast China where agricultural space has decreased significantly, the scale of agricultural space in the Harbin-Changchun urban agglomeration decreased first and then increased, with a decrease of 2.29% in the first 10a and an increase of 6.48% in the second 10a. The spatial scale of agriculture has increased by 627.14
2) The scale area of ecological space continues to decrease, with a cumulative reduction of 2137.42
3) The expansion of urban space is the largest. In the past 20 years, the space has continued to expand in the southeast direction along the development axis of Harbin-Daqing-Qiqihaer-Mudanjiang, which is consistent with the spatial pattern planning guidance of “dual core, one axis, and two belts” for urban clusters in recent years: With Harbin and Changchun as the core pole, and with the Harbin, Daqing and Qiqihaer Railway as the link, it gradually radiates along the northwest and southeast direction to drive the development belt of the two major cities of “Harbin-Daqing-Qiqihaer-and Mudanjiang” and “Changchun-Jilin-Tumen,” creating a network pattern of axial and belt connectivity. From 2000 to 2010, the urban space increased by 7.31%, and the spatial center of gravity moved to the northeast by 3,852 m. The expansion scope of the two provincial capitals of Harbin and Changchun and some surrounding areas were relatively concentrated, with a large scale, but the expansion volume of other areas was relatively low, especially the urban space coverage in the northeast of Mudanjiang City and the southeast of Yanbian Korean Autonomous Prefecture was small. In addition to the continuous concentrated expansion of provincial capital cities, a large number of urban Spaces have been generated in Qiqihar, Daqing, and Mudanjiang in the northwest. In 20a, the urban space in the urban agglomeration increased by 13.13%, with a total increase of 1,488.85 km2. The spatial center of gravity moves eastward and southward, and the difference between the ellipse and the axis of urban space is the largest, and the dynamic migration direction is the most obvious. However, the ellipse area does not change much, the coverage of space expansion is limited and the dispersion is low.
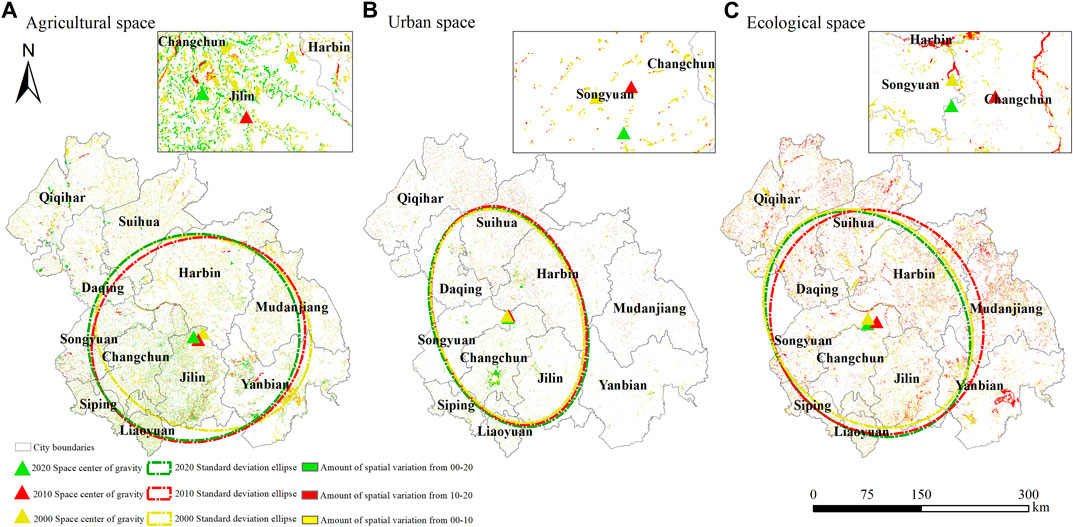
FIGURE 4. Spatio-temporal dynamics of the “three-zone space”. (A) Agricultural space (B) Urban space (C) Ecological space.
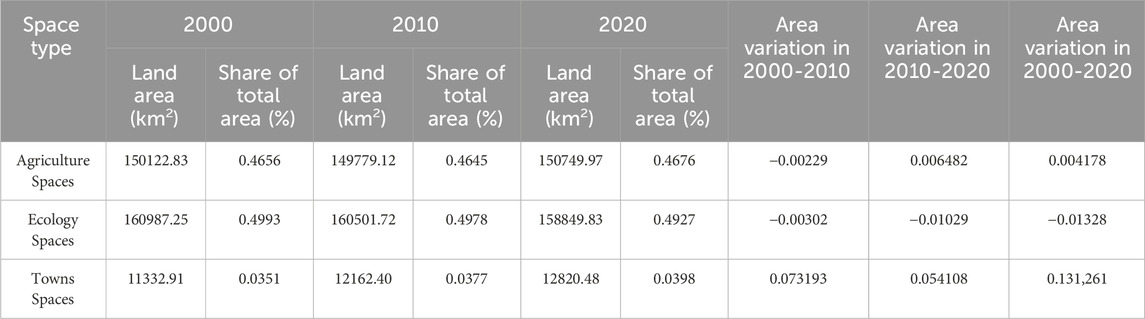
TABLE 4. Land use area and share from 2000 to 2020.
4.1.2 Cross-conversion features of “three-zone space”
The Arcgis10.8 software was used to calculate and analyze the scale and direction of the spatio-temporal dynamic cross-transformation of the “three-zone space” of the Harbin-Changchun urban agglomeration from 2000 to 2020 (Figure 5), and statistical data of various spatial cross-transformation in 20a (Table 5) were collected. According to the main functional zoning planning of the two provinces and the national ecological function zoning documents, the characteristics of various spatial transformations were analyzed respectively from the conversion direction, conversion scale, and conversion position:
1) The conversion scale of agricultural space and ecological space is the most significant 9,508.89 km2 of ecological space was transformed into agricultural space, and the agricultural space had a net inflow of 1,927.54 km2 from ecological space. From the perspective of longitudinal time series, 13,309.98 and 13,776.63 km2 of these two types of spatial land participated in the transformation in the first 10a, respectively, while the conversion scale in the second 10a was relatively small. The conversion areas of the two types of space mainly occurred in the main agricultural production areas such as the western Songnen Plain, the main forest product production areas such as the central part of Jilin and the northwest part of Heilongjiang Province, and the national nature reserves. In the context of the rapid expansion of urban space in the past 20 years, the urban space of Harbin-Changchun urban agglomeration has still carried out a large-scale transfer to agricultural space, accounting for 88.7% of the total urban space transfer scale, which is a rare cross-conversion feature in northeast China compared with other regions of China. Urban space transfer areas are mainly concentrated in the outlying rural areas far away from the built-up areas and high-quality farmland, while the key development areas near the main urban areas are less distributed.
2) The expansion of urban space mainly comes from agricultural space, and the outflow of ecological space is relatively low. In the past 20a, agricultural space conversion land accounted for more than 85% of the new urban space, especially in Changchun and Jilin. In the first 10a, the agricultural space conversion scale reached 4,271.37 km2, accounting for nearly 90% of the new urban space. The latter 10a saw a slight decline in the scale of conversion under the policy constraint of the State’s proposal to protect the construction of basic farmland and the vigorous development of functional areas for agroforestry products. In general, the transformation of agricultural space and ecological space to urban space is along the direction of northwest to southeast, but the direction of ecological space transformation is more obvious. The agricultural spatial conversion center moved 16,024 m to the southeast, while the ecological spatial conversion center moved eastward and northward. The spatial conversion area gradually approached the main producing areas of agricultural and forestry products and ecological protection function areas from the surrounding areas of the key and core development zones of the urban agglomeration, and the derivative of urban space and the encroachment on other spaces became gradually obvious.
3) The conversion of ecological space mainly depends on agricultural space. In the past 20 years, 7,581.35 km2 of agricultural space has been converted into ecological space, with a relatively discrete distribution; The scale of urban spatial transformation is small, mainly concentrated in the Greater and Lesser Hing’an Mountains, the southern part of the Sanjiang Plain and near key ecological functional areas, and the transformation center gradually shifts to the east.

FIGURE 5. Spatio-temporal dynamics of the “three-zone space” crossover. (A) 2000–2010 (B) 2010–2020 (C) 2000–2020.
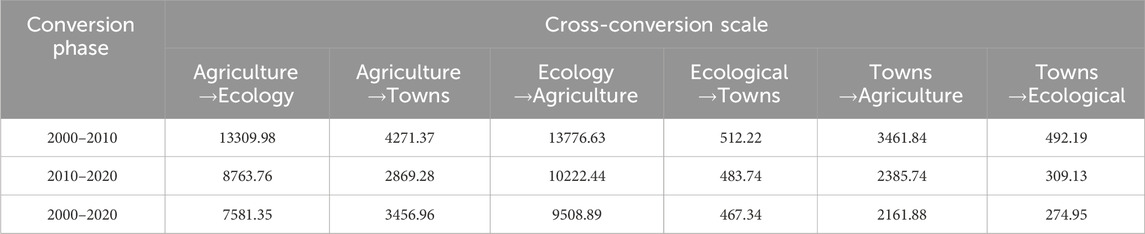
TABLE 5. Dynamic cross-transformation data of the “three district space” from 2000 to 2020.
4.2 The spatial and temporal evolution of the conflict in the “three-zone space”
Taking into account the definition of the core area in the Development Plan of Harbin and Changchun Urban Agglomerations and the division of the core-periphery structure of Harbin and Changchun Urban Agglomerations by existing studies, dividing Daoli district, Nangang district, Daowai district, Xiangfang district, Pingfang district, Songbei district, Acheng district and Shuangcheng district in Harbin City; Saltu district, Longfeng district Ranghulu district, Honggang district of Daqing City; Chaoyang district Nanguan district, Kuancheng district, Erdao district, Lvyuan district, Jiutai district of Changchun City, and Changyi district, Longtan district, Chuanying district and Fengman district of Jilin City, a total of 22 regional units into core areas, while the rest are peripheral districts (Zhang and Qi, 2018). The spatial comprehensive conflict index of land use represents the conflict degree of three types of Spaces. According to the distribution characteristics of the cumulative frequency curve of spatial conflict index and the evolution law of the inverted “U” shaped curve model of spatial conflict (Zhou et al., 2022), this study adopts the equal spacing method to divide the comprehensive index of land use spatial conflict into: There are four grades: stable and controllable [0,0.25), basically controllable [0.25,0.5), basically out-of-control [0.5,0.75) and seriously out-of-control [0.75,1.0]. Then, Arcgis10.8 is used to conduct a fishnet unit analysis of land use spatial conflicts (Figure 6).
1) From the perspective of spatial distribution structure, the seriously out-of-control areas are mainly distributed around the core areas of the central part of the urban agglomeration, such as the main axis line of Harbin and Changchun and the development belt of Harbin-Daqing-Qiqihar-Mudanjiang. Among them, the spatial conflicts in the main urban areas of Changchun and Harbin are the most serious and concentrated, and the conflicts in Changchun are the most extensive. Except for the major out-of-control areas in the main urban areas, the basic out-of-control areas spread to the surrounding counties and towns along the administrative division. And with the main urban area as the core, it spreads to the surrounding areas until it connects with the out-of-control area of Harbin City in the north to form an “out-of-control belt.” Compared with the core area, there are fewer serious out-of-control areas in the peripheral areas, and the basic out-of-control areas are presented in the shape of a dot, set in it: the spatial conflicts are strongest in the central and northern parts of Siping City and Liaoyuan City, and the southeastern part of Songyuan City; the spatial conflict at the junction of municipalities is more significant, Mudanjiang City and Yanbian Korean Autonomous Prefecture which are located in the southeastern part of the urban agglomeration only have a large distribution of runaway areas in the center of the City By summarizing the spatial characteristics of conflict zones, it can be found that out-of-control zones, especially serious out-of-control zones, are concentrated in urban spatial areas and spread to peripheral areas with administrative centers as the core. The spatial conflicts near the major river systems are also intensified, the ecological and agricultural spaces near the Songhua River and Nenjiang River basins are frequently transformed, and the regions with weak conflicts are mainly distributed in the key ecological functional areas and national nature reserves in the northwest and east, among which the spatial conflicts in the forest ecological functional areas of Changbai Mountain in the east are the weakest, and the controllable area units account for 72.3% of the total units. The remaining controllable areas are mainly in the outer contour areas of urban agglomerations and are relatively discrete.
2) From the perspective of dynamic change of spatial conflict pattern (Table 6 and Figure 7), the intensity of conflict in 20a “three-zone space” showed a trend of first increasing and then decreasing, in which the basic controllable area decreased first and then increased, the number of stable controllable area units decreased year by year, and the scale of reduction increased from 1.9% to 2.7%. The controllable area reduction area was mainly located in the agricultural and ecological space around the municipal administrative center. The proportion of out-of-control areas has changed from 30.09% in 2000 to 38.65% in 2010, and 34.26% in 2020. The number of out-of-control areas in the first 10a has increased dramatically, and the number of seriously out-of-control areas alone has increased by 58 pcs. From the distribution map, the additional units are mainly distributed in the core area of urban agglomeration and its surrounding agricultural space. After 10a, the number of runaway zones declined, but the scale of the reduction was smaller, The reduction area is mainly concentrated in the main production areas of agricultural and forestry products, key ecological function areas and nature conservation areas of the Sanjiang Plain outside the urban agglomeration, conflicts in some agricultural spaces and most ecological spaces far from the core areas were alleviated, while in the central and southern part of the Songnen Plain, the concentration of basically out-of-control and seriously out-of-control units along the main axis of the development of Harbin-Changchun continued to increase.
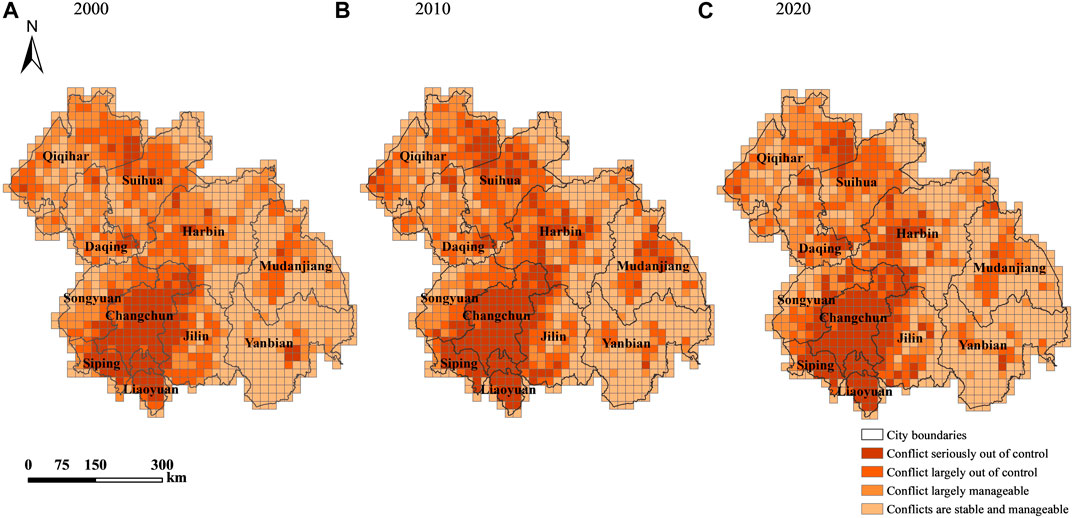
FIGURE 6. Conflict pattern distribution characteristics of the “three-zone space” in 2000 (A) 2010 (B), and 2020 (C).
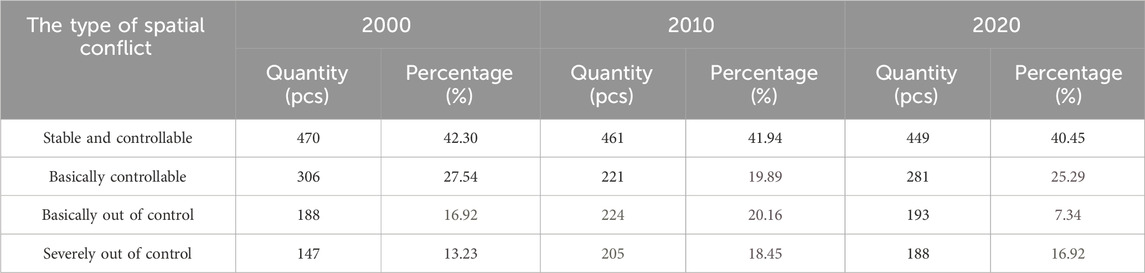
TABLE 6. Conflict index data for the “three-zone space” from 2000 to 2020.
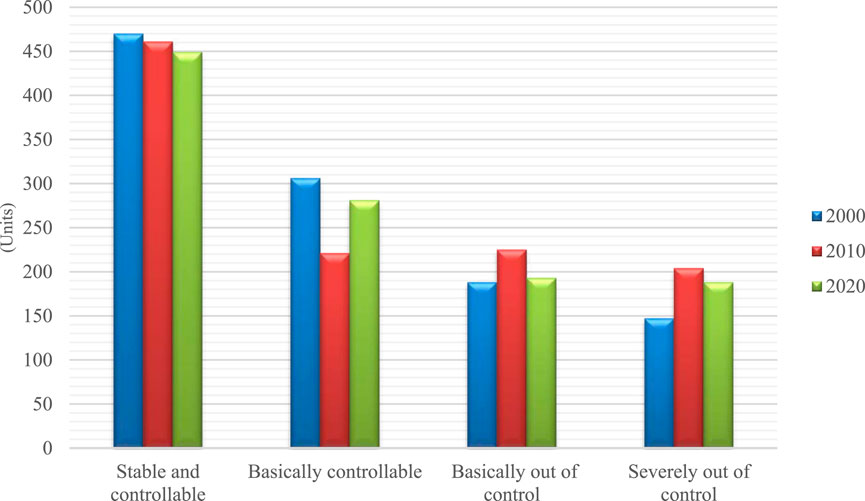
FIGURE 7. Conflict index table.
The dynamic change of spatial conflict pattern is closely related to the interference of human activities during urban development and construction. In the past 20 years, due to the rapid development of urbanization, and industrialization, the core area of urban agglomerations has a dense population, relatively concentrated industrial distribution, high urbanization level, and relatively developed economy, while the peripheral area is mainly distributed with rural settlements and lacks industrial types. Cultivated land has become the core production factor in rural areas, so a large amount of reclaimed agricultural land is spread around. With the continuous spillover of population and industry, a large number of “satellite cities” have been derived from the periphery of the core area. With the continuous outward expansion of urban built-up areas, agricultural space is invaded by urban space on a large scale, the transformation scale of ecological space and urban space is gradually significant, and the fragmentation and complexity of spatial patches are increasing, thus leading to the increasingly intensified conflict of “three-zone space” in this region. In 2018, the central government required provincial and municipal people’s governments to demarcate the main functional areas. The protection of basic farmland and agricultural and forestry product areas should be strengthened, and the development restriction of ecological protection areas should be enhanced. The spatial conflicts in the study area are generally alleviated as a result, but the conflicts in the core area and its surrounding areas are still serious.
4.3 Multi-scenario simulation results of “three-zone space”
4.3.1 Accuracy verification
After the Extract Land Expansion module built-in PLUS model was used to extract the raster data of land expansion from 2000 to 2010, the selected driver data set was added to the LEAS module, the random forest decision tree was set as the default value 20, the sampling rate was 0.01, and the number of trained RF features was 30. The random forest algorithm was used to mine each type of land use expansion and driving factors one by one, and the contribution data of driving factors and the suitability atlas of eight land use types were obtained. The land use type suitability atlas and 2010 land use distribution grid data were input into the CARS module to simulate the spatial distribution of land use in 2020, and the results were compared with the real data. The Kappa coefficient of the image was 0.88, the overall accuracy was 0.95, and the model prediction accuracy was excellent. On this basis, the spatial distribution of land use in 2030 was simulated concerning the set rules of multi-scenario simulation and the distribution pattern of “three-region space” was obtained after reclassification (Figure 8) (Table 7). Cross-conversion data of various types of land use from 2020 to 2030 were calculated and a string diagram was drawn (Figure 9).
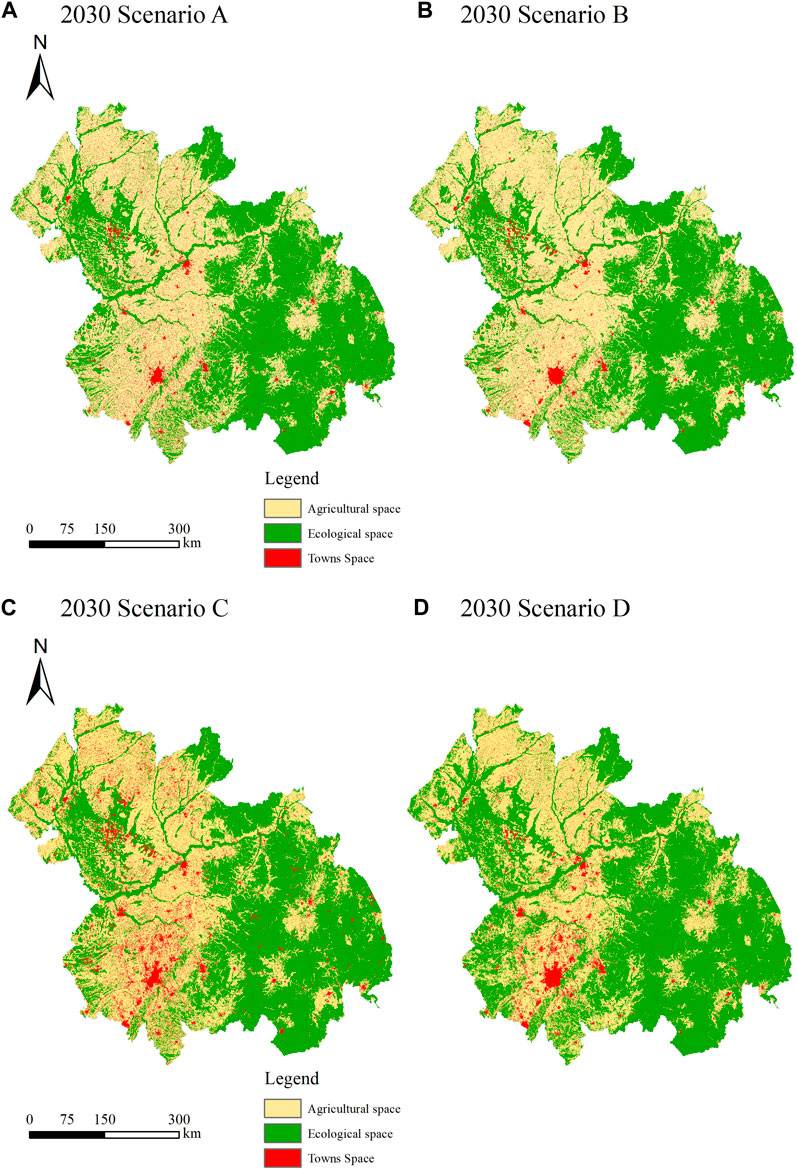
FIGURE 8. Distribution of the “three-zone spatial” pattern of the Harbin-Changchun urban agglomeration under multiple scenarios in 2030. (A) 2030 Scenario A (B) 2030 Scenario B (C) 2030 Scenario C (D) 2030 Scenario D.
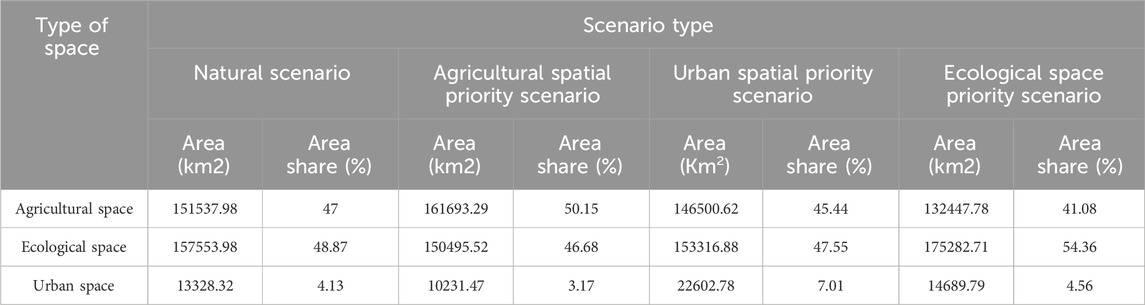
TABLE 7. Distribution data of “three-zone space” pattern under multi-scenario simulation.
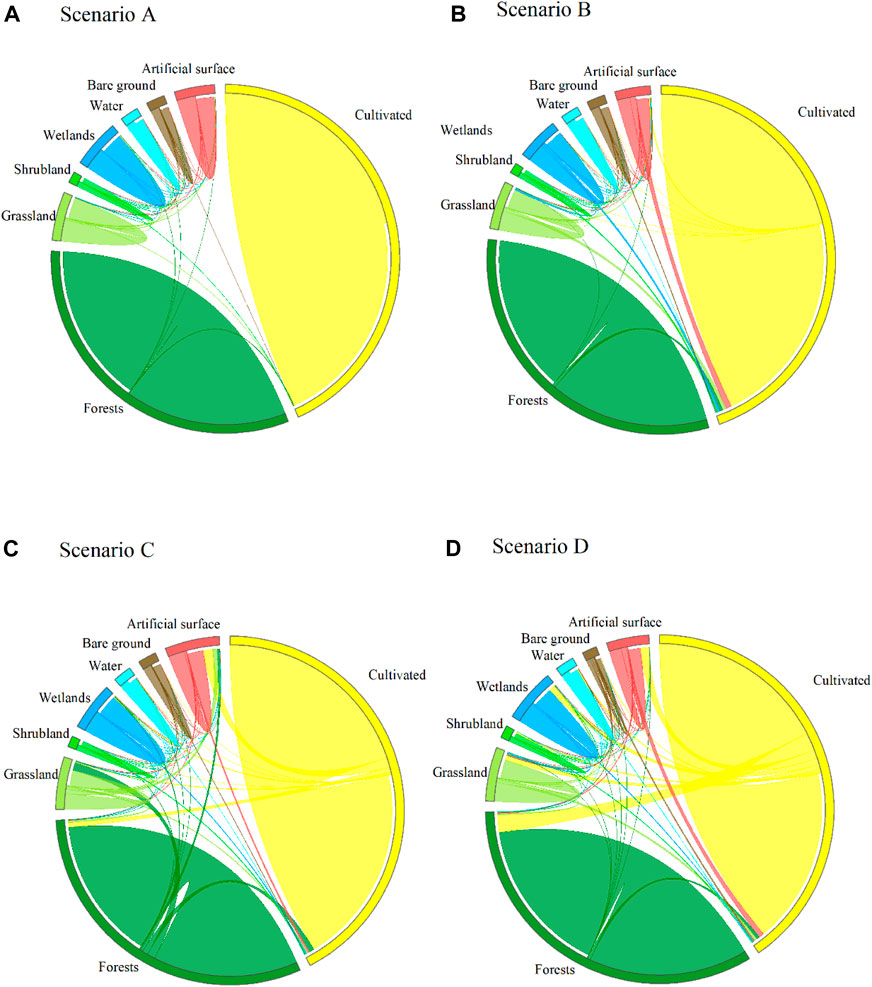
FIGURE 9. Land use transfer chord diagram for the Harbin-Changchun urban agglomeration under the multi-case simulation for 2020–2030. (A) Scenario A (B) Scenario B (C) Scenario C (D) Scenario D.
4.3.2 Distribution pattern of “three-zone space” under multi-scenario simulation
Combined with Figures 8, 9 it can be seen that: compared with 2020, there is no significant structural change in the spatial pattern of the three regions under the natural development scenario, with agriculture and ecological space as the main body, but there are significant differences in spatial distribution characteristics in the priority scenarios of agriculture, urban and ecological space. Among the four scenarios, the conversion scale of grassland, cultivated land, forest land, wetland, and artificial land surface is more obvious, while other land types have little change, as shown in
1) under the natural development scenario, the agricultural, ecological and urban spatial area of the Harbin-Changchun urban agglomeration in 2030 will increase by 788.01 km2, decrease by 1,295.84 km2, and increase by 507.84 km2 compared with 2020. Ecological space as the main turn-out space in which the grassland area changed the most, decreasing by 1,039.88 km2, and the main outflow direction was wetland and artificial surface. The proportion of agricultural space is almost the same as that in 2020; With the continuous development of urban agglomeration, the urban space continues to increase, with the proportion of space rising from 3.97% to 4.13%. However, with an average growth rate of 0.04% over the last 10a, the rate of expansion has become slower than in the past, the expansion area occurs mainly in the south-eastern part of Daqing City linking the main axis of Harbin-Changchun urban agglomeration.
2) Under the agricultural space priority scenario, the agricultural space 10a increased by 10,943.32 km2, which was 13.71 times of that under the natural development scenario, and the expansion effect was significant. The proportion of ecology and urban space decreased by 2.58% and 0.8% respectively, and the urban space scale stopped expanding. In terms of spatial cross-conversion, the expansion of agricultural space mainly comes from ecological space. A total of 6,722.31 km2 of ecological space is transformed into agricultural space, among which the conversion of grassland into cultivated land accounts for the largest proportion, but the conversion area of artificial surface single land type accounts for 61.40% of the total land conversion area of the six types of ecological space. From the perspective of transformation position, the agricultural spatial expansion effect of provincial key urban group development zones and forest ecological function zones is remarkable.
3) Under the urban space priority scenario, the urban space 10a increased by 9,782.30 km2, and the space proportion increased from 3.97% to 7.01%. The increase in area was 12.41 times that under the natural development scenario, and the average annual growth rate increased to 0.7%, indicating a strong expansion of urban space. At this time, the agricultural space and ecological space were reduced by 4,249.35 and 5,532.94 km2 respectively. In terms of spatial cross-conversion, the conversion area of agricultural space to urban space is the largest, accounting for 67.02% of its total growth area. For the ecological space, the scale of grassland conversion is the largest. From the perspective of conversion position, urban spatial growth regions are concentrated in the central and western parts of urban agglomerations: The large-scale transformation of agricultural space along the railway formed a “strip urban space belt.” Nearly 82% of agricultural space in Nongan County, Dehui City, and Yushu City in the north of Jilin City was transformed into urban space, forming an “urban space network” with Changchun City and Jilin City as the core and spreading to the surrounding areas, while the urban space expansion in Qiqihar City and Suihua City was relatively uniform. In the eastern region, the expansion is mainly scattered, and the agricultural space around the core built-up areas of districts and counties in Mudanjiang City and Yanbian Korean Autonomous Prefecture and the ecological space close to the residential areas are transformed on a large scale.
4) Under the ecological space priority scenario, the ecological space 10a increased by 16,432.89 km2, and the space proportion increased from 49.26% to 54.3.6%. The growth area is 12.6 times of that under the natural development scenario. Unlike other scenarios, while the ecological space increases rapidly, the urban space also expands significantly, increasing by 1,869.31 km2. In terms of spatial cross-conversion, agricultural space is the main source of ecological space, in which the area of arable land to the forest is the largest and most extensive, and the scale of conversion between different land types in ecological space is small. Of these, the largest scale of conversion is between bare ground and grassland. In terms of the conversion position, the expansion of ecological space mainly occurred in the flat Songnen plain in the central and western part of the urban agglomeration, and the water content was relatively sufficient in the Nenjiang and Songhua River basins, while the expansion scale in the eastern part was relatively small.
4.3.3 Multi-scenario simulation of land use conflict distribution characteristics in the “three-zone space”
The multi-scenario simulation “three-zone space” data in 2030 was imported into the Arcgis10.8 software to create a fishing net, and the comprehensive conflict index of “three-zone space” in 2030 was measured with the Fragstats4.2 software moving window method, to obtain the spatial conflict pattern of the Harbin-Changchun urban agglomeration under four types of scenarios (Figure 10). The results show that (Table 8):
1) Under the natural development scenario, there is no significant change in the distribution structure of the “three-zone space” conflict pattern compared to 2020, and the number of units in the out-of-control zone continues to decline, while the stable and controllable zone remains the largest in terms of scale but also experiences the largest reduction among the four conflict zones. In addition to the mutual transformation between the seriously out-of-control area and the basic out-of-control area, there are also some seriously out-of-control areas located at the edge of the peripheral area and the core area that are directly developed into the basic out-of-control area. However, under this scenario, the number of units in the seriously out-of-control area exceeds the basic out-of-control area for the first time, significant growth at administrative district boundaries. It is evident that the spatial conflicts in the core area and surrounding area are constantly intensified with the improvement of urbanization level and urban expansion. Resolving conflicts and reducing the seriously uncontrolled areas will require a considerable amount of time.
2) Agricultural spatial priority scenario was the most ideal simulation result for spatial conflict control among the four types of scenarios. The number of units in the severely out-of-control area decreased by 62 compared with the natural development scenario, and the total number of units in the out-of-control area decreased by 52 compared with the natural development scenario, accounting for only 26.37% of the total number of the areas. The highly concentrated and seriously out-of-control areas in the main axis of the development of Harbin and Changchun have been significantly reduced, and the spread of conflict to the surrounding areas has also been curbed. Most of the areas in the core area have been transformed from the seriously out-of-control areas to basic out-of-control area or controllable areas, especially the controllable area of the conflict area in the development zone of Harbin, Daqing, and Qing has been significantly expanded. In the peripheral areas, only Siping City and Liaoyuan City still have a certain scale of serious out-of-control areas.
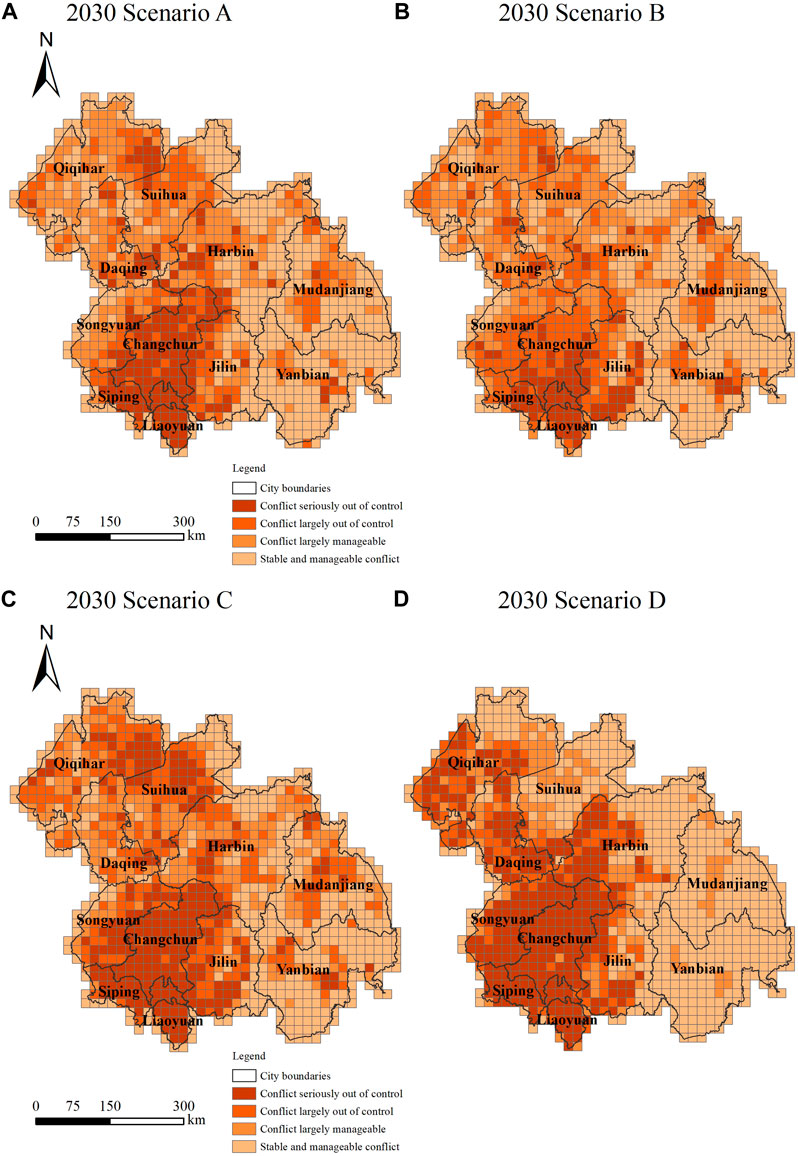
FIGURE 10. Spatial conflict pattern of the “three-zone space” in the Harbin-Changchun urban agglomeration under multiple scenarios in 2030. (A) 2030 Scenario A (B) 2030 Scenario B (C) 2030 Scenario C (D) 2030 Scenario D.
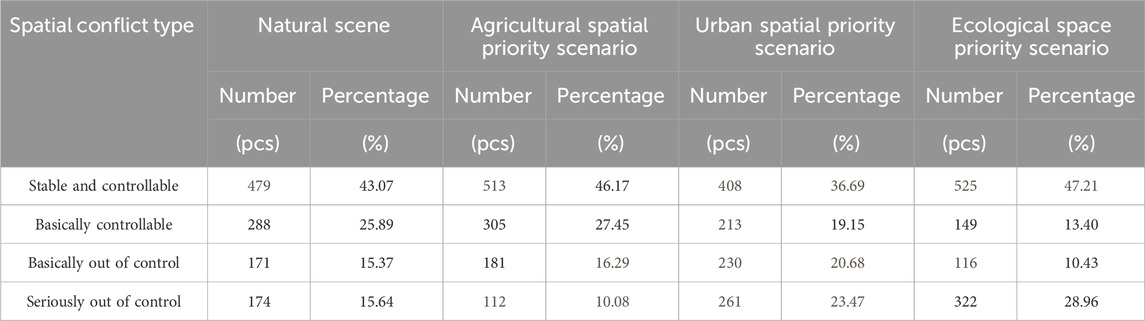
TABLE 8. Comprehensive conflict index of “three-zone space” in Harbin-Changchun urban agglomeration under multi-scenario simulation.
The priority scenario of agricultural space aims to protect basic farmland and ensure agricultural and forestry product supply, from the perspective of ensuring national food security and improving comprehensive agricultural productivity. As the insufficient supply of mainland sources for urban spatial expansion. After the development of agricultural space is limited, the urban expansion process slows down with it, thus alleviating the aggravation of the contradiction between man and land. However, while fully protecting agricultural space, this scenario also delays the development process of urbanization.
3) In the urban spatial priority scenario, the “three-zone space” conflict is the most intense, and the total number of out-of-control district units is 491, an increase of 112 space units compared with 2020. The proportion of space area increased by 9.36% compared with the natural development scenario. The spatial conflicts in the main built-up areas and the surrounding counties and towns are intensified, and the spatial conflict layout structure has obvious attributes of urbanization core expansion. The conflict in the core area is the most serious, and the out-of-control area expands dramatically. Harbin and Changchun are the two growth centers, and significant diffusion effects are generated in both radial and axial directions. The basic out-of-control area distributed in key development areas and urban groups has undergone a large-scale transformation to the severely out-of-control area. The original conflict-controllable “buffer zone” between the two poles is connected with each other to form a “seriously out-of-control gathering area” of spatial conflicts. In the outer areas, the conflicts between Qiqihar City and Suihua City developed strongly along the direction of the development belt of Ha-Da-Qi-Mu.
Urban spatial priority is crucial for adapting to the future economic development situation, strengthening the spatial connection between medium satellite cities and key small towns, and ensuring the steady progress of urbanization level. National key development urban groups are given priority development rights, which makes urban space large-scale encroachment on surrounding ecological and agricultural land, and the complexity and fragmentation of land patch landscape pattern significantly increase the conflicting index. Such a scenario is an extreme pursuit of economic benefits at the expense of agricultural and ecological rights.
4) Under the ecological space priority scenario, the structure of the “three-zone space” conflict pattern was significantly different from other scenarios, and the areas of the stable and controllable conflict zones and the seriously out-of-control conflict zones increased significantly. There are 322 units in the serious conflict zone and 525 units in the stable controllable conflict zone, accounting for the largest proportion among the four scenarios. The layout of spatial conflicts is seriously extreme: the out-of-control conflict zones are distributed in the core areas of urban agglomerations and the industrial corridor of Harbin-Daqing-Qiqihar, of which 75.8% are seriously out-of-control areas. In the outer regions, Mudanjiang City, Suihua City, the whole of Yanbian Korean Autonomous Prefecture, and the northern region of Qiqihar are in the range of controllable conflict zones, of which 77.9% are stable controllable areas. The basic controllable area and the basic out-of-control area are mainly distributed in the middle transition zone of the two types of conflict Spaces and near the urban agglomeration contour area.
The ecological space priority scenario is an important scenario to promote the transformation of urban agglomeration from extension and expansion to connotation and promote the harmonious and sustainable development of man and nature. National nature reserves and key ecological function areas have been fully protected, while another ecological land has been given priority for development. Under ecological protection measures such as returning farmland to forests and grasslands, the ecological space of forests and grasslands has expanded significantly, with the highest level of forest and grass area. In space competition, the artificial land surface is at the priority level (Chen, W et al., 2023), resulting in an increase in urban space area. As the mainland supply area, agricultural space is invaded by both urban and ecological space, resulting in a severe impact on landscape pattern, which results in a high coincidence between spatial conflict pattern and agricultural spatial distribution.
5 Discussion and conclusion
5.1 Discussion
The fundamental purpose of land use conflict research is to prevent and eliminate potential conflicts in the future. Compared with the static characterization of the land use conflict pattern and the exploration of the driving factors in the existing studies (Liu et al., 2022; Ma et al., 2022) the evolutionary patterns of the three types of spaces are firstly accurately portrayed and discussed in detail from two dynamic dimensions, namely, time and space, in terms of physical and quantitative changes in this paper. And discovers the potential rules of spatial evolution that have been neglected in the previous studies, These are the factors that cannot be ignored in land use conflict management. However, few studies have paid attention to this basic work.
In terms of simulation research on urban land expansion, existing studies mostly focus on the improvement of model precision and accuracy verification (Qiao et al., 2023) while there is a lack of discussion on how the simulation results can effectively support the determination of urban planning and management policies. In this paper, in accordance with the requirements of the content of the “Harbin-Changchun Urban Agglomeration Development Plan,” four scenarios of urban space priority, agricultural space priority, and ecological space priority and natural development are set up, rationalize the setting of restricted development zone, and the four simulation scenarios ensure the upper limit of the occurrence of conflict, the status quo, and the lower limit, identify the potential conflict areas and form a contrasting effect among each other, so that the decision makers can obtain the results under different scenarios, and formulate reasonable conflict control policies according to the differentiated characteristics of different regions.
1) The research results demonstrate that agricultural space represented by cultivated land is the core resource and key area contested by different interest subjects in the process of land development and utilization, and it is also a high-incidence area where spatial conflicts arise and escalate (Haregeweyn et al., 2012). In the process of urban expansion, urban space has a large amount of encroachment upon agricultural space. Under ecological protection measures such as returning farmland to forest and grassland, cultivated land also should provide the place for the sustainable and healthy development of ecological environment. Agricultural spatial pattern directly determines the pattern of spatial conflicts to some extent.
2) The spatial conflicts in the Harbin-Changchun urban agglomeration have slightly eased in 2010 and 2020, but the regions with reduced conflict levels were mainly distributed in the peripheral areas. The spatial conflicts caused by urban spatial expansion in the core and surrounding areas were difficult to produce significant reverse resolution effects through policy-oriented means in a short period of time, reflecting obvious distance effects. The scenario setting of single space priority can satisfy the control of conflict scale in the study area, but cannot balance the distribution of multiple spatial rights and conflict locations.
Based on the above analysis of the prediction results of different simulation scenarios, optimization strategies are proposed in the following aspects:
① Overall planning of the “three-zone space” layout and implementing the urban optimization model for the core area of urban agglomerations. It is an inevitable trend that the spatial conflict in the core area of urban agglomerations will intensify. Therefore, the efficient and intensive use of space within the core area, the rational planning and configuration of industrial and infrastructure space layout, and the promotion of industrial structure upgrading while limiting the unbridled expansion of the built-up area. Strictly control the amount of construction land to reduce the space conflict caused by the outward diffusion of the core area.
② Implementation of a comprehensive development model for satellite towns and villages outside the core area. The satellite towns mainly undertake the overflow industries and population of the main urban area, but they are in the transition zone between urban space and agricultural space. The dual benefits of economic development and agricultural protection should be realized comprehensively, so the production and construction of land and agricultural land should be integrated to achieve intensive utilization. In addition, a regional buffer zone is set up between rural settlements, high-quality cultivated land, and basic farmland to delay the high-intensity conflict between urban space and agricultural space.
③ Strict cultivated land protection mode shall be implemented in the range of high-quality cultivated land, permanent basic farmland and main producing areas of agricultural products to avoid the loss of high-quality cultivated land and ensure food security and stability.
④ Implement ecological protection models within key ecological functional areas and nature reserves, strictly implement ecological protection red lines, and formulate hierarchical management and control policies to strengthen the protection of ecologically fragile areas.
⑤ Implement the urban development model in peripheral areas such as Mudanjiang City and Yanbian Korean Autonomous Prefecture, Appropriate expansion of urban spatial scale in areas with the relatively concentrated distribution of conflict controllable areas, strengthen economic and industrial development in built-up areas, and make up for the limited economic increment in the core area, so as to achieve the balance of social and economic benefits of the entire urban agglomeration.
5.2 Conclusion
This paper takes the perspective of “three-zone space” as the pointcut, and selects 2000, 2010, and 2020 as observation nodes, portrays the Harbin-Changchun urban agglomeration from the dimensions of “transformation scale” and “landscape pattern,” quantitatively describes the spatio-temporal dynamic changes of land use distribution and spatial conflict pattern of the urban agglomerations in the past 20 years, and combines the PLUS model with multiple scenarios to simulate the conflict evolution trend, draws the following conclusions:
1) The land use spatial pattern of the Harbin-Changchun urban agglomeration is highly consistent with the main functional areas. Agricultural and ecological spaces are mainly distributed in the central and eastern regions, while urban space is distributed along the Harbin-Daqing-Changji-corridor development zone with Harbin-Changchun as the development axis. In the past 20 years, urban space has continued to expand outwards, and agricultural space has become the main source, resulting in a large loss of high-quality farmland. At the same time, the scale of cross-conversion between agricultural space and ecological space is the largest, mainly in the main producing areas of agricultural and forestry products and national nature reserves, with the cross-conversion center shifting to the southeast. Relatedly, the spatial conflict pattern of the Harbin-Changchun urban agglomeration is closely related to the trajectory of human development activities. Areas with out-of-control conflicts are concentrated in core areas with high levels of economic development and dense population, while key ecological functional areas and nature reserves in the northwest and east are areas with the weakest conflicts. In the past 20 years, the intensity of conflicts in the “Three-zone space” has shown a trend of first increasing and then decreasing. However, in ecological functional areas far away from the city, conflicts are increasingly becoming more extreme. Although the promotion of national policies and measures has alleviated spatial conflicts, the problem of agricultural and ecological spatial deprivation in the core area is still an inevitable contradiction.
2) Simulation and prediction results indicate distinct distribution differences in the “three-zone space” under various scenario planning. Under the natural development scenario, ecological and agricultural space still dominate, and spatial transformation remains relatively balanced. Although urban space continues to expand, the growth rate has slowed down. However, under the scenario of giving priority to the development of urban and ecological space, the “three-zone space” pattern has changed significantly. Agricultural space has been greatly encroached, and the proportion has dropped sharply. Only under the scenario of giving priority to agricultural space, the agricultural area will increase. And urban space is reduced. Agricultural space and urban space show opposite trends in spatial transformation, and the competition between them is particularly fierce. Under the four scenarios, the overall conflict pattern of the “three-zone space” showed a spatio-temporal distribution pattern of “high in the south, low in the north, high in the west, low in the east, and with high in the core, low in the periphery, high in the plains, and low in the mountains.” The conflicts in the urban space priority scenario are the most intense. The proportion of out-of-control areas is the highest in 30 years, and it spreads disorderly to the surrounding areas. The contradiction between man and land is acute. The agricultural spatial priority scenario has the best control effect on spatial conflicts. Although serious conflict areas still exist in Siping City and Liaoyuan City, the spatial conflicts in the core area are significantly reduced. Under the ecological space priority scenario, conflict areas, stable controllable areas, and severely out-of-control areas show a highly concentrated and polarized distribution in the east and west, while the basically out-of-control areas and basically controllable areas are located in the intermediate transition zone.
Research results show that the continued deterioration of land use conflicts in core areas is an inevitable development trend. Agricultural space represented by cultivated land is the core resource and key area that different stakeholders compete for in the process of land development and utilization. As urban space is expanding on a large scale, it is also constantly transforming outwards, it has always shown an opposite development trend to the agricultural space. There is no optimal solution to the land use model that can achieve balanced and coordinated development of urbanization, food production and ecological protection. Therefore, in the next 10 years, the government should formulate differentiated land use policies for core and peripheral areas, giving priority to ecological environment improvement and Reasonable layout of regional space and optimization of spatial configuration for regional economic transformation. Promoting governments at all levels to further carry out land use optimization research and policy innovation is of great significance to promoting the coordinated and sustainable development of the Harbin-Changchun urban agglomeration.
Data availability statement
The original contributions presented in the study are included in the article/supplementary material, further inquiries can be directed to the corresponding author.
Author contributions
WZ: Conceptualization, Data Curation, Methodology, Software, Investigation, Formal Analysis, Writing–Original Draft, Visualization. BG: Conceptualization, Supervision, Project administration, Writing–review and editing. HS: Visualization, Investigation, Software, Validation, Writing–review and editing. ZL: Resources, Supervision, Validation
Funding
The author(s) declare this research was supported by the National Natural Science Foundation of China (42201272)
Conflict of interest
The authors declare that the research was conducted in the absence of any commercial or financial relationships that could be construed as a potential conflict of interest.
Publisher’s note
All claims expressed in this article are solely those of the authors and do not necessarily represent those of their affiliated organizations, or those of the publisher, the editors and the reviewers. Any product that may be evaluated in this article, or claim that may be made by its manufacturer, is not guaranteed or endorsed by the publisher.
References
Adam, Y., Pretzsch, J., and Darr, D. (2015). Land use conflicts in Central Sudan: perception and local coping mechanisms. Land Use Policy 42, 1–6. doi:10.1016/j.landusepol.2014.06.006
Allen, C., Reid, M., Thwaites, J., Glover, R., and Kestin, T. (2020). Assessing national progress and priorities for the Sustainable Development Goals (SDGs): experience from Australia. Sustain Sci. 15, 521–538. doi:10.1007/s11625-019-00711-x
Alston, L. J., Libecap, G. D., and Mueller, B. (2000). Land reform policies, the sources of violent conflict, and implications for deforestation in the Brazilian Amazon. Econ. Manag. 39 (2), 162–188. doi:10.1006/jeem.1999.1103
Andrew, J. S. (2003). Potential application of mediation to land use conflicts in small-scale mining. Clean. Prod. 11 (2), 117–130. doi:10.1016/s0959-6526(02)00032-x
Bao, W., Yang, Y., and Zou, L. (2021). How to reconcile land use conflicts in mega urban agglomeration? A scenario-based study in the Beijing-Tianjin-Hebei region, China. J. Environ. Manag. 296, 113168. doi:10.1016/j.jenvman.2021.113168
Brown, G., and Raymond, C. M. (2014). Methods for identifying land use conflict potential using participatory mapping. Landsc. Urban Plann. 122, 196–208. doi:10.1016/j.landurbplan.2013.11.007
Chen, Z., Lu, C., and Fan, L. (2012). Farmland changes and the driving forces in yucheng, north China plain. J. Geogr. Sci. 22, 563–573. doi:10.1007/s11442-012-0947-9
Chen H, H., Yang, Q., Su, K., Zhang, H., Lu, D., Xiang, H., et al. (2021). Identification and optimization of production-living-ecological space in an ecological foundation area in the upper reaches of the Yangtze River: a case study of Jiangjin District of Chongqing, China. Land 10 (8), 863. doi:10.3390/land10080863
Chen W, W., Zhang, Q., Kong, X., Duan, X., Zuo, X., Tan, M., et al. (2021). Optimization rules of provincial permanent basic farmland layout based on "Three-line" overall planning and empirical research. Trans. Chin. Soc. Agric. Eng. 37 (15). (in chinese). doi:10.11975/j.issn.1002-6819.2021.15.030
Chen, W., Wang, G., Gu, T., Fang, C., Pan, S., Zeng, J., et al. (2023). Simulating the impact of urban expansion on ecosystem services in Chinese urban agglomerations: a multi-scenario perspective. Environmental Impact Assessment Review 103, 107275. doi:10.1016/j.eiar.2023.107275
De Groot, R. (2006). Function-analysis and valuation as a tool to assess land use conflicts in planning for sustainable, multi-functional landscapes. Landsc. Urban Plann. 75 (3–4), 175–186. doi:10.1016/j.landurbplan.2005.02.016
De Jong, L., De Bruin, S., Knoop, J., and van Vliet, J. (2021). Understanding land-use change conflict: a systematic review of case studies. J. Land Use Sci. 16 (3), 223–239. doi:10.1080/1747423x.2021.1933226
Dong, G., Ge, Y., Jia, H., Sun, C., and Pan, S. (2021). Land use multi-suitability, land resource scarcity and diversity of human needs: a new framework for land use conflict identification. Land 10 (10), 1003. doi:10.3390/land10101003
Fan, J. (2019). Spatial organization approach of regional function-structure: discussion on the implementation of the functional zoning strategy in territorial spatial planning. Geogr. Res. 38 (10), 2373–2387. (in chinese). doi:10.11821/dlyj020190865
Guo, R., Wu, T., Wu, X., Luigi, S., and Wang, Y. (2022). Simulation of urban land expansion under ecological constraints in harbin-changchun urban agglomeration, China. Chin. Geogr. Sci. 32, 438–455. doi:10.1007/s11769-022-1277-1
Haregeweyn, N., Fikadu, G., Tsunekawa, A., Tsubo, M., and Derege, T. M. (2012). The dynamics of urban expansion and its impacts on land use/land cover change and small-scale farmers living near the urban fringe: a case study of Bahir Dar, Ethiopia. Landsc. Urban Plan. 106 (2), 149–157. doi:10.1016/j.landurbplan.2012.02.016
Jiang, S., Meng, J., Zhu, L., and Cheng, H. (2021). Spatial-temporal pattern of land use conflict in China and its multilevel driving mechanisms. Sci. Total Environ. 801, 149697. doi:10.1016/j.scitotenv.2021.149697
Kim, I., and Arnhold, S. (2018). Mapping environmental land use conflict potentials and ecosystem services in agricultural watersheds. Sci. Total Environ. 630, 827–838. doi:10.1016/j.scitotenv.2018.02.176
Li, D., Ding, S., Liang, G., Zhao, Q., Tang, Q., and Kong, L. (2014). Landscape heterogeneity of mountainous and hilly areas in the western Henan Province based on the moving window method. Acta Ecol. Sin. 34 (12), 3414–3424. (in chinese). doi:10.1109/Geoinformatics.2013.6626190
Liang, X., Guan, Q., Clarke, K., Liu, S., Wang, B., and Yao, Y. (2021). Understanding the drivers of sustainable land expansion using a patch-generating land use simulation (PLUS) model: a case study in Wuhan, China. Comput. Environ. Urban Syst. 85, 101569. doi:10.1016/j.compenvurbsys.2020.101569
Liu, H., Soares-Filho, B. S., Leite-Filho, A. T., Zhang, S., Du, J., and Yi, Y. (2023). How to balance land demand conflicts to guarantee sustainable land development. Iscience, 26 (5), 106641. doi:10.1016/j.isci.2023.106641
Liu, X., Zhang, Z., Li, M., Fu, Y., and Hui, Y. (2022). Spatial conflict simulation of land-use based on human-land-landscape elements intercoordination: a case study in Tianjin, China. Environ. Monit. Assess. 194 (5), 317. doi:10.1007/s10661-022-09947-0
Ma, G., Li, Q., Yang, S., Zhang, R., Zhang, L., Xiao, J., et al. (2022). Analysis of landscape pattern evolution and driving forces based on land-use changes: a case study of Yilong Lake watershed on Yunnan-Guizhou Plateau. Land 11 (8), 1276. doi:10.3390/land11081276
Ma, W., Jiang, G., Chen, Y., Qu, Y., Zhou, T., and Li, W. (2020). How feasible is regional integration for reconciling land use conflicts across the urban–rural interface? Evidence from Beijing–Tianjin–Hebei metropolitan region in China. Land Use Policy 92, 104433. doi:10.1016/j.landusepol.2019.104433
Meimei, W., Zizhen, J., Tengbiao, L., Yongchun, Y., and Zhuo, J. (2023). Analysis on absolute conflict and relative conflict of land use in Xining metropolitan area under different scenarios in 2030 by PLUS and PFCI. Cities, 137, 104314. doi:10.1016/j.cities.2023.104314
Nyangena, W. (2000). Land tenure, land use, environmental degradation and conflict resolution. A PASIR analysis for the narok district, Kenya.
Peng, K., Jiang, W., Deng, Y., Liu, Y., Wu, Z., and Chen, Z. (2020). Simulating wetland changes under different scenarios based on integrating the random forest and CLUE- S models: a case study of Wuhan urban agglomeration. Ecol. Indic. 117, 106671. doi:10.1016/j.ecolind.2020.106671
Peterseil, J., Wrbka, T., Plutzar, C., Schmitzberger, I., Kiss, A., Szerencsits, E., et al. (2004). Evaluating the ecological sustainability of Austrian agricultural landscapes—the SINUS approach. Land Use Pol. 21 (3), 307–320. doi:10.1016/j.landusepol.2003.10.011
Qiao, W., Hu, B., Guo, Z., and Huang, X. (2023). Evaluating the sustainability of land use integrating SDGs and its driving factors: A case study of the Yangtze River Delta urban agglomeration, China. Cities 143, 104569. doi:10.1016/j.cities.2023.104569
Rahman, M. R., Shi, Z. H., and Chongfa, C. (2014). Assessing regional environmental quality by integrated use of remote sensing, GIS, and spatial multi-criteria evaluation for prioritization of environmental restoration. Environmental monitoring and assessment 186, 6993–7009. doi:10.1007/s10661-014-3905-4
Ran, N., Jin, X., Fan, Y., Xiang, X., Liu, J., Zhou, Y., et al. (2018). Research on "three-line" demarcation method based on land use conflict identification and coordination: a case study of Jintan District, Changzhou City. Resour. Sci. 40 (02), 284–298. doi:10.18402/resci.2018.02.06
Von Der Dunk, A., Grêt-Regamey, A., Dalang, T., and Hersperger, A. M. (2011). Defining a typology of peri-urban land-use conflicts–A case study from Switzerland. Landsc. urban Plan. 101 (2), 149–156. doi:10.1016/j.landurbplan.2011.02.007
Wang, B., Tian, J., and Wang, S. (2022). Process and mechanism of transition in regional land use function guided by policy: a case study from Northeast China. Ecol. Indic. 144, 109527. doi:10.1016/j.ecolind.2022.109527
Wang, X., Wang, D., Gao, W., Lu, J., and Jin, X. (2023). Investigation of spatial coupling coordination development: identifying land system states from the adaptation–conflict perspective. Int. J. Environ. Res. Public Health 20 (1), 373. doi:10.3390/ijerph20010373
Wang, Y., Fan, J., and Zhou, K. (2019). Optimized zoning of territorial functions based on the integration of "double evaluation. Geogr. Res. 38 (10), 2415–2429. (in chinese). doi:10.11821/dlyj020190327
Wehrmann, B. (2008). Land conflicts: a practical guide to dealing with land disputes. Eschborn: GTZ.
Wei, W., Yin, L., Xie, B., and Bo, L. (2023). Evolution characteristics and mechanism of "three-zone space" in the Yellow River Basin under the background of territorial spatial planning. Econ. Geogr. 42 (03), 44–55+86. doi:10.13249/j.cnki.sgs.2023.02.014
Wei, W., Yin, L., Xie, B., and Bo Liming, (2022). Evolution characteristics and mechanism of "three-zone space" in the Yellow River Basin under the background of territorial spatial planning. Econ. Geogr. 42 (03), 44–55+86. doi:10.15957/j.cnki.jjdl.2022.03.005
Wubie, A. M., de Vries, W. T., and Alemie, B. K. (2021). Synthesizing the dilemmas and prospects for a peri-urban land use management framework: evidence from Ethiopia. Land Use Policy 100, 105122. doi:10.1016/j.landusepol.2020.105122
Xie, H., et al. (2023). Study on the extent and spatial pattern differentiation of terraced land in China. Acta Geogr. Sin. 78 (01), 3–15. doi:10.11821/dlxb202301001
Xu, W., Wang, J., Zhang, M., and Li, S. (2021). Construction of landscape ecological network based on landscape ecological risk assessment in a large-scale opencast coal mine area. J. Cleaner Production 286, 125523. doi:10.1016/j.jclepro.2020.125523
Yang, J., Yang, S., Li, J., Gong, J., Yuan, M., Li, J., et al. (2023). A distance-driven urban simulation model (DISUSIM): accounting for urban morphology at multiple landscape levels. Cities 134, 104156. doi:10.1016/j.cities.2022.104156
Yang, S., and Su, H. (2022). Multi-scenario simulation of ecosystem service values in the guanzhong plain urban agglomeration, China. Sustainability 14, 8812. doi:10.3390/su14148812
Yang, Y., Bao, W., Li, Y., Wang, Y., and Chen, Z. (2020). Land use transition and its eco-environmental effects in the beijing–tianjin–hebei urban agglomeration: a production–living–ecological perspective. Land 9, 285. doi:10.3390/land9090285
Yu, B., and Lu, C. (2006), Land use conflict analysis: concepts and methods. Adv. Geogr. Sci. (03), 106–115. (in chinese). doi:10.3969/j.issn.1007-6301.2006.03.013
Zhang, S., and Qi, Y. (2018). Study on core-periphery structure and development stage judgment of Harbin and Yangtze River Agglomerations. Sci. Geogr. Sin. 38(10):1699–1706. (in chinese). doi:10.11821/dlyj020210375
Zhang, Y., Jiang, P., Cui, L., Yang, Y., Ma, Z., Wang, Y., et al. (2022). Study on the spatial variation of China’s territorial ecological space based on the standard deviation ellipse. Frontiers in Environmental Science 10, 982734. doi:10.3389/fenvs.2022.982734
Zhou, D., Xu, J. C., and Wang, L. (2015a). Progress and prospects of land use conflict research in China in the past 15 years. China Land Sci. 29 (02), 21–29. doi:10.13708/j.cnki.cn11-2640.2015.02.003
Keywords: three-zone space, urban spatial expansion, land-use conflict, spatial-temporal dynamic patterns, multi-scenario simulation, Harbin-Changchun urban agglomeration
Citation: Zheng W, Guo B, Su H and Liu Z (2024) Study on multi-scenarios regulating strategy of land use conflict in urban agglomerations under the perspective of “three-zone space”: a case study of Harbin-Changchun urban agglomerations, China. Front. Environ. Sci. 11:1288933. doi: 10.3389/fenvs.2023.1288933
Received: 05 September 2023; Accepted: 19 December 2023;
Published: 05 February 2024.
Edited by:
Hualin Xie, Jiangxi University of Finance and Economics, ChinaCopyright © 2024 Zheng, Guo, Su and Liu. This is an open-access article distributed under the terms of the Creative Commons Attribution License (CC BY). The use, distribution or reproduction in other forums is permitted, provided the original author(s) and the copyright owner(s) are credited and that the original publication in this journal is cited, in accordance with accepted academic practice. No use, distribution or reproduction is permitted which does not comply with these terms.
*Correspondence: Wei Zheng, zw597404460@xauat.edu.cn