Quantifying interactions in the water-energy-food nexus: data-driven analysis utilizing a causal inference method
 Behdad Saed
 Amin Elshorbagy
 Saman Razavi
- 1Department of Civil, Geological, and Environmental Engineering, University of Saskatchewan, Saskatoon, SK, Canada
- 2Global Institute for Water Security, University of Saskatchewan, Saskatoon, SK, Canada
- 3International Institute for Applied Systems Analysis (IIASA), Laxenburg, Austria
- 4School of Environment and Sustainability, University of Saskatchewan, Saskatoon, SK, Canada
- 5Institute for Water Futures, Mathematical Sciences Institute, Austlralian National University, Canberra, NSW, Australia
Introduction: There is a pressing need for a holistic approach to optimize water-energy-food (WEF) resources management and to address their interlinkages with other resources due to population growth, socio-economic development, and climate change. However, the structural and spatial extent of the WEF system boundaries cause exponential growth in computational complexity, making exploratory data analysis crucial to obtain insight into the system’s characteristics and focus on critical components.
Methods: This study conducts a multiscale investigation of the WEF nexus within the Canadian prairie provinces (Alberta, Saskatchewan, and Manitoba), utilizing causal-correlational analysis and the multispatial Convergence Cross Mapping (mCCM) method. Initially, we employed regression analysis to establish equations, along with their coefficients of determination (R2), to identify patterns among pairs of WEF sectors, gross domestic product (GDP), and greenhouse gas (GHG) emissions. Subsequently, we conducted a causal analysis between correlated pairs using the mCCM method to explore the cause-and-effect relationships between sector pairs within the Canadian prairie provinces; both individually and as a single unit over the period 1990-2020.
Results and discussion: Results show that energy and water are the most influential sectors on GHG emissions and GDP in the prairies as a whole. Energy has a stronger influence on GHG compared to water and food sectors, while water has the strongest causal influence on the GDP of Alberta, and food and energy do so for Saskatchewan and Manitoba, respectively. The trade-offs for improving WEF nexus security strongly depend on the scale of the system under investigation, highlighting the need for careful deliberations around boundary judgment for decision-making. This study provides a better understanding of the WEF-GDP-GHG nexus in the Canadian prairies and existing interrelationships among the aforementioned sectors, helping to build more efficient WEF nexus models for further simulation and scenario analysis.
1 Introduction
As global water, energy, and food (WEF) demands are continuously increasing because of population growth, climate change, and the modernization of the human lifestyle, sustainable resource management has long been of prime importance. This has pushed societies to struggle with the planning and management of different resources under the stresses of changes in population, climate, and ecosystem (Brown et al., 2009; Saed et al., 2018; Wu et al., 2023). Resources management and planning should meet the current requirements and periodically be updated to adapt to future demands (Loucks and Beek, 1981). The Integrated Water Resources Management (IWRM) approach was developed to provide a platform capable of coordinating the sustainable development and management of water, land, environmental and other related resources in an integrated manner. For more than two decades, IWRM (Biswas, 2004; Loucks, 2009) has been used to address issues related to sustainable water management. However, IWRM did not improve much on water resource management as it is a water-centric approach (Benson et al., 2015). Water resources management is intrinsically related to the management of food and energy resources, and they need to be equally considered for holistic resources management. To that end, unlike the water-centric IWRM that considers the water sector as the main policy variable, multi-centric approaches were introduced to treat all sectors equally (Hoff, 2011; Si et al., 2019; Molajou et al., 2021a; Wu et al., 2021; Soleimanian et al., 2022).
Governments, policymakers, and non-governmental organizations (NGOs) have been trying to set different policies and make plans to improve WEF security. Sometimes, such policies and plans involve conflicts and do not align since these WEF resources influence each other. To overcome the problem, the World Economic Forum introduced ‘nexus thinking’ in 2011 for the first time to highlight the interdependency between different resources to offer conventional rights to water, energy, and food security (Waughray, 2011). WEF nexus is a systems-based framework considering WEF as interconnected and interdependent systems (Albrecht et al., 2018). Such a framework enables the analysis of either one-way or two-way interactions and interrelationships of subsystems within a nexus system (Akbari Variani et al., 2023; Vahabzadeh et al., 2023). The WEF nexus concept has a relatively more explicit scope of integration over the interacting water, energy, and food sectors compared to IWRM since it can allow interdisciplinary research to be implemented where IWRM has had limited success (Cai et al., 2018).
Many studies have been conducted to develop fundamental frameworks for WEF and other resources to investigate nexus problems and to design possible solutions to increase WEF security. By developing a WEF framework (Hoff, 2011), showed how a nexus approach can increase WEF security “by increasing efficiency, reducing trade-offs, building synergies, and improving governance across sectors”. The developed framework provides an important insight into a better understanding of WEF sectors’ linkages as well as the impacts of investment and climate change policies (Hoff, 2011). Many WEF frameworks, models, and diverse analytical tools have been developed since the Bonn conference (Pomeroy et al., 2013; De Strasser et al., 2016; Ghoreishi et al., 2023). Such models and tools have been utilized in many studies to understand and quantify interlinkages and address challenges in WEF and other related resources.
Abdelkader et al. (2018) have developed a water-food nexus model including the real and virtual water (VW) resources based on system dynamics modelling to inform decision making around food security in Egypt. In the water management model (real part), a food-water model was constructed based on agricultural, industrial, and municipal water consumption and land use. In the international VW trade model (virtual part), VW trade between Egypt and other countries was evaluated. Then, the water and food self-sufficiency of Egypt according to the past situation were assessed. Their study highlights the pivotal role of virtual water trade in effective water resources management. However, their VW trade model was limited to food production and ignored the part associated with the energy sector. To gain insight into the impacts of different policies on interactions between WEF subsystems in the shape of trade-offs and synergies, Wu et al. (2021) developed an integrated WEF nexus model using also system dynamics. The model, known as the WEF-Sask, has been applied to Saskatchewan in Canada. Different socio-economic and climatic scenarios, including irrigation expansion, changes in streamflow of transboundary (TB) rivers, bioenergy use for transportation, wind power expansion, and a joint impact of all scenarios have been considered in the WEF-Sask model to evaluate their impacts on WEF sectors. The interactions between WEF, climate change, and human interventions have been investigated based on the WEF-Sask model (Wu et al., 2021). Their investigation concluded that renewable energy expansion in Saskatchewan would significantly improve the nexus performance during 2021–2050. Furthermore, it would reduce total water demand and greenhouse gas (GHG) emissions. The spatial averages of the values of several parameters have been used in the WEF-Sask model for the sake of simplicity. This macro analysis perspective may produce results with less accurate estimates of nexus interactions at various scales.
Mahlknecht et al. (2020) conducted a qualitative description of the WEF nexus in Latin America to assess the trends in resource security. They tried to address sustainable development challenges to evaluate the current and future resource security by tracking the resource security trends within the WEF nexus context. Multiple indices were defined to explain the progress in WEF security and assess the interrelationships among WEF resources. They concluded that different economic strategies and technological solutions need to be put in place to enhance water and infrastructure governance and encourage inter-regional cooperation, which consequently can increase WEF security. Even though they examined the trends of WEF security over time, their WEF analysis was based on the average annual values of WEF sectors and did not include an assessment of the temporal influence of each resource on other resources. Nhamo et al. (2020) developed an analytical framework for WEF nexus using Analytic Hierarchy Process (AHP) to evaluate the progress toward associated sustainable development goals (SDGs) in South Africa. Multiple WEF nexus indicators were defined to evaluate the level of interactions and inter-relationships among WEF sectors to help policymakers with balancing and prioritizing components of complex systems.
Daher et al. (2019) emphasized the importance of understanding trade-offs associated with potential solutions and promoting informed dialogue between stakeholders, as a foundation for formulating localized policy recommendations for each hotspot. Another essential aspect is to bridge the research on the nexus concept and its actual application in policy- and decision-making communities, which was highlighted by (Dargin et al., 2019). They introduced a “complexity index” to measure the level of simplicity or complexity of nexus assessment tools. Their study revealed that tools with higher complexity level are better at capturing relationships details between specific resources, but struggling with handling higher number of components, in comparison with lower complexity tools. They noted that there is a shortage of tools for preliminary assessment capabilities, which could facilitate the communication of model outputs into actual decision-making.
Sušnik, (2015) used global data to regress countries’ Global Domestic Product (GDP) against different metrics of WEF resources. The study revealed that there is a strong relationship between GDP and WEF resources metrics. Then, based on the relationships between GDP and WEF subsystems, the future of water withdrawals, food production, and energy generation and consumption were estimated through multiple GDP growth scenarios. In another study, Sušnik, (2018) extended the previous work by adding new relationships between WEF-GDP sectors and developed a quantitative analysis framework to investigate the interactions among WEF and GDP sectors on a global scale using system dynamics modelling approach. Causality analysis was conducted by (Sušnik, 2018) to investigate the pattern of changes in WEF and GDP sectors and to measure the influence of the aforementioned sectors on each other at a global scale. However, detailed quantification of interactions between WEF, GDP, and environmental factors within a specific region (policy-relevant scales) containing multiple jurisdictional boundaries is lacking.
The WEF security nexus has been investigated across different scales in the literature. Many studies have been conducted at the global (D’Odorico et al., 2018; Sušnik, 2018; Næss et al., 2021) and national (Laspidou et al., 2020; Abdelkader and Elshorbagy, 2021; Campana et al., 2022) levels, and have not sufficiently addressed the local government perspective. Some other studies have been focused on the WEF nexus at the subnational level (Johnson et al., 2000; Valin et al., 2013; Ding et al., 2021; Kropf et al., 2021; Purwanto et al., 2021; Saed et al., 2022; Wen et al., 2022; Elkamel et al., 2023), each of which used a different modelling strategy to comprehend the intricate relationships between the water, energy, and food systems. Wang et al. (2023), for example, used a system dynamics approach in the Chinese province of Hunan to emphasize the integration of society, economy, and environment (SEE) systems into WEF nexus modelling. Their model aimed to bridge the science-policy divide by assessing policy concerns and targets and providing practical policy recommendations. Similarly, (Wen et al. (2022) utilized system dynamics modelling to analyze the effects of anthropogenic activities on the WEF nexus in Daqing City, China. They discovered that regulating anthropogenic activities and putting water conservation measures in place were essential for socio-economic development and the long-term preservation of natural resources.
Although these studies, conducted at the subnational level, have made valuable contributions to our understanding of the WEF nexus and provided specific policy recommendations, there is still a need for a more comprehensive assessment of the WEF nexus across multiple scales. The challenge lies in understanding how interactions and policies within the nexus are affected when the scale of analysis changes. This gap becomes more pronounced in cases where the study area includes multiple local governmental entities. For example, some studies at the provincial level have only focused on one province (Yi et al., 2020; Wu et al., 2021), and not on the interactions between riparian provinces with different government policies, which are sharing water through transboundary (TB) rivers. Therefore, it is essential to carry out a multi-scale analysis of the WEF nexus system to address this gap and arrive at a comprehensive understanding of the system.
The WEF nexus approach calls for including more sectors and more interactions (Molajou et al., 2021b), which requires expanding the boundaries of the systems, being analyzed or modelled, structurally and spatially. There are many studies in the literature in which WEF systems/models have been built to be more inclusive (Kraucunas et al., 2015; Nhamo et al., 2020; Afshar et al., 2022). However, this could compromise computational tractability, and discourage managers and policymakers (Lant et al., 2019). Therefore, there is a need for exploratory analysis to understand correlations and causations in nexus to be able to delineate the system boundaries and focus the analysis/modelling on the critical issues and components. Such exploratory analysis should precede any model development exercise. In this study, we aim to i) identify and quantify the interactions among WEF, economic, and environmental sectors at provincial and regional (i.e., prairie) scales; ii) assess which sectors have direct and indirect causal influences on others; and iii) measure the strength of the causality and prioritize complex interrelationships within the nexus system.
Our study provides unprecedented details of WEF-GDP-GHG interrelationships within a specific region by employing correlation-causality analysis within the nexus context. This provides an approach to elucidate challenges that might arise across different scales in the nexus approach and enables the evaluation to be made on the impact of the study’s scale on the WEF-GDP-GHG interrelationships. Historical data on WEF, GDP and GHG emissions associated with the prairie provinces were collected and analyzed to initially identify the pattern of changes in the above-mentioned sectors as well as their sub-sectors in any individual province and within the prairies as a single unit. WEF, GDP, and GHG nexus analysis was then conducted to identify and quantify the interactions and interlinkages among WEF, between WEF and GDP, and between WEF and GHG sectors in the prairies. In addition, based on identified and quantified trade-offs and synergies within the Canadian prairies, the contribution of each province to the prairies’ WEF security is highlighted.
2 Methodology
To measure the degree of relationships and explore the causal effects between each pair of WEF-GDP-GHG sectors, correlation and causality analysis are performed by utilizing the multispatial Convergence Cross Mapping (mCCM) method, a causal inference method (Sugihara et al., 2012; Clark et al., 2015; Runge et al., 2019). Such a causal inference method, in addition to the standard correlation analysis used in this study, have the potential to use available data in an exploratory way to identify critical components in complex systems prior to building extensive models or modelling frameworks. This will help with finding the dominant variables and sectors on both the provincial scale and a larger scale (Canadian prairies level) to help with a better understanding of WEF systems in the relevant decision-making process. The causality exploration approach demonstrated through this study for estimating causal relationships among WEF, GDP, and GHG has the potential to be applied to areas other than the WEF nexus.
2.1 Correlation and causality
The slopes of the best-fitted regression line through the data points (correlation analysis) can determine whether they are following a pattern and possibly can capture the polarity of causal influence (positive or negative polarity), in case there is a causal relationship between the variables, but not the strengths of causality. However, the correlation analysis is not sufficient to test that the change in one variable is the cause of the change in other variables. In other words, causation may occur in the absence of correlation, and correlation can occur in spite of the lack of causation (Chang et al., 2017). Therefore, it is necessary to use a proper approach to assess causal relationships to examine whether there is a cause-and-effect relationship among sectors and variables. In addition, determining the causal relationship between two variables helps policymakers with recognizing the dominant and leading variable to invest in. Identifying causal networks is crucial to making an effective recommendation in WEF resources management (Runge et al., 2019).
Causality is defined as the relation between two variables where the changes in one variable lead to the change in the other variables. Although the concept may look simple, the mathematical expression of the concept is complicated. Experimental assessment of causality can be costly, difficult to perform, or even impossible (Clark et al., 2015). Therefore, to assess the causality between two variables, causal inference tools have been developed in different studies. The causal inference tools have predominantly been developed in two fields: computer science and statistical economics. In the field of computer science, Pearl, (2009) developed conceptual causal models to describe the dynamics of the systems. Granger, (1969) in the field of economics, developed a model termed Granger causality (GC) based on the predictability of the effect variable (Y) when the cause variable (X) is known (Geweke, 1982; Schelter et al., 2006). In GC, the cause (X) always precedes the effect (Y), and cause (X) can therefore be used to predict effect (Y). In other words, one of the requirements of the GC is separability (independence of influences of causal variables), a property that is best suited for purely stochastic and linear systems (Sugihara et al., 2012). However, nonlinearity is ubiquitous in nature, therefore, to infer and quantify the causal relationships between intertwined variables within nonlinear systems, different methods have been developed and used both theoretically and numerically in the literature. These methods include the transfer entropy (Ma et al., 2014), conditional mutual information (Komárek et al., 2001), recurrence plots (Hirata and Aihara, 2010; Feldhoff et al., 2012), the nonlinear extension of GC, and different kinds of mutual nonlinear cross-map methods based on state-space reconstruction technique (Ma et al., 2014). For example, the mutual nonlinear cross-map methods (adopted in this study) have been used to detect causality in complex relationships of different systems (Sušnik van der Zaag, 2017) in various fields, such as ecological systems.
In this study, the general linear equation has been fitted to the data points to demonstrate the pattern of the change in an individual variable against any other variables of WEF resources, GDP, and GHG. This helped with the understanding of interactions between pairs of sectors in a region under study. Table 1 shows the five different variables considered in this study and their corresponding data source. Data used in this study have been gathered and analyzed on an annual time scale. Further details about collected data and their processing have been provided in Supplementary Section S1 of the supplementary document.
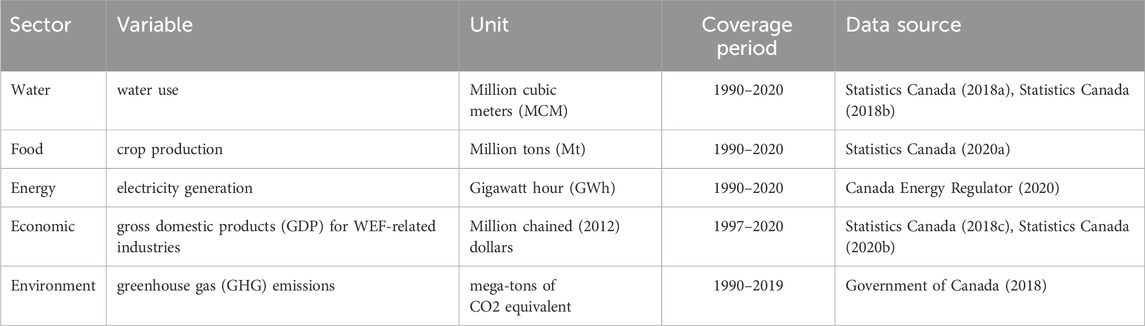
TABLE 1. A summary of resource variables (metrics), units, coverage period, and the source of the data used in this study, for further details see Supplementary Section S1 of the supplementary document.
2.2 Causal inference method
A causal inference method can help with recovering potential causal relations between a pair of variables. Convergent Cross Mapping (CCM) is a type of mutual nonlinear cross-map methods (Ma et al., 2014) developed by (Sugihara et al., 2012), which can be used to test the causal relationship between variables in dynamical systems. Sugihara et al. (2012) found that if two variables belong to the same dynamical system (i.e., variables are causally linked), the cross-mapping between them will be convergent (Chang et al., 2017). Convergence is a critical feature in the CCM technique that differentiates causation from correlation (Sugihara et al., 2012). According to CCM, if the causal variable (X) influences the affected variable (Y) then, the affected variable (Y) contains information about the causal variable (X) that can be used to predict (recover) causal variable (X). In other words, when X is cross-mapping to Y, CCM tests if Y is encoded in the shadow manifold for X. CCM is a viable numerical method for identifying the causal relations in even nonlinear, weakly coupled systems. CCM tests the causal relationship between two variables (X and Y) by measuring the extent to which the historical values of effect (Y) can reliably estimate the cause’s state (X). CCM is based on the idea that the correlation coefficient (rho or ρ) goes up with increasing the length (L) of the period of association. The higher convergence speed (time to stability) during the CCM process and a closer value of rho to 1 and −1 reflect a stronger causal relationship (Sugihara et al., 2012; Clark et al., 2015). It should be pointed out that the direction of cross-mapping is in the opposite direction of the cause-effect relationship (Chang et al., 2017). For instance, CCM from runoff (Q) to precipitation (P) indicates that P causes Q. The reason is that P as a cause variable driving Q, has left its footprints on Q, as an effect variable, and the footprints of P are transcribed on the history of Q. Therefore, Q can predict the recent history of P.
2.2.1 Convergent Cross Mapping (CCM)
The key idea of the CCM method is that the time series can be viewed as projections of the dynamic system behavior (Sugihara and May 1990; Stark et al., 2003). Projecting system state onto a coordinate axis helps to obtain the value of the corresponding state variable, and sequential projections over time can help with generating a time series for the variable (Tsonis et al., 2018). Conversely, having time series of variables can help with reconstructing a shadow manifold of the original system dynamics (true manifold). According to (Takens, 1981) Theorem, the attractor manifold of a multivariate dynamical system can be regenerated based on the different time-lagged coordinates of a single time series of one variable (i.e., time delayed embedding of X (X(t), X(t-τ), X(t-2τ), where τ denotes the time lag), instead of three time series of variables X(t), Y(t), and Z(t). In the same manner, lags of different variables (X, Y, and Z) can form their corresponding shadow manifold (MX, MY, and MZ). Takens, (1981) Theorem stated that the regenerated shadow manifold (MX, MY, and MZ) preserves the essential mathematical properties of the original dynamical system (true manifold M). Particularly, there is one to one mapping between true manifold (M) and MX, MY, and MZ. As shadow manifolds MX, MY, and MZ mapped one to one to the original manifold M, they also map one to one to each other, which means X, Y, and Z are causally related. In the other words, CCM method tests how well the local neighborhood of the first shadow manifold maps to the second shadow manifold’s local neighborhood.
The convergence of the correlation coefficient values between the original time series and estimated time series (X and X|MY or Y and Y|MX) is used as an indicator to evaluate the causality between time series. The convergence can be improved by increasing the length of the time series (L). CCM algorithm performs the following steps for causality detection from x→y as follows (Sugihara et al., 2012):
- Considering two time series (e.g., x and y) of length L:
- Generating shadow manifold Mx by forming the lagged-coordinate vectors X*(t) = <
- Finding the E+1 nearest neighbors of X*(t) in Mx to create a cross-mapped estimate of Y(t), denoted by
- Using the mentioned time indices corresponding to nearest neighbors to X*(t) on Mx to identify points in Y to estimate Y(t) from the weighted mean of the E+1 values in Y(ti) using Eq. (1) (Sugihara et al., 2012):
where Y(ti) are corresponding to Y values and
where
where
- Calculating the correlation coefficient
Where
- Checking the convergence of
A full explanation of the CCM method with its mathematical background is provided in (Sugihara et al., 2012).
Although CCM may perform relatively well in assessing the relative strength of causality using short time series with at least 30 sequential observations, larger time series are generally preferred to have good results, especially when the causal linkages are weak, or process noise and observation error are large (Ma et al., 2014; Clark et al., 2015). To overcome this limitation (Clark et al., 2015), built a novel test of significant causal relationships by combining the CCM method and dewdrop regression (Hsieh et al., 2008). This combination was then developed and named multispatial CCM (mCCM). They showed that the method can reliably discover the causal links with fewer sequential observations, even in the presence of process noise and observation error (Clark et al., 2015). mCCM helps with detecting causal associations by expanding the applicability of CCM to short time series that are spatially replicable, which are stitched together using bootstrapping (Hall and Martin, 1988), instead of a single long time series. In other words, spatial replication of data can help with detecting causal relationships from short time series. Furthermore, it picks up both direct and indirect causation and distinguishes between bidirectional and unidirectional relationships. The causal influence of the first variable on the second variable can be inferred if the skill of cross-mapping increases by the length of the time series (Tsonis et al., 2018).
The causal analysis between correlated pairs of WEF sectors, GDP, and GHG emissions are conducted using mCCM. In mCCM, additional data with similar statistical characteristics to observed/historical data are replicated to achieve more accurate results. For this replication, the best-fitted distribution analysis is used to quantify the variable degrees of scattering in the correlation of each pair of correlated sectors.
Figure 1 illustrates the detailed workflow of our methodology, showcasing how the theoretical framework has been effectively applied in the context of the specific application being studied in this paper. This study utilizes annual historical data from different sectors, some of which has been directly collected, while others (e.g., total water use) have been calculated based on available information. Using these data, the causal-correlational analysis has been conducted to recognize the leading components of the nexus system. In this study, the general linear equations, along with corresponding coefficients of determination (R2), have been fitted to the data points to demonstrate the pattern of the change in an individual variable against any other variables. Bilateral causal relationships between each pair of sectors have been calculated using multispatial CCM package for the R programming language (Clark et al., 2015) to measure the strength of causal effects of one variable on the other. Table 1 shows the five different variables considered in this study and their corresponding data source. Data used in each sector of this study has been calculated based on gathered data in different subsectors and analyzed on an annual time scale. For example, the amount of total water use in each year is equal to the municipal water use, water footprint for different food sub-sectors such as agri-food, livestock, and food industry, and energy sub-sectors such as fossil fuels and renewable sources. Further details about collected data and their processing have been provided in Supplementary Section S1.
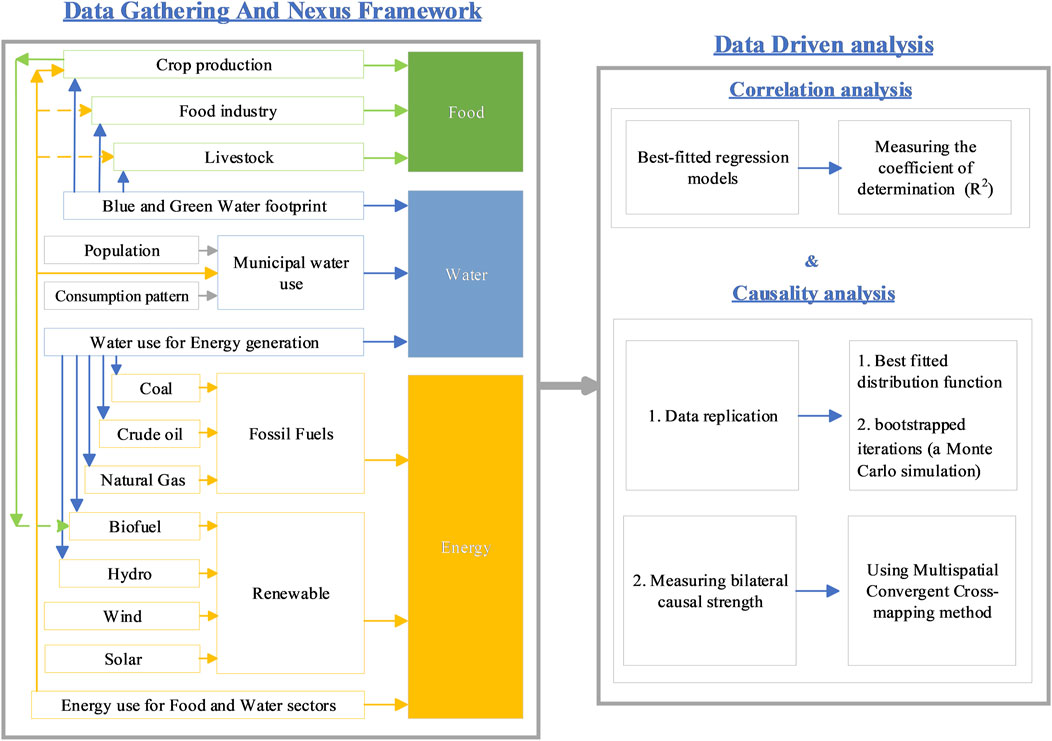
FIGURE 1. Comprehensive methodological workflow for Water-Energy-Food (WEF) nexus analysis, detailing sequential data collection, nexus framework construction, and data-driven analytical approaches to elucidate correlation and causation within the integrated water, energy, and food sectors.
The fundamental WEF sector relationships and interlinkages considered in this study, as depicted in Figure 2, are as follows:
- Water for energy: the amount of water required for hydropower energy generation and extraction, cooling systems, and processing of fossil fuels including NG, crude oil, and coal.
- Water for food: the amount of water required for crop production, livestock watering, and food industry (Statistics Canada, 2009; Mekonnen and Hoekstra, 2010; 2011; Hoekstra et al., 2012; Statistics Canada, 2020c)
- Energy for water: the amount of energy required for water treatment plants and water distribution.
- Energy for food: energy required in the agricultural sector including electricity, NG, motor gasoline, diesel fuel oil, light fuel oil, and heavy fuel oil (Natural Resources Canada, 2018)
- Food for energy: the amount of feedstock (wheat, corn, canola, and soy) required for biofuel (ethanol and biodiesel).
- Food for water: No information has been reported regarding food used in the water sector, so the authors have assumed a negligible amount (epsilon)
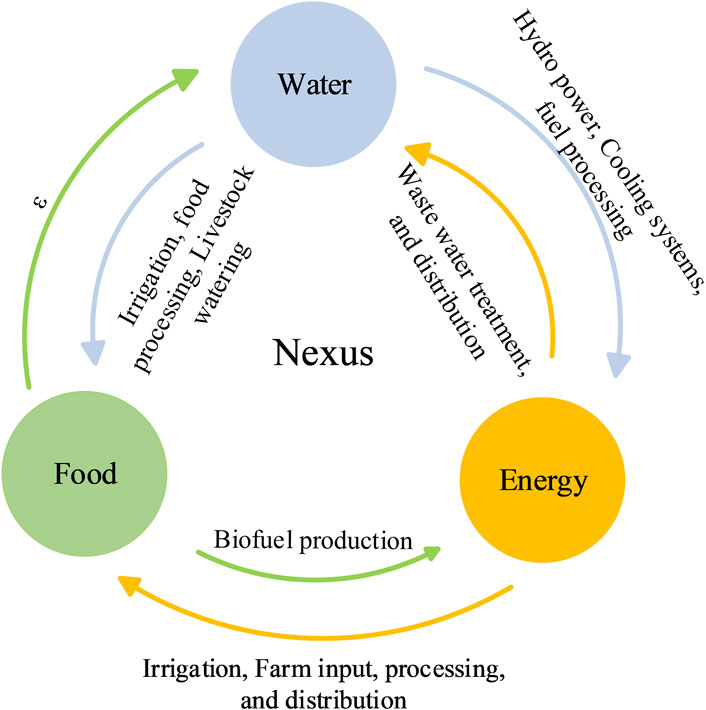
FIGURE 2. Schematic representation of the WEF nexus showcasing interconnected resource use across key sectors including food production, energy generation, and water use to highlight the importance of nexus thinking approach for resource management.
2.3 Case study
The Canadian prairies is a region in Western Canada including the provinces of Alberta, Saskatchewan, and Manitoba, covering 20% of Canada’s land area and Canada’s total surface area of water bodies (Natural Resources Canada, 2016). The prairies play a major role in Canada’s agri-food production, accounting for more than 80% of Canada’s arable land divided among Alberta, Saskatchewan, and Manitoba with 31%, 39%, and 11%, respectively. The prairie provinces’ cropland contributions in Canada are 27%, 42%, and 13% associated with Alberta, Saskatchewan, and Manitoba, respectively. This indicates that Saskatchewan contributes the most to agricultural crop production within the entire country (Supplementary Section S1.1).
The amount of electricity generation is noticeably high in Alberta compared to that in Saskatchewan and Manitoba. This amount is almost three and 15 times that of Saskatchewan and Manitoba, respectively (Supplementary Section S1.3). Saskatchewan and Alberta have had the highest and the second-highest water use in the prairies during the 31 years from 1990 to 2020 (Supplementary Section S1.2). The prairie provinces’ contribution to Canada’s GDP is around 23% on average. Alberta has the most contribution (16%) compared to Saskatchewan (4%) and Manitoba (3%). In this study, WEF-related industries in the prairies and any individual province within the prairies from 1997 up to 2020 (Statistics Canada, 2018c; Statistics Canada, 2020b) are considered for the economic sector with GDP metric (Supplementary Section S1.4). On average, the Canadian prairie provinces released 45% of Canada’s total GHG emissions from 1990 to 2019. Alberta is the largest emitter of GHGs in the prairie region (Supplementary Section S1.5) with 33% contribution compared to Saskatchewan (9%), and Manitoba (3%) (Government of Canada, 2018).
Nexus thinking with a more explicit scope of integration helps with greater policy coherence among agencies, stakeholders, and policymakers in a self-contained jurisdiction. Achieving policy coherence becomes more challenging when it comes to multiple jurisdictions connected through any resource. In this regard, the Canadian prairie provinces are selected as the case study since this region, with three jurisdictions (provinces), is connected by TB water resources. A schematic diagram of the TB rivers and lakes within the prairie provinces is presented in Figure 3. This figure shows that several international and interprovincial TB rivers flow in and out of the Canadian prairie provinces. Different agreements have been set for water management through these TB rivers between riparian countries (Canada and the US) as well as among provinces within the prairies. As an example, Prairie Provinces Water Board (1969) agreement, signed in 1969 between the government of Canada and the provinces of the Canadian prairies, is a master agreement that governs the water apportionment among the three provinces. However, such agreements on water apportionment through TB rivers (i.e., focusing only on surface water resources) do not consider the virtual water (VW) movement (e.g., energy and food products) among riparian provinces/countries. VW flows need to be taken into account in such agreements since there is a substantial volume of intra- and inter-regional VW flows within the region in North America (Dalin et al., 2012). The nexus thinking approach provides us with a more comprehensive insight into the interlinkages of the WEF resources. Although Canadian provinces have significant control over their resources and policies, natural resources and the economy do not respect jurisdictional boundaries. Therefore, evaluating the fairness of shared water resources among riparian provinces within the context of the WEF nexus rather than from the sectoral point of view can help with a better allocation of resources among the provinces.
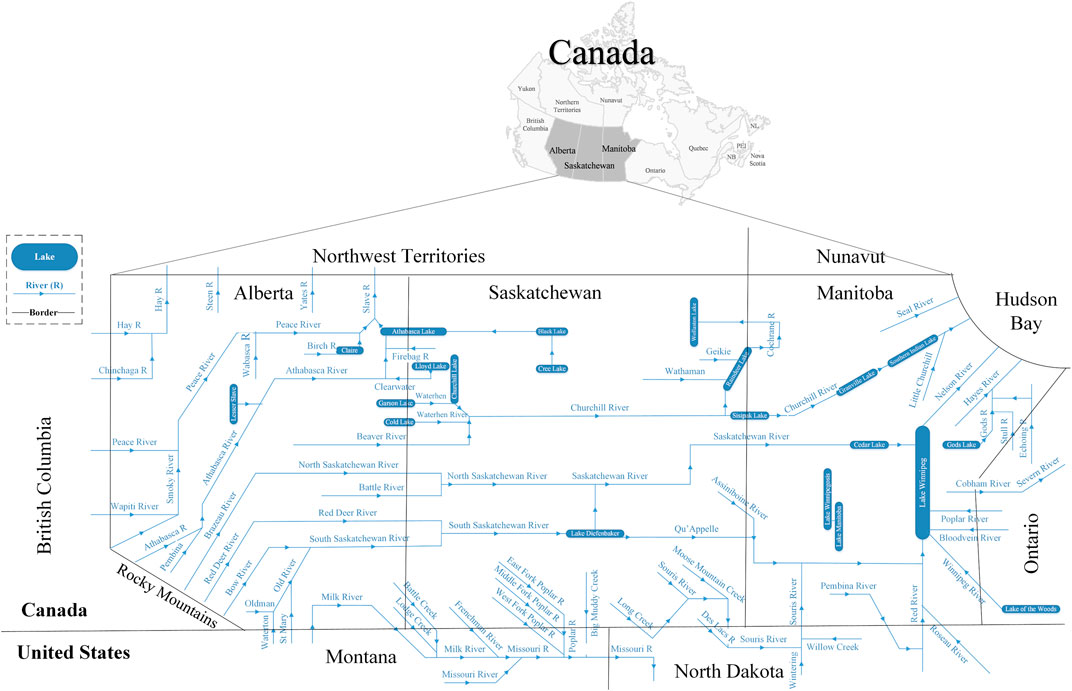
FIGURE 3. Schematic diagram of the main rivers and lakes within the Canadian prairie provinces (Abbreviations: NL Newfoundland; NB New Brunswick; PEI Prince Edward Island).
2.3.1 The Canadian prairie nexus assessment
The whole Canadian prairie nexus including intra- and inter-provinces interactions have been summarized in Figure 4. The WEF nexus in the Canadian prairies as one administrative unit and its interaction with regions outside of the prairies have also been illustrated in Figure 5. In both Figures 4, 5, the blue, gray, and green doughnut charts represent the water, energy, and food sectors, respectively. The available water specified inside each of the blue doughnut charts is equal to the average annual water yield and has been calculated based on the contribution of each province (Healey and Wallace, 1987) in Canada’s water yield (Kienzle, 2012; Statistics Canada, 2018a) plus green water use (GWU). GWU refers to the human use of the evaporative flow from the land surface (Hoekstra et al., 2012) for the agriculture (food) sector, and blue water use (BWU) refers to the use of blue water resources (surface and groundwater) for food, energy, and municipal sectors. The remaining water refers to the remaining portion of the annual available blue water in each province, which either remains inside or flows to a neighboring province through TB rivers.
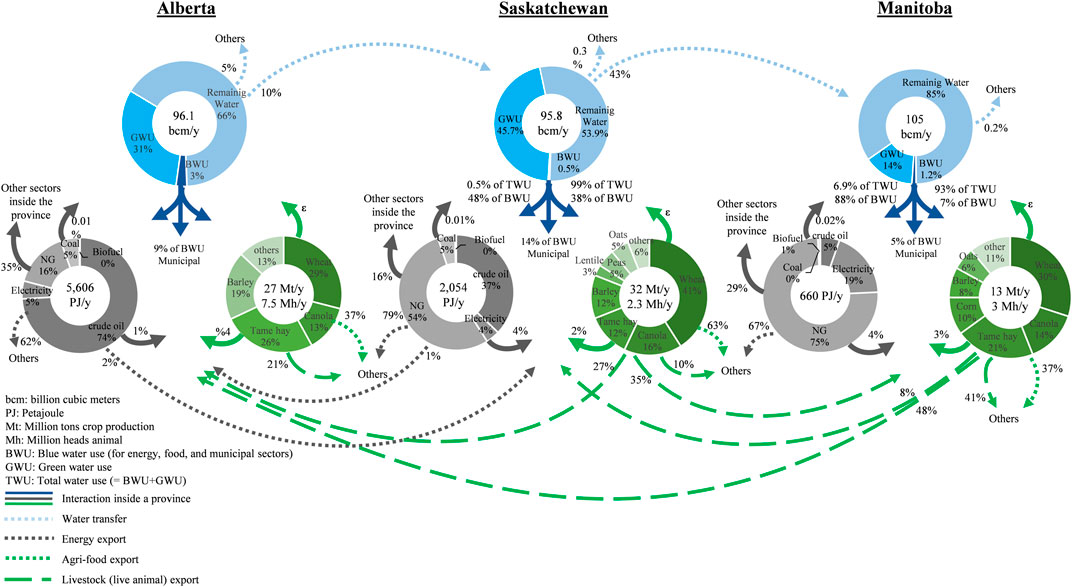
FIGURE 4. WEF nexus within and between the Canadian prairie provinces. The blue, gray, and green doughnut charts represent the water, energy, and food sectors, respectively, in each province. In the food sectors, livestock and agri-food are treated independently.
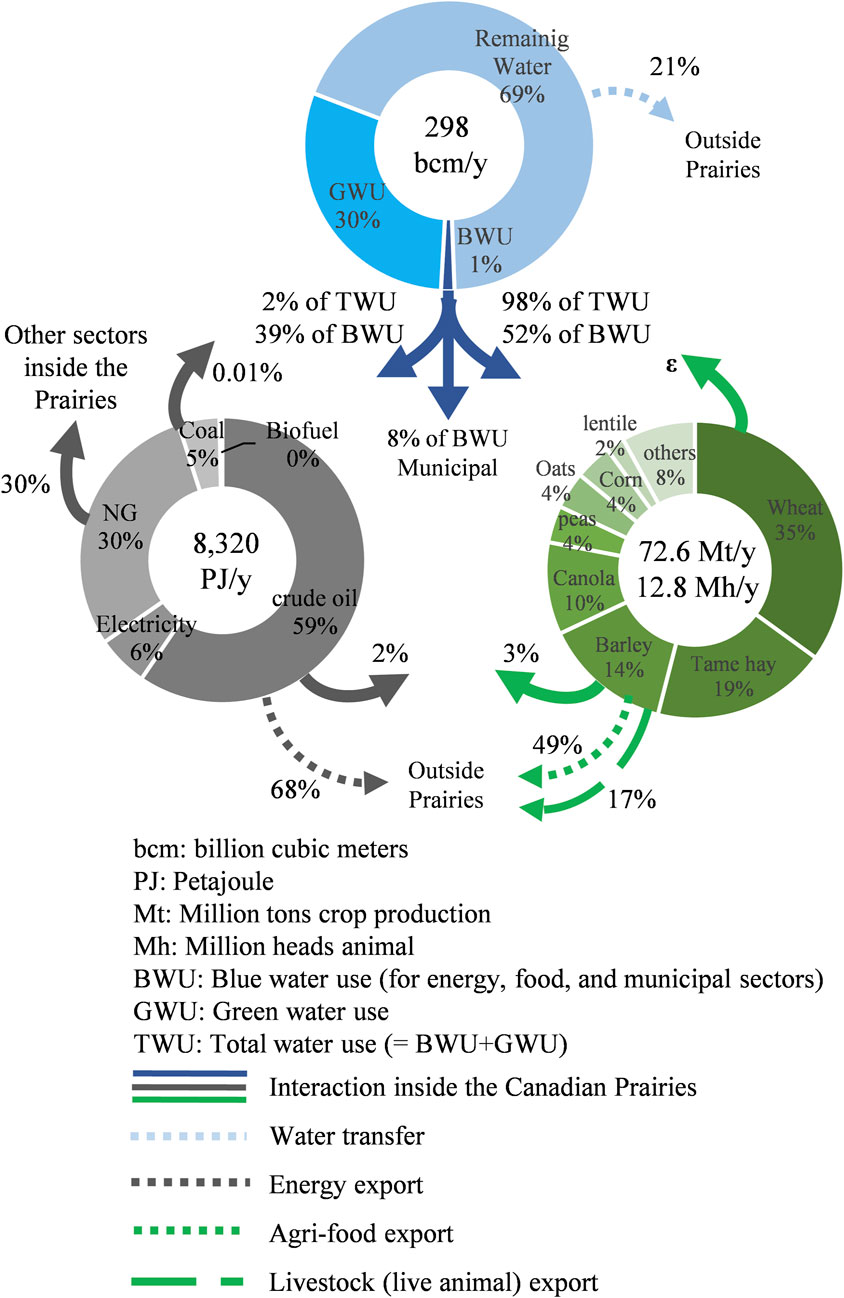
FIGURE 5. WEF nexus of the Canadian prairies as a single region with other regions represented as “Outside Prairies”. The blue, gray, and green doughnut charts represent the water, energy, and food sectors, respectively. In the food sectors, livestock and agri-food are treated independently.
The total amount of generated energy and produced food (including agri-food and animal products) specified inside the gray and green doughnut charts in Figure 4 are the average annual values of historical records. The term ‘total generated energy’ in this study refers to the amount of energy derived from different sources including crude oil, natural gas, coal, flowing/falling water (as a primary source of energy for hydropower), and biofuel in the province. In Figure 5, the data of the doughnut charts represent the Canadian prairie values, calculated as the sum of the average annual related values of the three provinces. Figure 4 shows that the average annual energy generation in Alberta (5606 PJ/y) is about 2.7 and 8.5 times that of Saskatchewan (2054 PJ/y) and Manitoba (660 PJ/y), respectively. Figure 5 indicates that the average annual energy generation for the whole prairie is 8320 PJ/y. The energy doughnut charts show each energy source’s share of the total energy in each province. Crude oil is the main source of energy in Alberta and the prairie accounting for 74% and 59% of their total generated energy, respectively. However, the main energy source in Saskatchewan and Manitoba is natural gas (NG) which includes 54% and 75% of their total generated energy, respectively. Similarly, the major crops produced in each province are provided in the food green-color doughnut charts. It can be seen that wheat is the most produced crop in all three provinces (Figure 4) and the prairie (Figure 5).
Outgoing arrows in Figures 4, 5 denote the contribution of each sector to other sectors or provinces, and the values on the arrows indicate the amount of the contribution of the interaction. There are two types of arrows (links) fluxing from the water sector: i) dark blue arrows, which show water use in food, municipal, and energy sectors, and ii) light blue dotted-line arrows, which show the (real) water transfers through TB rivers to either an adjacent downstream province or a region other than prairie provinces.
Municipal water use is calculated by subtracting the water used in food and energy from the total water use (TWU) and shown in Figures 4, 5. It is worth noting that the main sub-sectors of water use in the industrial sector are covered in the i) energy sector, including oil and gas extraction, coal and metal mining, electric power generation, transmission and distribution, and transportation, and ii) food sector, including crop production, animal production, support activities for agriculture and forestry, and food manufacturing (Statistics Canada, 2017; Dieter et al., 2018). The remaining water use of other sub-sectors of the industrial sector (e.g., clothing and leather and allied product manufacturing, textile product manufacturing, computer and electronic product manufacturing, furniture and related products, etc.) is not considered in this study as it has no significant contribution in total water use.
There are three different types of arrows (links) fluxing from the food sector into the other sectors or provinces: i) solid arrows show the contribution of the food sector to the energy and water sectors, ii) dotted-line arrows stand for the agri-food exports, and iii) long-dash arrows refer to livestock exports. It should be mentioned that livestock and agri-food are treated independently in this study.
Two different arrow types are fluxing from the energy sector: i) solid arrows indicate the energy used in water, food, and other sectors within the province, and ii) dotted-line arrows stand for energy trades (exports). Inter-provincial energy trades in the prairies are limited to crude oil, while energy trades to other regions include crude oil, coal, electricity, and NG.
Figure 5 indicates that 59% of energy generation in the prairies is obtained by crude oil, which needs a considerable amount of water for oil extraction and refining. Hydropower is still the backbone of Canada’s electricity supply. However, electricity generation only accounts for 6% of the total energy generation in the prairies (Figure 5). Therefore, there is still a potential to develop the hydropower capacity as more water can be dedicated to running more hydropower plants, depending on decisions made by water managers (Wu et al., 2021) as well as the conditions by which the resource management remains sustainable. According to Figure 5, around 21% of the total annual water yield in the Canadian Prairies, equivalent to about 63 bcm/yr (billion cubic meter per year) is being transferred outside of the region. This significant outflow of water from the Canadian prairie region highlights the importance of conducting further investigations at a broader scale, beyond the provincial level, to explore potential opportunities for renewable energy generation as well as expansion of irrigated-crop lands. Such investigations could contribute to enhancing WEF security in the prairie region to ensure sustainable and resilient future. Moreover, Figure 5 shows a substantial portion of the Canadian prairie’s annual energy generation, agri-food production, and livestock production, accounting for 68%, 49%, and 17%, respectively, are exported to external markets. This reveals the potential of the region for achieving self-sufficiency and fulfilling a part of the demand from the rest of Canada during crises like the Covid-19 pandemic. This emphasizes the need for further in-depth investigation of the region’s capacity to enhance its resilience and contribution to national resilience during crisis times. Additional information on Figures 4, 5 can be found in Section S2 of the supplementary document.
Even though Figures 4, 5 present important information on the relationships among different WEF sectors within each individual prairie province as well as between provinces, both qualitatively and quantitatively, they are not able to reflect the dynamic pattern of these relationships. In other words, they only show the average amount of WEF resources used by each sector within a specific period and do not provide us with any information on the fluctuations of such relationships over time among WEF sectors. Therefore, evaluation of the interactions among WEF resources over time in terms of their usage, production, and generation is of great importance to policymakers to track the change in any individual resource and consequently evaluate its impact on other resources.
3 Results
3.1 Correlation between system sectors
The fitted equations with their coefficients of determination (R2) have been determined for pairs of WEF sectors, GDP, and GHG emissions based on the best-fitted regression models. The obtained fitted equations between each pair have been shown in Figure 6 for the Canadian prairie as one region. The arrows thicknesses schematically indicate the correlation strengths between the pairs. The equations along with their coefficient of determination (R2) for individual provinces have been listed in Table 2. Historical data associated with WEF sectors, GDP, and GHG emissions for the three provinces in the Canadian prairies including the prairies as a single region from 1990 to 2020 along with their corresponding regression models have been plotted and shown in Supplementary Figure S7–S10.
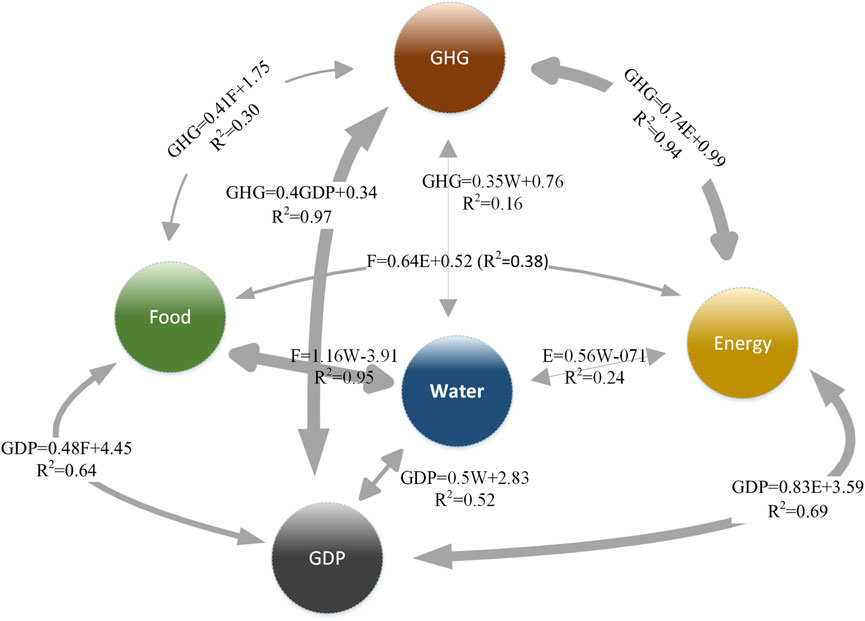
FIGURE 6. Schematic diagram of regression relationships among WEF sectors, GDP, and GHG emissions (annual scale) in the Canadian prairie region as one region. Related graphs are provided in Supplementary Figure S7–S10.
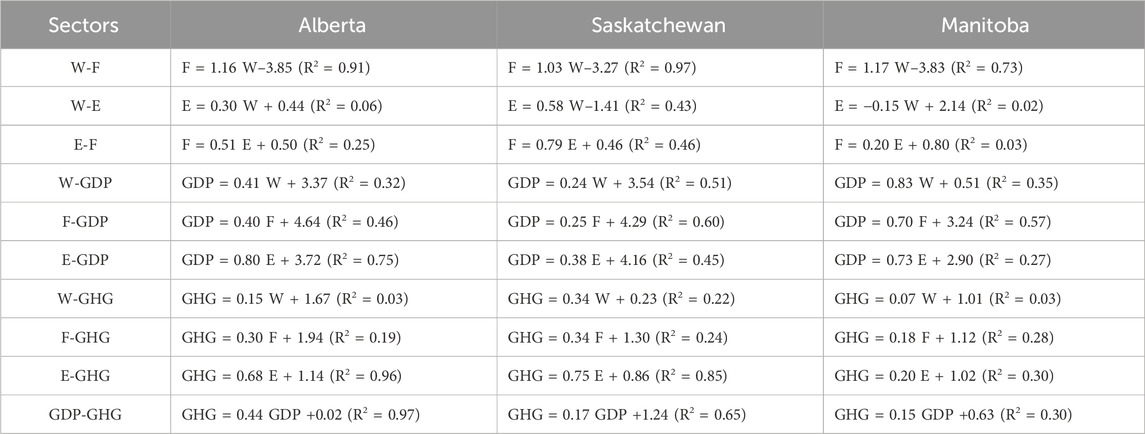
TABLE 2. Best-fitted regression relationships among WEF sectors, GDP, and GHG emissions (annual scale) and their coefficient of determination (R2) in Alberta, Saskatchewan and Manitoba. Related graphs are provided in Supplementary Figure S7–S10.
The statistical significance level was set at 0.01 for all regressions. The p-value was <0.01 in all regressions except for the regressions between W-E (p = 0.51) and E-F (p = 0.34) in Manitoba and W-E (p = 0.17) in Alberta. Spearman’s ranked correlation coefficient was also calculated to check if there is any non-linear correlation between the above-mentioned pairs (S4). Statistical analysis indicates that there is no sufficient evidence to prove that there is a linear/non-linear correlation between these variables. Therefore, correlation analysis cannot provide any information on the relationship between the aforementioned sectors. Further analysis (e.g., causality analysis) can help with describing relationships between such variables.
The food sector (agri-food production) has the strongest correlation with total water use among other sectors in the prairies (Figure 6). This was expected as this region plays a major role (67%) in Canada’s agri-food production. Furthermore, W-F, E-F, and W-E pairs have the largest, second largest and lowest correlation values, respectively in the prairies. A stronger correlation between E-F than between W-E could be due to the use of energy-intensive equipment and processes in agriculture and food production. The difference in correlation values highlights the importance of both energy and water in the food production sector in the Canadian prairies. However, the stronger relationship between energy and food production may indicate a need to focus on energy efficiency and conservation efforts in the agriculture and food production sector in the region.
Based on the correlation analysis (Table 2), it can be concluded that Saskatchewan, Alberta, and Manitoba have the strongest, second strongest, and lowest correlation for any pair of WEF sectors, respectively. Saskatchewan has the highest correlation of both water use and food production with GDP among the prairie provinces with R2 of 0.51 and 0.6, respectively (Supplementary Figure S8). However, Alberta and Manitoba have an uptrend pattern of total (both blue and green) water use and food production against GDP with a rate almost two and three times that of Saskatchewan, respectively (Supplementary Figure S8A, B). A higher rate of water use and food production against GDP in Alberta compared to Saskatchewan is due to several factors, including differences in government policies, investment in infrastructure, and economic diversification. Alberta has invested in irrigation and water management infrastructure, which has helped to improve the productivity of irrigated lands. As a result, irrigated land development has been stronger in Alberta compared to Saskatchewan. The correlation between energy generation and GDP is the strongest in Alberta (Supplementary Figure S8C); this was expected as energy generation plays an important role in Alberta’s GDP. In conclusion, we can say that GDP is more correlated to energy generation in Alberta and to food production in Saskatchewan and Manitoba. Moreover, GDP has almost equal correlation with food and energy in the Canadian prairies as one region (Figure 6).
The correlation analysis was also conducted between WEF sectors and GHG emissions for the 30 years of historical data in the Canadian prairie provinces, individually and as a whole from 1990 to 2019 (Supplementary Figure S9). Based on this analysis, the energy sector has the highest correlation against GHG among WEF sectors in all three provinces and the prairie. This correlation is more highlighted in Alberta among prairie provinces, which was expected due mainly to oil and gas production, and (coal-fired) electricity generation (Canada Energy Regulator, 2022). This correlation (GHG-E) is weak in Manitoba, as Manitoba relies mainly on hydropower for energy generation. Manitoba has the highest correlation between food and GHG (mostly methane (CH4) from livestock and nitrous oxide (N2O) from soils). This is probably due to the use of a larger amount of fossil-fuel-based fertilizer (Manitoba Agriculture and Resource, 2021) in Manitoba compared to that used in Alberta and Saskatchewan.
The correlation analysis between economic and environmental indicators (i.e., GDP and GHG emissions) based on the 23 years of historical data from 1997 to 2019 (Supplementary Figure S10) shows that GDP is strongly correlated with GHG emissions in Alberta (R2 = 0.97). This correlation is weaker in Saskatchewan (R2 = 0.65) and Manitoba (R2 = 0.30). Furthermore, Alberta has an uptrend pattern of GHG against GDP with a rate of more than two times that of Saskatchewan and Manitoba. GDP-GHG cross-correlation in the prairie as one region follows an approximate similar pattern observed in Alberta. This was expected as Alberta has the highest GDP and GHG contribution in the prairies compared to the other two provinces.
3.2 Causation between system sectors
The best-fitted statistical distribution functions of each of the WEF sectors and GDP and GHG variables in each of the three provinces, and the prairies as a single unit, have been plotted and shown in the supplementary document (S5.1) and summarized in Table 3. The probability distributions that were used in the analysis were Normal, Lognormal, Weibull, Exponential, Gamma, Burr XII, and Pareto II distributions within the CoSMoS (Complete Stochastic Modelling Solution) package (Papalexiou, 2018). The Anderson-Darling test and the Kolmogorov-Smirnov (K-S) test have been used for checking the goodness of fit regarding the assessment of normality of the data and the selection of best-fitted distribution. Then, bootstrapped iterations (Hall and Martin, 1988), as a Monte Carlo simulation approach (Raychaudhuri, 2008), were used for data replication based on the historical data and best-fitted distribution functions of each variable. The replicated data are then ordered to follow the prior patterns obtained from the correlation analysis. The iterations in the data replication process are based on 31-year (1990–2020), 24-year (1997–2020), and 30-year (1991–2019) available observations associated with WEF, GDP and, GHG, respectively. The number of generated data points were 2015, 2,184, and 2,130 for WEF, GDP, and GHG, respectively.
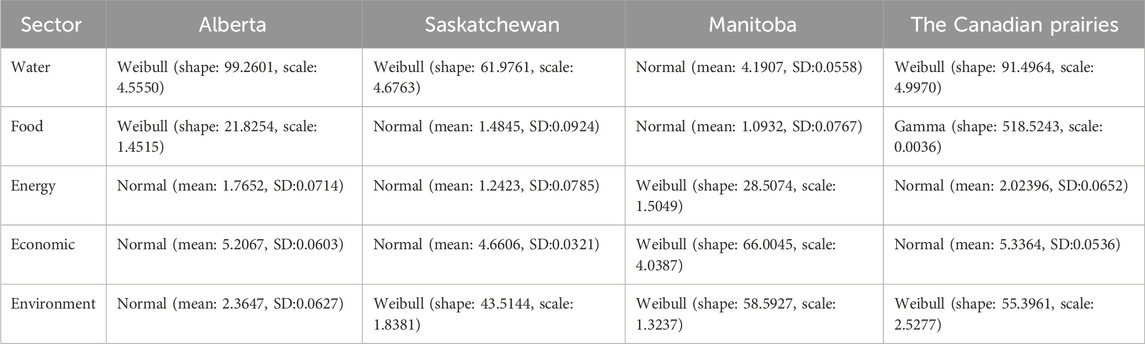
TABLE 3. Best-fitted statistical distribution of WEF sectors, GDP, and GHG emissions in Alberta, Saskatchewan, Manitoba, and the Canadian prairies.
Causal influences between pairs of sectors/variables can be considered as a criterion to determine whether a nexus exists among WEF sectors as well as between WEF sectors and both economic (GDP) and environmental (GHG emissions) variables. The rho values obtained from mCCM within the prairies as a region and prairie provinces are provided in Figure 7.
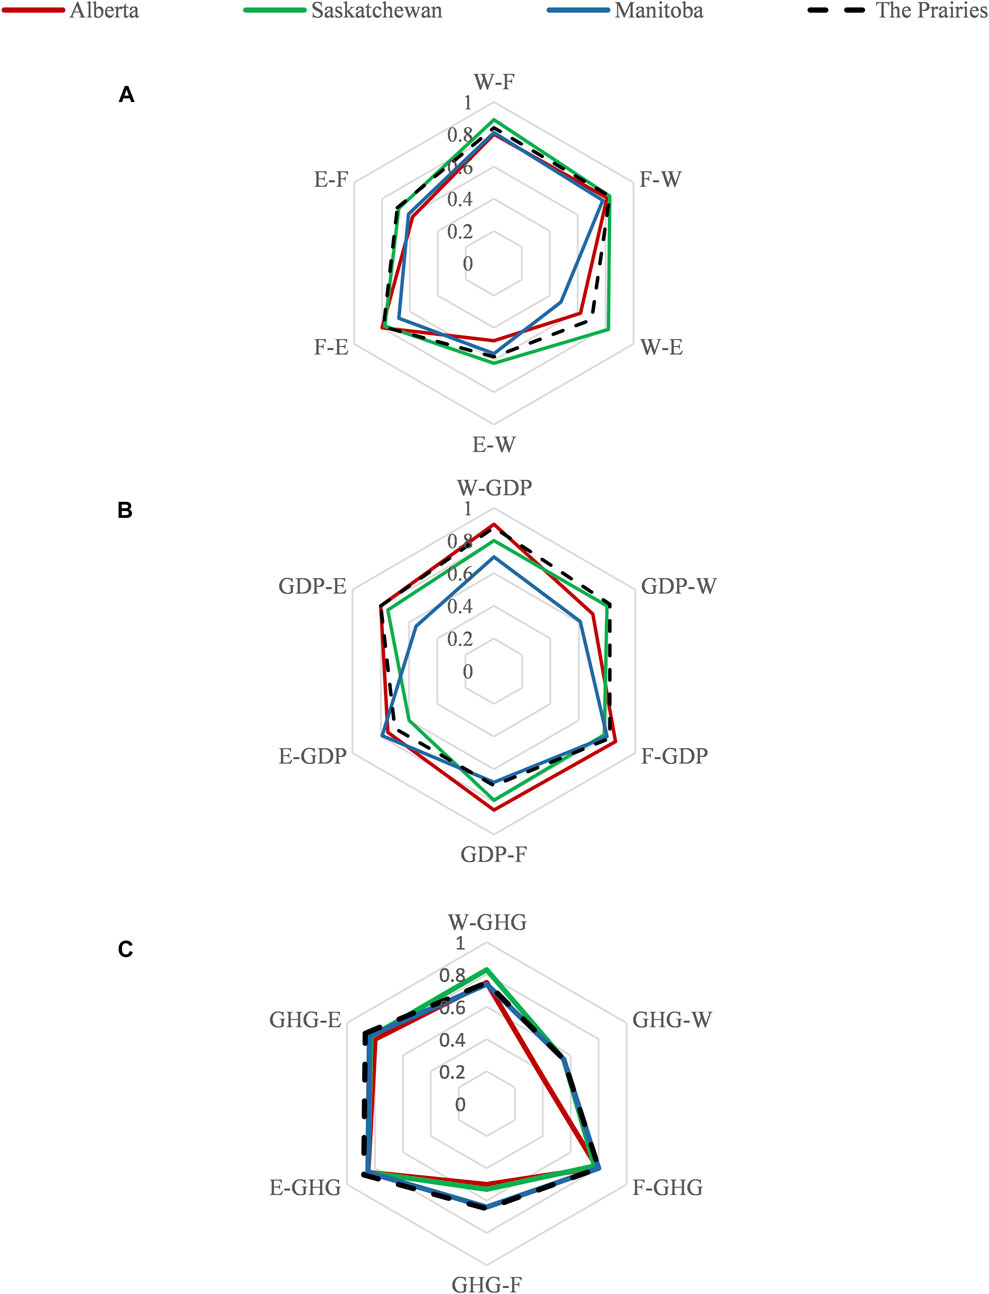
FIGURE 7. Rho values between (A) WEF, (B) WEF and GDP, and (C) WEF and GHG sectors in Alberta, Saskatchewan, Manitoba, and the Canadian prairies as a region (mCCM results provided in Supplementary Figure S15–S18). Abbreviations: W water; E energy; F food; GDP gross domestic product; GHG greenhouse gases emissions.
The causal influence among WEF sectors, shown in Figure 7A, indicates that water causal influence on Food (W→F) is relatively high in all Canadian prairie provinces and is the highest in Saskatchewan. Highly correlated W-F variables shown in Table 2, obtained from correlation analysis could justify such a strong causal influence between water and food sectors. This was expected as Saskatchewan has 40% and 70% more croplands than Alberta and Manitoba, respectively (Statistics Canada, 2020a). An argument might arise from water causal influence on food in Saskatchewan as to whether increasing food security can be improved significantly by improving water security. One can say that re-evaluating the water resources management between Alberta and Saskatchewan might increase the agricultural productivity of croplands in Saskatchewan. However, croplands in Saskatchewan are mostly rainfed agriculture and allocating an additional amount of water to croplands in Saskatchewan would probably not have a significant impact on food security. The rapid rise of rho (ρ) to stability observed in Supplementary Figure S15A occurs in a situation when one variable demonstrates high dominance behaviour (water variable) so that the other variable’s behaviour (food variable) is forced to follow it. This phenomenon is called “synchrony” and does not necessarily reflect the true bidirectional coupling in a causal relationship (Sugihara et al., 2012).
As shown in Figure 7A, food has a stronger causal influence on energy (F→E) than the other way around in both the prairies and individual provinces. One main reason for this could be the biomass industries in the prairie provinces where they use biomass plant feedstocks for thermal and electrical energy purposes. The effects of food on energy are almost the same in Saskatchewan, Alberta, and the prairie. However, the influence of energy on food is stronger in Saskatchewan and the prairie compared to that in Alberta. In both Saskatchewan and Alberta, food has a higher causal influence on energy than that of Manitoba (Figure 7A). This might be due to the smaller area of croplands and less biomass production (e.g., wheat, corn, canola, and soy) in Manitoba compared to Saskatchewan and Alberta causing less influence on energy.
In terms of the water-energy causal relationship, water has a stronger influence on energy than the other way around in Alberta, Saskatchewan, and the prairies (Figure 7A), but this is vice versa in Manitoba. Historical data shows that Manitoba has had annual electricity generation within an almost constant threshold between 35 and 40 GWh/year (Supplementary Figure S3) over 31 years. This probably indicates that hydropower plants in Manitoba have been operated mostly at their maximum nominal compacity and that the minimum amount of water required for hydropower plants to generate electricity at their nominal capacity has always been available in the above-mentioned period. In conclusion, additional available water has not had a considerable influence on the amount of energy generation for that period.
Almost 98% of electricity generation in Manitoba comes from hydropower plants (Canada Energy Regulator, 2018) whose operation heavily relies on the use and regulation of water resources. It is worth noting that the electricity generation in Manitoba represents only 19% of the total energy generation (Figure 4). We conducted correlation analysis to investigate the potential relationship between total energy generation and total water use in Manitoba. However, the results indicate that there is insufficient evidence to establish a correlation (p-value = 0.51). This finding highlights the need for causality analysis, which can help unveil the logical necessity and significance of exploring the unidirectional or bidirectional relationships between variables.
Water has the strongest influence (slightly higher than energy influence) on GDP in Alberta, while GDP is mostly affected by the energy sector in Manitoba. The food and water sectors influence GDP with the same weights and are higher than the energy sector’s influence on GDP in Saskatchewan. In the prairie as a region, water is the most influential sector on GDP. GDP influences on the food sector in Alberta and Manitoba, and on the water sector in Saskatchewan and the prairies are more pronounced compared to other sectors. The reason for such influence of GDP on food sector (food production) might be due to different direct or indirect reasons including i) GDP growth can increase the ability for investing in farm equipment and precision agriculture to increase crop production, and/or ii) GDP growth may increase food consumption, as the consequence of increased purchasing power. Then, in turn, the increase in food demand boosts food production to address the demand.
Causal relationships between environmental variables (GHG emissions) and WEF sectors have been quantified in terms of rho and shown in Figure 7C. It can be seen that energy generation has a stronger influence on GHG emissions in the prairie and its three provinces compared to the water and food sectors. As to causation between W↔GHG, the results suggest that water use has a stronger causal influence on GHG emissions than the other way around in all provinces and the prairie. The level of the causal influence of W→GHG in Alberta, Manitoba, and the prairies is almost equal, while it is stronger in Saskatchewan. Reasons for the stronger W→GHG causation in Saskatchewan could be related to the influence of water use on i) fossil fuel power plants as more than %81 of Saskatchewan’s electricity generation is based on fossil fuels (Canada Energy Regulator, 2021), and ii) agri-food production due to the larger cropland areas in Saskatchewan meaning that more farmed organic soil, as an emitter of two of the most powerful GHGs such as methane (CH4) and nitrous oxide (N2O), would be used and, in turn, more agricultural activity (farm machinery and application of fossil-fuel-based fertilizers) would be required. The influence of the food sector on GHG has almost the same strength in Alberta and Manitoba, which is slightly higher than that in Saskatchewan. As expected, GHG emissions have the strongest impact on energy among WEF sectors. Similar to the coupling behaviour between W-F, the synchrony phenomenon is also observed in E-GHG causal relationship.
Causality analysis showed that there is no causal influence between GDP and GHG in either direction in the prairie provinces or the prairies as one region (Supplementary Figure S18). In Alberta, although there was a high correlation between GDP and GHG, no causal influence was observed between these two sectors. Perhaps, this is another indicator of the value of causality analysis compared to the statistical correlation analysis. Results of the mCCM among WEF sectors, between WEF and GDP, between WEF and GHG emissions, and between GDP and GHG emissions are presented in Supplementary Figure S15–S18, respectively.
The WEF nexus approach promotes the inclusion of additional sectors and interrelationships, which causes the expansion of system boundaries. However, the escalating computational complexity may hinder practicality and discourage policymakers and managers. Therefore, conducting exploratory analysis becomes essential to gain a better understanding of nexus relationships and causal effects. The utilization of such an exploratory analysis is not intended to replace other modelling approaches nor compete with them, but instead helps with prioritizing components of complex WEF nexus systems. Our exploratory analysis allows for the identification of key causal relationships, enabling the delineation of system boundaries, and in turn, providing a more parsimonious and efficient representation of the WEF nexus. This enhanced understanding of the system allows for the development of more targeted and effective WEF nexus models for simulation and scenario analysis. This advancement provides a platform for policymakers and decision-makers to make well-informed decisions that promote comprehensive resource management.
In this study, the identification of the sectors most or least affected by other sectors and variables among WEF resources and the quantification of their interrelationships were conducted using causality analysis taking economic and environmental factors into account. This can provide useful information concerning nexus management as well as sectoral efficient investment. It is quite difficult and still challenging to unravel causal relationships among the elements of a system using causality analysis (Sušnik, 2018), let alone precisely quantify them. Further detailed investigations will be required to delineate interrelationships among different sectors more accurately to explore the reasons behind different rho values among pairs of sectors. Causality analysis can reveal important information and provide initial insights into the relationships between the components of the WEF nexus and other sectors. However, incorporating more variables and considering the dynamic nature of the WEF nexus would require a more sophisticated model. This can lead to a more accurate assessment of WEF nexus and improve the efficacy of the analysis.
In this study, a multi-scale causal-correlational analysis was conducted to bridge the gap in understanding the impact of changing scales on interrelationships and system analysis within WEF nexus context. This study allows us to investigate how the interactions and policies within the WEF nexus are influenced by the scale. Based on the findings of this study, it can be implied that the assessment of trade-offs and synergies for improving nexus security relies on the scale of the case study. In other words, to improve the WEF resources management and suggest practical management strategies at decision-making scale, a comprehensive assessment is required from two perspectives: i) a regional study that considers different variables and details of WEF systems, and ii) an assessment of the WEF nexus both within and beyond a region, simultaneously (Kraucunas et al., 2015). Therefore, studying the WEF nexus on different scales at the same time would allow for a more nuanced understanding of the interconnections between water, energy, and food within a specific region, and can provide valuable information on how these interconnections vary across different sub-regions. Comparing Figures 4, 5 can give a better demonstration of the advantage of investigating nexus at different scales. A difference of 13% can be seen in blue water use contribution to the food (39%) and energy (52%) sectors in the prairies as one region (Figure 5). In contrast, as seen in Figure 4, there is a more significant difference in Alberta’s and Manitoba’s distribution of BWU in the energy and food sectors (15% vs 76% in Alberta and 88% vs 7% in Manitoba). This difference in the contribution of BWU to food and energy between the prairie and individual prairie provinces can be considered significant and highlights the need for more integrated and holistic approaches to managing WEF resources.
In our study, a thorough analysis of the WEF nexus system was conducted by considering the most significant sub-sectors within each WEF-GDP-GHG sector in the three provinces under consideration. This approach acknowledges the varying contributions and importance of different sub-sectors across provinces. For example, we included both crop production and the food industry in the analysis of the food sector, as they play crucial roles in different provinces. Similarly, we considered both irrigated and rainfed sub-sectors, which have varying significance across provinces. In the energy sector, we accounted for the total energy generation from relevant sub-sectors, taking into account the predominant use of fossil fuels in one province and the significance of hydropower in another. While obtaining precise data for all sub-sectors in all provinces has inherent limitations, we carefully selected significant sub-sectors based on their contributions and relevance within each province. This approach allows for a comprehensive simulation and assessment of the WEF nexus system, considering variations in contributions across provinces and striking a balance between data availability, analytical rigor, and capturing essential interlinkages between sectors.
There are some limitations in this study that are worth considering in future research. This study has been conducted based on the annual temporal scale, which, while providing valuable and important insights into the nexus system in the region, may ignore patterns that emerge within finer temporal resolution (e.g., seasonal effects). Data analysis within a finer resolution can provide more accurate results by capturing short-time variations driven by different factors, including seasonal fluctuations, which might be valuable for policy and planning purposes. However, it can add more complexity to the problem and, in addition, access to the required data associated with different sectors might not always be possible. Pollution has a significant impact on the availability and quality of water, energy, and food resources. It can also impact the health and wellbeing of people and ecosystems. By considering the effects of pollution in the context of the WEF nexus, the analysis can take into account the potential impacts of pollution on the availability and quality of WEF resources, as well as the potential impacts on human health and the environment. This leads to a more comprehensive evaluation of potential impacts and the potential for mitigation measures to be developed and implemented, which can ultimately lead to more sustainable and equitable outcomes. Expanding bio-physical system boundaries in the nexus framework that includes other components, such as land, soil, health and nutrients should be considered in the future in, considering the tolerable level of model complexity.
This study is a step forward toward a better understanding of WEF nexus analysis at a scale between the provincial and national scales. The causality analysis carried out through this study to explore causal interrelationships among WEF resources, GDP, and GHG sectors can reflect the effects of changing the scale on nexus variables within the prairie provinces and the prairie as one region. In other words, this multiscale analysis can determine how sensitive nexus variables are to the scale change. As causality is inherently linked to decision-making (Zheng et al., 2020), the results of this study obtained through causality analysis can help us to highlight variables that have the maximum potential to affect others allowing decision-makers to intervene to change them, effectively.
Future research directions should involve i) incorporating a process-based model to quantify and analyze nexus interlinkages to assess causal relations to have a more insightful understanding of the system ii) assessing the interprovincial effects of WEF resource management changes in the Canadian prairies, iii) considering a broader environmental context by including additional environmental dimensions such as the impacts of climate change and biodiversity loss within the nexus system to advance our understanding for promoting resilience and sustainable strategies in WEF resources management, iv) evaluating the existing agreements on inter-provincial water apportionment based on WEF nexus perspective to assess their effects on the equitable distribution of WEF integrated resources in the region in a sustainable way, and v) improving WEF security targets (increasing the efficiency of the whole system, reducing trade-offs, building synergies, and improving governance across sectors) by using simulation techniques.
4 Conclusion
A data-driven analysis of the WEF nexus in the Canadian prairie provinces and the prairies as one (virtual) administrative unit has been conducted based on historical data. A database containing information on WEF sectors, GDP, and GHG emissions within the Canadian prairies has been built to examine the pattern associated with the aforementioned sectors from 1990 to 2020. The database has initially been used to explore any local and/or global continuous increasing, decreasing or fluctuating patterns of any individual WEF, GDP, and GHG variables and then to perform a preliminary identification of anomalies and unexpected changes in the occurrence patterns. Correlation and causality analysis was performed on WEF, GDP, and GHG data to quantify and analyze the interlinkages between each pair of WEF, GDP, and GHG emissions over time. This helped with the understanding of interactions between each pair of WEF, GDP, and GHG sectors on a yearly time-basis during the specified 31-year period. The analysis was also beneficial to the identification of the influence on WEF, GDP, and GHG emissions caused by changes in any individual sector and the measurement of the strength of such influence. Results showed that food had more influence on energy than the other way around in the prairie provinces. The strength of causality between food and energy in the prairies was almost equal to that of Saskatchewan. The water influence on the food sector was higher than the other way around in both prairies and any individual provinces. Water influence on energy was higher than the other way around in all prairie provinces except for Manitoba. The influence of food on GDP was more than the other way around in Manitoba and the prairies. However, there was no significant difference in this influence between both directions in Alberta and Saskatchewan. GDP had the highest influence on energy in Alberta, while Manitoba possesses the highest influence the other way around among the prairie provinces. The prairies had a slightly higher GDP influence on water use (equal to that of Alberta) than the other way around (equal to that of Saskatchewan). As to WEF-GHG sectors’ causal relationships, it was observed that all WEF sectors had a significant influence on the GHG to almost the same extent. The maximum GHG influence occurred in the energy sector. However, the GHG influence on WEF sectors was not as high as the other way around. This study provides useful information on i) the interrelationships among the WEF, GDP, and GHG sectors within the context of nexus analysis, and ii) the dominant sectors in each province and the dominant province in the prairies for each sector; comparison between dominant sectors among different provinces can interpret WEF interrelationships in the prairies to some extent. This helps identify priority sectors and local communities (prairie provinces) to invest in, to improve WEF security in the prairie region. Investigating the WEF nexus starting from the provincial scale and then moving up to the prairie scale in the Canadian prairies indicated the significant role of multi-scale analysis in assessing interrelationships among WEF and other sectors. Taking into account the GHG emissions in WEF nexus analysis can help to enhance the understanding of the fundamental role of environmental impacts in the nexus leading to achieving holistic and effective decision-making for sustainable resource management.
Data availability statement
The raw data supporting the conclusion of this article will be made available by the authors, without undue reservation.
Author contributions
BS: Conceptualization, Data curation, Formal Analysis, Investigation, Methodology, Software, Validation, Visualization, Writing–original draft, Writing–review and editing. AE: Conceptualization, Funding acquisition, Project administration, Resources, Supervision, Visualization, Writing–review and editing. SR: Supervision, Validation, Visualization, Writing–review and editing.
Funding
The author(s) declare financial support was received for the research, authorship, and/or publication of this article. The Funding of NSERC of Canada to AE is greatly appreciated (RGPIN-2019-04590), and also the University of Saskatchewan devolved scholarship to BS is acknowledged. Behdad sincerely thanks Prof. Nathaniel Osgood (University of Saskatchewan, Department of Computer Science) for sharing knowledge about Causality Analysis-Convergent Cross Mapping (CCM).
Conflict of interest
The authors declare that the research was conducted in the absence of any commercial or financial relationships that could be construed as a potential conflict of interest.
The reviewer RM declared a past co-authorship with the author AE to the handling editor.
Publisher’s note
All claims expressed in this article are solely those of the authors and do not necessarily represent those of their affiliated organizations, or those of the publisher, the editors and the reviewers. Any product that may be evaluated in this article, or claim that may be made by its manufacturer, is not guaranteed or endorsed by the publisher.
Supplementary material
The Supplementary Material for this article can be found online at: https://www.frontiersin.org/articles/10.3389/fenvs.2023.1328009/full#supplementary-material
References
Abdelkader, A., and Elshorbagy, A. (2021). ACPAR: a framework for linking national water and food security management with global conditions. Adv. Water Resour. 147, 103809. doi:10.1016/j.advwatres.2020.103809
Abdelkader, A., Elshorbagy, A., Tuninetti, M., Laio, F., Ridolfi, L., Fahmy, H., et al. (2018). National water, food, and trade modeling framework: the case of Egypt. Sci. total Environ. 639, 485–496. doi:10.1016/j.scitotenv.2018.05.197
Afshar, A., Soleimanian, E., Akbari Variani, H., Vahabzadeh, M., and Molajou, A. (2022). The conceptual framework to determine interrelations and interactions for holistic Water, Energy, and Food Nexus. Environ. Dev. Sustain 24, 10119–10140. doi:10.1007/s10668-021-01858-3
Akbari Variani, H., Afshar, A., Vahabzadeh, M., and Molajou, A. (2023). A review on food subsystem simulation models for the water-food-energy nexus: development perspective. Environ. Sci. Pollut. Res. 30, 95197–95214. doi:10.1007/s11356-023-29149-6
Albrecht, T. R., Crootof, A., and Scott, C. A. (2018). The Water-Energy-Food Nexus: a systematic review of methods for nexus assessment. Environ. Res. Lett. 13, 043002. doi:10.1088/1748-9326/aaa9c6
Benson, D., Gain, A. K., and Rouillard, J. J. (2015). Water governance in a comparative perspective: from IWRM to a “nexus” approach? Water Altern. 8, 756–773.
Biswas, A. K. (2004). Integrated water resources management: a reassessment. Water Int. 29, 248–256. doi:10.1080/02508060408691775
Brown, S., Schreier, H., and Lavkulich, L. M. (2009). Incorporating virtual water into water management: a British Columbia example. Water Resour. Manag. 23, 2681–2696. doi:10.1007/s11269-009-9403-8
Cai, X., Wallington, K., Shafiee-Jood, M., and Marston, L. (2018). Understanding and managing the food-energy-water nexus – opportunities for water resources research. Adv. Water Resour. 111, 259–273. doi:10.1016/j.advwatres.2017.11.014
Campana, P. E., Lastanao, P., Zainali, S., Zhang, J., Landelius, T., and Melton, F. (2022). Towards an operational irrigation management system for Sweden with a water – food – energy nexus perspective. Agric. Water Manag. 271, 107734. doi:10.1016/j.agwat.2022.107734
Canada Energy Regulator (2018). Cer – provincial and territorial energy profiles - Manitoba. Available at: https://www.cer-rec.gc.ca/en/data-analysis/energy-markets/provincial-territorial-energy-profiles/provincial-territorial-energy-profiles-manitoba.html (Accessed October 28, 2021).
Canada Energy Regulator (2021). CER – provincial and territorial energy profiles – saskatchewan. Available at: https://www.cer-rec.gc.ca/en/data-analysis/energy-markets/provincial-territorial-energy-profiles/provincial-territorial-energy-profiles-saskatchewan.html (Accessed September 12, 2022).
Canada Energy Regulator (2022). CER – provincial and territorial energy profiles - Alberta. Available at: https://www.cer-rec.gc.ca/en/data-analysis/energy-markets/provincial-territorial-energy-profiles/provincial-territorial-energy-profiles-alberta.html [Accessed April 12, 2022].
Chang, C. W., Ushio, M., and Hsieh, C. (2017). Empirical dynamic modeling for beginners. Ecol. Res. 32, 785–796. doi:10.1007/s11284-017-1469-9
Clark, A. T., Ye, H., Isbell, F., Deyle, E. R., Cowles, J., Tilman, D., et al. (2015). Spatial convergent cross mapping to detect causal relationships from short time series. Ecology 96, 1174–1181. doi:10.1890/14-1479.1
Daher, B., Lee, S. H., Kaushik, V., Blake, J., Askariyeh, M. H., Shafiezadeh, H., et al. (2019). Towards bridging the water gap in Texas: a water-energy-food nexus approach. Sci. Total Environ. 647, 449–463. doi:10.1016/j.scitotenv.2018.07.398
Dalin, C., Konar, M., Hanasaki, N., Rinaldo, A., and Rodriguez-Iturbe, I. (2012). Evolution of the global virtual water trade network. Proc. Natl. Acad. Sci. U. S. A. 109, 5989–5994. doi:10.1073/pnas.1203176109
Dargin, J., Daher, B., and Mohtar, R. H. (2019). Complexity versus simplicity in water energy food nexus (WEF) assessment tools. Sci. Total Environ. 650, 1566–1575. doi:10.1016/j.scitotenv.2018.09.080
De Strasser, L., Lipponen, A., Howells, M., Stec, S., and Bréthaut, C. (2016). A methodology to assess the water energy food ecosystems nexus in transboundary river basins. WaterSwitzerl. 8, 59–28. doi:10.3390/w8020059
Dieter, C. A., Maupin, M. A., Caldwell, R. R., Harris, M. A., Ivahnenko, T. I., Lovelace, J. K., et al. (2018). Estimated use of water in the United States in 2015. Virginia, US: USGS. doi:10.3133/CIR1441
Ding, K. J., Gilligan, J. M., Yang, Y. C. E., Wolski, P., and Hornberger, G. M. (2021). Assessing food–energy–water resources management strategies at city scale: an agent-based modeling approach for Cape Town, South Africa. Resour. Conserv. Recycl 170, 105573. doi:10.1016/j.resconrec.2021.105573
D’Odorico, P., Davis, K. F., Rosa, L., Carr, J. A., Chiarelli, D., Dell’Angelo, J., et al. (2018). The global food-energy-water nexus. Rev. Geophys. 56, 456–531. doi:10.1029/2017RG000591
Elkamel, M., Valencia, A., Zhang, W., Zheng, Q. P., and Chang, N. B. (2023). Multi-agent modeling for linking a green transportation system with an urban agriculture network in a food-energy-water nexus. Sustain Cities Soc. 89, 104354. doi:10.1016/j.scs.2022.104354
Feldhoff, J. H., Donner, R. V., Donges, J. F., Marwan, N., and Kurths, J. (2012). Geometric detection of coupling directions by means of inter-system recurrence networks. Phys. Lett. A 376, 3504–3513. doi:10.1016/j.physleta.2012.10.008
Geweke, J. (1982). Measurement of linear dependence and feedback between multiple time series. J. Am. Stat. Assoc. 77, 304–313. doi:10.1080/01621459.1982.10477803
Ghoreishi, M., Elshorbagy, A., Razavi, S., Blöschl, G., Sivapalan, M., and Abdelkader, A. (2023). Cooperation in a transboundary river basin: a large-scale socio-hydrological model of the Eastern Nile. Hydrol. Earth Syst. Sci. 27, 1201–1219. doi:10.5194/hess-27-1201-2023
Government of Canada, (2018). Canada’s official greenhouse gas inventory - open government portal. Pollutant Inventories and Reporting Division, Environment and Climate Change Canada. Available at: https://open.canada.ca/data/en/dataset/779c7bcf-4982-47eb-af1b-a33618a05e5b (Accessed August 15, 2022).
Granger, C. W. J. (1969). Investigating causal relations by econometric models and cross-spectral methods. Econometrica 37, 424–438. doi:10.2307/1912791
Hall, P., and Martin, M. A. (1988). On bootstrap resampling and iteration. Biometrika 75, 661–671. doi:10.1093/biomet/75.4.661
Healey, M. C., and Wallace, R. R. (1987). Canadian aquatic resources. Regina, Canada: Dept. of Fisheries and Oceans.
Hirata, Y., and Aihara, K. (2010). Identifying hidden common causes from bivariate time series: a method using recurrence plots. Phys. Rev. E 81, 016203. doi:10.1103/physreve.81.016203
Hoekstra, A. Y., Chapagain, A. K., Aldaya, M. M., and Mekonnen, M. M. (2012). The water footprint assessment manual. doi:10.4324/9781849775526
Hsieh, C. H., Anderson, C., and Sugihara, G. (2008). Extending nonlinear analysis to short ecological time series. Am. Nat. 171, 71–80. doi:10.1086/524202
Kienzle, S. W. (2012). Water yield and streamflow trend analysis for Alberta watersheds. Edmonton, Canada: Alberta Innovates, Energy and Environment Solutions.
Komárek, V., Hrnčíř, Z., and Štěrbová, K. (2001). Synchronization as adjustment of information rates: detection from bivariate time series. Phys. Rev. E Stat. Phys. Plasmas Fluids Relat. Interdiscip. Top. 63, 1–6. doi:10.1103/PhysRevE.63.046211
Kraucunas, I., Clarke, L., Dirks, J., Hathaway, J., Hejazi, M., Hibbard, K., et al. (2015). Investigating the nexus of climate, energy, water, and land at decision-relevant scales: the Platform for Regional Integrated Modeling and Analysis (PRIMA). Clim. Change 129, 573–588. doi:10.1007/s10584-014-1064-9
Kropf, B., Schmid, E., and Mitter, H. (2021). Multi-step cognitive mapping of perceived nexus relationships in the Seewinkel region in Austria. Environ. Sci. Policy 124, 604–615. doi:10.1016/j.envsci.2021.08.004
Lant, C., Baggio, J., Konar, M., Mejia, A., Ruddell, B., Rushforth, R., et al. (2019). The U.S. food–energy–water system: a blueprint to fill the mesoscale gap for science and decision-making. Ambio 48, 251–263. doi:10.1007/s13280-018-1077-0
Laspidou, C. S., Mellios, N. K., Spyropoulou, A. E., Th, D., and Papadopoulou, M. P. (2020). Systems thinking on the resource nexus: modeling and visualisation tools to identify critical interlinkages for resilient and sustainable societies and institutions. Sci. Total Environ. J. 717, 137264. doi:10.1016/j.scitotenv.2020.137264
Loucks, D. P. (2009). Sustainable water resources management. Water Int. 25, 3–10. doi:10.1080/02508060008686793
Loucks, P. D., and Beek, E. van (1981). Water resource systems planning and management, an introduction to methods, models, and applications. Adv. Water Resour. 146. doi:10.1016/0309-1708(81)90046-4
Ma, H., Aihara, K., and Chen, L. (2014). Detecting causality from nonlinear dynamics with short-term time series. Sci. Rep. 4, 7464–7474. doi:10.1038/srep07464
Mahlknecht, J., González-Bravo, R., and Loge, F. J. (2020). Water-energy-food security: a Nexus perspective of the current situation in Latin America and the Caribbean. Energy 194, 116824–116841. doi:10.1016/j.energy.2019.116824
Mekonnen, M., and Hoekstra, A. Y. (2011). The green, blue and grey water footprint of crops and derived crop products. Hydrol. Earth Syst. Sci. 15, 1577–1600. doi:10.5194/hess-15-1577-2011
Mekonnen, M. M., and Hoekstra, A. Y. (2010). The green, blue and grey water footprint of farm animals and animal products.
Molajou, A., Afshar, A., Khosravi, M., Soleimanian, E., Vahabzadeh, M., and Variani, H. A. (2021a). A new paradigm of water, food, and energy nexus. Environ. Sci. Pollut. Res. 30, 107487–107497. doi:10.1007/s11356-021-13034-1
Molajou, A., Pouladi, P., and Afshar, A. (2021b). Incorporating social system into water-food-energy nexus. Water Resour. Manag. 35, 4561–4580. doi:10.1007/s11269-021-02967-4
Næss, J. S., Cavalett, O., and Cherubini, F. (2021). The land–energy–water nexus of global bioenergy potentials from abandoned cropland. Nat. Sustain 4, 525–536. doi:10.1038/s41893-020-00680-5
Natural Resources Canada (2018). Comprehensive energy use database | natural resources Canada. Available at: https://oee.nrcan.gc.ca/corporate/statistics/neud/dpa/menus/trends/comprehensive_tables/list.cfm (Accessed March 28, 2022).
Natural Resources Canada, A. of C (2016). Land area, Canada. Available at: https://www150.statcan.gc.ca/n1/pub/11-402-x/2012000/chap/geo/tbl/tbl06-eng.htm (Accessed December 25, 2020).
Nhamo, L., Mabhaudhi, T., Mpandeli, S., Dickens, C., Nhemachena, C., Senzanje, A., et al. (2020). An integrative analytical model for the water-energy-food nexus: South Africa case study. Environ. Sci. Policy 109, 15–24. doi:10.1016/j.envsci.2020.04.010
Papalexiou, S. M. (2018). Unified theory for stochastic modelling of hydroclimatic processes: preserving marginal distributions, correlation structures, and intermittency. Adv. Water Resour. 115, 234–252. doi:10.1016/j.advwatres.2018.02.013
Pomeroy, J. W., Fang, X., and Williams, B. (2013). Impacts of climate change on regional water resources. J. Indian Inst. Sci. 93, 227–242.
Purwanto, A., Sušnik, J., Suryadi, F. X., and de Fraiture, C. (2021). Quantitative simulation of the water-energy-food (WEF) security nexus in a local planning context in Indonesia. Sustain Prod. Consum. 25, 198–216. doi:10.1016/j.spc.2020.08.009
Raychaudhuri, S., Granja, C., and Leroy, C. (2008). Introduction to Monte Carlo simulation. AIP Conf. Proc. 1204, 17–21. doi:10.1063/1.3295638
Runge, J., Bathiany, S., Bollt, E., Camps-Valls, G., Coumou, D., Deyle, E., et al. (2019). Inferring causation from time series in Earth system sciences. Nat. Commun. 10, 2553–2566. doi:10.1038/s41467-019-10105-3
Saed, B., Afshar, A., Jalali, M. R., Ghoreishi, M., and Aminpour Mohammadabadi, P. (2018). A water footprint based hydro-economic model for minimizing the blue water to green water ratio in the Zarrinehrud river-basin in Iran. AgriEngineering 1, 58–74. doi:10.3390/agriengineering1010005
Saed, B., Elshorbagy, A., and Razavi, S. (2022). “Causality analysis in the water-energy-food nexus in the Canadian prairies,” in EGU general assembly conference abstracts. EGU22-10955.
Si, Y., Li, X., Yin, D., Li, T., Cai, X., Wei, J., et al. (2019). Revealing the water-energy-food nexus in the Upper Yellow River Basin through multi-objective optimization for reservoir system. Sci. Total Environ. 682, 1–18. doi:10.1016/j.scitotenv.2019.04.427
Soleimanian, E., Afshar, A., and Molajou, A. (2022). A review on water simulation models for the WEF Nexus: development perspective. Environ. Sci. Pollut. Res. 29, 79769–79785. doi:10.1007/s11356-022-19849-w
Stark, J., Broomhead, D. S., Davies, M. E., and Huke, J. (2003). Delay embeddings for forced systems. II. Stochastic forcing. J. Nonlinear Sci. 13, 519–577. doi:10.1007/s00332-003-0534-4
Statistics Canada (2017). Physical flow account for water use. Table 38-10-0250-01. Available at: https://www150.statcan.gc.ca/t1/tbl1/en/cv.action?pid=3810025001 (Accessed August 12, 2021).
Statistics Canada (2018a). Environment-Canada’s water yield. Available at: https://www150.statcan.gc.ca/n1/pub/11-402-x/2011000/chap/env/env-eng.htm (Accessed March 6, 2021).
Statistics Canada (2018b). Irrigation volume by province and drainage region. doi:10.25318/3810023901-eng
Statistics Canada (2020a). Estimated areas, yield, production, average farm price and total farm value of principal field crops. Ottawa, Canada: Statistics Canada. Table 32-10-0359-01. doi:10.25318/3210035901-eng
Statistics Canada (2020b). Gross domestic product (GDP) at basic prices, by industry. monthly (x 1,000,000). Table 36-10-0434-01. doi:10.25318/3610043401-eng
Statistics Canada (2020c). Livestock watering - agriculture and agri-food Canada (AAFC). Available at: https://www.agr.gc.ca/eng/agriculture-and-the-environment/agricultural-practices/agriculture-and-water/livestock-watering/?id=1370558638358 (Accessed March 4, 2021).
Sugihara, G., May, R., Ye, H., Hsieh, C. H., Deyle, E., Fogarty, M., et al. (2012). Detecting causality in complex ecosystems. Science 338 (1979), 496–500. doi:10.1126/science.1227079
Sugihara, G., and May, R. M. (1990). Nonlinear forecasting as a way of distinguishing chaos from measurement error in time series. Nature 344, 734–741. doi:10.1038/344734a0
Sušnik, J. (2015). Economic metrics to estimate current and future resource use, with a focus on water withdrawals. Sustain Prod. Consum. 2, 109–127. doi:10.1016/j.spc.2015.05.003
Sušnik, J. (2018). Data-driven quantification of the global water-energy-food system. Resour. Conserv. Recycl 133, 179–190. doi:10.1016/j.resconrec.2018.02.023
Sušnik, J., and van der Zaag, P. (2017). Correlation and causation between the UN Human Development Index and national and personal wealth and resource exploitation. Econ. Research-Ekonomska Istraz. 30, 1705–1723. doi:10.1080/1331677X.2017.1383175
Takens, F. (1981). “Detecting strange attractors in turbulence,” in Dynamical systems and turbulence, Warwick 1980 (Springer), 366–381.
Tsonis, A. A., Deyle, E. R., Ye, H., and Sugihara, G. (2018). Convergent cross mapping: theory and an example. Adv. nonlinear geosciences, 587–600. doi:10.1007/978-3-319-58895-7_27
Vahabzadeh, M., Afshar, A., Molajou, A., Parnoon, K., and Ashrafi, S. M. (2023). A comprehensive energy simulation model for energy-water-food nexus system analysis: a case study of the great Karun water resources system. J. Clean. Prod. 418, 137977. doi:10.1016/j.jclepro.2023.137977
Valin, H., Havlík, P., Mosnier, A., Herrero, M., Schmid, E., and Obersteiner, M. (2013). Agricultural productivity and greenhouse gas emissions: trade-offs or synergies between mitigation and food security? Environ. Res. Lett. 8, 035019–035031. doi:10.1088/1748-9326/8/3/035019
Wang, X., Dong, Z., and Sušnik, J. (2023). System dynamics modelling to simulate regional water-energy-food nexus combined with the society-economy-environment system in Hunan Province, China. Sci. Total Environ. 863, 160993–161008. doi:10.1016/j.scitotenv.2022.160993
Waughray, D. (2011). Water security the water-food-energy-climate nexus: the World Economic Forum water initiative.
Wen, C., Dong, W., Zhang, Q., He, N., and Li, T. (2022). A system dynamics model to simulate the water-energy-food nexus of resource-based regions: a case study in Daqing City, China. Sci. Total Environ. 806, 150497. doi:10.1016/j.scitotenv.2021.150497
Wu, L., Elshorbagy, A., and Helgason, W. (2023). Assessment of agricultural adaptations to climate change from a water-energy-food nexus perspective. Agric. Water Manag. 284, 108343. doi:10.1016/j.agwat.2023.108343
Wu, L., Elshorbagy, A., Pande, S., and Zhuo, L. (2021). Trade-offs and synergies in the water-energy-food nexus: the case of Saskatchewan, Canada. Resour. Conserv. Recycl 164, 105192. doi:10.1016/j.resconrec.2020.105192
Yi, J., Guo, J., Ou, M., Pueppke, S. G., Ou, W., Tao, Y., et al. (2020). Sustainability assessment of the water-energy-food nexus in Jiangsu Province, China. Habitat Int. 95, 102094. doi:10.1016/j.habitatint.2019.102094
Keywords: WEF nexus, causality analysis, multispatial convergent cross mapping, greenhouse gas emissions, gross domestic product, Canadian prairies
Citation: Saed B, Elshorbagy A and Razavi S (2024) Quantifying interactions in the water-energy-food nexus: data-driven analysis utilizing a causal inference method. Front. Environ. Sci. 11:1328009. doi: 10.3389/fenvs.2023.1328009
Received: 25 October 2023; Accepted: 21 December 2023;
Published: 11 January 2024.
Edited by:
Guoqiang Tang, National Center for Atmospheric Research (UCAR), United StatesReviewed by:
Dimitris Kofinas, University of Thessaly, GreeceRabi Mohtar, Texas A and M University, United States
Copyright © 2024 Saed, Elshorbagy and Razavi. This is an open-access article distributed under the terms of the Creative Commons Attribution License (CC BY). The use, distribution or reproduction in other forums is permitted, provided the original author(s) and the copyright owner(s) are credited and that the original publication in this journal is cited, in accordance with accepted academic practice. No use, distribution or reproduction is permitted which does not comply with these terms.
*Correspondence: Behdad Saed, behdad.saed@usask.ca