Research on optimization of approach procedures for airports in an alpine environment
 Li Lu
Li Lu Xin Lai
 Junliang Jiang
 Juncheng Zhou
- School of Air Traffic Management, Civil Aviation Flight University of China, Guanghan, Sichuan, China
Obstacles in alpine environments pose significant challenges to aircraft safety during terminal operations. Key challenges include constraints from obstacles within the terminal clearance area and the labor-intensive manual calculations of flight procedures. The focal point of concern lies in the design of approach procedures, particularly due to the heightened risk of collisions with obstacles during the descent segment in such terrain. To address these challenges, initially, this paper proposes processing the terrain data and visualizing and extracting the topographic data of the alpine airport by adopting a bi-cubic b-spline interpolation and cellular automatic machine model. Then, the paper proposes improving the A* path algorithm to make sure it can obey the standards of flight procedure design, utilizing the improved A* path algorithm to design approach procedures. As fuel consumption is directly connected with the economy of aviation companies, this research finally suggests employing the fuel consumption evaluation model to select the most efficient approach flight procedures. This research takes a case study of a Yunnan airport and simulates and designs the optimized approach procedures by A* path algorithm and evaluation based on fuel consumption. Results indicate that the parameters of optimized approach procedures align with the regulation of flight procedure design and meet the requirements of real flight operation. Therefore, the core tenant of this research can provide a feasible idea for flight procedures with alpine airports and has the potential to reduce workload and enhance operational efficiency.
1 Introduction
When an aircraft is flying over towering mountains, there exists a constant risk of collision with the terrain. The western regions of China are predominantly rounded with mountainous areas, which means that the profile changes of terrain elevation exceed 900 m (3 000 ft) within a distance of 18.5 km (10.0 NM). Despite this, the tourism industry in these regions has always flourished; therefore, it is imperative to develop the aviation transportation in these alpine areas. Currently, the flight procedures of alpine airports confront limitations arising from the extensive reliance on manual design and calculation for obstacle clearance height. Consequently, it is necessary to solve the problem of the presence of numerous obstacles during aircraft departure and arrival in these mountainous terrains, and replace the manual workload with intelligence methods.
The approach segment, as a critical period within the entire flight phase, is considered pivotal due to the numerous potential hazards that aircraft may encounter. When the aircraft descends during the approach segment, the pilot’s attention is highly concentrated on the aircraft’s landing configuration, aligning with the runway, or descent gradient requirements, and other operational procedures. Because of this, when approaching the complex alpine environment, it is easy for aircraft to collide with the mountain. Therefore, flight procedure design (DOC8168) serves as a primary foundation for airport safety operations. However, the manual calculations are prone to errors and some mistakes, so intelligent approach procedure design has become a focal point for research, especially in situations where terrain is complex (Rahim and Malaek, 2007; Liu et al., 2018).
The authors of this research have done some work in 2022 to optimize approach trajectories (Lu and Liu, 2022); in this paper, they will continue to address the optimization of approach procedures in alpine environments. Drawing upon the standards of Performance-Based Navigation procedures design (ICAO), an algorithmic model serves as the foundation for formulating approach flight procedures in alpine airports. Leveraging MATLAB software facilitates the design and simulation of these procedures, producing approach flight trajectories. Through an evaluation framework that considers fuel consumption, the approach procedures are optimized to offer a dependable solution for enhancing the manual calculation and design of approach flight procedures. This optimization not only contributes to increased safety but also provides valuable ideas for augmenting airspace utilization in alpine terminal areas (Malaek and Kosari, 2007; Lu, 2019).
Based on the former considerations, this research will start with the perspective of secondary improvement of the A* algorithm and conduct simulation research on the approach flight procedures of mountainous airports. The holistic idea of the paper is shown in Figure 1.
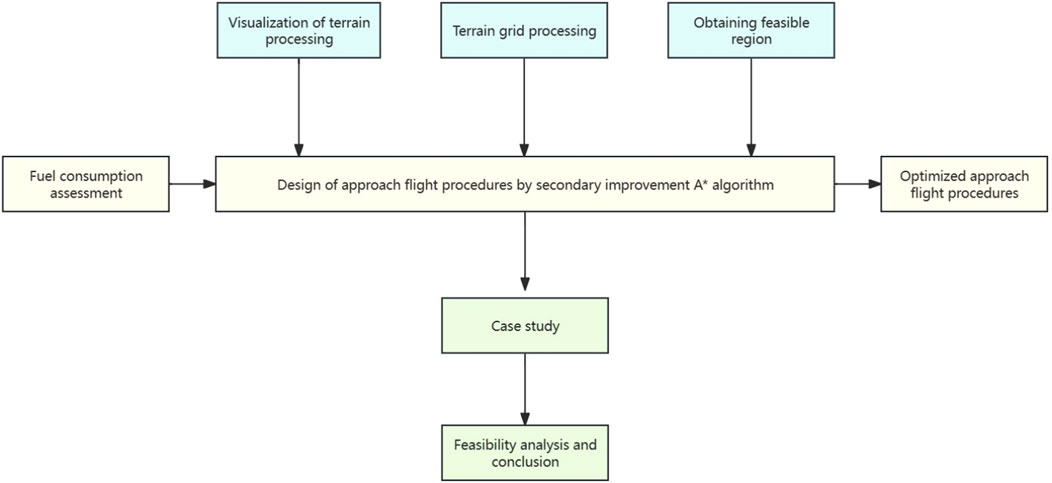
FIGURE 1. Flow chart of the research idea.
2 State of arts
Experts and scholars have conducted extensive research on instrument flight procedures design, using safety assessment and simulation in the early stages. In 2015, Qian Ge adopted the ant colony algorithm to design and improve the departure and arrival procedures of Lanzhou airport, and conducted optimization evaluation, providing a good method for further procedure design (Qian, 2015). In 2017, Zhao Qian conducted an optimization evaluation of the approach segment of the flight procedures based on GIS software (Zhao, 2017). In 2018, scholars such as Chen Shaoqian used the A* algorithm to optimize flight trajectories based on thumbnails (Chen et al., 2019). In 2019, Tang Li and others used an improved ant colony algorithm to simulate unmanned aerial vehicles transporting disaster relief materials in mountainous areas (Tang et al., 2019). The above research has laid an important foundation for the subsequent research of path optimization algorithms to solve civil aviation operation problems.
Scholars both domestically and internationally have conducted significant research on the visualization of three-dimensional terrain. In 2015, scholars such as Plat N combined the Kriging interpolation method with LiDAR to calculate the average elevation values of terrain, thus obtaining more accurate terrain elevation values (Plat et al., 2015). In 2016, Zhao Qian used C language to program ArcGIS software for grid simulation of three-dimensional terrain in the field and combined the advantages of A * and Dijkstra algorithm to explore the optimal trajectory in complex environments (Zhao, 2016). In 2017, scholars such as He Shan used DLG interpolation to simulate three-dimensional terrain, providing a reference for selecting DEM data to simulate three-dimensional elevation terrain (He et al., 2017). In 2018, scholars such as Yuan Wei established a grid terrain elevation map using V parallax, which has important significance for the accurate expression of terrain visualization (Yuan et al., 2018).
Experts in the aviation field have conducted in-depth research on the calculation and evaluation of flight fuel consumption. The calculation of flight fuel consumption not only saves costs for aviation operators from an economic perspective, but also serves as an important reference for flight trajectory optimization evaluation. In 1982, Bela P. Collins adopted the principle of energy conservation for fuel consumption assessment. This method evaluated and predicted fuel consumption by calculating parameters such as thrust and speed. This method was a cornerstone for subsequent research (Collins, 1982). In 2010, Wang Changkun provided ideas for calculating fuel consumption based on multiple linear regression analysis; results show that this method can correctly obtain the value of fuel consumption (Wang, 2010).
The above research provides important ideas for this research, but more work is needed to design flight procedures with intelligence algorithms, especially approach procedures. This is because, due to the steep terrains around the alpine airports, uncontrollable factors can easily occur, for example, it can result in collision during approach flight. In addition, the difficulty of manual design means the research is urgent.
3 The processing of terrain
3.1 Visualizing of terrain
To design the approach flight procedures for alpine airports, data on the surrounding terrain is needed. It is necessary to acquire the basic information of the airport, such as the magnetic direction of the runway and the clearance conditions of airport. The most important consideration is the surroundings of high natural mountains that can pose a safety hazard to aircraft operation. It is then necessary to execute to visualize the terrain, finally extracting terrain height data (Campos et al., 2016).
In order to visualize the three-dimensional terrain of the airport terminal area, equidistant sampling of the terrain is necessary to further apply the corresponding visualization algorithm. In this research, bi-cubic b-spline interpolation is used, as its simulation difference has lower noise performance, better continuity, and higher smoothness.
Bi-cubic b-spline interpolation is based on b-splines to perform interpolation calculations on any two directions of a spatial surface, resulting in better local deformation and better locality and continuity of the graph. The principle of this method is to calculate pixel values in units of 16 control points, which can be written in a matrix form as shown in Formula 1:
Firstly, each row of control points is interpolated. The matrix has four columns of row vectors, so four columns of b-spline interpolation curves can be obtained. The expression can be written as a formula, as shown in Formula 2:
Among them,
Among them, the values of s are between 0 and 1. Since the bi-cubic b-spline interpolation method interpolates in two directions simultaneously, assuming these two directions, it can be written as two directional vectors: and. Therefore, the cubic spline interpolation expression in the direction can be written as a matrix, as shown in Formula 7:
Due to the continuous changes between 0 and 1 after weighting, the values in the other direction v also continuously change between 0 and 1. From the above results, the bicubic b-spline interpolation matrix of the three-dimensional surface can be obtained, as shown in Formula 8:
Using the bi-cubic b-spline interpolation method to simulate the saddle surface, as shown in Figure 2, it can be seen that the error accuracy of the saddle surface effect simulated by the bi-cubic b-spline interpolation algorithm reaches 0, with good continuity performance; this method can be used for simulation research on continuous terrain.
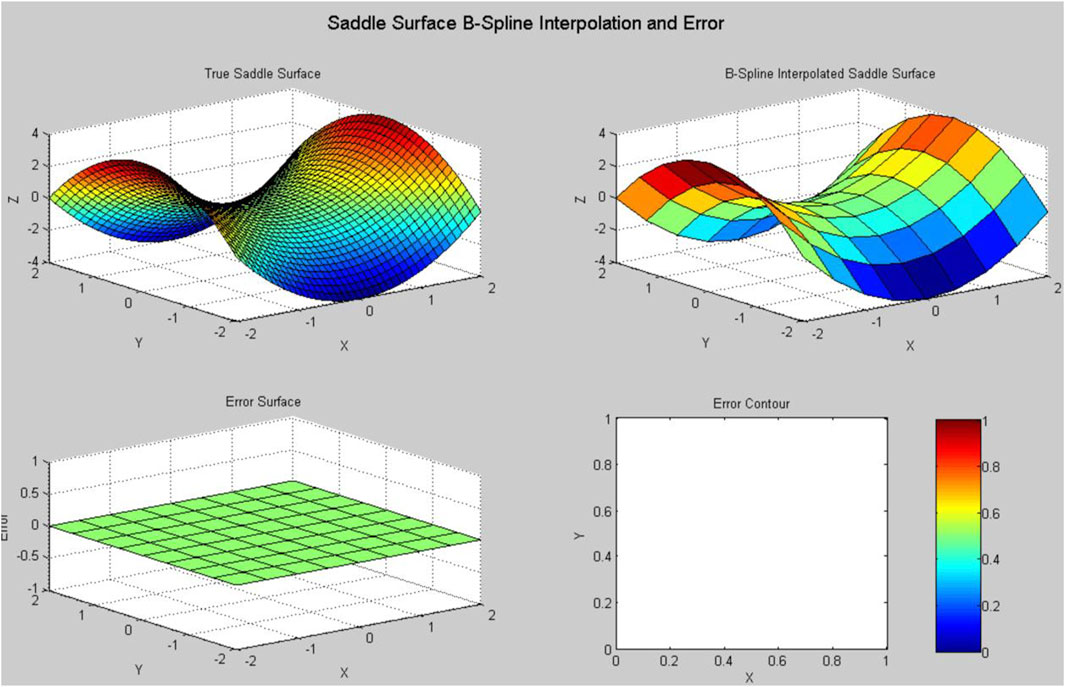
FIGURE 2. The saddle surface simulation.
The following terrain figure is a visual simulation of mountainous terrain by taking an example. MATLAB is used to simulate the sampling terrain points combined with the bicubic B-spline interpolation method; the three-dimensional terrain and two-dimensional contour map of the mountainous area are shown as Figures 3, 4. It can be seen that the terrain and topography of the mountainous area can be well performed.
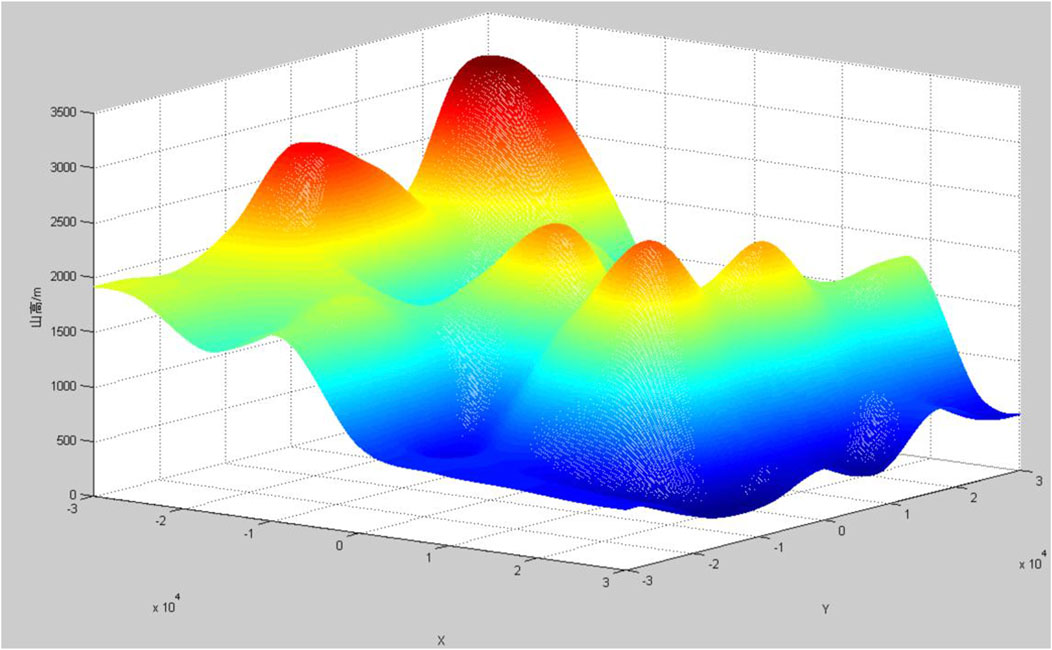
FIGURE 3. Three-dimensional terrain display.
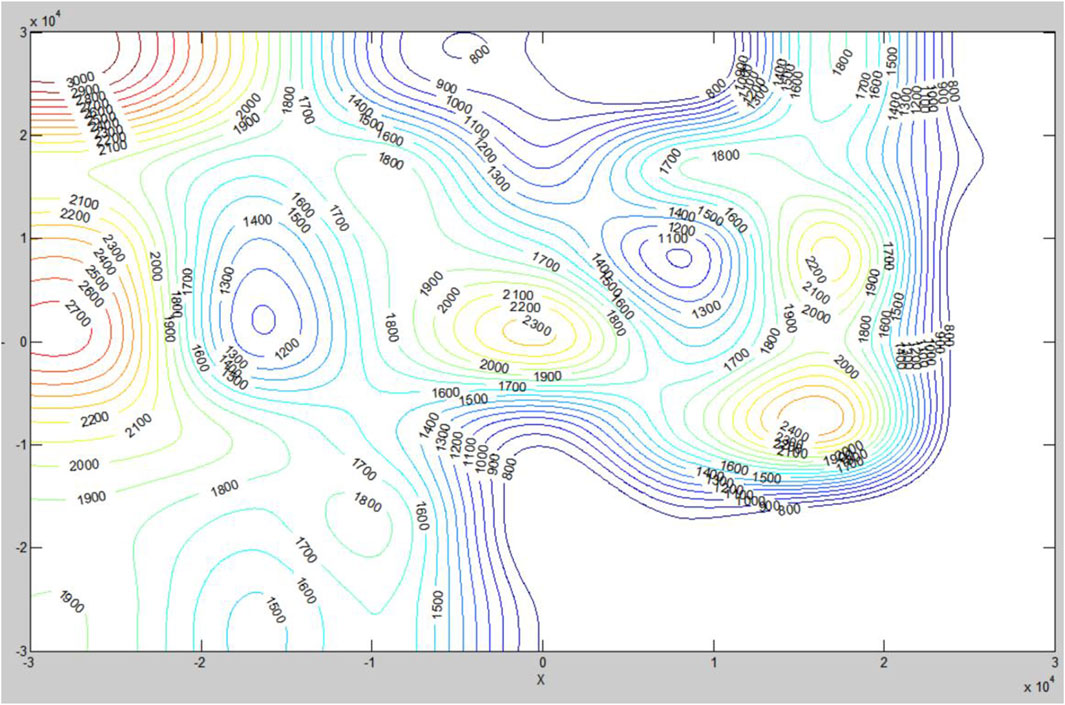
FIGURE 4. Contour map.
3.2 Extraction of terrain data
After presenting the terrain in three-dimensional format, it is necessary to do grid processing of the terrain to extract terrain height and position information, making it more convenient for outputting approach procedures and identifying terrain obstacles. This study uses the Cellular Automatic machine model to process grids. For example, if the cell is assigned a value of 1, the grid can pass at the next moment, indicating that there are no obstacles at the previous moment. If the cell is assigned a value of 0, the grid is not accessible at the next moment, indicating that there were obstacles at the previous moment.
The more grids the model selects, the more accurate the simulation results will be. When using a cellular automatic machine to process terrain, each grid contains four pieces of information: longitude, latitude, terrain elevation, and traffic status. This research selects three-dimensional Cartesian coordinates: X (longitude), Y (latitude), Z (terrain elevation), and 0–1 (traffic status, 1 means that the obstacles in the grid can pass through at this moment) (Kozmus Trajkovski et al., 2020).
After obtaining the terrain of the airport terminal area, the matrix with terrain elevation Z is shown in Formula 9; n*n means the number of grids (Lee and Shim, 2014).
Among them, h represents the terrain elevation information that is contained in every cellular units. The larger the number of grids n, the higher the accuracy.
3.3 The minimum stabilization distance
The design scope of the approach flight procedures involves the whole area of the terminal airport (Chandra et al., 2016). After the terrain is processed to grids, it is necessary to select the relatively low terrain area as a feasible area for setting the waypoint. When the flight segment distance is not less than the minimum stabilization distance (MSD), it is necessary to ensure that the aircraft has sufficient margins to cut into the next scheduled flight segment. Therefore, this study uses MSD as a constraint when selecting a waypoint. If there are two way points on one trajectory, the minimum distance between them is equal to the sum of the MSD of all segments (ICAO, 2014). In general, the MSD of way points in different situations can be obtained by referring to DOC8168, because the turning angle of an aircraft is always less than 120°, so the relationship between the speed of the aircraft and MSD can be shown as in Table 1:

TABLE 1. The minimum stabilization distance (maxed changing angle 120°).
For example, if the flight speed is less than 400 km/h, the MSD at one two way point is 4.7km, so the MSD between the two way points will be double, which is 9.4 km. Therefore, we use a method that draws a circle with the current position as the center and is no less than the MSD as the radius to find a feasible region, when the aircraft is at an airport or a certain waypoint, as shown in Figure 5. Then, a certain altitude is set to limit the terrain obstacles on the circumference, and a relatively low terrain area as a feasible region is selected and marked in green, as in Figure 5. This can allow the selection of the most suitable waypoint within the feasible regions, and the parameters can show the flight procedure design requirements.
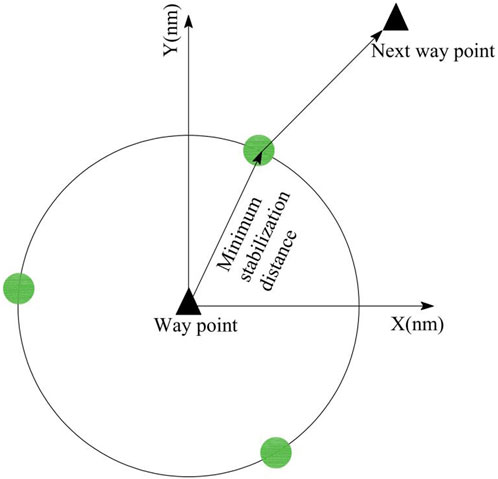
FIGURE 5. MSD used in feasible regions definition.
4 Approach flight procedures design algorithm and optimization evaluation model
4.1 Approach flight procedures design algorithm
The most important element in designing an approach procedure for alpine environments is defining a suitable algorithm or model to do the movement path plan. The movement of an object seems to be very simple, but it is actually very complex. Many scientific researchers have been exploring and improving various path optimization algorithms. In 1959, Dutch computer scientist Dijkstra studied vector path maps and developed the Dijkstra algorithm. Later, heuristic algorithms were added to the A-Star (A*) algorithm to scientifically process the optimal path results based on the Dijkstra algorithm (Hentzen et al., 2018; Dunn and Shultis, 2022).
For static environment path planning, A* and Dijkstra algorithms are usually used; Dijkstra is also used for dealing with partial problems and is suitable for non-direct graphs. Conversely, A* is more suitable for directed graphs and is specifically designed for overall path optimization. As for this research, the mountains in alpine environments are a static obstacle, so the design of the approach trajectory should automatically find all the areas of the alpine terrain to define the best result. Therefore, in this research, an improved A* algorithm was selected to solve the background problem mentioned before (González-Arribas et al., 2019).
The classical model of the A* algorithm is to compare various nodes and then add the compared nodes to the path library. The mechanism for finding the path in each step can be seen as a function guide. Based on this, the A* algorithm can be written as Formula 10:
The relationship between F(n), G(n), and H(n) is not a real additive relationship, as shown in Formula 10. F(n) represents the total path from the starting point to the destination by using the A* algorithm; G(n) is an evaluation function representing the displacement generated from the starting point to the destination, every displacement between grids is 1, and the farther the destination is from the starting point, the larger the displacement is. H(n) represents a heuristic guidance function: if the heuristic function is 0, the A* algorithm is equivalent to the Dijkstra algorithm, and different heuristic functions produce different path algorithm results. The weaker the heuristic function, the more nodes the A* algorithm generates, resulting in a longer operation time. When the number of steps required between the starting and destination points is exactly equal to the heuristic function, the optimal solution is generated, and its function is to preset the direction of the path.
4.1.1 First improvement of the A* algorithm
The difference between the A* algorithm and other path algorithms is that it contains heuristic functions, which can be divided into various types. The commonly used distances include Manhattan distance and Euclidean distance. These two distances take different paths with obstacles. The following introduction will compare in detail the two heuristic functions andnd make an improvement on the A* algorithm by resetting the heuristic function if necessary (Hongyan et al., 2021).
The Manhattan distance is the default heuristic function of the A* algorithm, which is shown as Formula 11, but its optimization idea is only to find the next point with the shortest step compared to the previous position.
Euclidean distance is also a commonly used heuristic function, which is shown as Formula 12, and its optimization idea is to refer to the whole process, which is from the starting point to the final destination, using the Pythagorean theorem as a model to define the shortest distance to reach the destination.
In this part, a simple obstacle avoidance simulation can be conducted using Matlab for these two heuristic functions respectively. Firstly, grid processing to the terrain is carried out to obtain terrain data and set up the obstacles. The next step is to program the A* algorithm; after running, the software can automatically find the shortest path from the starting point to the ending point. The black blocks represent the obstacles and the green block represents the starting point. From the simulation results, it can be seen that the A* algorithm for Manhattan distance only considers the shortest distance of each step, shown as Figure 6, while the Euclidean distance considers the optimal path of the entire simulation field, shown as Figure 7.
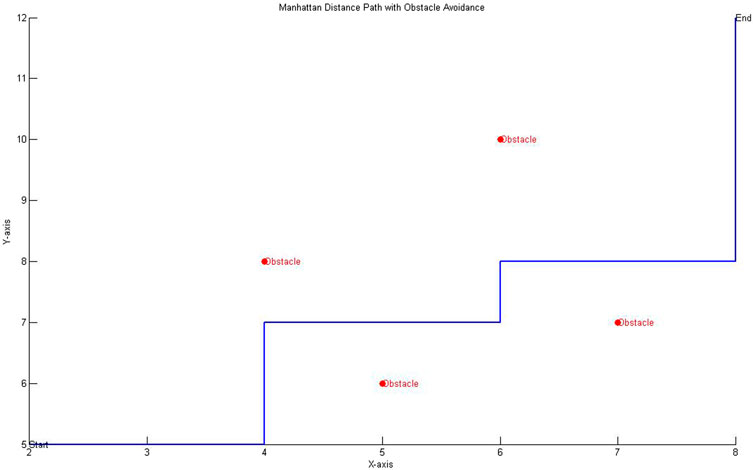
FIGURE 6. Manhattan distance display.
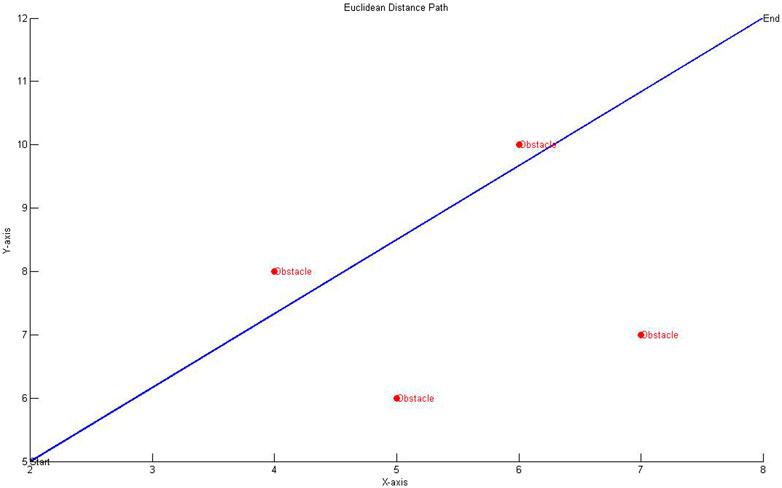
FIGURE 7. Euclidean distance display.
Based on the above analysis, the first improvement of the A* algorithm is to set the heuristic function to Euclidean distance, and select the next way point among the eight 3 dimensional grids around the coordinate field, as shown in Figure 8.
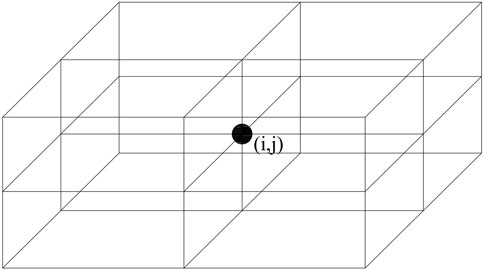
FIGURE 8. Way points of every step.
4.1.2 Second improvement of A* algorithm
The A* algorithm needs to meet the DOC8168 operational standards to obtain the optimal path. However, in practical situations, obstacles in mountainous airports pose a threat to flight safety. In order to seek the optimal approach trajectory, the A* algorithm needs to be further improved to meet the obstacle clearance rules of the flight procedure design (Hasegawa et al., 2015).
Each grid contains information on approaching aircraft, such as height, position, gradient, and time. Therefore, the requirement for obstacle avoidance needs to meet two key conditions. The first key condition is that the highest obstacle in each grid will be seen as the controlling obstacle, which will control the minimum flight height of each segment, so the aircraft height will be measured by the controlling obstacle, which can be depicted as Formula 13:
Here, the minimum obstacle clearance is MOC, Ho represents the height of the aircraft, and hobs represents the height of the controlling obstacle in the grid area.
As to the approach procedure, the flight trajectory still needs to meet the descent gradient, that is, Hpnext represents the altitude of the controlling obstacle in the next grid, the current aircraft altitude is Ho, and the distance between two near grids is d. The relationship between them is shown in Formula 14.
The maximum Gr of the approach flight program shall not exceed 8% in the initial approach segment, with an MOC of 300 m and a maximum turning angle of 120°. The maximum Gr of the intermediate approach segment shall not exceed 5.2%, the MOC shall be 150 m, and the maximum turning angle shall not exceed 30°. The maximum Gr of the final approach segment shall not exceed 6.1%, with a MOC of 75 m, consistent with the runway center line (Paveen et al., 2020).
4.2 Fuel consumption evaluation model
The trajectories of approach can be easily obtained using the improved A* algorithm; how to select the most optimized approach procedures will be addressed in this step. The consumption of fuel affects the operating costs of airlines, what’s more, the further aircraft fly, the more fuel is consumed, and the higher the risk of delay to the next flight phase. Therefore, using fuel consumption to analyze the feasibility of approach trajectory is the best. This research compares the fuel consumption of different approach procedures as the main evaluation factor. However, fuel consumption is related to various factors, such as flight altitude, speed, different flight segments, and number of engines (Olmstead et al., 2002).
During the aircraft approach process, gravity provides the forward force for the aircraft during the descent period, and the approach segment can be considered as a continuous descent. Referring to the BADA manual (Thomas et al., 2004; Clarke et al., 2006), a function of the fuel flow rate for a single engine per unit time and flight altitude can be shown as in Formula 15:
Among them, Cf3 and Cf4 is the fuel consumption coefficient in the descending section (unit: kg/min *N), as shown in Table 2 h represents the standard sea level pressure altitude (in feet) at the current position of the aircraft (Zeh et al., 2020). If N represents the number of engines installed on a certain type of aircraft, the total fuel consumption of the aircraft from time t0 to time t1, according to BADA manual, the total fuel consumption of the approach segment can be expressed as Formula 16.
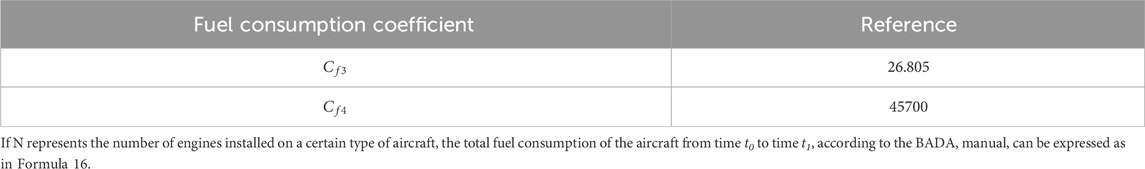
TABLE 2. The fuel consumption coefficient.
Due to the fact that the fuel flow rate per unit time during the descent segment is related to the altitude of the aircraft, conversion is required. The conversion between time t and altitude h for aircraft can be written as in Formula 17:
Among them, s represents the flight displacement and gr represents the descent gradient of the aircraft. The relationship between them can be obtained by Formula 18 after transformation.
By solving differential Eq. 18, the relationship between aircraft altitude and time can be obtained as shown in Formula 19:
Here, Ho represents the initial altitude of the aircraft during the descent segment.
With the transformation, the whole fuel consumption of the approach procedure can be depicted as in Formula 20:
Through the aforementioned fuel evaluation formulas, the comprehensively optimal approach procedure can be determined, since the formulas are associated with flight distance s, flight altitude h, flight time t, and descent gradient gr during the conversion process. The evaluation also covers a wide range, demonstrating good feasibility.
5 Case study
This section builds upon established optimization algorithm theories to study practical airport cases, employing MATLAB for the simulation and design of the airport’s approach flight procedures.
This research takes one airport in the mountainous area of Yunnan as a case study. The elevation of this airport is 863m, the magnetic direction of the runway is 045° and 225°, and the length and width are 2600 * 45 (m). The airport is located in a valley, surrounded by high mountains 5 km away, with a magnetic direction of 072° relative to the airport reference point. At a distance about 40 km, there are obstacles with elevations of 3000 m, 2326 m, 2229 m, and 1686 m in the area. Therefore, when designing the approach procedures manually, it is difficult to overcome natural mountains. Therefore, this research will adopt intelligence modeling for simulation testing.
For the terrain data of 60 square kilometers around this airport, equidistant sampling points were conducted, as shown in Table 3, where the terrain data have been adjusted and modified.
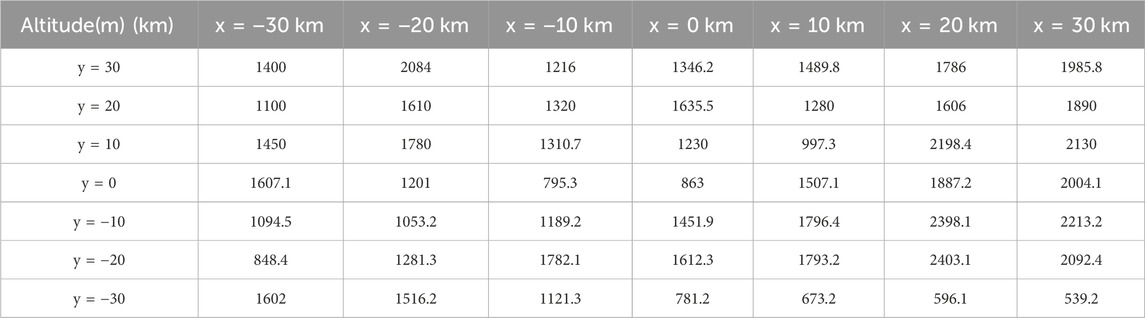
TABLE 3. Equidistant sampling points of the practical terrain (in meters).
Firstly, using the bi-cubic b-spline interpolation method for 3D modeling and simulation, the airport coordinate points are (0,0), and the approach points are B and P way points. According to Figures 9, 10, it can be seen that this airport is located in a mountainous terrain similar to a canyon, and the ups and downs of the terrain continually changing can be seen from the simulation map.
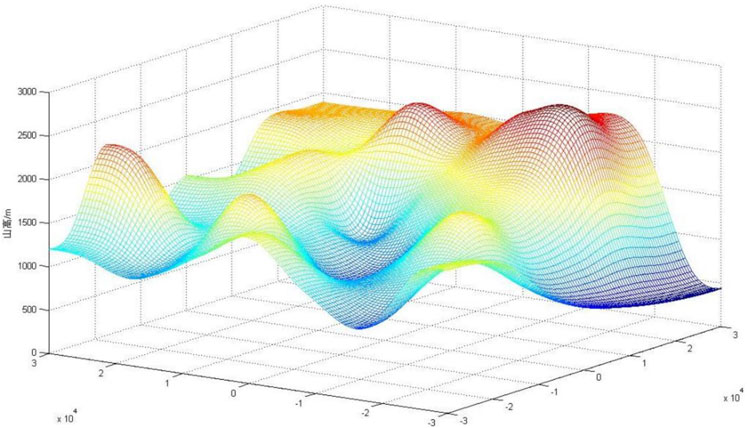
FIGURE 9. Three-dimensional of the practical terrain.
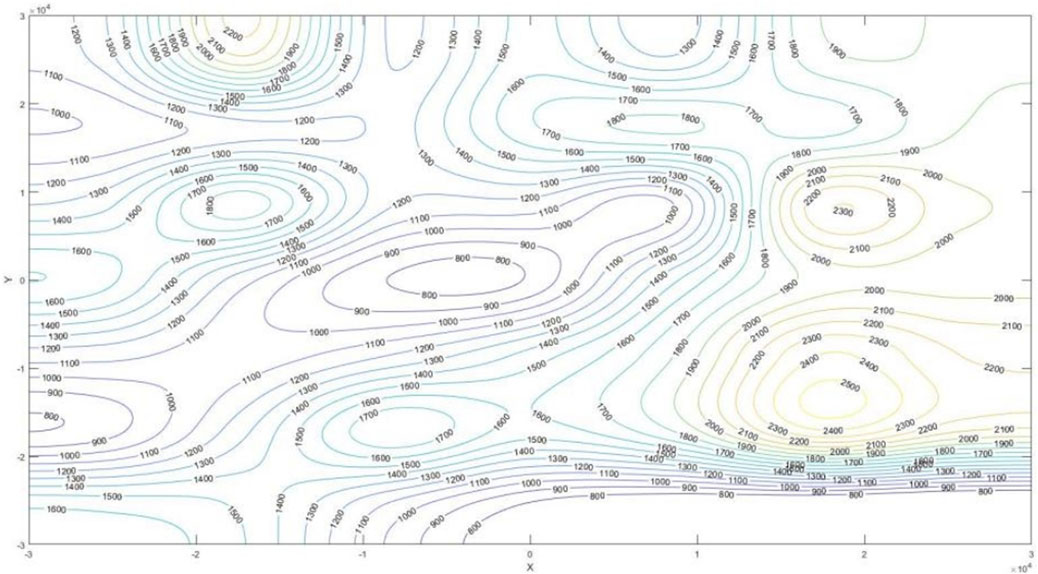
FIGURE 10. Contour map of the practical terrain.
Secondly, the cellular automaton model is adopted for grid processing of the terrain. The more grids, the smaller the obstacles will be included in the terrain range, and the higher the calculation accuracy. In this research, the terrain of the airport is divided into grids with an equal distance of 1 km, as shown in Figure 11:
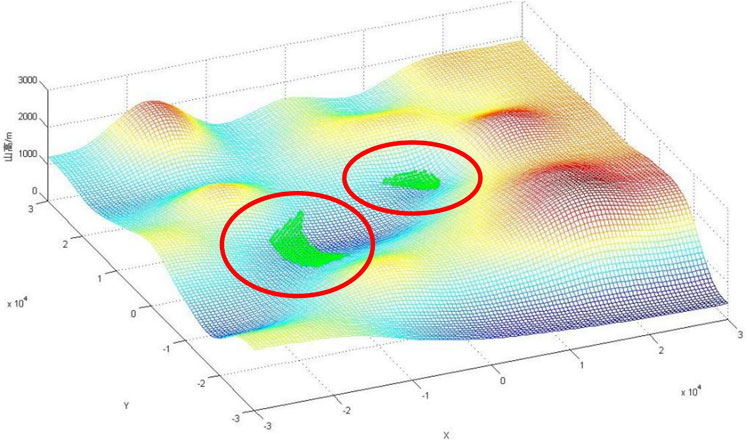
FIGURE 11. The feasible regions near the airport.
After the terrain of this airport terminal area is grid processed, each grid is assigned information such as terrain height, location, and time, as shown in Figure 11. The green area represents the feasible region.
The design of the approach procedures adopts the twice-improved A* algorithm in this research. Starting from the arrival way points B(1,n) and P(n/2,n/2), n stands for the number of grids within the terminal terrain, so n equals to 120 in this research. The four procedures are designed as shown in the following Figures 12, 13; Figures 14, 15; among them, procedures A and C’s arrival is from way point B, procedures B and D’s arrival is from way point P, the gradient of the four procedures in the initial approach segment is 7%, the intermediate approach segment is 5.2%, and the final approach segment is 6.1%. The magenta areas on both sides of the route represent the protected area. If the protected area cannot be displayed completely, it indicates that the obstacle is too high. If the protected area is shaded, this further indicates that the designed procedure is not safe.
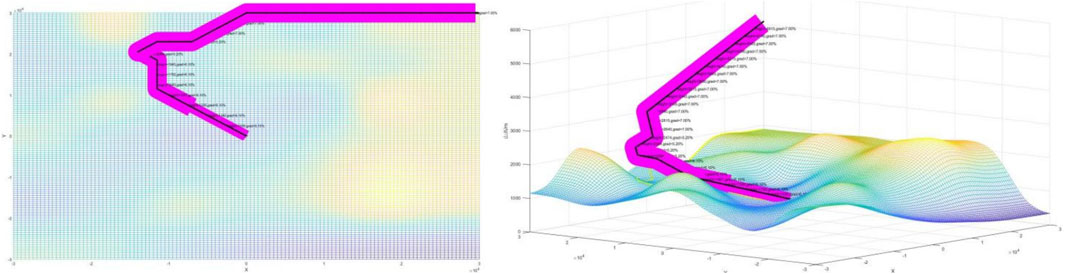
FIGURE 12. Approach procedure A of this airport (left 2D, right 3D).
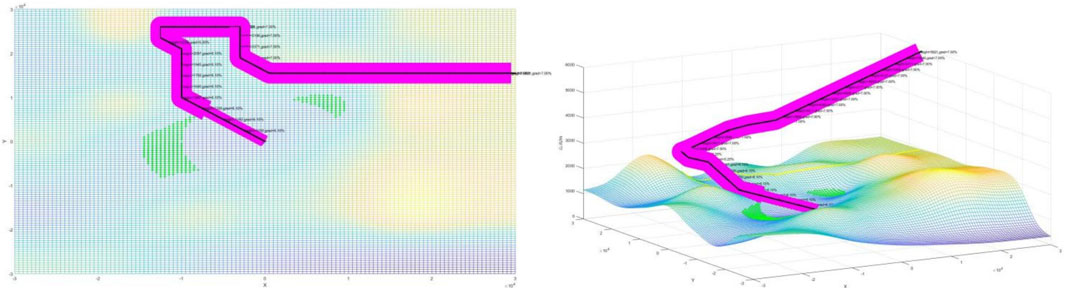
FIGURE 13. Approach procedure B of this airport (left 2D, right 3D).
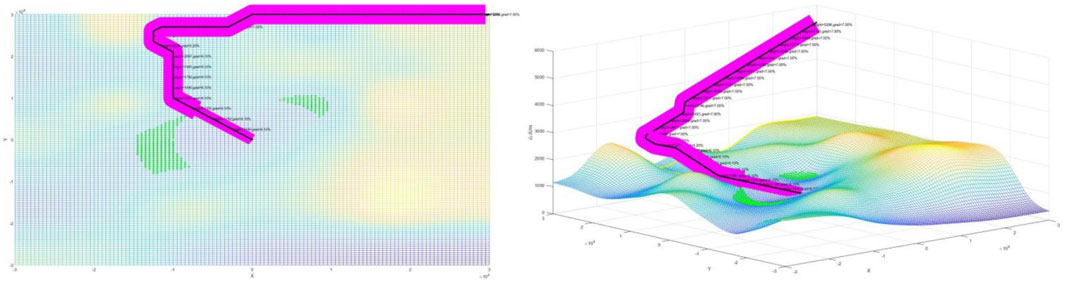
FIGURE 14. Approach procedure C of this airport (left 2D, right 3D).
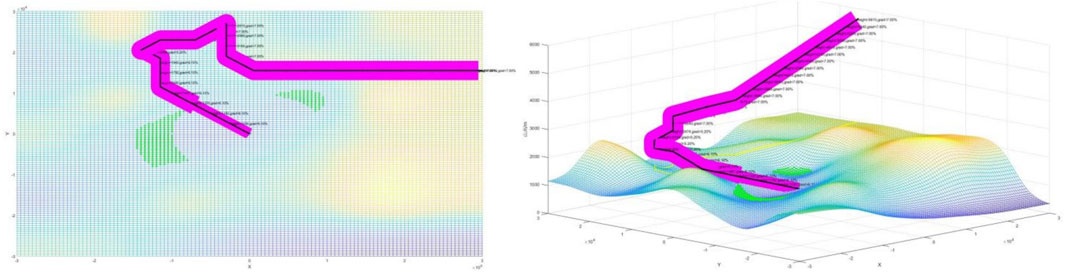
FIGURE 15. Approach procedure D of this airport (left 2D, right 3D).
It can be observed that four of the approach procedures adhere to the DOC8168 specifications. The gradient in the initial approach segment is less than 8%, and the descent gradient in the final approach segment does not exceed 6.1%. The intermediate approach segment maintains an optimal descent gradient of around 5.2%. The magenta protected areas all avoid obstacles, which, when displayed completely, indicates that the flight procedure can smoothly surpass the obstacles. Next, the fuel consumption calculation method will be applied to optimize and evaluate the four approach procedures.
After completing the design of the approach procedures, this research evaluated the four simulated approach procedures based on the fuel consumption evaluation model. Each approach procedure will be divided into four segments, namely, 1, 2, 3, and 4, representing arrival segment, initial approach segment, intermediate approach segment, and final approach segment, respectively. According to the descent gradient, the total fuel consumption for each segment of the approach was calculated separately. The results are rounded to the nearest whole number and shown in Table 4:

TABLE 4. The fuel consumption of every simulated approach procedure (unit:kg).
According to Table 4, the fuel consumption of approach procedures A and D is slightly smaller than that of the same approach direction program. Therefore, after optimization and evaluation, approach procedures A and D are appropriate to be retained. This decision can be adopted for the flight procedure designer to have a brief insight to manual design approach procedures for mountainous airports.
6 Conclusion
Flight procedure design is a key technology required for the current development of civil aviation, especially in the approach flight procedure of alpine airports, which have many flight segments and are complex to design for under the presence of dense obstacles. However, based on this challenge, this research used the flight procedures design regulations and standards to form a design idea for trajectory optimization, software programming, and automatically drawing the protected areas. By calculating obstacle clearance to actively avoid obstacles, as we can see from the case study, the result of the approach procedures designed by the improved A* algorithm can strictly obey the regulation of DOC8168, mainly about the turning angle, descent gradient, and the MSD length. With By taking a further step and evaluating fuel consumption, the optimized approach procedures for alpine airports can be intelligently obtained. This removes the difficulties that manually designing approach flight programs, route layouts, protection areas, obstacle clearance calculations and evaluations, gradient optimizations can incur. They are also labor-intensive and inefficient. Ultimately, this research provides a reliable design idea for manually calculating flight procedures. However, in order to make the research results more accurate, the following points need to be further studied: (1) Further use of more accurate digital maps, such as GIS software for in-depth research; and (2Consideration of multiple program evaluation models to comprehensively evaluate the designed approach flight program from multiple aspects and dimensions.
Data availability statement
The datasets presented in this study can be found in online repositories. The names of the repository/repositories and accession number(s) can be found in the article/Supplementary material.
Author contributions
LL: Conceptualization, Data curation, Formal Analysis, Funding acquisition, Investigation, Methodology, Project administration, Resources, Software, Supervision, Validation, Visualization, Writing–original draft, Writing–review and editing. XL: Data curation, Investigation, Resources, Supervision, Writing–review and editing. JJ: Formal Analysis, Investigation, Writing–review and editing. JZ: Methodology, Resources, Writing–review and editing.
Funding
The author(s) declare financial support was received for the research, authorship, and/or publication of this article. This research is supported by The China Scholarship Council (Grant No. 202108510115) and Research on Feature Extraction and Event Correlation of Aviation Intelligence Information in Big Data Environment (2023 Central University Level Key Projects) (Grant No. ZJ2023-003).
Conflict of interest
The authors declare that the research was conducted in the absence of any commercial or financial relationships that could be construed as a potential conflict of interest.
Publisher’s note
All claims expressed in this article are solely those of the authors and do not necessarily represent those of their affiliated organizations, or those of the publisher, the editors and the reviewers. Any product that may be evaluated in this article, or claim that may be made by its manufacturer, is not guaranteed or endorsed by the publisher.
References
Campos, I. S. G., Nascimento, E. R., Freitas, G. M., and Chaimowicz, L. (2016). A height estimation approach for terrain following flights from monocular vision. Sensors 16 (12), 2071. doi:10.3390/s16122071
Chandra, D. C., and Markunas, R. (2016). “Line pilot perspectives on complexity of terminal instrument flight procedures,” in 2016 IEEE/AIAA 35th Digital Avionics Systems Conference (DASC) (IEEE), 1–10.
Chen, S., Dong, G., Tang, T., Zhang, J., Wang, J., Liu, S., et al. (2019). Research on improved A* algorithm for track optimization based on schematic maps. J. Projectiles. Rockets. Missiles. Guidance 1–7.
Clarke, J. P., Bennett, D., Elmer, K., Firth, J., Hilb, R., Ho, N., et al. (2006). Development, design, and flight test evaluation of a continuous descent approach procedure for nighttime operation at Louisville International Airport (No. PARTNER-COE-2005-002). Canada: Partnership for Air Transportation Noise and Emissions Reduction.
Collins, B. P. (1982). Estimation of aircraft fuel consumption. J. Aircr. 11, 969–975. doi:10.2514/3.44799
González-Arribas, D., Soler, M., Sanjurjo-Rivo, M., Kamgarpour, M., and Simarro, J. (2019). Robust aircraft trajectory planning under uncertain convective environments with optimal control and rapidly developing thunderstorms. Aerosp. Sci. Technol. 89, 445–459. doi:10.1016/j.ast.2019.03.051
Hasegawa, T., Tsuchiya, T., and Mori, R. (2015). Optimization of approach trajectory considering the constraints imposed on flight procedure design. Procedia Eng. 99, 259–267. doi:10.1016/j.proeng.2014.12.534
He, S., Wang, C., and Yang, Q. (2017). Determination of suitable grid size for 1:50000 DLG-based DEM. J. Mt. Sci. 35 (04), 572–579.
Hentzen, D., Kamgarpour, M., Soler, M., and González-Arribas, D. (2018). On maximizing safety in stochastic aircraft trajectory planning with uncertain thunderstorm development. Aerosp. Sci. Technol. 79, 543–553. doi:10.1016/j.ast.2018.06.006
Hongyan, Y. X., Wei, X., Xinyuan, J., and Ji, X. (2021). A moving path tracking method of the thunderstorm cloud based on the three-dimensional atmospheric electric field apparatus. J. Sensors 2021, 1–13. doi:10.1155/2021/8856033
ICAO (2000). Environmental technical manual on the use of procedures in the noise certification of aircraft. ICAO.
ICAO (2014). Procedures for air navigation services — visual and instrument flight procedures. Canada: International Civil Aviation Organization.
Kozmus Trajkovski, K., Grigillo, D., and Petrovič, D. (2020). Optimization of UAV flight missions in steep terrain. Remote Sens. 12 (8), 1293. doi:10.3390/rs12081293
Lee, D., and Shim, D. H. (2014). “Spline-RRT* based optimal path planning of terrain following flights for fixed-wing UAVs,” in 2014 11th International Conference on Ubiquitous Robots and Ambient Intelligence (URAI) (IEEE), 257–261.
Liu, Y., Hansen, M., Lovell, D., and Ball, M. O. (2018). “Predicting aircraft trajectory choice–a nominal route approach,” in Proc. of the International Conference for Research in Air Transportation.
Lu, Li. (2019). Optimization and simulation research on flight procedures design for mountainous airports. Sichuan: Civil Aviation Flight University of China.
Lu, L., and Liu, C. (2022). Research on trajectory planning in thunderstorm weather based on dynamic window algorithm during approach segment. Sci. Program. 2022, 1–10. doi:10.1155/2022/7031928
Malaek, S. M., and Kosari, A. R. (2007). Novel minimum time trajectory planning in terrain following flights. IEEE Trans. Aerosp. Electron. Syst. 43 (1), 2–12. doi:10.1109/taes.2007.357150
Olmstead, J. R., Fleming, G. G., and Gulding, J. M. (2002). Integrated noise model (INM) version 6.0 technical manual. Washington, DC: Federal Aviation Administration Office of Environment and Energy, Paper FAA-AEE-02-01.
Paveen, J., Supatcha, C., Sameer, A., and Daniel, D. (2020). “A distributed metaheuristic approach for complexity reduction in air traffic for strategic 4D trajectory optimization,” in 1st conference on Artificial Intelligence and Data Analytics in Air Transportation, Singapore, Feb 2020, 1-9.
Plat, N., Uysal, M., and Toprak, A. S. (2015). An investigation of DEM generation process based on LiDAR data filtering, decimation, and interpolation methods for an urban area. Measurement 75, 50–56. doi:10.1016/j.measurement.2015.08.008
Qian, G. (2015). Research on key technologies for flight procedure optimization design. Nanjing: Nanjing University of Aeronautics and Astronautics.
Rahim, M., and Malaek, S. M. (2007). “Intelligent operation using terrain following flight in unmanned aerial vehicles,” in 2007 IEEE Aerospace Conference (IEEE), 1–8.
Tang, Li, Peng, H., and Zhang, X. (2019). Path planning method for mountainous UAVs based on improved ant colony algorithm. J. Transp. Syst. Eng. Inf. Technol. 19 (01), 158–164.
Thomas, C. S., Hume, K. I., and Hooper, P. D. (2004). Aircraft noise,airport growth and regional development, 2806. American Institute of Aeronautics and Astronautics, 477–488.
Wang, C. (2010). Research on aircraft cruise stage fuel flow model based on multiple linear regression. Guide Sci. Technol. Wealth 2, 15–18.
Yuan, W., Yang, M., Deng, L., Wang, C., and Wang, B. (2018). Rapid construction method of terrain elevation grid map based on V disparity. J. Shanghai Jiao Tong Univ. 52 (01), 1–6.
Zeh, T., Judith, R., Richard, A., and Harmut, F. (2020). “Prediction of the propagation of trajectory uncertainty for climbing aircraft,” in DASC 2020 IEEE/AIAA 39th Digital Avionics Systems Conference, San Antonio, United Statas, 1–9.
Zhao, Q. (2016). Research on terrain path planning technology based on geographic information system. Beijing: The First Institute of China Aerospace Science and Technology Corporation.
Keywords: airports in alpine environment, terrain data processing, approach procedures, improved A∗ algorithm, fuel consumption evaluation
Citation: Lu L, Lai X, Jiang J and Zhou J (2024) Research on optimization of approach procedures for airports in an alpine environment. Front. Environ. Sci. 11:1336705. doi: 10.3389/fenvs.2023.1336705
Received: 11 November 2023; Accepted: 26 December 2023;
Published: 22 January 2024.
Edited by:
Yunhui Zhang, Southwest Jiaotong University, ChinaReviewed by:
Jingwei Guo, City University of Macau, Macao SAR, ChinaHong Liu, Civil Aviation University of China, China
Wenxin Li, Hubei University of Arts and Science, China
Copyright © 2024 Lu, Lai, Jiang and Zhou. This is an open-access article distributed under the terms of the Creative Commons Attribution License (CC BY). The use, distribution or reproduction in other forums is permitted, provided the original author(s) and the copyright owner(s) are credited and that the original publication in this journal is cited, in accordance with accepted academic practice. No use, distribution or reproduction is permitted which does not comply with these terms.
*Correspondence: Li Lu, luli@cafuc.edu.cn