Spatio-temporal dynamics of aerosol distribution in an urban environment recorded in situ by means of a bike based monitoring system
 Stefan Norra1,2*
  Junwei Song3
  Reiner Gebhardt4
  Jonas Bauer1 Magdalena Broß1
  Marco Fuchs1 Theresa Huber1 Dennis Mack1
  Harald Saathoff3
- 1Working Group Environmental Mineralogy and Environmental System Analysis, Institute of Applied Geosciences, Karlsruhe Institute of Technology, Karlsruhe, Germany
- 2Division of Soil Science and Geoecology, Institute of Environmental Sciences and Geography, University of Potsdam, Potsdam, Germany
- 3Institute of Meteorology and Climate Research, Karlsruhe Institute of Technology, Karlsruhe, Germany
- 4Institute of Geography and Geoecology, Karlsruhe Institute of Technology, Karlsruhe, Germany
Aerosol pollution in urban areas is highly variable due to numerous single emission sources such as automobiles, industrial and commercial activities as well as domestic heating, but also due to complex building structures redirecting air mass flows, producing leeward and windward turbulences and resuspension effects. In this publication, it is shown that one or even few aerosol monitoring sites are not able to reflect these complex patterns. In summer 2019, aerosol pollution was recorded in high spatial resolution during six night and daytime tours with a mobile sensor platform on a trailer pulled by a bicycle. Particle mass loadings showed a high variability with PM10 values ranging from 1.3 to 221 μg m−3 and PM2.5 values from 0.7 to 69.0 μg m−3. Geostatistics were used to calculate respective models of the spatial distributions of PM2.5 and PM10. The resulting maps depict the variability of aerosol concentrations within the urban space. These spatial distribution models delineate the distributions without cutting out the built-up structures. Elsewise, the overall spatial patterns do not become visible because of being sharply interrupted by those cutouts in the resulting maps. Thus, the spatial maps allow to identify most affected urban areas and are not restricted to the street space. Furthermore, this method provides an insight to potentially affected areas, and thus can be used to develop counter measures. It is evident that the spatial aerosol patterns cannot be directly derived from the main wind direction, but result far more from an interplay between main wind direction, built-up patterns and distribution of pollution sources. Not all pollution sources are directly obvious and more research has to be carried out to explain the micro-scale variations of spatial aerosol distribution patterns. In addition, since aerosol load in the atmosphere is a severe issue for health and wellbeing of city residents more attention has to be paid to these local inhomogeneities.
1 Introduction
Aerosol pollution negatively affects the health of numerous people, especially in urban areas. For Europe, Kushta et al. (2018) estimated on a basis of a 100 km grid 535,000 premature deaths with 242.000 cases within the EU-28. This effect of premature deaths caused by aerosol pollution is observed worldwide (Liu et al., 2019). Son et al. (2020) showed that the COVID-19 mitigation measures lowered air pollution related total and cause specific deaths. Interestingly, Yao et al. (2020) showed for Chinese cities a correlation between ambient aerosol concentration and COVID-19 fatality rate. Statistical analyses of health effects reflect the average impacts of mechanical processes individuals are facing when inhaling aerosols. The water soluble inorganic ions associated to single aerosol particles are able to penetrate the lung surfactant barrier (Park et al., 2022). Also palladium nanoparticles emitted from motor vehicles can be toxic to exposed persons (Arzoo and Samim, 2022). Arsenic and Selenium, which can have toxic effects, can be found associated to particles emitted by coal fired power plants (Huang and Yao, 2022). Mercury, a further potentially health affecting element, was monitored in aerosols of Beijing by Schleicher et al. (2015); Schleicher et al. (2016). Another health effecting constituent of aerosol is black carbon that is responsible for respiratory and cardiovascular diseases (Janssen et al., 2011; Geng et al., 2013). An example for the existing spatio-temporal variations of black carbon in the city of Beijing is given by Schleicher et al. (2013). Song et al. (2022) analyzed the highly resolved temporal courses of black carbon, sulfate, nitrate, chloride and organics during a summer and winter period at an inner urban location in Karlsruhe. They differentiated various sources for hydrocarbon-like, cooking related, semi-volatile oxygenated and low-volatile oxygenated organic aerosol showing different temporal distribution patterns during day and night. Beside organic pollutants aerosols also transport bacteria into the human body (Li et al., 2021; Yin et al., 2021). Also mineral particles in aerosol potentially affect human health (Guthrie and Mossmann, 1993; Guthrie, 1997). Rahman et al. (2021) showed how aerosol particles are transported and deposited in upper and lower airways of human being. For the highly urbanized region of central Taiwan it was shown that PM2.5 beside of odd oxygen and non-methane hydrocarbon have strong effects annual incidence growth rates of respiratory diseases. Interestingly, the spatial distribution of the incidences investigated was the same as that of PM2.5 (Liang et al., 2023). Thus, it has to be stated that the individual exposure is an important information. This can be best investigated by spatially highly resolved aerosol measurement, e.g., carried out by mobile bicycle based monitoring concepts. This information complements the measurements of reference stations that more reflect the general aerosol pollution instead of the spatial variability.
In general, aerosol concentration is high in urban regions due to the high density of different emission sources such as traffic, industry or domestic heating. Cities are typical man-made ecosystems and thus, humans form here a specific and unique geochemical sphere, the Astysphere (Norra, 2009); Norra, 2014; Norra, 2022). Here, chemical elements occur in concentrations and relations nowhere else in nature. Also, aerosol plumes form unique geometric patterns in urban systems according to the interplay between constructions, land use, aerosol sources and meteorology. The knowledge about these patterns is an important information to develop healthy and sustainable urban systems.
Elevated and harmful aerosol concentrations have been recorded in cities from all over the world, such as for Beijing, China (Chen et al., 2016; Norra et al., 2016), Varanasi, India (Mehra et al., 2020), New Delhi (Kumar et al., 2018), European cities with hotspots in Poland and Northern Italy (European Environmental Agency, 2020) or for cities in Northern America (Grinshpun et al., 2014; IQAir, 2020). In these studies, aerosol concentrations often were measured at specific and distinct points. Nevertheless, those studies did show that the aerosol concentrations in urban areas can be highly variable and depend on land use. Relationships between land use and chemical composition of aerosols, for example, road dust, were shown for Beijing and Colcata (Kuang et al., 2004; Nath et al., 2007) as well as for black carbon and particulate mercury in Beijing (Schleicher et al., 2013; Schleicher et al., 2015). Saha et al. (2020) used stationary laser technology as particle counters to analyze the spatial distribution of PM2.5 at 50 sites in Pittsburgh and created interpolation maps to display the spatial load of particulate matter. They also showed a correlation between aerosol concentrations and land use. The existence of the spatial variability of air pollution in the urban environment was shown by Beckwith et al. (2019) for NO2, too. They identified intersections as hotspots of aerosol concentrations where the driving modes queuing and accelerating act as aerosol pollution sources. Borge et al. (2016) mapped the spatial variability of aerosol concentrations at a specific intersection in Madrid, Spain. Horizontal and vertical variabilities up to 20 m were also investigated for a road profile in Zurich by Monn et al. (1997). Rowell et al. (2021) analyzed such vertical variability for three height levels up to 2.7 m in Newcastle upon Tyne, United Kingdom. However, these very small scale studies did produce an inhomogenic picture of the occurrence of spatial variabilities of aerosol concentrations. Furthermore, especially Borge et al. (2016) showed that the spatial variability of aerosol concentrations varies from day to day.
Knowledge about spatial variation in aerosol pollution in urban areas related to land use and building structures is an important basis for a healthy and worth living urban development. Nevertheless, this knowledge often is limited due to available measurement capacities. One approach to overcome this gap is the identification of spatial aerosol distributions generated from satellite data via calculation of the atmospheric optical depth as carried out by Ly and Myint. (2021) for Phoenix, United States, or Xie and Sun. (2021) for Wuhan, China. However, temporal and spatial resolution in these cases is limited and often does not reflect the influence of smaller urban construction structures on the aerosol distribution. Resolution is not that challenge, if the spatial distribution of aerosols is modeled with programs such as ENVI-met (Nikolova et al., 2014), but validation in such high resolution models still is a challenge. Passive bulk sampling methods such as the Bergerhoff method (VDI, 2012) were used for the overall spatial distribution of dust deposition in urban areas, especially during the last century, e.g., in Germany (Ministerium für Umwelt, 1990). Also later, this method was applied to specific scientific questions such as source identifications and land use influences (Norra and Stüben, 2004). Spatial monitoring of aerosol pollution for larger urban areas is feasible using affordable passive bulk samplers, but is more challenging when using active samplers for PM10 or PM2.5, which in addition require electrical power. Development of optical particle counters enabled the measurement of aerosol loads in small time steps (Peters et al., 2006). Applying a moving measurement platform allows to record aerosol concentrations with high temporal resolution in the spatial context. For example, this was carried out with larger optical particle counters installed on cable cars in the city of Karlsruhe (Hagemann et al., 2014). However, this approach with a cable car is feasible for long routes and specific one dimensional transects but less for two dimensional spatial analyses. Meanwhile, small optical particle sensors are on the market. Approaches exist to monitor the personal exposition with small handheld devices such as the Ultrafine Particle Counter C100 (Enmont) or the Miniature Diffusion Size Classifier (testo). These are fixed to the specific person to follow their exposition over a certain time interval of activities (Asbach and Todea, 2016). Lim et al. (2019) used the Airbeam (Shinyei Technology Co. LTD.) to record the aerosol concentrations during walks in Seoul and generated spatial distribution maps for the particle load with machine learning algorithms. A bicycle based monitoring system (TSI P-Trakultrafine particle counter model number 8525) was operated in Antwerp, Belgium, to analyze aerosol exposure of cyclists (Peters et al., 2014). Also Hart et al. (2020) equipped bicyclists with a particle counter to investigate the intra-urban PM2.5 variability at fine resolution at the campus of the University of North Texas but did not carry out spatial interpolations. Noteworthy is the study of Klemm et al. (2022) in which PM1, PM2.5 and PM10 were analyzed by means of an optical particle spectrometer (OPC type 3330, TSI Inc., United States) in the city of Münster, Germany. Also this study highlights high variability of aerosol exposure along inner urban streets but the study was not laid out for spatial interpolation or modeling. Motor vehicles were used for high resolution recording of aerosol pollution in urban areas as well (Yeom, 2021; Zhao et al., 2021; Khuzestani et al., 2022). In contrast to walking and bicycle studies, the velocity of cars and their range focus on larger areas. Resulting interpolation maps display whole city aspects instead of higher resolved street and district aerosol distributions.
Within this study we applied the SDS011 (Nova Fitness) sensor recording aerosols of sizes between 0.3 and 10 µm to determine the spatial distribution of aerosols within a typical urban district of about 2.7 km2 for the example of Karlsruhe, Germany. The sensor was installed on a bike trailer together with a GPS system. This setting was used in July 2019 to conduct several monitoring runs along the similar route through a part of the inner city of Karlsruhe. Spatial interpolation of the results was carried out with the geostatistical tool box of ArcMap (version 10.7.1). Finally, the spatial patterns of aerosol pollution are discussed on the basis of wind conditions, land use and construction patterns.
2 Methods
2.1 Area of investigation
The city of Karlsruhe, founded in 1715, is located in the Rhine Graben, Germany, at an average elevation of 115 m above sea level and at 49,01° N and 8,40° E. Main and central parts of Karlsruhe were developed on a flat terrace deposited during the last ice age (Würm period) by the river Rhine. About 300,000 inhabitants are living in Karlsruhe. Main wind direction is south-west especially during summer time, whereas in winter times north-eastern winds more often occur. Karlsruhe belongs to the climate zone Cfb according to Köppen-Geiger classification. Mean temperature is about 10.4°C and average annual precipitation accounts to 693 mm (Hackenbruch, 2018). The inner city is densely developed. The measurement tours for recording the aerosol concentrations in ambient atmosphere took place in the eastern parts of the inner city around the so called “Durlacher Tor” (DT) (English: Gate to the village of Durlach) and covered parts of the “Karlsruhe Institute of Technology” (KIT) in the north, the district “Oststadt” (English: East City) in the east and the district “Dörfle” (English: little village) (Figure 1). The Dörfle is the oldest district of Karlsruhe and is characterized by closely built city blocks of about four to seven stories high (∼10–30 m). The ground floors frequently are used by various shops. The “Oststadt” shows a similar development but with younger buildings mainly 100–150 years old and younger. Here, some commercial areas are embedded. The area of KIT is differently structured. Single buildings of various heights and extents can be found here instead of perimeter block development. Some larger avenues are crossing all these districts and meet in the center of the map at the “Durlacher Tor” square. Between 2009 and 2022 a subway was under construction with intensive works at the crossroads of the “Durlacher Tor” and along the most southern avenue that passed during the measurement runs. The irregular construction works led to daily changes in the traffic volume along the particular roads of the investigation area. However, traffic volume officially was last counted in 2009 (Stadt Karlsruhe, 2013). This data is inserted in the map of Figure 1. It shows that highest traffic volume occurs along the southern avenue (Kriegsstraße) with 40,000 to 50,000 vehicles per day, on the street (Kapellenstraße) between “Durlacher Tor” (DT) and “Kriegsstraße” with about 30,000 vehicles per day and along the avenue reaching from the “Durlacher Tor” northwards (Adenauerring) with about 20,000 vehicles per day.
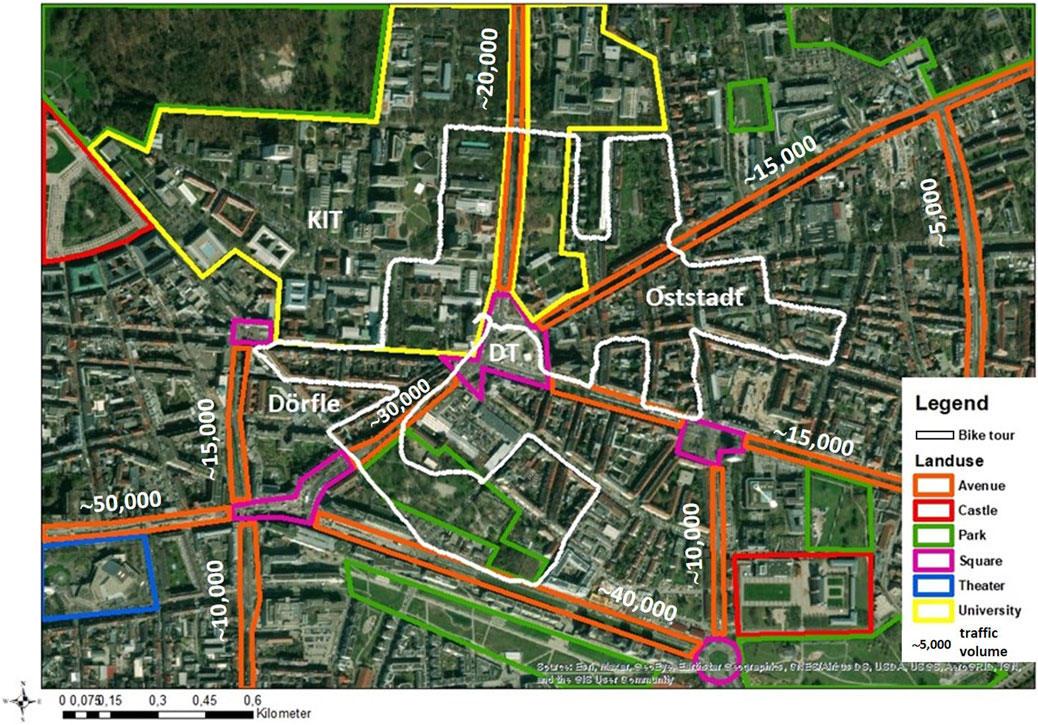
FIGURE 1. Land use patterns in eastern inner city of Karlsruhe and pathway of aerosol recording by a bike trailer based sensor system (the central square is the Durlacher Tor (DT)). Average daily traffic volume for 2019 is based on data from Stadt Karlsruhe. (2013) (”∼5000” in the legend is provided as an example).
The route of the measurement tours to map the aerosol plume is depicted in Figure 1. The measurements were carried out with a particle sensor mounted on a bike trailer. It was aimed not to extend the area of investigation too much, since the weather conditions should be comparable at the beginning and the end of the measurement run. Therefore, a bike tour of about 1 h was chosen. According to the aforementioned urban development characteristics, the hypothesis is deduced that highest aerosol concentrations should occur in the densely built-up areas of the “Dörfle” west of the “Durlacher Tor” and in the “Oststadt” east of the “Durlacher Tor”. Here the air mass exchange is expected to be most reduced. High concentrations are also expected directly at the “Durlacher Tor” square itself, since here seven roads meet and highest emission rates can be expected. Lower aerosol concentrations can be supposed in the more openly developed KIT area as well as in the park dominated southern parts of the investigation area, where exchange of air masses is more likely. The spatial distributions of PM10 and PM2.5 were recorded in summer 2019 during six night and daytime tours.
2.2 Instruments
In this study, bike measurements of particulate matter (PM) were carried out with a custom-built sensor box, which was deployed on a bike trailer (Figure 2).
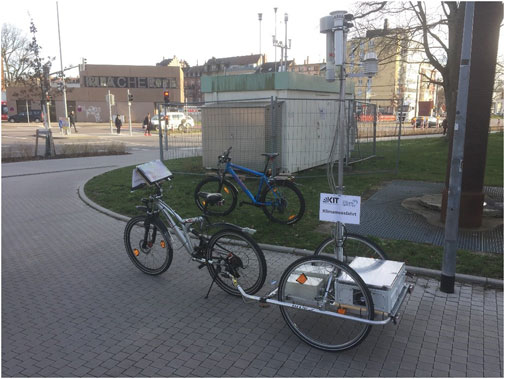
FIGURE 2. Monitoring bike with sensor systems, lower right box (in the background: the “Durlacher Tor”).
On the trailer, a box was installed containing a low-cost PM sensor (SDS011, Nova Fitness) for measuring PM2.5 and PM10 mass concentrations (Budde et al., 2018; Genikomsakis et al., 2018; Liu et al., 2019). The sensor was installed at about 60 cm height representing typical conditions children are exposed to if seated in trailers. The detailed description of SDS011 is given by Liu et al. (2019). Briefly, this sensor is based on laser diffraction theory, where the particle density distribution is determined from the intensity distribution of scattered light. The particle density distribution is then converted into particle mass by a manufacture-provided empirical algorithm. Furthermore, a temperature and relative humidity sensor Rotronic HygroClip 2 Typ HC2-S3 was mounted on the trailer. The tour that was monitored is depicted in Figure 1. The tour is about 6 km long and was driven within about 1 h (Table 1) at an almost steady velocity without longer stops.
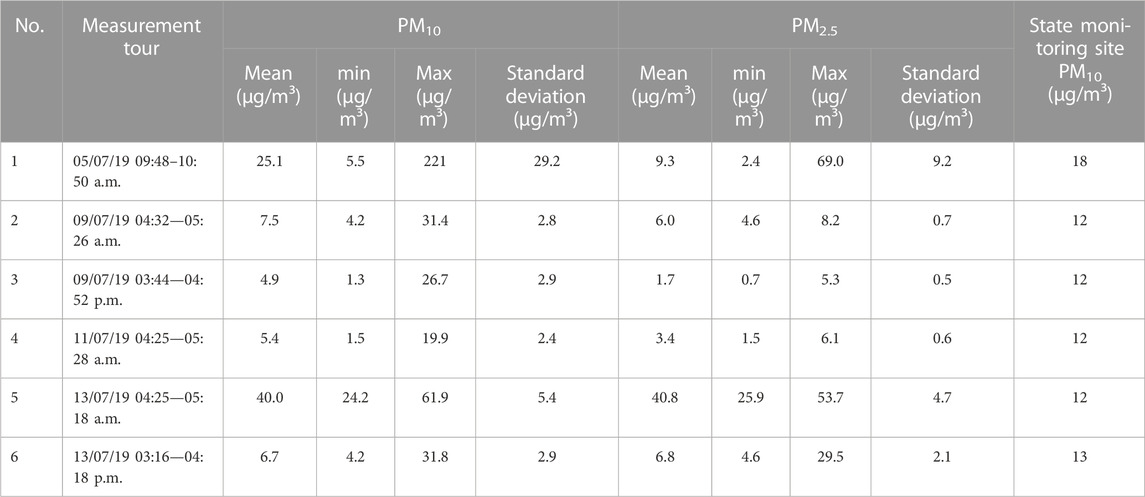
TABLE 1. summary statistics for PM2.5 and PM10 records of bike tours.
In order to evaluate the performance of the SDS011 sensor, we simultaneously carried out two comparison measurements with an optical particle counter (FIDAS200, Palas GmbH) at KIT campus north, which is a rural site located 10 km north of downtown Karlsruhe. The calibrations were achieved over 5 days covering atmospheric aerosol particle concentrations up to 6 and 15 μg m-3. Altogether 5561 data pairs were produced (Figure 3). These concentrations are close to the PM2.5 and PM10 concentrations measured with FIDAS200 Sensor at Durlacher Tor during the measurement period with the bike trailer, which ranged between 0.94–19.6 μg/m3 in July 2019. The FIDAS200 is well calibrated using reference particles (CalDust, Palas GmbH; certified according to EN 16450, TÜV report no.: 936/21227195/B) and can be used as a reference instrument (Vogt et al., 2021). In addition to that, black carbon (BC) was measured with a portable aethalometer (AE51, AethLabs), NO2 was measured with the gas monitor (AF 32M, Environment SA) and particle number concentration was measured with a condensation particle counter (CPC3022, TSI) at the immobile measurement station at Durlacher Tor.
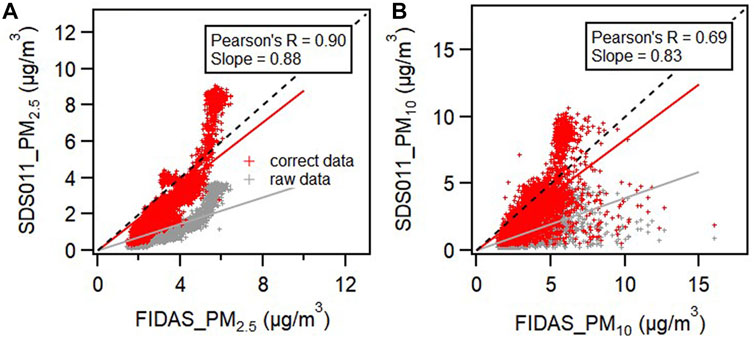
FIGURE 3. Scatter plots of PM2.5 (A) and PM10 (B) mass concentrations measured by SDS011 and FIDAS for calibration issues. The red and grey dots show the data after and before the correction, respectively. The correlation coefficients are given for the corrected data.
As shown in Figures 3A, B, there was a good correlation (R = 0.90, slope = 0.88) between the PM2.5 measured by SDS011 and FIDAS after correction. In contrast, a weaker correlation (R = 0.69, slope = 0.83) was observed between the PM10 measured by SDS011 and FIDAS, which is probably related to the distribution shifts of larger particles (Budde et al., 2018). To calculate the PM2.5 and PM10 mass concentrations from the measurements with the SDS011 sensor, we used the correction factors of 2.42 (±0.01) for PM2.5 and 2.12 (±0.01) for PM10, respectively.
Previous studies have shown that the low cost sensor SDS011 has uncertainties like larger particle shifts (PM10) and a humidity dependence for relative humidity above 80% (Badde et al., 2018; Budde et al., 2018; Liu et al., 2019). However, we generally performed the mobile measurements and calibrations at dry days with relative humidity below 60% (Table 2) except for the morning measurement tour on 13 July 2019. Therefore, we consider the corrections we applied as sufficient to achieve a reasonable data quality for the low cost sensors. This is also substantiated by comparisons of data from the mobile sensors at the starting and end point of the bicycle route and the FIDAS200 or an aerosol mass spectrometer (AMS) in a nearby air quality monitoring container at Durlacher Tor (Figure 4). NO2 data and also black carbon (BC) data in Figure 4 illustrate potential traffic related emissions. Here, NO2 and black carbon concentrations show a very good correlation. Nevertheless, during our measurement tours, traffic related emissions are not the dominating sources for PM2.5 masking the contributions from the other sources. The measurement tours have not been undertaken at times of highest black carbon and NO2 concentrations (Figure 4D). Exemplarily, this is shown in higher temporal resolution for the morning tour at the 11th of July (Figure 5).
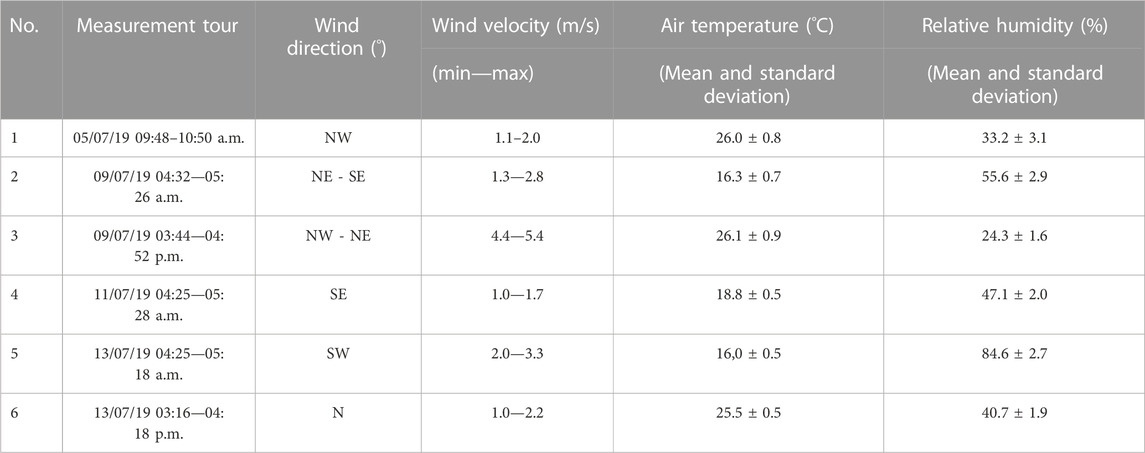
TABLE 2. Meteorological parameters during the bike tours.
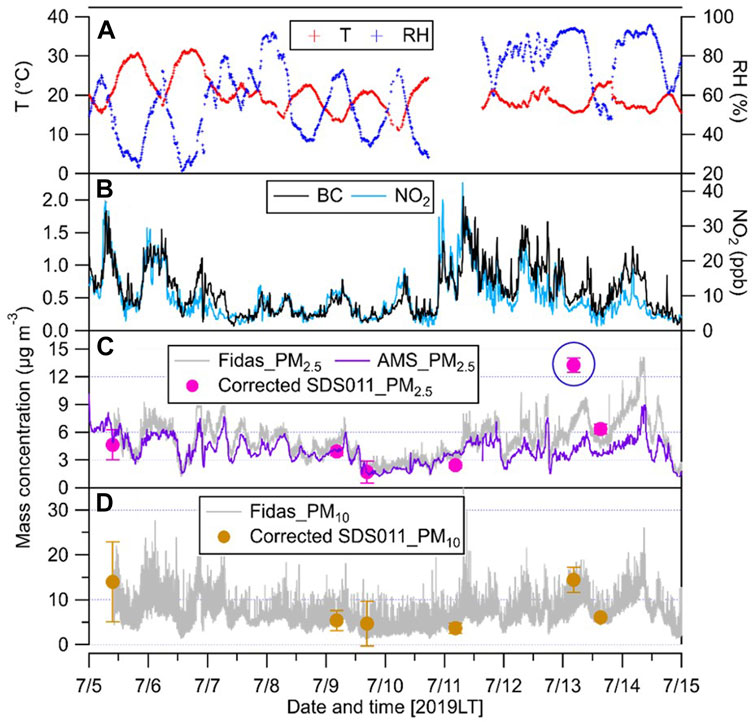
FIGURE 4. (A) Time series of air temperature (T) and relative humidity (RH), (B) Black carbon (BC) and NO2 (C,D) PM2.5 and PM10 measured by the Fidas200, and PM2.5 measured by an aerosol mass spectrometer (AMS, Song et al., 2022) in the air quality monitoring container at Durlacher Tor. The 5-min average data of SDS011 at the starting and end point near the container are plotted for comparison. The blue cycle in (C) indicates the morning measurement tour data on 13 July 2019 with high RH conditions (>80%).
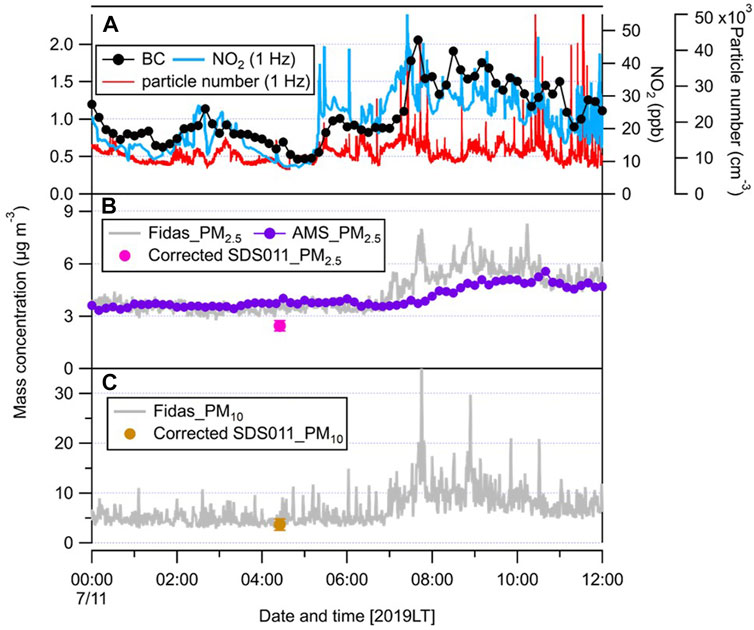
FIGURE 5. Time series of (A) black carbon (BC), NO2, particle number, (B) PM2.5 and (C) PM10 concentrations in the morning hours of the 11th of July.
After the correction, we can observe similar trends of corrected SDS011 data with the FIDAS or AMS. There is a good agreement between the PM2.5 for the corrected SDS011 and the FIDAS measurements except for one morning measurement tour on 13 July 2019. During this morning measurement tour, we observed high relative humidity (>80%), which may have led to an overestimation by the SDS011 measurement. We can also obtain acceptable agreement of PM10 measured by the SDS011 with the FIDAS200. However, the PM10 data measured by the SDS011 show significant variations, which could be caused by the distribution shifts of larger particles. In case of extreme low concentrations of particles between 2.5 and 10 μm, the uncertainty of the measurements can lead to slight negative differences between PM2.5 and PM10. However, since the mobile measurements were performed mostly at dry days, these onsite comparisons further indicate the data quality of low-cost particle sensor measurements within the given uncertainties. It has to be stated, that this study focusses on the spatial distributions of aerosol concentrations, that means the relative spatial differences are within this context more important as the absolute values, and this is very well represented by the spatial monitoring concept.
2.3 Measurement times
Six single measurement campaigns with the mobile equipment were carried out: 5th of July 2016 from 9:48 till 10:50 a.m., 9th of July 2019 from 4:32 till 5:26 a.m., 9th of July 2019 from 3:44 till 4:52 p.m., 11th of July 2019 from 4:25 till 5:28 a.m., 13th of July 2019 from 4:25 till 5:18 a.m. and 13 of July 2019 from 3:16 till 4.18 p.m. (Table 1). Thus, aerosol concentrations were monitored during three early morning, one morning and two afternoon periods to cover variations of different situations during the day. A typical summer period was chosen with expected little rainfall and relative stable atmospheric conditions. Wind force did not exceed 3 on the Beaufort Scale (Table 2). Daytime and late night/early morning temperatures during the measurement times were comparable. The dates were chosen to cover comparable periods. But the aim was not to show long term variation between different weather situations. Shortly before, end of June and shortly afterwards end of July heat waves hit the area of investigation (Bissolli et al., 2019; Imbery et al., 2019), with different climatic conditions to the period of investigation. Thus, the selected days reflect typical summer days of a city in South-Germany and adjacent regions.
3 Results
Table 1 lists the summary statistics for PM2.5 and PM10 recorded with the sensor on the bike trailer. Furthermore, average data from the official, state-owned monitoring site for PM10 in south-west of Karlsruhe (Reinhold-Frank-Straße) is listed. Average air temperature and relative humidity are provided in Table 2 for the monitoring tours as well as wind direction and velocity measured at a station with almost undisturbed conditions of the German Weather Service south of Karlsruhe (Rheinstetten). It was intended not to conduct the measurements during rain. However, the relative humidity on 13th of July was high due to rainfall at the previous day. Nevertheless, the specific spatial aerosol distribution pattern on such a day was of interest as well.
Highest maximum aerosol concentrations were measured during first run on 5th of July with 221 μg/m³ for PM10 and 69 μg/m³ for PM2.5 (Table 1). During the other runs, concentrations did not exceed 61.9 μg/m³ for PM10 and 53.7 μg/m³ for PM2.5, respectively. Standard deviations reach up to 29.2 μg/m³ reflecting the high variability of aerosol concentrations within the constructed area that is mirrored in the interpolation maps for the single runs (Figures 6–11). With the exceptions of the 5th and 13th of July, the average concentrations measured during the bike tours were below those recorded at the state monitoring site. Meteorological parameters for the periods of the measurement tours are listed in Table 2. General wind directions varied extremely between the measurement days, which is certainly a contribution to the high spatial variability of the urban aerosol plume in the area of investigation. In the afternoon of the 9th of July highest wind velocities occurred with up to 5.4 m/s. During the other measurement periods the velocities varied between 1.0 and 3.3 m/s. This corresponds to up to 2 Bft, enough to move aerosol particles (Pye, 1987).
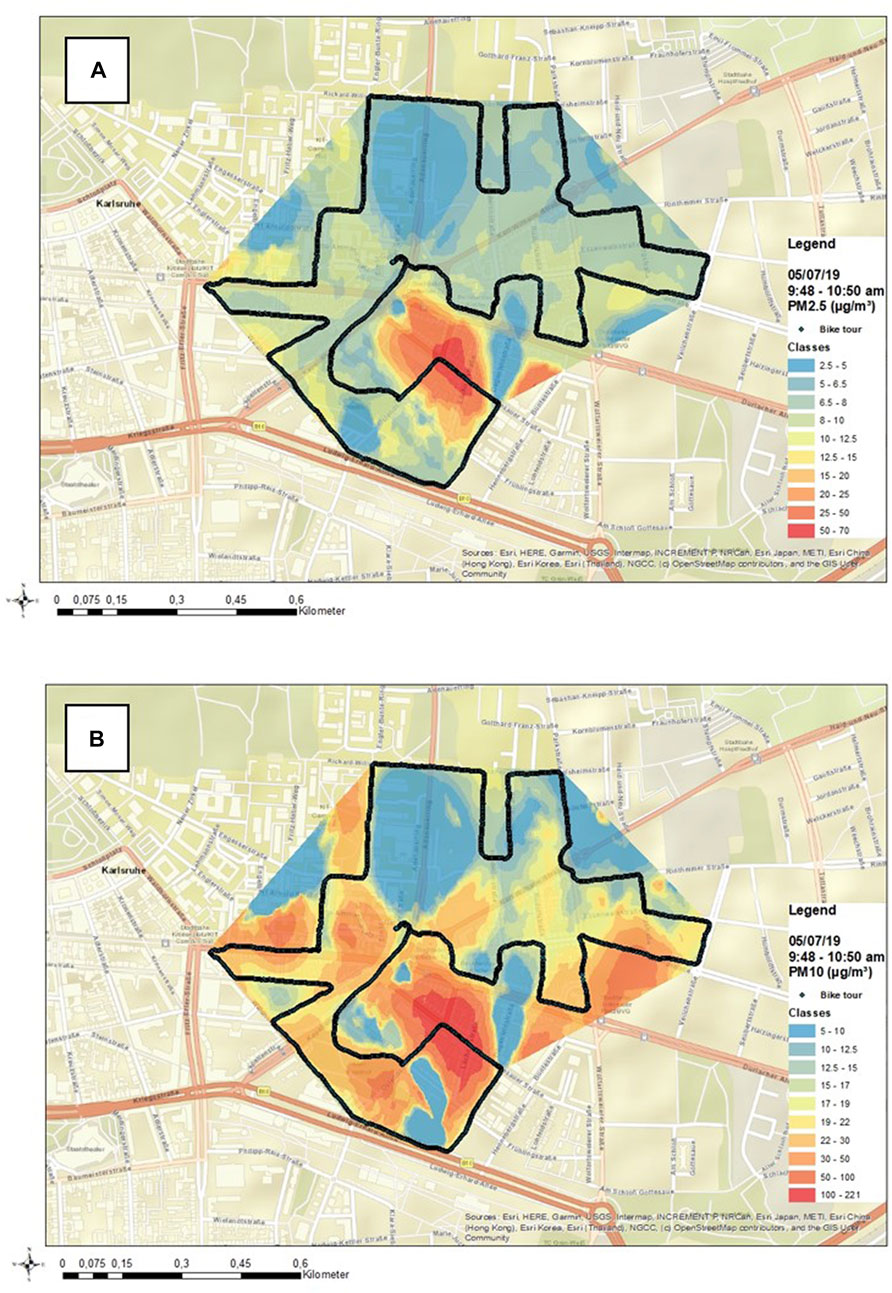
FIGURE 6. (A) PM2.5 concentration pattern on 5th of July 2019, 9:48–10:50 a.m. (B) PM10 concentration pattern on 5th of July 2019, 9:48–10:50 a.m.
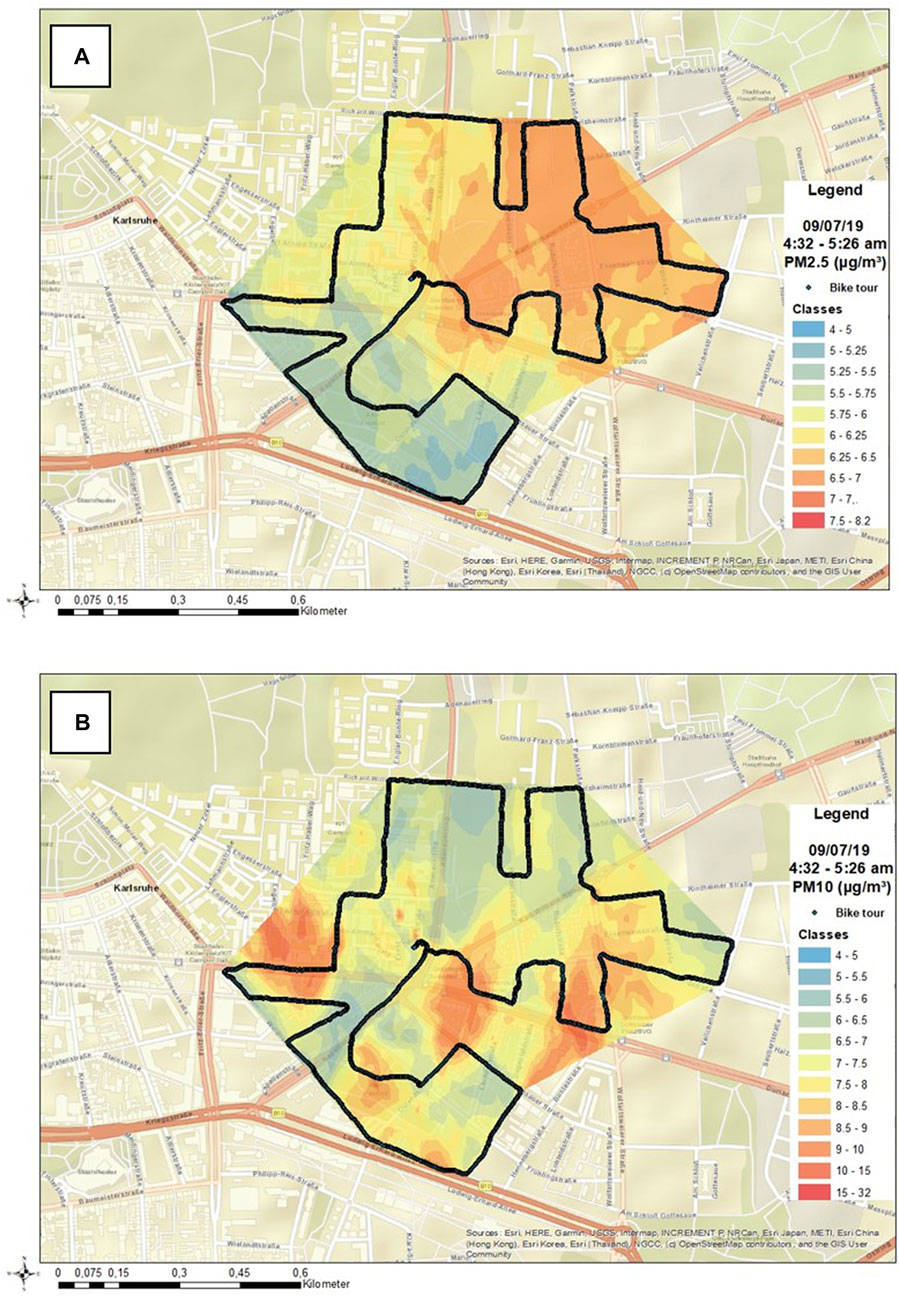
FIGURE 7. (A) PM2.5 concentration pattern on 9th of July 2019, 4:32—5:28 a.m. (B) PM10 concentration pattern on 9th of July 2019, 4:32—5:28 a.m.
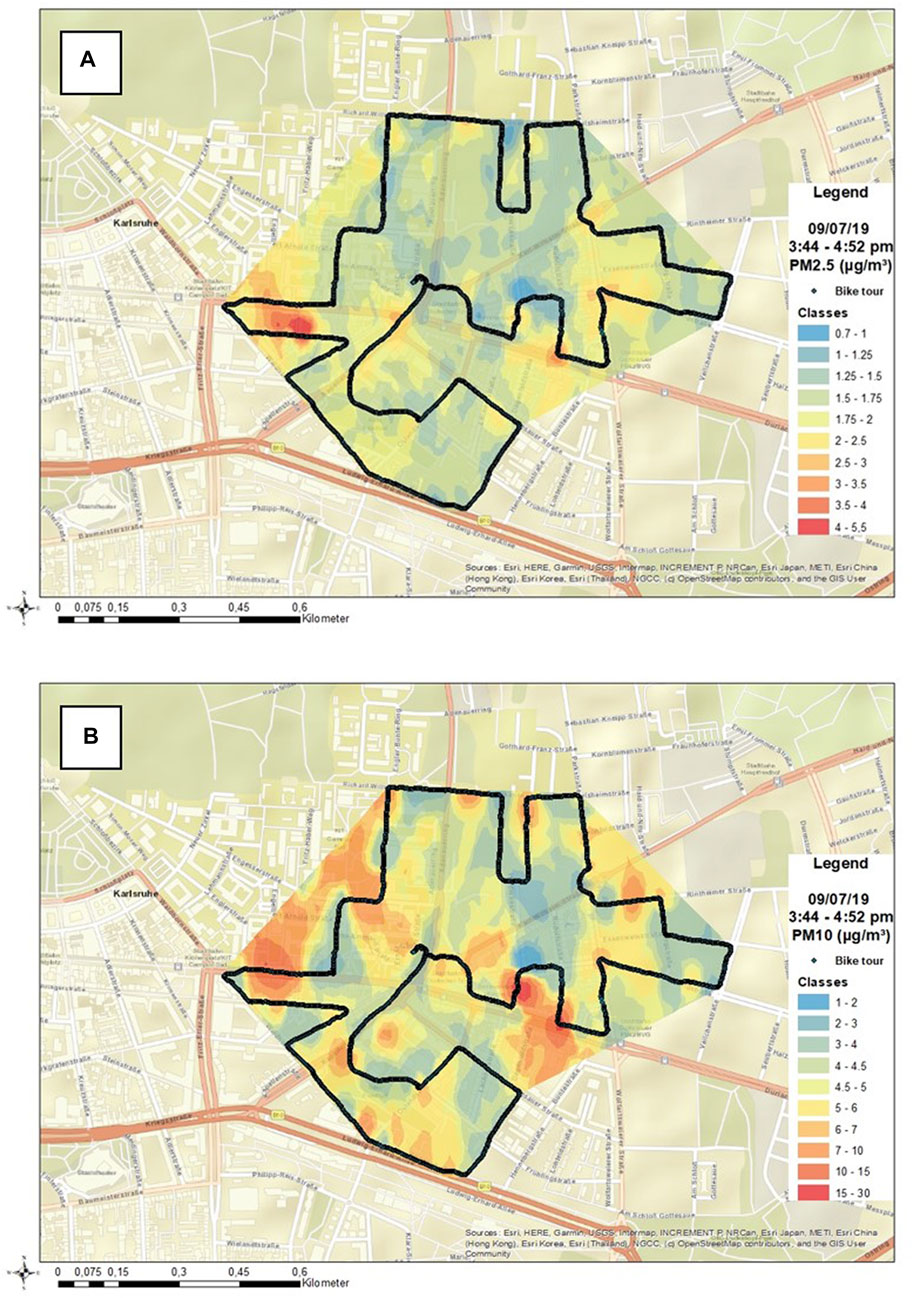
FIGURE 8. (A) PM2.5 concentration pattern on 9th of July 2019, 3:44—4:52 p.m. (B) PM10 concentration pattern on 9th of July 2019, 3:44—4:52 p.m.
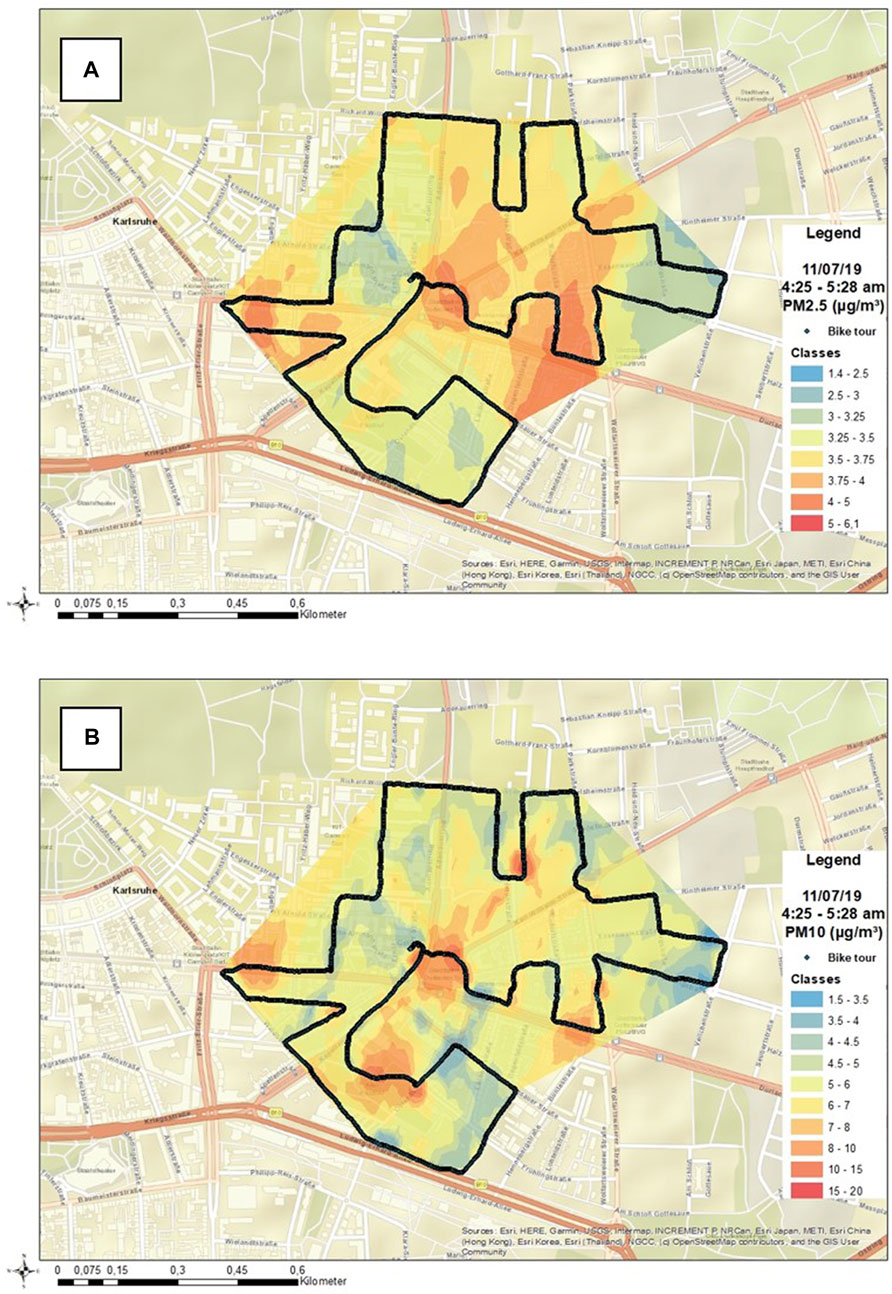
FIGURE 9. (A) PM2.5 concentration pattern on 11h of July 2019, 4:25—5:28 p.m. (B) PM10 concentration pattern on 11h of July 2019, 4:25—5:28 p.m.
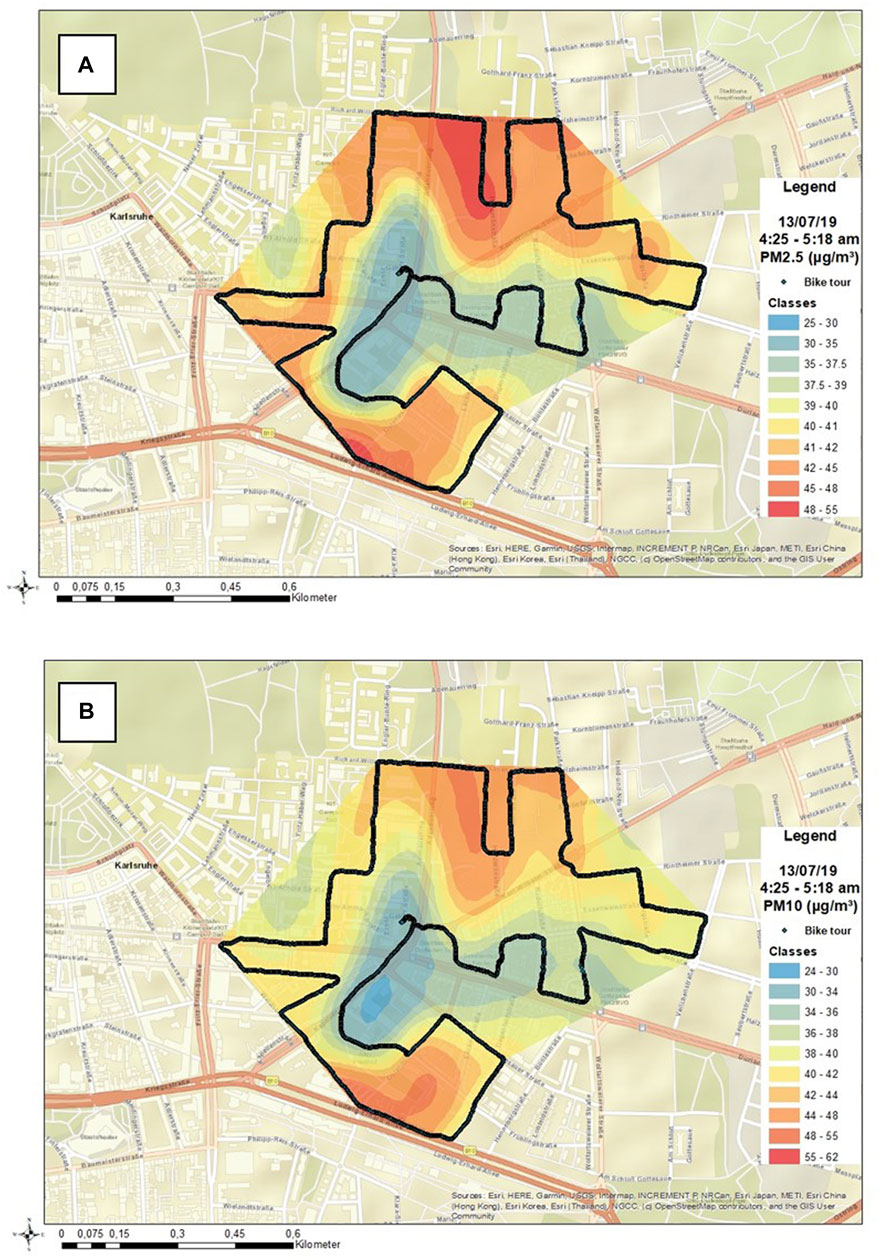
FIGURE 10. (A) PM2.5 concentration pattern on 13h of July 2019, 4:25—5:18 a.m. (B) PM10 concentration pattern on 13h of July 2019, 4:25—5:18 a.m.
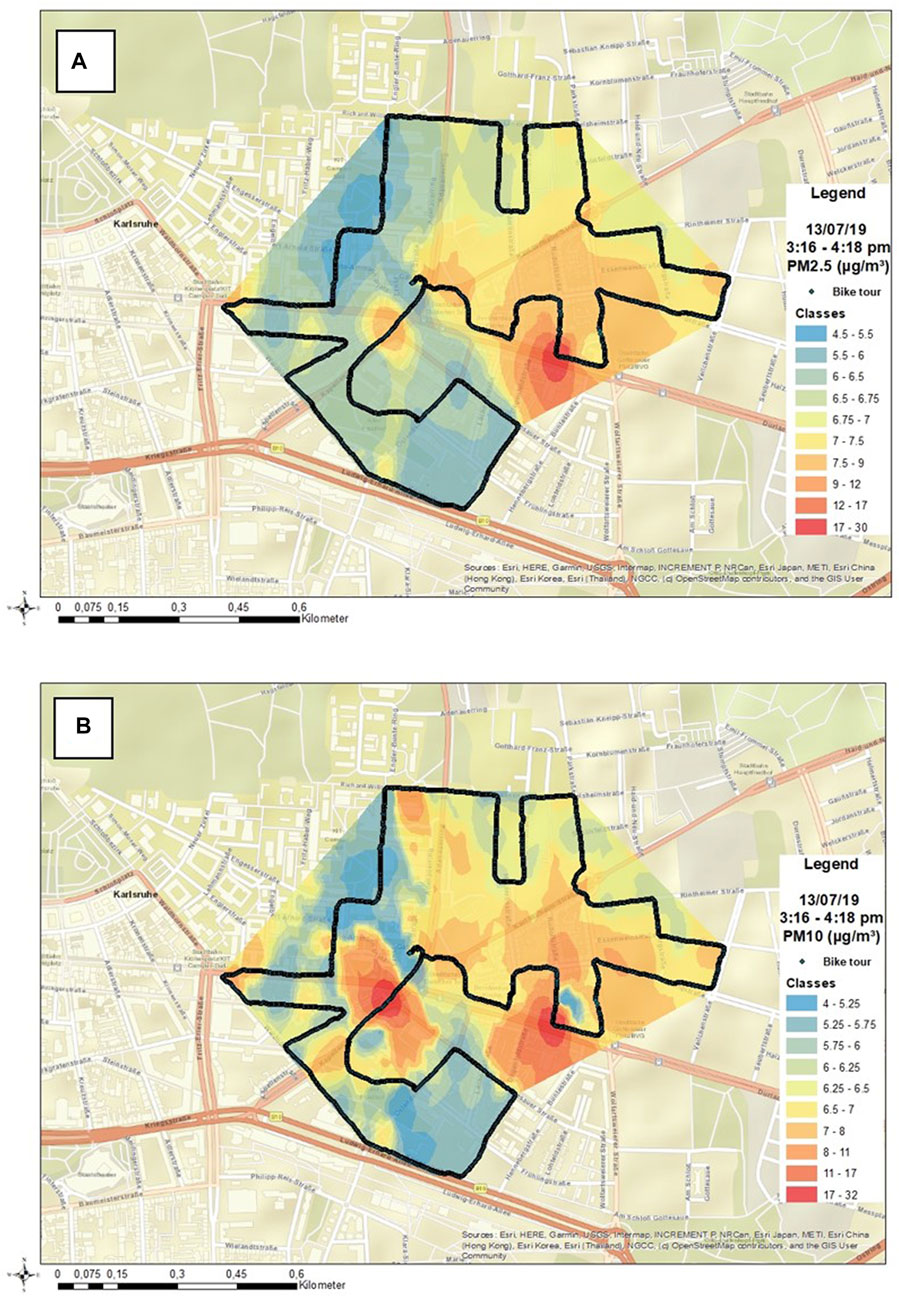
FIGURE 11. (A) PM2.5 concentration pattern on 13h of July 2019, 3:16—4:18 p.m. (B) PM10 concentration pattern on 13h of July 2019, 3:16—4:18 p.m.
For each measurement tour the data were interpolated by geostatistical methods. The model parameters of the variography are listed in Table 3. Geostatistics and mapping were carried out with ARCGIS (version 10.7.1). In all cases, ordinary kriging was conducted. Gaussian, spherical, stable and hole effect variogram models nested with a nugget effect could be adapted to the patterns of the experimental variograms. These models show varying sills and ranges indicating the intervariability of the urban aerosol plume patterns within short time. Nevertheless, the ranges of the models, that are the distances between samples when the model reaches its maximum semi-variance (the sill), are relatively similar, if comparing PM10 and PM2.5 patterns of the same monitoring tour. It has to be stated that the interpolation is not considering the building structure and is assuming an area without barriers. Nevertheless, the interpolation produces a map that reflects the trends of aerosol pollution in the investigated area, which is worth to be interpreted on the basis of land use and spatial structures. The interpolated map itself shows the situation as if there would not be any construction, but the influence of constructions on aerosol distribution can be deduced from the spatial patterns of aerosol concentrations. Similar maps have been published by Borge et al. (2016) for spatial NO2 patterns in Madrid, Spain, by Lim et al. (2019) for PM2.5 in Seoul, South-Korea, and by Górka and Lewicka-Szczebak. (2013) for the isotopic composition of CO2 in Wroclaw, Poland, but detailed data on the interpolation procedures are not always clear. Thus, valuable information for assessing the influences of urban structures on the spatial aerosol patterns can be generated, which then can be used to design more sustainable urban development plans. The plausibility of such interpolations of spatial pollution data within the urban environment was already shown for the case of urban-wide background soil pollution that often is manifesting the long term air pollution (Norra et al., 2001); Norra et al., 2005; Norra et al., 2006). The Figure 5; Figure 6; Figure 7; Figure 8; Figure 9; Figure 10 display the different patterns of aerosol loads in urban atmosphere during the measurement campaigns.
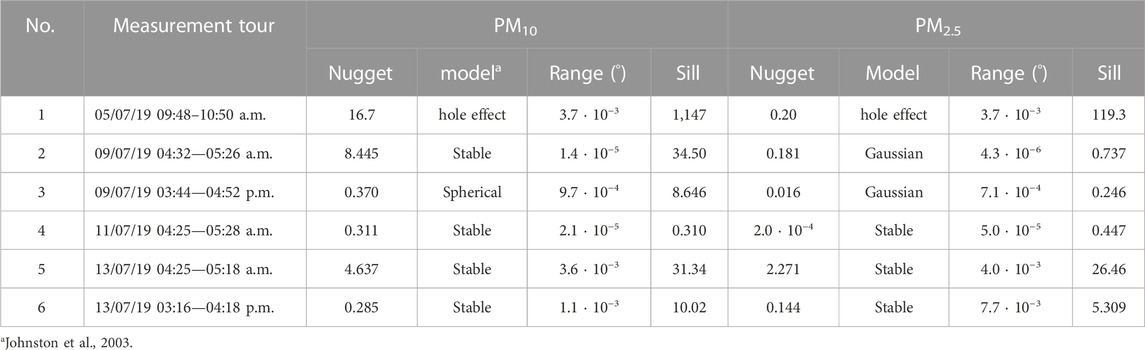
TABLE 3. Model parameters of geostatistical interpolations.
The situation on 5th of July between 9:48 and 10:50 a.m. (Figure 6) is dominated for both, PM10 and PM2.5, by a hotspot of high aerosol concentrations in a back road in the central-southern part of the area of investigation. Here some commercial land use occurs such as a large car dealer who also runs an auto repair shop. Thus, a relative higher density of car motor operations occasionally can occur here. The PM10 concentrations increase to more as 200 μg/m³, the PM2.5 concentrations reach values above 50 μg/m³. Although threshold values are not defined for short term ambient conditions it has to be stated that these concentrations are far higher as the legal values for the daily average of PM10 in the European Union with 50 μg/m³ at not more as 35 days per year. For PM2.5 the European Union’s threshold value is 25 μg/m³ as annual average. That value is reached in the aerosol hot spot region during this monitoring tour. In the rest of the area the PM10 concentration is below 50 μg/m³ and the PM2.5 concentration below 20 μg/m³. Nevertheless, it should be considered that the WHO proposes lower threshold values of 5 μg/m³ for PM2.5 and 15 μg/m³ for PM10 for the annual mean and 15 μg/m³ and 45 μg/m³ for the 24-h mean, respectively. The northern part of the area of investigation shows lower aerosol loadings as the southern part. This pattern overlays with the more loose development and higher share of green spaces in the norther part relative to southern part. All in all, the spatial aerosol distribution pattern of PM10 is far more heterogenuos as that of PM2.5, that is also reflected by the higher standard deviation for PM10. These areas of higher PM10 values are not always directly connected to roads and can be found in built-up areas of the single districts.
On 9th of July in the morning, the pattern for PM2.5 shows higher concentrations in the north-eastern parts of the area of investigation and lowest values in the southern and western parts (Figure 7). Threshold values are partly reached, such as the average annual values of the WHO with 5 μg/m³ for PM2.5 and 15 μg/m³ for PM10. However, the mean values measured during the run do not reach the WHO threshold value for PM10 or only slightly exceeds it for PM2.5. Also during this monitoring tour, the PM10 pattern is different to that of PM2.5. Hot spots of PM10 concentrations occur at the western and south-eastern margins of the area of investigation and in the center slightly east of the Durlacher Tor. The decoupling to PM2.5 and the locally restricted occurrences of higher concentrations are strong hints to construction activities, which take place at those locations to establish the subway in Karlsruhe. Coarse particles are more often produced and resuspended by construction activities. In contrast, automobiles exhaust rather finer particles, that occur in relative higher concentrations in the north-eastern parts of the monitored area, which is reflected by the spatial PM2.5 pattern.
In the afternoon of the 9th of July, threshold values were not reached for PM10 and PM2.5 mean values (Figure 8). The overall concentrations are lower as in the morning and the spatial patterns of both, PM10 and PM2.5, differ. The higher PM2.5 concentrations in the north-eastern part of the area vanished and a specific hotspot occurs in the west in a backstreet of the old district “Dörfle”. Regarding PM10, higher concentrations still occur in distinct hotspots in the west and in the south-east, but the central hot spot is not visible anymore. Here, the wind speed, which is almost twice as high in the afternoon as in the morning, is a possible cause for the difference of the PM2.5 concentrations. Furthermore, the change of the wind direction from eastern directions towards northern directions together with the relative high wind velocities will also contribute to the changed spatial pattern. Varying construction activities are able to influence the spatial patterns of PM10 with respect of the morning results.
During the monitoring tour on 11th of July the spatial patterns of PM10 and PM2.5 show similarities to the spatial pattern of PM10 of the 9th of July in the morning (Figure 9). The spatial pattern of PM2.5 is characterized by hotspots in the west, in the center slightly east of the Durlacher Tor and in the south-east. These hotspots are also depicted in the spatial pattern of PM10, where a further hotspot occurs in a park in the south of the investigation area. Wind velocities and directions are quite similar to those of the 9th in the morning, resulting in a similar spatial pattern at least for PM10. Thus, especially the different spatial patterns of PM2.5 are noteworthy, probably due to a different share of contributions of aerosol from traffic versus construction activities. On average, the PM2.5 concentrations were higher on 9th of July in the morning as on 11th of July. This induces a less impact of traffic to the overall aerosol pollution on 11th of July. Generally, the mean values of PM10 and PM2.5 do not exceed those of the WHO.
During the monitoring tour in the morning of the 13th of July, lowest aerosol concentrations occurred along a corridor starting from the east of the investigation area towards the DT, which is the center and further along the connected avenues towards north and southwest from the DT (Figure 10). However, further towards south, west and north higher concentrations occurred again. The similarity of the spatial patterns of PM10 and PM2.5 is documented by the quite similar variogram models of both distributions (Table 3). Also the absolute concentrations of PM10 and PM2.5 during this period are quite similar. PM10 and PM2.5 exceeded the WHO threshold values, especially PM2.5 concentrations were up to about eight times the WHO threshold of the annual mean and clearly exceeded the WHO 24-h mean value. However, in this context it has to be considered that the high relative humidity during this period might influence the aerosol sensors causing elevated concentrations (Figure 4).
Lower concentrations were monitored again in the afternoon of the 13th of July (Figure 11). Meanwhile the general wind direction changed from south-west in the morning to north in the afternoon. Clear hotspots of aerosol concentrations again were detected at the square east of DT (Figure 1) for both aerosol size classes, similar to the patterns of the 9th and 11th of July (Figure 7; Figure 8; Figure 9), and in addition for PM10 just south-west of the DT intersection. Lowest aerosol concentrations occur in the park region in the south and in the university area in the north-western parts of the investigation area. Generally, the western part is less affected by aerosol pollution as the eastern part of the area of investigation. The PM10 and PM2.5 mean concentrations stay below the WHO 24-h threshold values.
4 Discussion
Generally, two main statements can be made: i) PM10 and PM2.5 patterns were often similar, which could be expected, but divergences occasionally occur, ii) PM10 and PM2.5 patterns at different recording times (measurement tours) extremely differ even within 1 day. This is of high importance for health assessment, monitoring planning and urban development. All six tours vary significantly in their spatial aerosol distribution patterns. This reflects the high dynamics of aerosol sources in urban areas combined with high variability of meteorological conditions interacting with the building structure. Different to Liang et al. (2023), a non-negligible influence of wind conditions on the aerosol patters could be deduced. The mean aerosol concentrations of the tours also differ from those measured at the state monitoring site that is located roughly 2 km west of the area of investigation (Figure 12). In most cases they are below those measured at the Rheinhold-Frank-Straße-Station. This station is recording directly at the roadside of a busy street with about 38.000 vehicles passing a day. During the measurement runs in this study, measurements were mainly taken along roads with significantly less traffic. Thus, permanently monitoring reference stations are important for traffic planning and emission control, but they do not reflect the variability of aerosol concentrations within single districts where people often most of the time live. Therefore, both approaches complement each other and provide valuable information for emission control aspects in both, traffic planning and city planning.
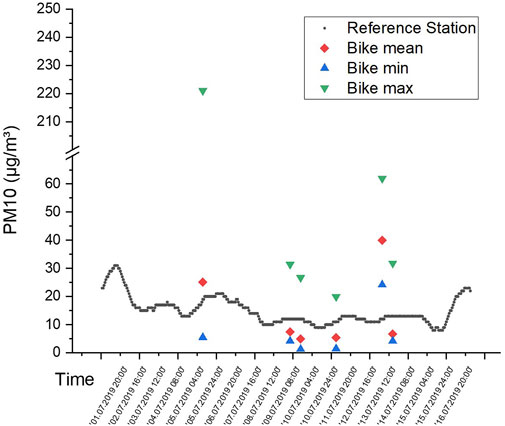
FIGURE 12. PM10 concentrations at an automatically recording air quality station operated by the State of Baden-Württemberg at Karlsruhe-Southwest (Reinhold-Frank-Straße) (data base query from https://www.umweltbundesamt.de/daten/luft/luftdaten/luftqualitaet, access 09/01/20) and mean, min and max bike tour values.
Higher mean PM10 concentrations in comparison to the reference station occurred in the area of investigation on the 5th of July and on 13th of July. On 13th of July during the morning measurement, the bike tour data is much higher than those recorded at the state monitoring site, which probably is also a measurement effect (Figure 4) due to high relative humidity (Table 2). However, the spatial patterns of relative differences of aerosol concentrations will not be affected. PM2.5 is not measured at the state monitoring site, but similar patterns as those of PM10 can be expected as was also shown for the monitoring tours. Interestingly, the different aerosol distribution patterns do not simply correlate with wind direction and velocity (Table 2). During all campaigns, the wind blew from different directions but a specific spatial connection between wind direction and aerosol concentration patterns was only identified for few examples. This finding highlights the complex interplay of wind direction and velocity, building structure and varying emission patterns.
Obvious is the impact of wind direction on spatial aerosol patterns on 13th of July in the morning, when wind blew from southwest (Figure 13). Here, the PM2.5 and PM10 that is emitted along the large avenue at the southern margin (Kriegsstraße) of the tour route are transported into the adjacent northern park. The Kriegsstraße shows the highest daily traffic volume in the whole investigation area, which means that this street is affected by respectively high emissions from automobiles. Consequently, this plume directly can be explained by windblown traffic emissions. Quite striking for this spatial pattern is the general homogeneity of aerosol distribution with low concentrations in the central part and the eastern areas, and higher concentrations in the rest of the district. This gives evidence that the wind is refreshing the air via the road that is running from southwest to the central “Durlacher Tor” (DT), and from here further along the roads directed to the north, north-east and east (Figure 13). Higher concentrations again occur in the residential area between the roads towards north and north-east, where refreshing is blocked and accumulation of aerosols occurs.
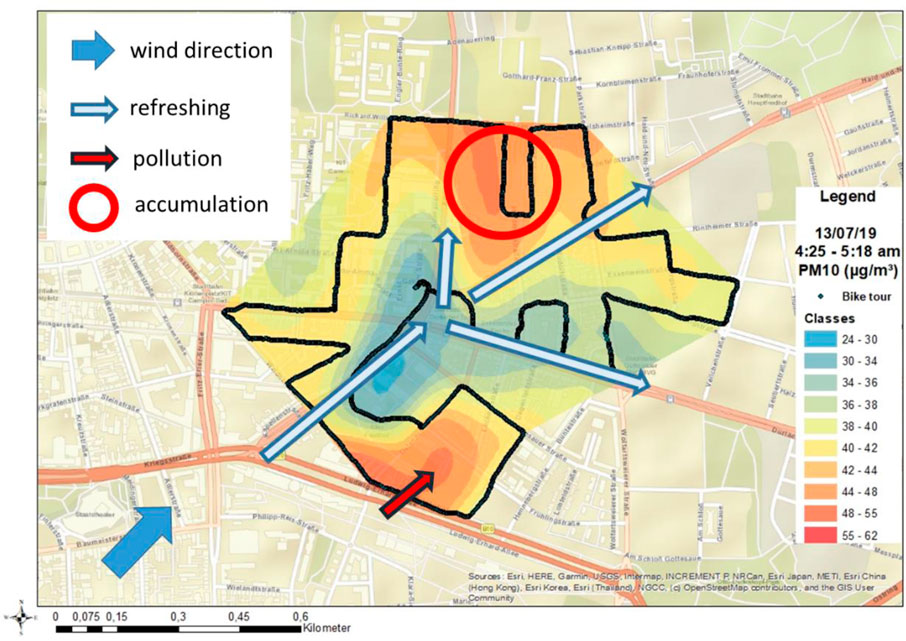
FIGURE 13. Interaction of wind direction and aerosol distribution pattern on 13th of July during the morning tour.
On 5th of July, wind also influences the aerosol pattern and produced a little plume with maximum PM10 concentrations of about 100 μg/m³ stretching towards south-east (Figure 14). This plume is direct south-east of a car selling and repair center, from which emissions occasionally can emanate when several motors are in operation. This highlights a missing link of these in situ measurements. Aerosol plumes are identified after data evaluation and map processing. In cities, aerosol emission sources can vary enormously in space and time. Singular or irregular occurring point and line sources are difficult to determine retrospectively. To overcome this gap, on-time processing of interpolated aerosol plume maps would be the next step in analyzing such heterogeneous patterns to identify specific aerosol sources.
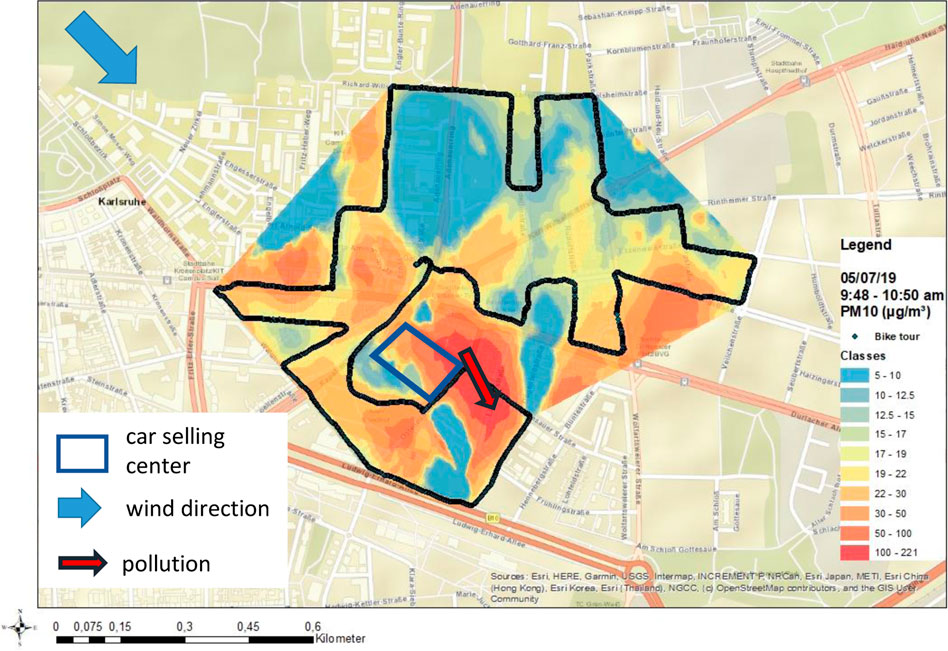
FIGURE 14. Interaction of wind direction and aerosol distribution pattern on 5th of July.
On 11th of July, a plume of higher aerosol concentrations occurred on the central place DT. Further hotspots were monitored in the west and in the south-east of area of investigation (Figure 9). This, however, can be better explained by construction activities and not only by traffic due to the temporal and distinct appearance of those activities during this time of subway construction along the affected road. This deduction is supported by the intensive PM10 peak in this area representing coarser particle sources such as construction works. Since 2009, those activities are numerous in the whole inner city of Karlsruhe because of subway construction, which were finalized in 2022. Hot spots of aerosol pollutions also were recorded at the other measurement days, but their locations are varying.
In Figure 15, recorded hot spots of aerosol pollution are depicted that were identified for the different measurement tours. This shows the high diversity of aerosol concentration levels in the urban space on different days. In this figure also the main traffic light systems and large cross roads are indicated. Several aerosol hotspots from the different measurement tours are not in conjunction with these traffic light systems. Thus, the peaks do not depend solely on cross roads or traffic lights causing accumulating traffic emissions but represent ubiquitous traffic emissions, commercial or private air polluting activities as well as construction activities, which can occur as single emission events. For health protection issues it would be important to strengthen investigation on such single emission events to develop control concepts.
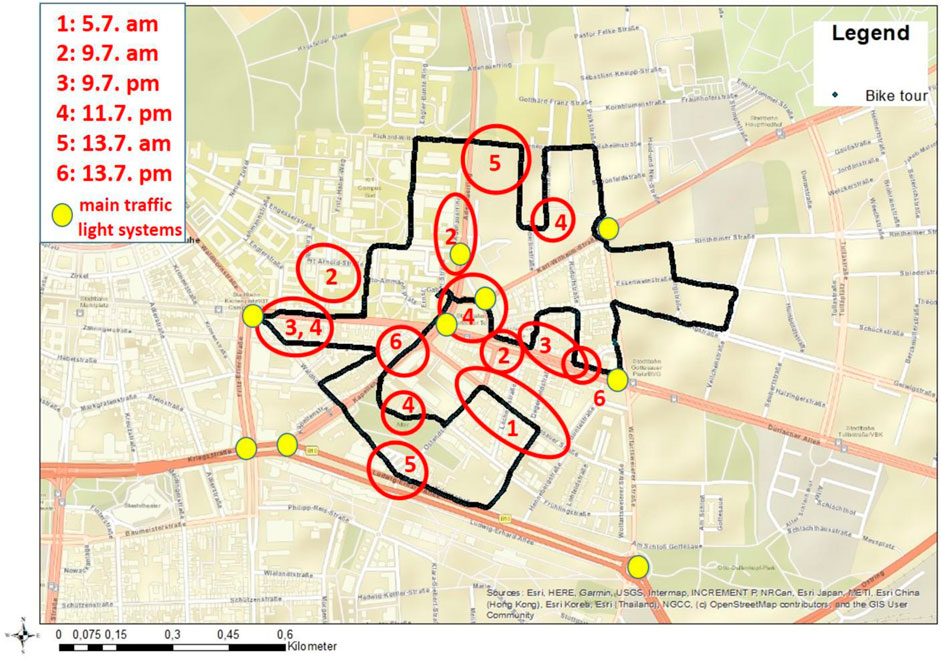
FIGURE 15. Hot spots of aerosol pollution (red circles) during the different recording tours.
Yeom. (2021) used a car based sensor system to monitor gaseous and particulate matter concentrations in a high spatial resolution in Daejeon, South Korea. Interpolation results indicate high spatial variability as well, but on a smaller scale as this study. Also Apte et al. (2017) used a car based sensor system monitoring black carbon, NO and NO2 in Oakland, CA, United States. For all three parameters a high spatial variability was shown. However, due to data agglomeration of the numerous measurement tours no temporal variations could be shown. Variability of gaseous pollution in the urban space was also proven by Górka and Lewicka-Szczebak. (2013) for CO2 and its isotopic composition. This study is based only on 15 sampling locations and concentrations and isotopic signals were interpolated similar to this study. Due to the limited number of recording stations, this study (Górka and Lewicka-Szczebak, 2013) only shows general trends that are not comparable with the higher resolution of this study. The same is valid for the study of Muni et al. (2021), in which NO2 concentrations were interpolated via the city of Sheffield, United Kingdom. The final interpolation results in statements about the influence of the topography and distance from the city center. Small scale patterns like in this study could not be displayed. Peters et al. (2014), although not generating interpolation maps, also stressed a high variability of aerosol loads within the streets of Antwerp recorded by a mobile bicycle platform. Traffic was described as one factor for the aerosol pollution beside the complex interplay of others, such as meteorology, street topology but also urban background fluctuations. Also satellite information is used for the analysis of the spatial aerosol pollution of the urban atmosphere. Particular matter concentrations are derived from the aerosol optical depth (AOD). Generally, it could be shown that correlations between land use and AOD exist, e.g., negative correlations between AOD and vegetated areas and positive correlations with constructed lands as was shown by Xie and Sun, 2021 for the city of Wuhan, China. This in line with the particle filtration effect of vegetation (Viippola et al., 2020; He et al., 2022). Also this study shows indications of lower aerosol concentrations in green areas although aerosol plumes can be transported into these areas in case of a respective combination of wind direction and aerosol source. Yu. (2023) correlated for the same city urban building structure and PM2.5 pollution on the basis of a combination of satellite and ground observations. This study could highlight the general effect that blocking air mass movements by larger buildings depend on wind direction and result in higher PM2.5 concentrations. This leads to small scale variations of aerosol concentrations as were carved out also in this study on Karlsruhe. Nevertheless, satellite data do not provide in situ measures as does ground monitoring and does not provide a similar high resolution but are very valuable for the analysis of particle concentrations over larger areas and long time periods. Consequently, urban planning should much more take into account the possibility to reduce aerosol pollution by creating green spaces and the arrangement of building blocks as is for example, conceived by Demmler et al. (2021).
Thus, the necessity of high spatial resolution measurements of aerosol pollution within the urban structure is obvious to identify hot spots of exposure and consequently of potential health risk. Considering the importance of the topic and the current state of research many more studies as the one documented here are needed to identify recurrent patterns of aerosol pollution due to construction arrangements, aerosol sources and meteorological conditions. Applied methods and insights gained here will contribute to identify effective counter measures and to improve urban development with the aim to safeguard human health and wellbeing. Those may include establishing proper air circulation for new buildings without blocking freshening pathways, adjusted traffic concepts, greener city centers and control of primary emission sources.
5 Summary and conclusion
Several PM2.5 and PM10 monitoring tours with a mobile, low cost sensor system attached to a bicycle dragged measurement platform were carried out for an inner urban district in the city of Karlsruhe, South-West Germany. The received data sets were interpolated by means of geostatistics and display the spatial distribution of aerosol pollution. Although these interpolations were calculated across the built-up areas, the spatial distribution is influenced by the buildings. These maps support the understanding of the variability of spatial aerosol patterns in urban systems if interpreted correspondingly.
It could be shown that the patterns of aerosol distribution in urban systems are not reflected by single urban reference stations as often installed. The high spatial resolution of aerosol concentrations within the urban structure can be extremely different from that of the reference station. Simple deductions of these high resolution patterns of spatial aerosol distribution from wind direction and obvious main aerosol sources such as traffic are not possible. In Karlsruhe maximum values of about 200 μg/m³ were recorded with a mobile particle counter when at the same time the reference station for street conditions in Karlsruhe only showed 18 μg/m³ of PM10. On the other hand, the average concentrations recorded during the measurement tours often were below those of the reference station. This can be explained here by the fact that the reference station is located at a busy road, but it also shows that this station is not able to represent the complex variability of aerosol concentrations within a city. Due to the spatial variability of the aerosol concentrations, threshold values can be extremely exceeded at some locations whereas at other locations nearby at the same time very low concentrations occur. Thus, the complex patterns of spatial distributions of aerosol levels within the built-up structures need to be more intensively investigated within different urban environments to deduce guidelines for a healthy and sustainable development. Finally, it can be stated that both together, single continuously monitoring reference stations and highly spatio-temporal resolved monitoring tours will provide best comprehensive information on urban aerosol pollution necessary to assess the health impacts for each citizen in its respective living situation. Since it could be shown that the spatial aerosol plumes are highly variable at different measurement times, many more measurement tours are required to identify regularities between aerosol plume patterns, emission sources, meteorological conditions and building structures. These results can be used to develop, calibrate and validate numeric models for forecasting aerosol patterns in urban systems and the related health impacts.
Data availability statement
The raw data supporting the conclusion of this article will be made available by the authors, without undue reservation.
Author contributions
All authors listed have made a substantial, direct, and intellectual contribution to the work and approved it for publication.
Conflict of interest
The authors declare that the research was conducted in the absence of any commercial or financial relationships that could be construed as a potential conflict of interest.
Publisher’s note
All claims expressed in this article are solely those of the authors and do not necessarily represent those of their affiliated organizations, or those of the publisher, the editors and the reviewers. Any product that may be evaluated in this article, or claim that may be made by its manufacturer, is not guaranteed or endorsed by the publisher.
References
Aarzoo, N., and Samim, M. (2022). Palladium nanoparticles as emerging pollutants from motor vehicles: An in-depth review on distribution, uptake and toxicological effects in occupational and living environment. Sci. Total Environ. 823, 153787. doi:10.1016/j.scitotenv.2022.153787
Apte, J. S., Messier, K. P., Gani, S., Brauer, M., Kirchstetter, T. W., Lunden, M. M., et al. (2017). High-resolution air pollution mapping with google street view cars: Exploiting big data. Environ. Sci. Technol. 51, 6999–7008. doi:10.1021/acs.est.7b00891
Asbach, C., and Todea, A. M. (2016). Personal exposure to ultrafine particles in everyday life. Gefahrst. Reinhalt. Luft 76 (9), 315–321. doi:10.1016/j.scitotenv.2017.03.049
Beckwith, M., Bates, E., Gillah, A., and Carslaw, N. (2019). NO2 hotspots: Are we measuring in the right place? Atmosperic Environ. X 2, 100025. doi:10.1016/j.aeaoa.2019.100025
Bissolli, P., Deutschländer, T., Imbery, F., Haeseler, S., Lefebvre, C., Blahak, J., et al. (2019). Hitzewelle juli 2019 in westeuropa – neuer nationaler rekord in deutschland deutscher wetterdienst. Avaliable At: https://www.dwd.de/DE/leistungen/besondereereignisse/temperatur/20190801_hitzerekord_juli2019.pdf?__blob=publicationFile&v=3.
Borge, R., Narros, A., Artinano, B., Yagüe, C., Gómez-Moreno, F. J., de la Paz, D., et al. (2016). Assessment of microscale spatio-temporal variation of air pollution at an urban hotspot in Madrid (Spain) through an extensive field campaign. Atmos. Environ. 140, 432–445. doi:10.1016/j.atmosenv.2016.06.020
Budde, M., Almuth, D. S., Müller, T., Laquai, B., Streibl, N., Schindler, G., et al. (2018). “Potential and limitations of the low-cost SDS011 particle sensor for monitoring urban air quality,” in 3rd international conference on atmospheric dust (DUST).
Chen, Y., Schleicher, N., Cen, K., Liu, X., Yu, Y., Zibat, V., et al. (2016). Evaluation of impact factors on PM2.5 based on long–term chemical components analyses in the megacity Beijing, China. Chemosphere 155, 234–242. doi:10.1016/j.chemosphere.2016.04.052
Demmler, J. C., Gosztonyi, Á., Du, Y., Leinonen, M., Ruotsalainen, L., Järvi, L., et al. (2021). A novel approach of creating sustainable urban planning solutions that optimise the local air quality and environmental equity in Helsinki, Finland: The CouSCOUS study protocol. PLOS ONE 16, e0260009. doi:10.1371/journal.pone.0260009
European Environmental Agency (2020). Air quality in europe - 2020 report. Luxembourg: Publicaiton Office of the European Union.
Geng, F., Hua, J., Mu, Z., Peng, L., Xu, X., Chen, R., et al. (2013). Differentiating the associations of black carbon and fine particle with daily mortality in a Chinese city. Environ. Res. 120, 27–32. doi:10.1016/j.envres.2012.08.007
Genikomsakis, K. N., Galatoulas, N. F., Dallas, P. I., Ibarra, L. M. C., Margaritis, D., and Ioakimidis, C. S. (2018). Development and on-field testing of low-cost portable system for monitoring PM2.5 concentrations. Sensors-Basel 18, 1056. doi:10.3390/s18041056
Górka, M., and Lewicka-Szczebak, D. (2013). One-year spatial and temporal monitoring of concentration and carbon isotopic composition of atmospheric CO2 in a Wroclaw (SW Poland) city area. Appl. Geochem. 35, 7–13. doi:10.1016/j.apgeochem.2013.05.010
Grinshpun, S. A., Yermakov, M., Reponen, T., Simmons, M., LeMasters, G. K., and Ryan, P. H. (2014). Traffic particles in ambient air of a major US urban area: Has anything changed over a decade? Aerosol Air Qual. Res. 14, 1344–1351. doi:10.4209/aaqr.2013.11.0334
Guthrie, D. G. (1997). Mineral properties and their contributions to particle toxicity. Environ. Health Perspect. 105 (5), 1003–1011. doi:10.2307/3433501
Guthrie, D. G., and Mossmann, B. T. (1993). Health effects of mineral dusts. Rev. Mineralogy 28, 584.
Hackenbruch, J. (2018). Anpassungsrelevante Klimaänderungen für städtische Baustrukturen und Wohnquartiere. Dissertation. Karlsruhe, Germany: Kalrsruhe Institute of Technology.
Hagemann, R., Corsmeier, U., Kottmeier, C., Rinke, R., Wieser, A., and Vogel, B. (2014). Spatial variability of particle number concentrations and NOx in the Karlsruhe (Germany) area obtained with the mobile laboratory ‘AERO-TRAM. Atmos. Environ. 94, 341–352. doi:10.1016/j.atmosenv.2014.05.051
Hart, R., Liang, L., and Dong, P. (2020). Monitoring, mapping, and modeling spatial-temporal patterns of PM2.5 for improved understanding of air pollution dynamics using portable sensing technologies. Int. J. Environ. Res. Public Health 17, 4914. doi:10.3390/ijerph17144914
He, C., Li, S., Zhang, Y., and Wu, M. (2022). Role of roadside vegetation as a passive method for the reduction of urban water-insoluble fine particle and impacts brought by different planting patterns. Air Qual. Atmos. Health 15, 1923–1940. doi:10.1007/s11869-022-01226-8
Huang, Y., Yao, H., Fu, B., Zou, C., Liu, H., Liu, X., et al. (2022). Fine particulate-bound arsenic and selenium from coal-fired power plants: Formation, removal and bioaccessibility. Sci. Total Environ. 823, 153723. doi:10.1016/j.scitotenv.2022.153723
Imbery, F., Friedrich, K., Fleckenstein, R., Kaspar, F., Bissolli, P., Daßler, J., et al. (2019). Neuer Rekord der mittleren Junitemperatur für Deutschland und intensive Hitzewelle in Europa. Deutscher Wetterdienst. Avaliable At: https://www.dwd.de/DE/leistungen/besondereereignisse/temperatur/20190703_bericht_juni2019.pdf?__blob=publicationFile&v=2.
Janssen, N. A., Hoek, G., Simic-Lawson, M., Fischer, P., van Bree, L., ten Bring, H., et al. (2011). Black carbon as an additional indicator of the adverse health effects of airborne particles compared with PM10 and PM2.5. Environ. health Perspect. 119, 1691–1699. doi:10.1289/ehp.1003369
Johnston, K., Ver Hoef, J. M., Krivoruchko, K., and Lucas, N. (2003). ArcGis 9. Redlands, CA, USA: ESRI.
Khuzestani, R. B., Liao, K., Liu, Y., Miao, R., Zheng, Y., Cheng, X., et al. (2022). Spatial variability of air pollutants in a megacity characterized by mobile measurements. Atmos. Chem. Phys. 22, 7389–7404. doi:10.5194/acp-22-7389-2022
Klemm, O., Ahrens, A., Arnswald, M., Bethke, R., Berger, D. F., Blankenhaus, K., et al. (2022). The impact of traffic and meteorology on urban particle mass and particle number concentrations: Student-led studies using mobile measurements before, during, and after the COVID-19 pandemic lockdowns. Atmosphere 13 (62), 62. doi:10.3390/atmos13010062
Kuang, C., Neumann, T., Norra, S., and Stüben, D. (2004). Land use related chemical composition of street sediments in Beijing. Environ. Sci. Pollut. Res. 11 (2), 73–83. doi:10.1007/bf02979706
Kumar, P., Kumar, S., and Yadav, S. (2018). Seasonal variations in size distribution, water-soluble ions, and carbon content of size-segregated aerosols over New Delhi. Environ. Scince Pollut. Res. 25, 6061–6078. doi:10.1007/s11356-017-0954-6
Kushta, J., Pozzer, A., and Lelieveld, J. (2018). Uncertainties in estimates of mortality attributable to ambient PM2.5 in Europe. Environ. Res. Lett. 13, 064029. doi:10.1088/1748-9326/aabf29
Li, Y., and Myint, S. W. (2021). Fine resolution air quality dynamics related to socioeconomic and land use factors in the most polluted desert metropolitan in the American Southwest. Sci. Total Environ. 788, 147713. doi:10.1016/j.scitotenv.2021.147713
Li, Z., Zhou, R., Li, Y., Chen, M., Wang, Y., Huang, T., et al. (2021). Characteristics and sources of organic aerosol markers in PM2.5. Aerosol Air Qual. Res. 21 (9), 210180. doi:10.4209/aaqr.210180
Liang, C-J., Lin, P-Y., Chen, Y-C., and Liang, J-J. (2023). Effects of regional air pollutants on respiratory diseases in the basin metropolitan area of central Taiwan. Sustain. Environ. Res. 33 (1), 1. doi:10.1186/s42834-022-00159-2
Lim, C. C., Kim, H., Vilcassim, M. J. R., Thurston, G. D., Gordon, T., Chen, L. C., et al. (2019). Mapping urban air quality using mobile sampling with low-cost sensors and machine learning in Seoul, South Korea. Environ. Internatinal 131, 105022. doi:10.1016/j.envint.2019.105022
Liu, C., Chen, R., Sera, F., Vicedo-Cabrera, A. M., Guo, Y., Tong, S., et al. (2019a). Ambient particulate air pollution and daily mortality in 652 cities. N. Engl. J. Med. 381 (8), 705–715. doi:10.1056/nejmoa1817364
Liu, H. Y., Schneider, P., Haugen, R., and Vogt, M. (2019b). Performance assessment of a low-cost PM2.5 sensor for a near four-month period in oslo, Norway. Atmosphere-Basel 10, 41. doi:10.3390/atmos10020041
Mehra, M., Zirzow, F., Ram, K., and Norra, S. (2020). Geochemistry of PM2.5 aerosols at an urban site, Varanasi, in the Eastern Indo-Gangetic Plain during pre-monsoon season. Atmos. Res. 234, 104734. doi:10.1016/j.atmosres.2019.104734
Monn, C., Carabias, V., Junker, M., Waeber, R., Karrer, M., and Wanner, H. U. (1997). Small-scale spatial variability of particulate matter < 10 µm (PM10) and nitrogen dioxide. Atmos. Environ. 31 (15), 2243–2247. doi:10.1016/s1352-2310(97)00030-7
Muni, S., Mayfield, M., and Coca, D. (2021). Understanding spatial variability of NO2 in urban areas using spatial modelling and data fusion approaches. Atmosphere 12, 179. doi:10.3390/atmos12020179
Nath, B., Norra, S., Chatterjee, D., and Stüben, D. (2007). Fingerprinting of land use related chemical and pollution patterns of street sediments: An environmental forensic case study from Kolkata, in- dia. Environ. Forensics 8 (4), 313–328. doi:10.1080/15275920701506516
Nikolova, I., Janssen, S., Vos, P., and Berghams, P. (2014). Modelling the mixing of size resolved traffic induced and background ultrafine particles from an urban street canyon to adjacent backyards. Aerosol Air Qual. Res. 14, 145–155. doi:10.4209/aaqr.2013.06.0221
Norra, S., Handley, L. L., Berner, Z., and Stüben, D. (2005). 13C and 15N natural abundances of urban soils and herbaceous vegetation in Karlsruhe, Germany. Eur. J. Soil Sci. 56, 607–620. doi:10.1111/j.1365-2389.2005.00701.x
Norra, S., Lanka-Panditha, M., Kramar, U., and Stüben, D. (2006). Mineralogical and geochemical patterns of urban surface soils, the example of Pforzheim, Germany. Appl. Geochem. 21 (12), 2064–2081. doi:10.1016/j.apgeochem.2006.06.014
Norra, S., and Stüben, D. (2004). Trace element patterns and seasonal variability of dust precipitation in a low polluted city - the example of Karlsruhe/Germany. Environ. Monit. Assess. Stud. 93, 203–228. doi:10.1023/b:emas.0000016803.95952.b2
Norra, S. (2022). The Astysphere - a concept to overcome the polarity between cities and nature and to develop sustainable urban raw material fluxes. IOP Conf. Ser. Earth Environ. Sci. 1078, 012063. doi:10.1088/1755-1315/1078/1/012063
Norra, S. (2009). The astysphere and urban geochemistry—A new approach to integrate urban systems into the geoscientific concept of spheres and a challenging concept of modern geochemistry supporting the sustainable development of planet Earth. Environ. Sci. Pollut. Res. 16, 539–545. doi:10.1007/s11356-009-0183-8
Norra, S. (2014). Urban geochemistry news in brief. Environ. Earth Sciene 71, 983–990. doi:10.1007/s12665-013-2866-1
Norra, S., Weber, A., Kramar, U., and Stüben, D. (2001). 2001: Mapping of trace metals in urban soils – The ex-ample of mühlburg/karlsruhe. J. Soils Sediments 1 (2), 77–93.
Norra, S., Yu, Y., Dietze, V., Schleicher, N., Fricker, M., Kaminski, U., et al. (2016). Seasonal dynamics of coarse atmospheric particulate matter between 2.5 μm and 80 μm in Beijing and the impact of 2008 Olympic Games. Atmos. Environ. 124, 109–118. doi:10.1016/j.atmosenv.2015.08.029
Park, S., Ku, J., Lee, S-M., Hwang, H., Lee, N., Kim, H., et al. (2022). Potential toxicity of inorganic ions in particulate matter: Ion permeation in lung and disruption of cell metabolism. Sci. total Environ. 824, 153818. doi:10.1016/j.scitotenv.2022.153818
Peters, J., Van den Bossche, J., Reggente, M., Van Poppel, M., De Baets, B., and Theunis, J. (2014). Cyclist exposure to UFP and BC on urban routes in Antwerp, Belgium. Atmos. Environ. 92, 31–43. doi:10.1016/j.atmosenv.2014.03.039
Peters, T. M., Ott, D., and O'Shaughnessy, P. T. (2006). Comparison of the grimm 1.108 and 1.109 portable aerosol spectrometer to the TSI 3321 aerodynamic particle sizer for dry particles. Ann. Occup. Hyg. 8, 843–850. doi:10.1093/annhyg/mel067
Rahman, Md. M., Zhao, M., Islam, M. S., Dong, K., and Saha, S. C. (2021). Aerosol particle transport and deposition in upper and lower airways of infant, child and adult human lungs Atmosphere 12, 1402.
Rowell, A., Terry, M. E., and Deary, M. E. (2021). Comparison of diffusion tube.measured nitrogene dioxide concentrations at child and adult breathing heights: Who are we monitoring for? Air Qual. Atmos. Health 14, 27–36. doi:10.1007/s11869-020-00909-4
Saha, P. K., Sengupta, A., Adams, P., Robinson, A. L., and Presto, A. A. (2020). Spatial correlation of ultrafine particle number and fine particle mass at urban scales: Implications for health assessment. Environ. Sci. Technol. 54, 9295–9304. doi:10.1021/acs.est.0c02763
Schleicher, N., Norra, S., Fricker, M., Kaminski, U., Chen, Y., Chai, F., et al. (2013). Spatio-temporal variations of black carbon concentrations in the Megacity Beijing. Environ. Pollut. 182, 392–401. doi:10.1016/j.envpol.2013.07.042
Schleicher, N. J., Schäfer, J., Blanc, G., Chen, Y., Chai, F., Cen, K., et al. (2015). Atmospheric particulate mercury in the megacity Beijing: Spatio-temporal variations and source apportionment. Atmos. Environ. 109, 251–261. doi:10.1016/j.atmosenv.2015.03.018
Schleicher, N. J., Schäfer, J., Chen, Y., Blanc, G., Chen, Y., Chai, F., et al. (2016). Atmospheric particulate mercury in the megacity Beijing: Efficiency of mitigation measures and assessment of health effects. Atmos. Environ. 124, 396–403. doi:10.1016/j.atmosenv.2015.09.040
Son, J-Y., Fong, K. C., Heo, S., Kim, H., Lim, C. C., and Bell, M. L. (2020). Reductions in mortality resulting from reduced air pollution levels due to COVID-19 mitigation measures. Sci. Total Environ. 744, 141012. doi:10.1016/j.scitotenv.2020.141012
Song, J., Saathoff, H., Gao, L., Gebhardt, R., Jiang, F., Vallon, M., et al. (2022). Variations of PM2.5 sources in the context of meteorology and seasonality at an urban street canyon in Southwest Germany. Atmos. Environ. 282, 119147. doi:10.1016/j.atmosenv.2022.119147
Stadt Karlsruhe (2013). Verkehrsentwicklungsplan Karlsruhe zustandsanalyse. Karlsruhe: Stadtplanungsamt Karlsruhe.
VDI (2012). Measurement of atmospheric depositions - determination of the dust deposition according to the Bergerhoff method. Ver. Dtsch. Ingenieure, VDI-Guideline 4320, 2.
Viippola, V., Yli-Pelkonen, V., Järvi, L., Kulmala, M., and Setälä, H. (2020). Effects of forests on particle number concentrations in near-road environments across three geographic regions. Environ. Pollut. 266, 115294. doi:10.1016/j.envpol.2020.115294
Vogt, M., Schneider, P., Castell, N., and Hamer, P. (2021). 2021: Assessment of low-cost particulate matter sensor systems against optical and gravimetric methods in a field Co-location in Norway. Atmosphere 12, 961. doi:10.3390/atmos12080961
Xie, Q., and Sun, Q. (2021). Monitoring the spatial variation of aerosol optical depth and its correlation with land use/land cover in wuhan, China: A perspective of urban planning. Int. J. Environ. Res. Public Health 18, 1132. doi:10.3390/ijerph18031132
Yao, Y., Pan, J., Wang, W., Liu, Z., Kan, H., Qiu, Y., et al. (2020). Association of particulate matter pollution and case fatality rate of COVID-19 in 49 Chinese cities. Sci. Total Environ. 741, 140396. doi:10.1016/j.scitotenv.2020.140396
Yeom, K. (2021). Development of urban air monitoring with high spatial resolution using mobile vehicle sensors. Environ. Monit. Assess. Stud. 193, 375. doi:10.1007/s10661-021-09139-2
Yin, Y., Qi, J., Gong, J., and Gao, D. (2021). Distribution of bacterial concentration and viability in atmospheric aerosols under various weather conditions in the coastal region of China. Sci. Total Environ. 795, 148713. doi:10.1016/j.scitotenv.2021.148713
Yu, R. (2023). Correlation analysis of urban building form and PM2.5 pollution based on satellite and ground observations. Front. Environ. Sci. 10, 1111223. doi:10.3389/fenvs2022.1111223
Keywords: mobile, bicycle, aerosol, measurement platform, spatial pattern, urban pollution, low cost sensor
Citation: Norra S, Song J, Gebhardt R, Bauer J, Broß M, Fuchs M, Huber T, Mack D and Saathoff H (2023) Spatio-temporal dynamics of aerosol distribution in an urban environment recorded in situ by means of a bike based monitoring system. Front. Environ. Sci. 11:749477. doi: 10.3389/fenvs.2023.749477
Received: 29 July 2021; Accepted: 22 February 2023;
Published: 06 March 2023.
Edited by:
Oladele Ogunseitan, University of California, Irvine, United StatesReviewed by:
Michael Edward Deary, Northumbria University, United KingdomR. Naresh Kumar, Birla Institute of Technology, Mesra, India
Copyright © 2023 Norra, Song, Gebhardt, Bauer, Broß, Fuchs, Huber, Mack and Saathoff. This is an open-access article distributed under the terms of the Creative Commons Attribution License (CC BY). The use, distribution or reproduction in other forums is permitted, provided the original author(s) and the copyright owner(s) are credited and that the original publication in this journal is cited, in accordance with accepted academic practice. No use, distribution or reproduction is permitted which does not comply with these terms.
*Correspondence: Stefan Norra, stefan.norra@kit.edu