The role of topography feedbacks in enrichment of heavy metal elements in terrace type region
 Yuanyuan Tang1,2
  Donghui Zhang3*
  Honggen Xu1 Liangliang Dai1 Qingyang Xu1 Zhijie Zhang4 Xiaodong Jing5
- 1Changsha General Survey of Natural Resources Center, Changsha, China
- 2China University of Geosciences, Beijing, China
- 3Institute of Remote Sensing Satellite, China Academy of Space Technology, Beijing, China
- 4School of Geography, Development & Environment, University of Arizona, Tucson, AZ, United States
- 5Geomatics Engineering Department, Sichuan College of Architectural Technology, Deyang, China
Minerals, metallurgy, and other production activities will cause a large number of heavy metal elements to leak into the natural environment. A large number of heavy metal elements have been found in the farmland soil, where the adsorption of plants enhances the enrichment. Here, we have selected a region with three terraces to conduct a whole-area soil sample collection and satellite hyperspectral data processing study to explore the role of terrain in this enrichment process. Five spectral transformation methods and four feature enhancement algorithms were designed, and the content extraction model was established to quantitatively retrieve eight heavy metal elements. The results indicates that the three terraces are the source state, transition state, and stable state of heavy metals respectively with the decrease of elevation; The correlation coefficient of various heavy metal elements exceeds 0.92, and the enrichment pattern is consistent although slope and aspect have no significant correlation with the enrichment of heavy metal elements; Local Cd exceeds 30.00%, Hg exceeds 10 times, and As exceeds 48.30% according to the indicator provisions of Chinese national standard (GB 15618-2018). Such knowledge extends our understanding of the abundance, migration, and enrichment of heavy metals from the perspective of topography, which is crucial for pollution assessment and soil remediation.
1 Introduction
Heavy metal elements caused by mineral exploitation in mountainous areas flow from high altitude regions to low altitude regions and accumulate in densely populated valley plains (Shin et al., 2020; Cai et al., 2022). Unfortunately, this transportation process will pollute all farmland soil (Zhou et al., 2021). The enrichment of heavy metal elements, through the adsorption of biological roots, is finally partially absorbed by the human body, leading to public health problems (Banerjee et al., 2017; Agyeman et al., 2022; Wang et al., 2022). The traditional monitoring method is to carry out soil sampling (Guo et al., 2021), laboratory testing (Hou et al., 2019), and interpolation analysis technology on a yearly basis (Cai et al., 2022). The difficulty lies in the huge cost and timeliness cannot meet the public demand (Liu et al., 2017; Chen et al., 2022).
The combination of spectroscopy and chemometrics can be used as a practical, fast, low-cost and quantitative method (Liu et al., 2021). The general process of traditional soil heavy metal hyperspectral monitoring includes collecting representative soil samples to ensure sample quantity and quality, performing pretreatments such as drying, grinding, and sieving to obtain samples suitable for acquiring hyperspectral remote sensing data (Mezned et al., 2022). Obtaining the soil sample’s reflectance spectral data using a hyperspectral remote sensing instrument. Preprocessing the acquired spectral data, including atmospheric correction, radiometric correction, and comparison of ground object similarity (Harmel et al., 2012; Agyeman et al., 2022). Extracting the characteristic wavelength bands of soil heavy metal elements from the processed spectral data. Establishing the relationship between characteristic wavelength bands and soil heavy metal element content to obtain a quantitative inversion model (Ben-Dor et al., 2006; Tong et al., 2010). Performing hyperspectral inversion of soil heavy metal element content. Using the established quantitative inversion model, converting spectral data into spatial distribution maps of soil heavy metal element content (Ben Dor et al., 2022; Cai et al., 2022). A series of new discoveries have been made in soil zinc and nickel concentration distribution (Guo et al., 2021), heavy metal cations (Shin et al., 2020), soil Cr and Ni concentrations (Han L et al., 2022), soil mercury pollution (Han et al., 2021), clay minerals (Zhou et al., 2021), and toxic minerals (Dkhala et al., 2020). Heavy metals in soil generally belong to trace level, and it is difficult to find characteristic bands (Li et al., 2021; Zhang B. et al., 2022; Cai et al., 2022). Although several spectrum segments of heavy metals have been obtained, their universality is difficult to be recognized (Guo et al., 2021). A large number of spectral preprocessing methods have been used to improve the amount of spectral information and the accuracy of the model (Chen et al., 2019; Bian et al., 2021; Zhang B. et al., 2022).
The content of soil heavy metals usually decreases with the increase of terrain elevation, especially in areas with large differences in elevation such as mountainous regions, because heavy metals in the soil usually deposit to low-altitude areas with the flow of water and other substances (Saidi et al., 2022). Hydrological conditions also have some influence on the transport and accumulation of soil heavy metals, such as extreme weather events like heavy rains which can lead to an increase in soil heavy metal content (Mendes et al., 2022; Zhao et al., 2022). Excessive use of mining, smelting, and chemical fertilizers releases toxic pollutants such as Zn, Pb, or Cd into the soil, thus poisoning the soil and further harming the growth of crops (Xue et al., 2020; Li B. et al., 2022). Snow melting, frozen soil melting, and rainfall can transport soil matter to low-lying areas (Ou et al., 2021). In addition, the effect of terrain makes it very difficult for traditional sampling methods to determine the source and transportation route of pollutants (Guo et al., 2021; Ou et al., 2021). Heavy metals are exported from pollution sources, transported by water systems from streams near mountains, and absorbed and enriched by the land through which they pass, forming a complete transmission chain (Banerjee et al., 2017). Different crops will absorb different types of heavy metals, and the roots and straws further form new enrichment forms (Xue et al., 2020; Li Y. et al., 2022). The content of soil heavy metals varies in different geological environments, for example, the content of soil heavy metals is usually higher in geological environments such as igneous rocks and metamorphic rocks than in sedimentary rocks (Brossard et al., 2016; Wan et al., 2021). Overall, the content of soil heavy metals is closely related to factors such as terrain, hydrological conditions, and geological background, and a comprehensive consideration of these factors is needed to accurately assess the pollution status of soil heavy metals.
The application of hyperspectral remote sensing technology in the extraction of heavy metals from soil is a highly researched area, however, there are still some limitations and shortcomings in practical applications. Firstly, although hyperspectral remote sensing technology can capture more spectral information of objects, the information obtained in the extraction of soil heavy metals may not necessarily reflect the true content of heavy metals in the soil. Therefore, it is necessary to process and analyze the spectral data obtained by hyperspectral remote sensing technology to obtain more accurate information on heavy metal content. Secondly, the widely used methods of hyperspectral remote sensing technology in the field of soil heavy metal extraction all have certain limitations. For example, these methods require a large amount of sample data for training and are susceptible to the influence of data noise, leading to inaccurate identification results. Finally, despite the rapid and non-destructive detection advantages of hyperspectral remote sensing technology, there are still some difficulties in practical applications. For example, the cost of spectrometers is relatively high, the operation is complex, and requires professional personnel for operation and analysis.
Although hyperspectral remote sensing technology has tremendous potential in the field of soil heavy metal extraction, there are still limitations and shortcomings in practical applications. The next step in research needs to further improve the analysis methods of hyperspectral remote sensing technology and combine them with other methods to enhance the accuracy and reliability of soil heavy metal extraction. At the same time, it is necessary to reduce instrument costs, improve data processing efficiency, and enable hyperspectral remote sensing technology to be widely applied in the monitoring of soil heavy metal pollution and environmental assessment, providing a scientific basis for the management of soil pollution.
To understand the relationship between soil heavy metals and terraces, here, we collected soil samples from a county and hyperspectral satellite data for a day with good weather conditions. Eight typical heavy metal elements were quantitatively extracted through data preprocessing, algorithm implementation, precision evaluation, mapping, and analysis (Liu et al., 2017; Han L et al., 2022; Mezned et al., 2022). The strength of heavy metal content along the three terraces and the distribution patterns of heavy metal content in soil along the topography were studied by introducing slope, aspect, and pH data (Chen et al., 2019; Agyeman et al., 2022; Cai et al., 2022; Giniyatullin et al., 2022). The types of heavy metals exceeding the standard in the study area are obtained under the provisions of the Chinese national standard GB 15618-2018. The above knowledge broadens the understanding of heavy metal transport and enrichment, and is essential for the assessment and soil remediation.
2 Materials and methods
2.1 The study area
Fenghuang County, Xiangxi Tujia and Miao Autonomous Prefecture, Hunan Province is selected as the study area (109°18′E∼109°48′E, 27°44′N∼28°19′N) (Figure 1). The study area has undulating terrain, with main landforms including mountains, valleys, and hills. The area is crisscrossed by mountain ranges, with major peaks such as Jietian Peak and Wuling Peak. Multiple rivers flow through the area, including the Tuo River and Simeng River. Additionally, Fenghuang County also has some relatively gentle hilly areas. The soil types are diverse, with mountain soils mainly composed of weathered rocks forming yellow-brown soil, rich in minerals and organic matter, suitable for vegetation growth. Sandy soils are mainly distributed in the valley areas, with a higher content of sand particles and good drainage. Huang soils are widely distributed, with thick soil layers and high fertility, suitable for cultivation and agricultural development (Xue et al., 2020). The total area is about 1,760 km2, and the terrain is divided into three terraces (Agyeman et al., 2022). The eastern part is a valley and hilly area with an altitude of less than 500 m, the middle part is a middle and low mountain area with an altitude of 500–800 m, and the western part is a middle mountain area with an altitude of more than 800 m (Figure 2). There has been a tradition of mineral mining since ancient times, with phosphate ore, manganese ore, vanadium ore, iron ore, and coal mining as the main mining. The waste liquid generated in the process of mineral development flows into the soil through physical and chemical processes due to the special tertiary terrace, resulting in potential heavy metal pollution risk (Lu et al., 2019; Chen et al., 2022).
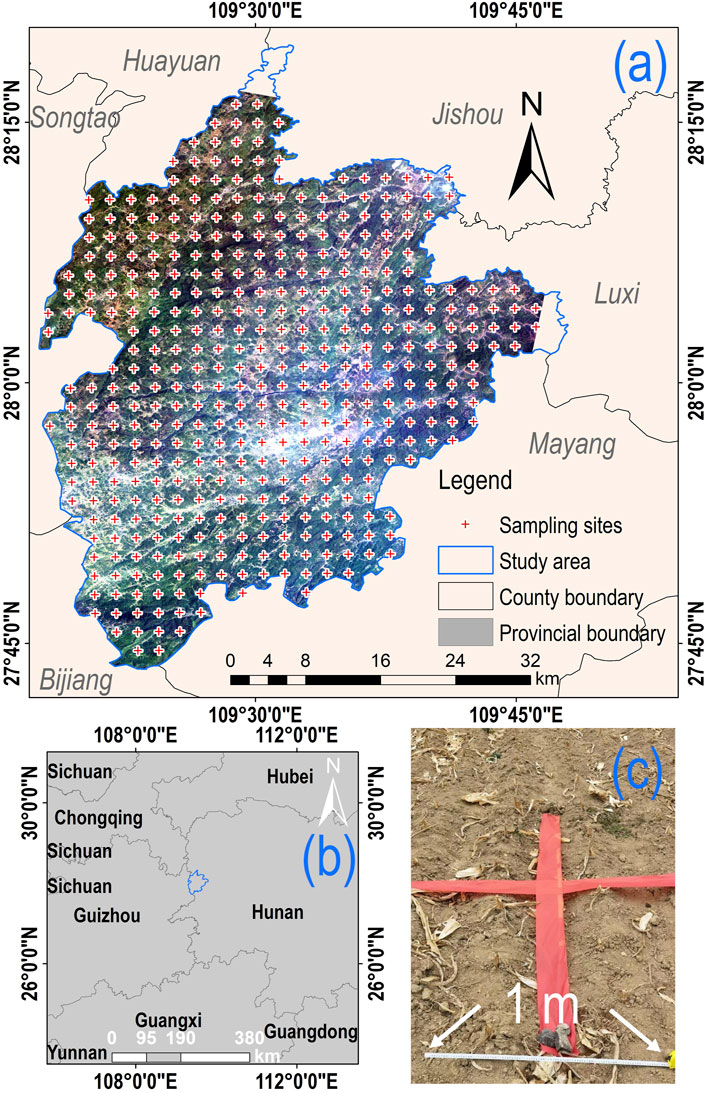
Figure 1. The distribution of the study area and sampling points. (A) The geographical distribution of the research area and sampling points; (B) Geographic site of the study area; (C) Synchronously determine GPS coordinates when collecting soil samples. Then take the soil within a 1 m range and send it to the laboratory for analysis and analysis.
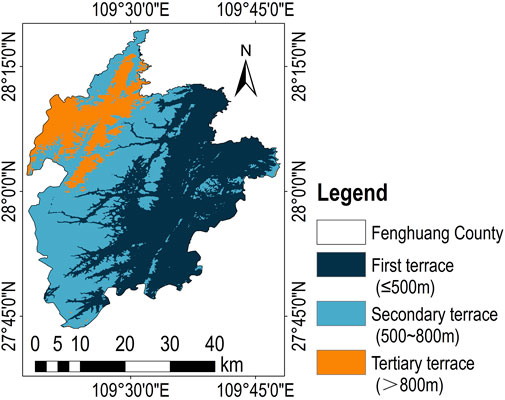
Figure 2. The study is divided into three terraces, which are valley hilly zone, middle and low mountain zone, and middle mountain zone from east to west.
Soil samples were collected at equidistant intervals of 2 km in the study area. And a total of 421 soil samples were obtained within a period of 1 month. Soil samples from the depth of 0–10 cm on the ground surface is collected at each point according to the longitude and latitude (Han B et al., 2022). They are sealed into polyethylene bags after removing plant roots, leaves, and stones with a mesh of 0.01 m. Send the collected soil samples to the Wuhan Mineral Resources Supervision and Testing Center of the Ministry of Land and Resources of China for physical and chemical analysis (Ben Dor et al., 2022). The contents of eight heavy metals such as cadmium, mercury, arsenic, lead, chromium, copper, nickel, and zinc were obtained. Among them, Cd, Pb, Cu, and Zn are measured by inductively coupled plasma mass spectrometry; Hg and As are determined by hydride generation-atomic fluorescence spectrometry; Cr is determined by X-ray fluorescence spectrometry; Ni was determined by inductively coupled plasma atomic emission spectrometry. A total of 421 samples were collected and divided into a modeling set and a validation set in a 7:3 ratio (Xue et al., 2020; Zhang B. et al., 2022; Mezned et al., 2022) (Table 1).
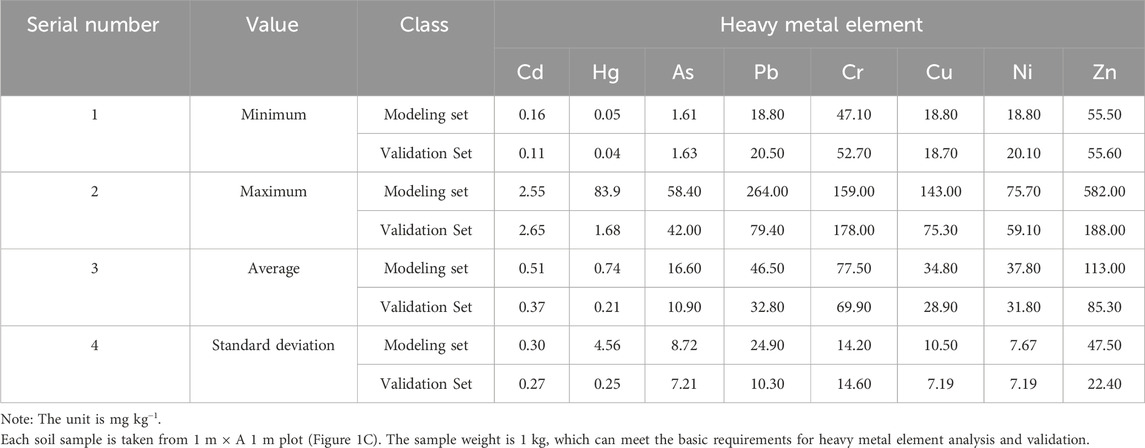
Table 1. Eight heavy metal content values were obtained for each soil sample, including the minimum, maximum, mean, and standard deviation values (Figure 1A).
2.2 Hyperspectral data acquisition and processing
OHS is the only commercial hyperspectral satellite in China that has completed the launch and networking. The spatial resolution is 10m, and the imaging range is 150 km × 2,500 km. The spectral resolution in the wavelength range of 400 nm–1,000 nm is 2.5 nm. This satellite data contains 32 spectral bands with a spatial resolution of 10 m [36]. Each group of satellite data contains a metadata file that records information such as payload, center point longitude and latitude, data acquisition time, satellite observation angle, solar altitude angle, etc., for subsequent data preprocessing (Zhang B. et al., 2022; Bouzidi et al., 2022). Data in 13 September 2022 were used in the study.
The process of data processing is divided into four steps: radiation correction, atmospheric correction, orthophoto correction, and study area clipping (Meng et al., 2021). Firstly, radiation correction. By using pre collected sensor response functions for calibration, the radiation distortion caused by the characteristics of the sensor itself is removed (Wang et al., 2022). Secondly, by utilizing the FLAASH algorithm and using an atmospheric transport model, the impact of the atmosphere on the image is estimated and corrected, and this impact is removed (Agyeman et al., 2022). Thirdly, use elevation data to generate a digital surface model, and then register satellite images with DSM to achieve ortho-correction. This method can consider the height difference of ground objects and improve the spatial positioning accuracy of the image (Agyeman et al., 2022). Fourthly, Fourthly, use vector boundaries and spatial analysis algorithms to crop the image into parts that intersect or are included within the boundaries (Wang et al., 2018). Finally, the reflectance data of satellite remote sensing images in the study area were obtained (Meng et al., 2021).
2.3 Algorithms
A set of algorithm processes was designed to better establish the relationship between spectrum and content. Firstly, the spectral data underwent five types of transformations to highlight the spectral characteristics. Secondly, the data was divided into a modeling set and a validation set, and the content of the modeling set was used to establish a partial least squares model with the spectral values. Thirdly, the modeling results were evaluated using the calculated values of NMI, MI, MIC, and Pearson, and the relatively optimal model was selected. Fourthly, the optimal model was applied to the validation dataset, and the predicted values were evaluated against the laboratory values using the indicators R2 to determine the effectiveness of the model (Figure 3).

Figure 3. Algorithm flowchart from data acquisition to model selection.
Five spectral data transformation methods were selected, including original spectrum, logarithmic spectrum, exponential spectrum, homogenization spectrum, and first derivative spectrum (Xue et al., 2020; Tan et al., 2021; Li B. et al., 2022). The original spectrum is not processed, and the pixel spectrum is directly taken for modeling; Logarithmic spectrum is a discrete way to make the spectrum close to normal distribution (Xu et al., 2022); Exponential spectrum can improve the value of low reflectivity and restrain the value of high reflectivity; The homogenization spectrum can remove the systematic error generated in the preprocessing process; The first derivative spectrum can amplify the mutation position of reflectivity and help to find the characteristic band (Table 2).

Table 2. The spectral transformation method selected in the study.
The purpose of selecting different spectral data conversion methods is to extract or emphasize information from different aspects of spectral data, to better adapt to subsequent data analysis and modeling needs.
(1) Original spectrum: Without any processing, model directly using pixel spectra. This method can preserve the characteristics of the original data and is suitable for data analysis that does not require additional processing in certain situations.
(2) Logarithmic spectroscopy: Performing logarithmic transformation on a spectrum to make it closer to a normal distribution can aid in the application of certain statistical methods, such as linear regression.
(3) Exponential spectrum: can increase the value of low reflectivity and suppress the value of high reflectivity. This method can adjust the dynamic range of spectral data, making some details more prominent in visualization and analysis.
(4) Uniformization spectroscopy: This method can remove systematic errors generated during preprocessing, making spectral data more accurate and reliable.
(5) First derivative spectroscopy: By calculating the first derivative of the spectrum, the position of abrupt changes in reflectance can be magnified, which helps to identify characteristic bands or edge positions. This method can extract local variation information from spectral data, which is helpful for the detection and analysis of specific features.
PLSR is selected as the modeling algorithm (Li B. et al., 2022; Mezned et al., 2022; Wang et al., 2022). PLSR (Partial Least Squares Regression) is a commonly used multivariate statistical modeling algorithm that has the following advantages in spectral processing.
(1) Solving the problem of multicollinearity: In spectral data, there is correlation and overlap between different bands, which may lead to the problem of multicollinearity in traditional linear regression methods. PLSR can effectively solve multicollinearity problems and improve the stability and accuracy of modeling by transforming predictive and response variables into new composite variables.
(2) Performs well in small sample situations: Spectral data typically has high dimensionality and relatively small sample sizes, which can make traditional regression methods difficult to obtain reliable results. PLSR uses multiple principal components to represent the variability of the original spectral data, which can better fit the data in small sample situations and reduce the risk of overfitting.
(3) Considering the characteristics of spectral data: PLSR is based on the principle of principal component analysis, which selects principal components to explain the variability of spectral data to the greatest extent possible. This enables PLSR to capture key features in spectral data and effectively utilize these features for modeling and prediction.
(4) Strong interpretability: PLSR can generate weight coefficients to explain the contribution of different bands to response variables in spectral data. This makes the PLSR model highly interpretable, helping researchers understand the relationship between spectral data and response variables, and further analyze and interpret them.
This method is used to find the basic relationship between reflectivity X and heavy metal content Y, and characterizes reflectivity into four correlation coefficients such as NMI, MI, MIC and Pearson.
NMI is a measure of the similarity of two reflectivity, with a range of [0,1]. The higher the value is, the more similar the two clustering results are (Huang et al., 2022). The formula is,
Where,
MI is an information quantity, which is the uncertainty of a random variable reduced by knowing another random variable (Wang et al., 2022). If two variables
Where, the minimum value of
The MIC coefficient can evaluate different types of association relationships efficiently to find a wide range of relationship types, with a value range of [0,1], and has good robustness (Zhou et al., 2022). The formula is,
Where, the range of
Pearson coefficient is used to measure the linear correlation degree between two variables
Where,
The determination coefficient R2 are commonly used evaluation indicators in hyperspectral quantitative remote sensing to evaluate the fitting degree and prediction accuracy of models. The coefficient R2 is used to measure the explanatory power of the model to the observed data, that is, the proportion of variance that the model can explain the dependent variable. The value range of R2 is between 0 and 1, and the closer it is to 1, the better the model fits and can explain more variance; On the contrary, the closer to 0, the worse the fitting effect of the model and the inability to explain variance. By comparing the R2 values of different models, it can be determined which model is more suitable for fitting the data (Liu et al., 2021; Zhang D. et al., 2022).
3 Results
3.1 The strength of heavy metal content along the three terraces
The distribution of eight heavy metals presents different laws according to the calculation results (Wang et al., 2018; Poppiel et al., 2020; Zhang D. et al., 2022). The distribution of Cd, Hg, and Cr contents has no significant relationship with terrace; The distribution of As, Pb, Ni, and Zn contents is positively correlated with altitude; The content of Cu is negatively correlated with the altitude (Figure 4).
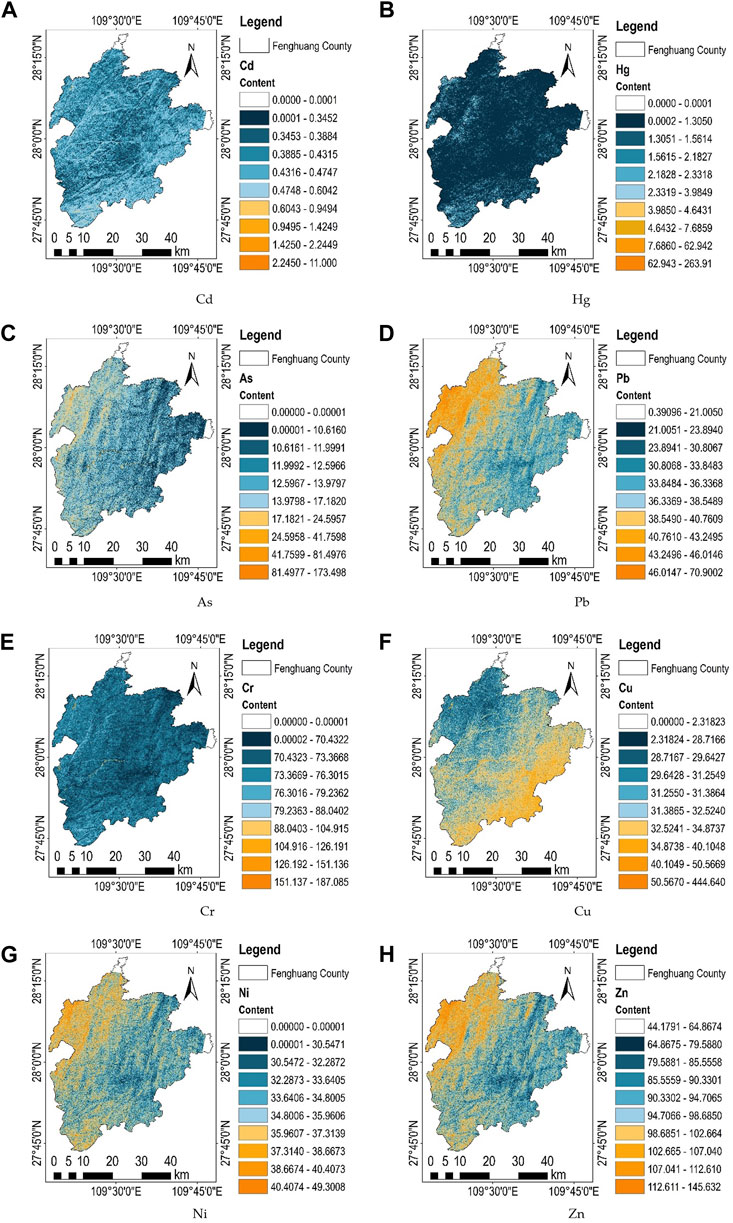
Figure 4. Mapping results of 9 soil components calculated from hyperspectral data. (A) The distribution of Cd is generally lower than 0.50 mg/kg, showing scattered distribution in the valley; (B) The distribution of Hg is lower than 1.50 mg/kg as a whole, and it is star-shaped in the study area; (C) The average value of As is 7.23 mg/kg, which is characterized by north-south distribution and significant high in individual regions; (D) The average value of Pb is 28.68 mg/kg, and there is a significant correlation between its distribution and terraces; (E) The content of Cr is lower than 80 mg/kg in most areas, but it is significantly higher in the valley; (F) The average content of Cu is 16.98 mg/kg, and its distribution is also closely related to terrace; (G) The average content of Ni is 18.38 mg/kg, and there is also a certain correlation between distribution and terraces; (H) The average content of Zn is 75.92 mg/kg, and the content of the first terrace is significantly higher.
Heavy metal elements are mainly distributed on the third terrace, which is consistent with the actual situation of mining (Figure 5A). The content of Cu is the only highest mean value distributed on the first terrace. It is speculated that human production and living activities lead to this phenomenon since there is no copper deposit in the area (Taghizadeh-Mehrjardi et al., 2021). The maximum content of heavy metals in each terrace mostly occurs in the first terrace, and only As and Cr do not follow this rule (Shin et al., 2020). The maximum pollution value still appears in the first terrace with high population density although there is a positive correlation between elevation and distribution (Figure 5B). The second terrace is in the transition zone connecting the other two terraces, and most of the content mutations occur in this area (Figure 5C). The first terrace is significantly higher than the other two terraces, even several times by calculate the total content of all heavy metals (Figure 5D). Heavy metals are enriched in this terrace with the rain, weathering, and erosion, as well as the impact of human production activities (Wang et al., 2018; Han L et al., 2022).
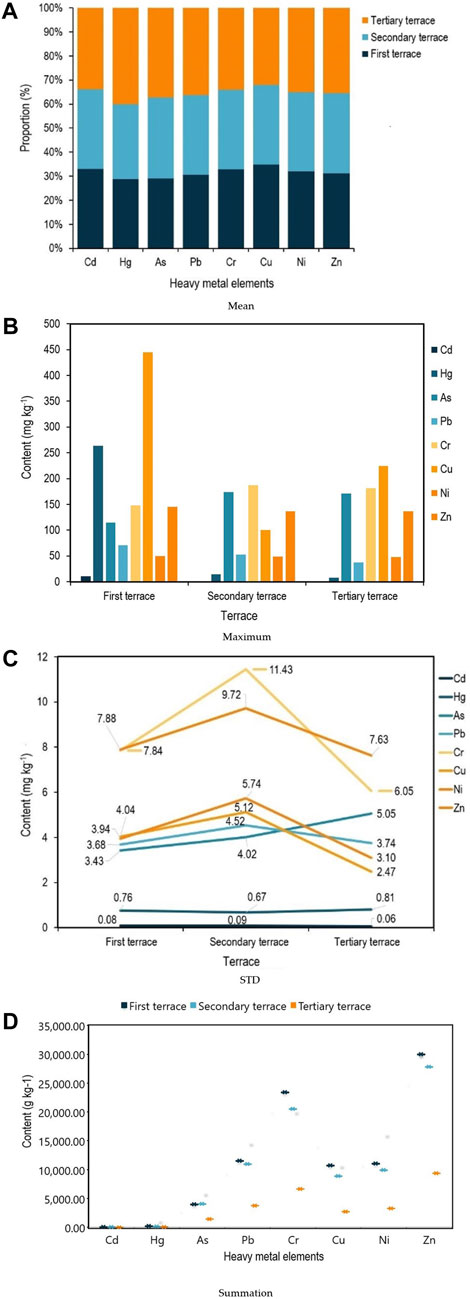
Figure 5. Statistical results of heavy metals in different terraces. (A) The highest Cu content is distributed outside the first terrace, while the average content of the other seven heavy metal elements is highest in the third terrace; (B) The maximum values of As and Cr appear in the second terrace, while the maximum values of the other six heavy metals appear in the first terrace at higher altitudes; (C) The maximum STD values of Hg and As appear in the third terrace, while the maximum STD values of the other six heavy metals appear in the second terrace at higher altitudes; (D) The total content of As element is the highest in the second terrace, while the other seven elements have the highest content in the first terrace at higher altitudes.
3.2 Distribution patterns of heavy metal content in soil along the topography
Slope and aspect are the most important indicators of terrain (Agyeman et al., 2022; Cai et al., 2022). The slope of the study area is between 0°–75° (Figure 6A), and the slope direction is mainly south and west (Figure 6B). There is no significant correlation between the two. The former is denudation under river cutting and weathering, and the latter is fault zone and mineralization caused by geological activities (Jiji, 2021; Giniyatullin et al., 2022).
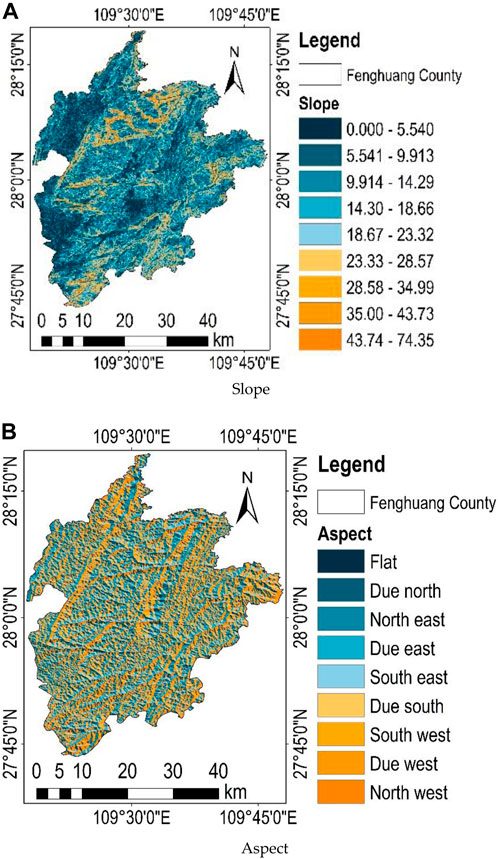
Figure 6. Response of heavy metals to topography. (A) Larger slope mainly occurs in the valley area due to the cutting effect of water system; the slope fluctuates violently; (B) The study area presents a south-north and east-west intersection trend, and southward and westward directions become the main existence mode of slope direction.
The correlation coefficient is only 0.05, which verifies that they are independent from each other from a mathematical point of view (Table 3). The aspect and slope have negligible correlation with Cd, Hg, As, and Pb, but have no correlation with the other four elements. It reveals that elevation is the only determining factor, independent of slope and aspect (Demattê et al., 2015; Chen et al., 2022). The correlation coefficient between Hg and other seven heavy metal elements is between 0.62–0.68. However, the correlation coefficient between the other seven heavy metal elements exceeded 0.92, especially the correlation coefficient of Cr, Cu, and Ni reached 0.98. The effects of mining, transportation, rehabilitation, and soil erosion have resulted in the enrichment of these heavy metal elements in the same places (Chen et al., 2022; Giniyatullin et al., 2022) (Figure 6C). This also explains that part of the local farmland will be fallow, because the crops planted often exceed the standard of heavy metals and fail to meet the requirements of safe food (Xue et al., 2020; Chen et al., 2023).
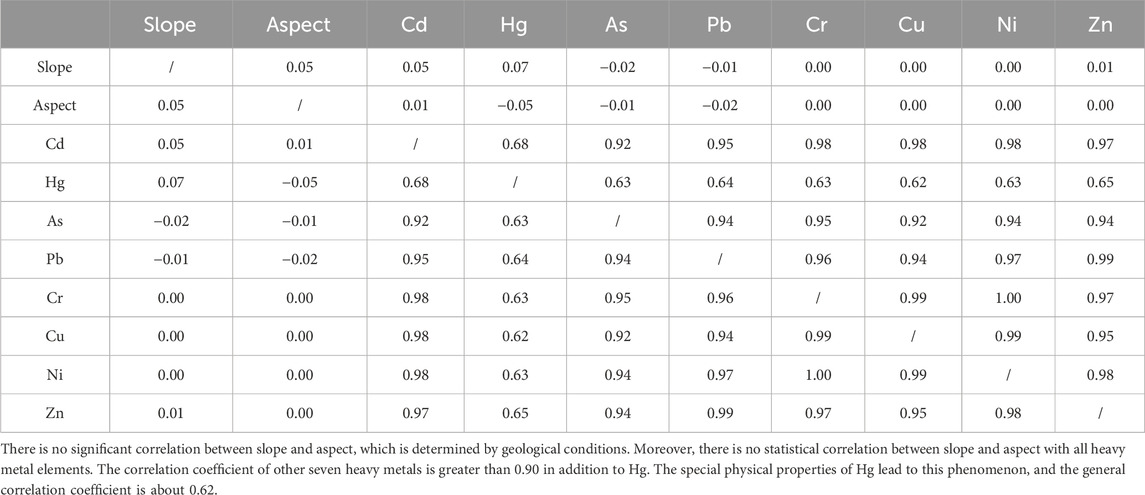
Table 3. Response relationship between heavy metals, slope, and aspect.
3.3 Assessment of heavy metal pollution in soil
The soil risk assessment was conducted according to the national standard, Soil environment quality—Risk control standard for soil contamination of agricultural land (GB 15618-2018) issued by China in 2018 (Table 4). Measure the pH value of the collected soil samples (Dkhala et al., 2020; Mezned et al., 2022) (Figure 7A). The pH is divided into four categories, and the area proportions of the four levels are 0.01%, 98.35%, 1.64%, and 0.00% respectively (Figure 7B).
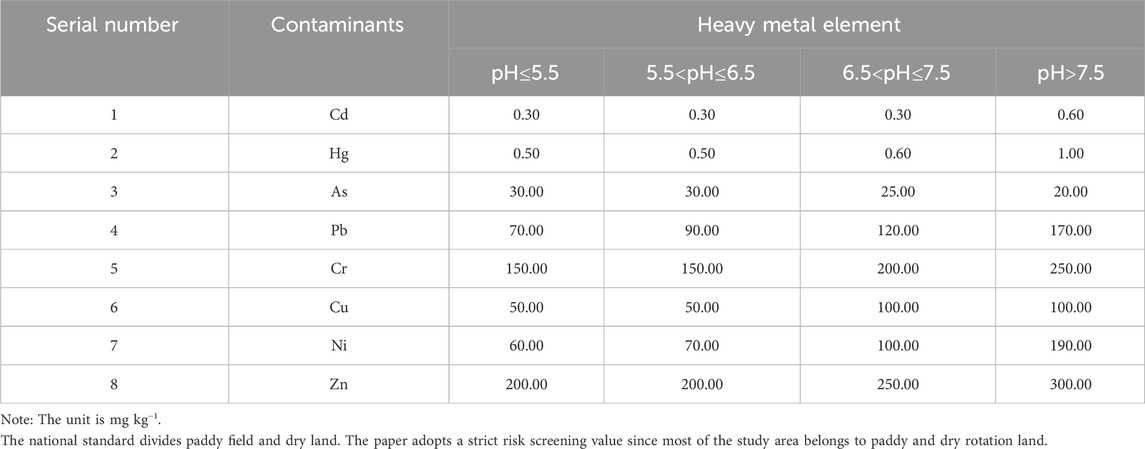
Table 4. National standards issued by China in 2018 (GB 15618–2018), Soil environment quality–Risk control standard for soil contamination of agricultural land.
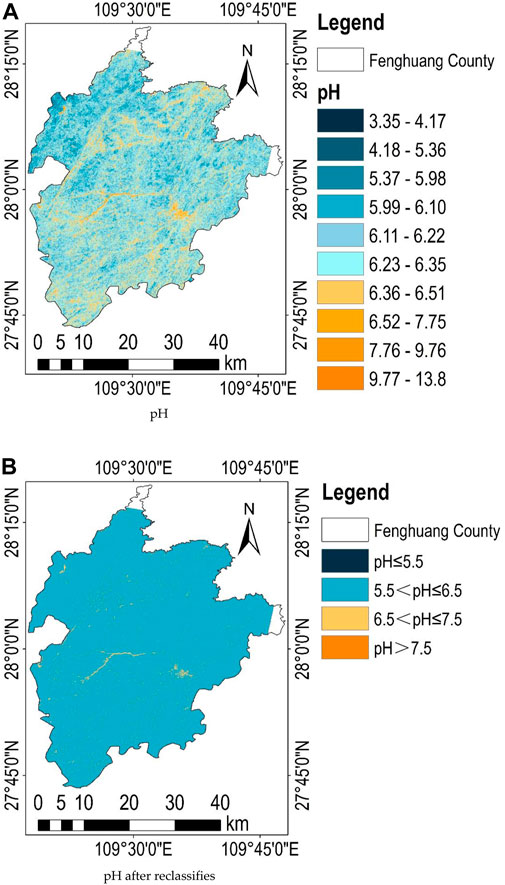
Figure 7. Distribution and grade of pH value. (A) The soil is weakly acidic as a whole; (B) The pH value of more than 98% of the area is the second category, between 5.5 and 6.5.
Cd is the most serious heavy metal in the soil and the average content is 0.43 mg kg−1, 0.52 mg kg−1, and 1.09 mg kg−1 respectively, when the pH exceeds 5.50 which is 30.23%, 42.31%, and 63.30% higher than the national standard (Bian et al., 2021). The average content of Hg element in the two grades of pH ≤ 5.50 and pH > 7.50 is 8.53 mg kg−1 and 11.27 mg kg−1, which are 16.06 times and 10.27 times higher than the national standard respectively. As element exceeded the standard in the range of pH > 7.50, and the average content was 29.66 mg kg−1, which is 48.30% higher than the 20.00 mg kg−1 required by the national standard. The other five heavy metal elements are below the requirements of the national standard, and are significantly lower than the threshold. There is no risk of heavy metal pollution (Giniyatullin et al., 2022) (Table 5).
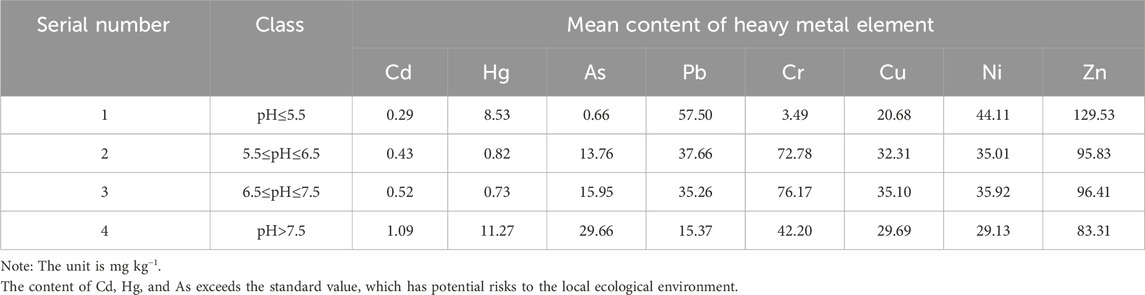
Table 5. Results of heavy metal elements exceeding the standard in the national standard (GB 15618-2018).
4 Discussion
In recent years, with the strengthening of China’s efforts to control air pollution and water pollution, these two environmental factors have initially met the requirements of healthy life [12,16]. In contrast, the seriousness of soil problems still exists, and there are not many reliable technical means (Xue et al., 2020; Ou et al., 2021). There is water, air bubbles, microorganisms, organic matter, minerals, and other substances in the soil (Han et al., 2021; Ou et al., 2021; Wang et al., 2021; Zhou et al., 2021). In terms of mechanism, speculation is based on the interaction principle between matter and electromagnetic radiation, while in terms of statistics, prediction models are established using a large amount of hyperspectral data and data analysis methods. This comprehensive application can improve the accuracy and reliability of heavy metal content, and play an important role in environmental protection, agricultural management, and other fields (Meng et al., 2021; Han B et al., 2022). The difficulty of the problem is that heavy metal elements in soil exist in trace or even micro amount forms (Lu et al., 2019). Current research shows that it is extremely difficult to determine the characteristic bands of each heavy metal element (Xue et al., 2020; Zhou et al., 2021; Zhang D. et al., 2022; Lin et al., 2022). This is easy to understand, because the content of heavy metal elements has a characteristic position in the spectrum, and this farmland can even extract minerals.
There are two ways to solve this problem. Firstly, the content of heavy metals can be extracted indirectly by determining the content relationship between heavy metals and other components with characteristic bands in the soil (Huang et al., 2022). There is a close relationship between heavy metal elements and soil moisture (Liu et al., 2017). The study indicates that the stability of soil aggregate water is gradually enhanced with the increase of Al, Fe, and Mn oxide content (Shin et al., 2020); There is a close relationship between Fe and Mn oxides (Zhou et al., 2021); Fe and Mn oxides will co-precipitate and oxidate with heavy metal pollutants arsenic, thus reducing the degree of heavy metal pollution (Zhou et al., 2021); Al can inhibit the decomposition of soil organic matter through adsorption and inhibition of microbial activity (Taghizadeh-Mehrjardi et al., 2021). Therefore, the content of heavy metals can be deduced by extracting the content of soil water, oxide, and organic matter (Lu et al., 2019; Wang et al., 2021; Zhou et al., 2021). Secondly, the heavy metal content and hyperspectral data are trained and learned on a large scale through machine learning algorithm, and the information is extracted from the statistical sense (Zhang B. et al., 2022; Giniyatullin et al., 2022; Lin et al., 2022). A series of breakthroughs have been made in relevant research although this method cannot answer the physical and chemical mechanism of heavy metal elements from the mechanism (Shin et al., 2020; Li Y. et al., 2022). From the results, the spectral principle is inversely inferred, and the closed-loop of the research is realized.
Our research combines the advantages and disadvantages of the above two methods. The PLSR model with stable information extraction is selected for TB level modeling and accuracy verification (Hou et al., 2019; Dkhala et al., 2020; Mezned et al., 2022). There are three discussion points extended. Firstly, the content of heavy metal elements in different terraces has three forms, that are generation, transition, and stability. Obviously, mineral occurrences in mountainous areas have become the source of heavy metals, known as the source state due to the impact of human production and living activities (Banerjee et al., 2017). Most heavy metal elements converge in the third terrace with the joint action of weather, climate, and water and soil, forming a potential risk area of soil heavy metal elements, called stable state (Shin et al., 2020). The secondary terrace becomes the pathway of heavy metal elements and forms the place where heavy metal elements are transported in the soil, which is called the transition state (Banerjee et al., 2017). This theory can be named STS model. Therefore, the strategy should obviously be to control the source state, block the transition state, and repair the stable state in order to control heavy metal pollution (Lin et al., 2022).
Additionally, the distribution pattern of heavy metal elements should be closely related to topography since terrain is an important factor in heavy metal transport (Han L et al., 2022). Terrain will lead to changes in water flow, sunshine, wind direction, and other environmental factors, which will lead to differences in the content of heavy metals (Liu et al., 2017; Bian et al., 2021). Thirdly, the prediction and early warning of local heavy metal exceeding the standard can give a comprehensive assessment conclusion of the environment based on the results of hyperspectral extraction of heavy metal elements (Shin et al., 2020; Tan et al., 2021). It can not only guide scientific pollution quality and soil remediation, but also identify potential risk sources and guide the government in carrying out relevant work (Chen et al., 2012; Bian et al., 2021; Wang et al., 2021).
It is an effective means to solve the problem of rapid extraction of regional soil heavy metal information whether the spectrometer is equipped on satellite (Bian et al., 2021), aircraft (Wang et al., 2022), UAV (Chen et al., 2022), or handheld (Hou et al., 2019). The low efficiency and uncontrollable factors of traditional sampling analysis urgently require the intervention of new technologies (Banerjee et al., 2017; Guo et al., 2021). Future research on hyperspectral technology in the field of heavy metal content should focus on improving the universality of models, breaking through regional and temporal limitations, and achieving true practicality. By improving data collection and processing, model development and optimization, model generalization and transfer learning, as well as practical application and validation, research can promote the widespread application of hyperspectral technology in this field and bring greater value to environmental protection and agricultural management (Guo et al., 2021; Taghizadeh-Mehrjardi et al., 2021).
Our research has identified the transport patterns of heavy metals in terraced areas. The abundance of heavy metals in soil is limited by terraces; Topography feedbacks affects both the abundance and spatial distribution of heavy metal content; And heavy metals migrate from high-altitude terraces to low-altitude terraces, forming STS models, namely source state, transition state, and stable state are the highlights of this paper (Figure 8).
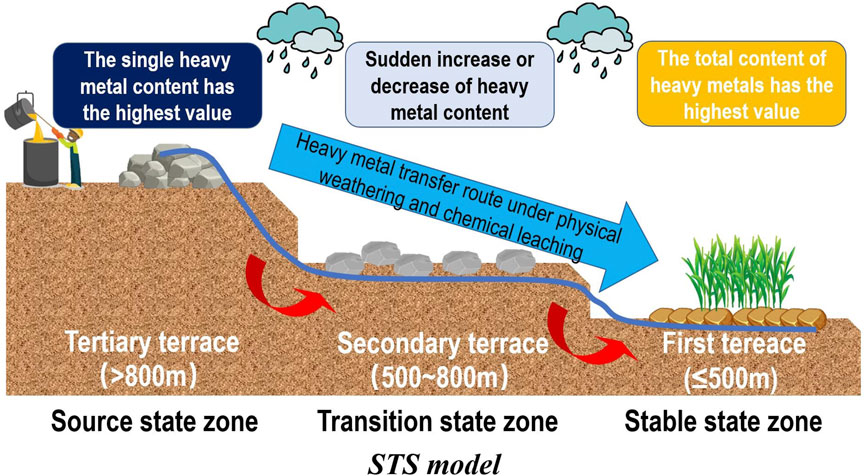
Figure 8. The transport patterns of heavy metals in terraced areas. Heavy metals migrate from high-altitude terraces to low-altitude terraces, forming STS models, namely source state, transition state, and stable state.
5 Conclusion
To our best knowledge, the present study quantifies the relationship between different geological terraces and the transport and enrichment of heavy metal elements in soil for the first time (Shi et al., 2018). In general, our findings have improved our understanding of the migration and accumulation of heavy metals in the process of mineral development and residents’ life from the perspectives of topography, environment, chemistry, etc. (Lu et al., 2019; Wang et al., 2020; Agyeman et al., 2022). Although the slope and aspect are not enough to dominate the spatial distribution of heavy metal elements, different elevations determine the enrichment of heavy metal elements (Ou et al., 2021; Taghizadeh-Mehrjardi et al., 2021). We have accurately assessed the excess of heavy metals in the study area with reference to relevant national standards in order to assess the extent of this enrichment (Chen et al., 2012). The above conclusions were reached, and the time factor was not fully considered as only one period of data is available (Liu et al., 2021; Li B. et al., 2022). Further research is needed to assess whether the accumulation of heavy metals in the soil changes in time and how to affect the soil ecosystem function of the terrace.
Data availability statement
The original contributions presented in the study are included in the article/supplementary material, further inquiries can be directed to the corresponding author.
Author contributions
YT: Conceptualization, Data curation, Formal Analysis, Investigation, Methodology, Software, Writing–original draft, Writing–review and editing. DZ: Conceptualization, Data curation, Formal Analysis, Funding acquisition, Investigation, Methodology, Project administration, Validation, Writing–original draft, Writing–review and editing. HX: Conceptualization, Data curation, Formal Analysis, Funding acquisition, Investigation, Methodology, Project administration, Validation, Writing–original draft, Writing–review and editing. LD: Formal Analysis, Investigation, Resources, Software, Validation, Writing–review and editing. QX: Methodology, Resources, Software, Writing–review and editing. ZZ: Methodology, Resources, Software, Writing–review and editing. XJ: Data curation, Formal Analysis, Investigation, Supervision, Writing–review and editing.
Funding
The author(s) declare financial support was received for the research, authorship, and/or publication of this article. This research was funded by the Survey of Land Quality in Western Hunan of China Geological Survey Geochemical (No. ZD20220214), the Science and Technology Innovation Fund of Command Center of Integrated Natural Resources Survey Center (No. KC20220013), the Comprehensive investigation on ecological restoration in the Huaihua Shaoyang area of southwestern Hunan (No. DD20230480), the Sichuan College of Architectural Technology Innovation Team (No. SCJYKYCXTD 2023), and the National Key Research and Development Program of China (No. 2022YFB3902000, No. 2022YFB3902001).
Acknowledgments
We would like to thank the editors and reviewers for their valuable opinions and suggestions that improved this research.
Conflict of interest
The authors declare that the research was conducted in the absence of any commercial or financial relationships that could be construed as a potential conflict of interest.
Publisher’s note
All claims expressed in this article are solely those of the authors and do not necessarily represent those of their affiliated organizations, or those of the publisher, the editors and the reviewers. Any product that may be evaluated in this article, or claim that may be made by its manufacturer, is not guaranteed or endorsed by the publisher.
Abbreviations
OHS, Orbita Hyper Spectral; FLAASH, Fast Line-of-sight Atmospheric Analysis of Spectral Hypercubes; DEM, Digital Elevation Model; PLSR, Partial Least Squares Regression; NMI, Normalized Mutual Information; MI, Mutual Information; MIC, Maximal Information Coefficient; Pearson, Pearson Correlation Coefficient; STD, Standard Deviation; TB, Terabyte; STS, Source state, Transition state, and Stable state; UAV, Unmanned Aerial Vehicle.
References
Agyeman, P. C., Khosravi, V., Michael Kebonye, N., John, K., Borůvka, L., and Vašát, R. (2022). Using spectral indices and terrain attribute datasets and their combination in the prediction of cadmium content in agricultural soil. Comput. Electron. Agric. 198, 107077. doi:10.1016/j.compag.2022.107077
Banerjee, B. P., Raval, S., Zhai, H., and Cullen, P. J. (2017). Health condition assessment for vegetation exposed to heavy metal pollution through airborne hyperspectral data. Environ. Monit. Assess. 189, 604. doi:10.1007/s10661-017-6333-4
Ben Dor, E., Francos, N., Ogen, Y., and Banin, A. (2022). Aggregate size distribution of arid and semiarid laboratory soils (<2 mm) as predicted by VIS-NIR-SWIR spectroscopy. Geoderma 416, 115819. doi:10.1016/j.geoderma.2022.115819
Ben-Dor, E., Levin, N., Singer, A., Karnieli, A., Braun, O., and Kidron, G. J. (2006). Quantitative mapping of the soil rubification process on sand dunes using an airborne hyperspectral sensor. Geoderma 131, 1–21. doi:10.1016/j.geoderma.2005.02.011
Bian, Z., Sun, L., Tian, K., Liu, B., Zhang, X., Mao, Z., et al. (2021). Estimation of heavy metals in tailings and soils using hyperspectral technology: a case study in a tin-polymetallic mining area. Bull. Environ. Contam. Toxicol. 107, 1022–1031. doi:10.1007/s00128-021-03311-7
Bouzidi, W., Mezned, N., and Abdeljaoued, S. (2022). Mineralogical mapping using EO-1 Hyperion data for iron mine identification. J. Appl. Rem. Sens. 16. doi:10.1117/1.JRS.16.024514
Brossard, M., Marion, R., and Carrére, V. (2016). Deconvolution of SWIR reflectance spectra for automatic mineral identification in hyperspectral imaging. Remote Sens. Lett. 7, 581–590. doi:10.1080/2150704X.2016.1168946
Cai, Z., Lei, S., Zhao, Y., Gong, C., Wang, W., and Du, C. (2022). Spatial distribution and migration characteristics of heavy metals in grassland open-pit coal mine dump soil interface. IJERPH 19, 4441. doi:10.3390/ijerph19084441
Chen, H. W., Chen, C.-Y., Nguyen, K. L. P., Chen, B.-J., and Tsai, C.-H. (2022). Hyperspectral sensing of heavy metals in soil by integrating AI and UAV technology. Environ. Monit. Assess. 194, 518. doi:10.1007/s10661-022-10125-5
Chen, X., Lee, H., and Lee, M. (2019). Feasibility of using hyperspectral remote sensing for environmental heavy metal monitoring. Int. Arch. Photogramm. Remote Sens. Spat. Inf. Sci. XLII-3/W7, 1–4. doi:10.5194/isprs-archives-XLII-3-W7-1-2019
Chen, X., Yang, Y., Zhang, D., Li, X., Gao, Y., Zhang, L., et al. (2023). Response mechanism of leaf area index and main nutrient content in mangrove supported by hyperspectral data. Forests 14, 754. doi:10.3390/f14040754
Chen, Y., Liu, Y., Liu, Y., Lin, A., Kong, X., Liu, D., et al. (2012). Mapping of Cu and Pb contaminations in soil using combined geochemistry, topography, and remote sensing: a case study in the le’an river floodplain, China. IJERPH 9, 1874–1886. doi:10.3390/ijerph9051874
Demattê, J. A. M., Alves, M. R., Gallo, B. C., Fongaro, C. T., Souza, A. B. e., Romero, D. J., et al. (2015). Hyperspectral remote sensing as an alternative to estimate soil attributes. Rev. CIÊNCIA AGRONÔMICA 46. doi:10.5935/1806-6690.20150001
Dkhala, B., Mezned, N., Gomez, C., and Abdeljaouad, S. (2020). Hyperspectral field spectroscopy and SENTINEL-2 Multispectral data for minerals with high pollution potential content estimation and mapping. Sci. Total Environ. 740, 140160. doi:10.1016/j.scitotenv.2020.140160
Giniyatullin, K. G., Sahabiev, I. A., Smirnova, E. V., Urazmetov, I. A., Okunev, R. V., and Gordeeva, K. A. (2022). Digital mapping of indicators that determine the sorption properties of soils in relation to pollutants, according to remote sensing data of the Earth using machine learning. Georesursy 24, 84–92. doi:10.18599/grs.2022.1.8
Guo, F., Xu, Z., Ma, H., Liu, X., Tang, S., Yang, Z., et al. (2021). Estimating chromium concentration in arable soil based on the optimal principal components by hyperspectral data. Ecol. Indic. 133, 108400. doi:10.1016/j.ecolind.2021.108400
Han, A., Lu, X., Qing, S., Bao, Y., Bao, Y., Ma, Q., et al. (2021). Rapid determination of low heavy metal concentrations in grassland soils around mining using vis–NIR spectroscopy: a case study of inner Mongolia, China. Sensors 21, 3220. doi:10.3390/s21093220
Han, B., Yun, Y., Cui, Q., Peng, J., and Wang, L. (2022). Retrieval of heavy metal content in soil using GF-5 satellite images based on GA-XGBoost model. Laser optoelectron. Prog. 59, 1230001. doi:10.3788/LOP202259.1230001
Han L, L., Chang, S., Chen, R., Liu, Z., Zhao, Y., Li, R., et al. (2022). Monitoring soil mercury content based on hyperspectral data and machine learning methods. J. Appl. Rem. Sens. 16. doi:10.1117/1.JRS.16.024518
Harmel, T., Gilerson, A., Tonizzo, A., Chowdhary, J., Weidemann, A., Arnone, R., et al. (2012). Polarization impacts on the water-leaving radiance retrieval from above-water radiometric measurements. Appl. Opt. 51, 8324–8340. doi:10.1364/AO.51.008324
Hou, L., Li, X., and Li, F. (2019). Hyperspectral-based inversion of heavy metal content in the soil of coal mining areas. J. Environ. Qual. 48, 57–63. doi:10.2134/jeq2018.04.0130
Huang, J., Zhang, Q., and Guo, Y. (2022). “Effect of remote sensing image pixel decomposition on the spectral response of soil heavy metals,” in International conference on cognitive based information processing and applications (CIPA 2021) lecture notes on data engineering and communications technologies. Editors B. J. Jansen, H. Liang, and J. Ye (Singapore: Springer Singapore), 182–193. doi:10.1007/978-981-16-5854-9_23
Jiji, G. W. (2021). A study on the analysis of heavy metal concentration using spectral mixture modelling approach and regression in Tirupur, India. Earth Sci. Inf. 14, 2077–2086. doi:10.1007/s12145-021-00678-3
Li, B., Li, C., Dong, C., Li, P., Ma, J., and Ye, D. (2022a). Mechanism of lead pollution detection in soil using terahertz spectrum. Int. J. Environ. Sci. Technol. 19, 7243–7250. doi:10.1007/s13762-021-03588-5
Li, N., Dong, X., Gan, F., and Zou, Z. (2021). “Extraction of soil mineral information based on hyperspectral image,” in Aopc 2021: optical spectroscopy and imaging. Editors H. Zhao, J. Liu, L. Xu, and Y. Wang (Beijing, China: SPIE). doi:10.1117/12.2601998
Li, Y., Yang, K., Wu, B., Wang, S., Hou, Z., and Ding, X. (2022b). Identification of soil heavy metal pollution by constructing 2D plane using hyperspectral index. Spectrochimica Acta Part A Mol. Biomol. Spectrosc. 278, 121318. doi:10.1016/j.saa.2022.121318
Lin, N., Jiang, R., Li, G., Yang, Q., Li, D., and Yang, X. (2022). Estimating the heavy metal contents in farmland soil from hyperspectral images based on Stacked AdaBoost ensemble learning. Ecol. Indic. 143, 109330. doi:10.1016/j.ecolind.2022.109330
Liu, K., Zhao, D., Fang, J., Zhang, X., Zhang, Q., and Li, X. (2017). Estimation of heavy-metal contamination in soil using remote sensing spectroscopy and a statistical approach. J. Indian Soc. Remote Sens. 45, 805–813. doi:10.1007/s12524-016-0648-4
Liu, W., Yu, Q., Niu, T., Yang, L., and Liu, H. (2021). Inversion of soil heavy metal content based on spectral characteristics of peach trees. Forests 12, 1208. doi:10.3390/f12091208
Lu, Q., Wang, S., Bai, X., Liu, F., Wang, M., Wang, J., et al. (2019). Rapid inversion of heavy metal concentration in karst grain producing areas based on hyperspectral bands associated with soil components. Microchem. J. 148, 404–411. doi:10.1016/j.microc.2019.05.031
Mendes, W. de S., Demattê, J. A. M., Minasny, B., Silvero, N. E. Q., Bonfatti, B. R., Safanelli, J. L., et al. (2022). Free iron oxide content in tropical soils predicted by integrative digital mapping. Soil Tillage Res. 219, 105346. doi:10.1016/j.still.2022.105346
Meng, X., Bao, Y., Ye, Q., Liu, H., Zhang, X., Tang, H., et al. (2021). Soil organic matter prediction model with satellite hyperspectral image based on optimized denoising method. Remote Sens. 13, 2273. doi:10.3390/rs13122273
Mezned, N., Alayet, F., Dkhala, B., and Abdeljaouad, S. (2022). Field hyperspectral data and OLI8 multispectral imagery for heavy metal content prediction and mapping around an abandoned Pb–Zn mining site in northern Tunisia. Heliyon 8, e09712. doi:10.1016/j.heliyon.2022.e09712
Ou, D., Tan, K., Lai, J., Jia, X., Wang, X., Chen, Y., et al. (2021). Semi-supervised DNN regression on airborne hyperspectral imagery for improved spatial soil properties prediction. Geoderma 385, 114875. doi:10.1016/j.geoderma.2020.114875
Poppiel, R. R., Lacerda, M. P. C., Rizzo, R., Safanelli, J. L., Bonfatti, B. R., Silvero, N. E. Q., et al. (2020). Soil color and mineralogy mapping using proximal and remote sensing in midwest Brazil. Remote Sens. 12, 1197. doi:10.3390/rs12071197
Saidi, S., Ayoubi, S., Shirvani, M., Azizi, K., and Zeraatpisheh, M. (2022). Comparison of different machine learning methods for predicting cation exchange capacity using environmental and remote sensing data. Sensors 22, 6890. doi:10.3390/s22186890
Shi, T., Guo, L., Chen, Y., Wang, W., Shi, Z., Li, Q., et al. (2018). Proximal and remote sensing techniques for mapping of soil contamination with heavy metals. Appl. Spectrosc. Rev. 53, 783–805. doi:10.1080/05704928.2018.1442346
Shin, H., Yu, J., Wang, L., Jeong, Y., and Kim, J. (2020). Spectral interference of heavy metal contamination on spectral signals of moisture content for heavy metal contaminated soils. IEEE Trans. Geosci. Remote Sens. 58, 2266–2275. doi:10.1109/TGRS.2019.2946297
Taghizadeh-Mehrjardi, R., Fathizad, H., Ali Hakimzadeh Ardakani, M., Sodaiezadeh, H., Kerry, R., Heung, B., et al. (2021). Spatio-temporal analysis of heavy metals in arid soils at the catchment scale using digital soil assessment and a random forest model. Remote Sens. 13, 1698. doi:10.3390/rs13091698
Tan, K., Ma, W., Chen, L., Wang, H., Du, Q., Du, P., et al. (2021). Estimating the distribution trend of soil heavy metals in mining area from HyMap airborne hyperspectral imagery based on ensemble learning. J. Hazard. Mater. 401, 123288. doi:10.1016/j.jhazmat.2020.123288
Tong, X., Xie, H., Qiu, Y., Zhang, H., Song, L., Zhang, Y., et al. (2010). Quantitative monitoring of inland water using remote sensing of the upper reaches of the Huangpu River, China. Int. J. Remote Sens. 31, 2471–2492. doi:10.1080/01431160902994440
Wan, Y., Fan, Y., and Jin, M. (2021). Application of hyperspectral remote sensing for supplementary investigation of polymetallic deposits in Huaniushan ore region, northwestern China. Sci. Rep. 11, 440. doi:10.1038/s41598-020-79864-0
Wang, F., Gao, J., and Zha, Y. (2018). Hyperspectral sensing of heavy metals in soil and vegetation: feasibility and challenges. ISPRS J. Photogrammetry Remote Sens. 136, 73–84. doi:10.1016/j.isprsjprs.2017.12.003
Wang, S., Zhang, C., Zhan, Y., Zhang, Y., Lou, T., and Xue, F. (2020). Evaluation of ecological risk of heavy metals in watershed soils in the Daxia River Basin. AIP Adv. 10, 055109. doi:10.1063/5.0004869
Wang, X., Gong, C., Ji, T., Hu, Y., and Li, L. (2021). Inland water quality parameters retrieval based on the VIP-SPCA by hyperspectral remote sensing. J. Appl. Remote Sens. 15, 042609. doi:10.1117/1.JRS.15.042609
Wang, Y., Zhang, X., Sun, W., Wang, J., Ding, S., and Liu, S. (2022). Effects of hyperspectral data with different spectral resolutions on the estimation of soil heavy metal content: from ground-based and airborne data to satellite-simulated data. Sci. Total Environ. 838, 156129. doi:10.1016/j.scitotenv.2022.156129
Xu, S., Zhao, Y., Wang, M., and Shi, X. (2022). A comparison of machine learning algorithms for mapping soil iron parameters indicative of pedogenic processes by hyperspectral imaging of intact soil profiles. Eur. J Soil Sci. 73. doi:10.1111/ejss.13204
Xue, Y., Zou, B., Wen, Y., Tu, Y., and Xiong, L. (2020). Hyperspectral inversion of chromium content in soil using support vector machine combined with lab and field spectra. Sustainability 12, 4441. doi:10.3390/su12114441
Zhang, B., Guo, B., Zou, B., Wei, W., Lei, Y., and Li, T. (2022a). Retrieving soil heavy metals concentrations based on GaoFen-5 hyperspectral satellite image at an opencast coal mine, Inner Mongolia, China. Environ. Pollut. 300, 118981. doi:10.1016/j.envpol.2022.118981
Zhang, D., Zhang, L., Sun, X., Gao, Y., Lan, Z., Wang, Y., et al. (2022b). A new method for calculating water quality parameters by integrating space-ground hyperspectral data and spectral-in situ assay data. Remote Sens. 14, 3652. doi:10.3390/rs14153652
Zhang, D., Zhu, Z., Zhang, L., Sun, X., Zhang, Z., Zhang, W., et al. (2023). Response of industrial warm drainage to tide revealed by airborne and sea surface observations. Remote Sens. 15, 205. doi:10.3390/rs15010205
Zhao, H., Gan, S., Yuan, X., Hu, L., Wang, J., and Liu, S. (2022). Application of a fractional order differential to the hyperspectral inversion of soil iron oxide. Agriculture 12, 1163. doi:10.3390/agriculture12081163
Zhou, M., Zou, B., Tu, Y., Feng, H., He, C., Ma, X., et al. (2022). Spectral response feature bands extracted from near standard soil samples for estimating soil Pb in a mining area. Geocarto Int. 37, 13248–13267. doi:10.1080/10106049.2022.2076921
Keywords: heavy metals in soil, hyperspectral remote sensing, landform, terraces, element enrichment
Citation: Tang Y, Zhang D, Xu H, Dai L, Xu Q, Zhang Z and Jing X (2024) The role of topography feedbacks in enrichment of heavy metal elements in terrace type region. Front. Environ. Sci. 12:1291917. doi: 10.3389/fenvs.2024.1291917
Received: 10 September 2023; Accepted: 26 March 2024;
Published: 10 April 2024.
Edited by:
Qi Liao, Central South University, ChinaReviewed by:
Mohammadhassan Salehi, Shahrekord University, IranSandhya Patidar, Heriot-Watt University, United Kingdom
Copyright © 2024 Tang, Zhang, Xu, Dai, Xu, Zhang and Jing. This is an open-access article distributed under the terms of the Creative Commons Attribution License (CC BY). The use, distribution or reproduction in other forums is permitted, provided the original author(s) and the copyright owner(s) are credited and that the original publication in this journal is cited, in accordance with accepted academic practice. No use, distribution or reproduction is permitted which does not comply with these terms.
*Correspondence: Donghui Zhang, zhangdonghui@alu.cdut.edu.cn