Flood vulnerability assessment in the flood prone area of Khyber Pakhtunkhwa, Pakistan
 Muhammad Ibrahim
 Aidi Huo
 Waheed Ullah
 Safi Ullah
 Adnan Ahmad1
 - 1School of Water and Environment, Chang’an University, Xi’an, Shaanxi, China
- 2Xi’an Monitoring, Modelling and Early Warning of Watershed Spatial Hydrology International Science and Technology Cooperation Base, Chang’an University, Xi’an, Shaanxi, China
- 3Key Laboratory of Subsurface Hydrology and Ecological Effects in Arid Region, Ministry of Education, Chang’an University, Xi’an, China
- 4Defense and Security, Rabdan Academy, Abu Dhabi, United Arab Emirates
- 5Department of Atmospheric and Oceanic Sciences, Fudan University, Shanghai, China
Floods are among the most destructive natural disasters, causing extensive damage to human lives, property, and the environment. Pakistan is susceptible to natural calamities, such as floods, resulting in millions of people being impacted yearly. It has been demonstrated that flood severity is rising and may continue to escalate in the coming years because of climate change-induced changes in monsoon precipitation in the country. Given the country’s exposure to flooding, it is essential to assess the vulnerability to floods to prepare for and mitigate their impact in Pakistan. This study provides a new conceptual framework for assessing flood risk and vulnerability in Charsadda, a flood-prone district in Pakistan. It evaluates the vulnerability of settlements to floods based on four indicators: population density, the average gross domestic product (GDP) of land, the distance between settlements and rivers, and land use and cover (LULC). The analytical hierarchy process (AHP) technique was integrated with the geographical information system (GIS) to assess the level of vulnerability to floods in the study area. The results reveal a higher degree of vulnerability to floods in the region. The spatial pattern of vulnerable areas reveals a significant connection between high-risk flood areas and densely populated areas during different flood seasons. The results further reveal that more than 60% of the area is arable land and is highly susceptible to flood. The population and their land-use setup show high and extremely high values of vulnerability in the normalized threshold of 0.3–0.4, respectively. The study provides an in-depth and comprehensive analysis of the chosen indicators, evaluation methods, and results, making this a valuable contribution to the field of flood vulnerability assessment. The findings of this study also include thematic maps and related information to the stakeholders for effective vulnerability management in the study area.
1 Introduction
Floods are frequent hydrometeorological disasters that can lead to extensive fatalities, socioeconomic losses, and environmental degradation (Koko et al., 2021; Zhang et al., 2023). The increasing occurrence of flood events underscores its importance in identifying flood-prone locations, which has emerged as a paramount concern (Chakrabortty, et al., 2018; Yu et al., 2023). Flooding can happen when rivers overflow their banks due to severe rain (Asri et al., 2009; Khan et al., 2016). The technique of flood-susceptibility mapping is of the utmost significance in effectively minimizing the major consequences associated with flood-related hazards. However, it is vital to develop/formulate precise models for assessing flood susceptibility, which can offer useful insights to enhance the effectiveness of flood management techniques (Ruidas et al., 2022a). Rossi and Villani (1994) defined floods as “a large amount of water from a river flowing at an unusually higher rate, resulting in the flooding of low-lying areas.” Kafle and Murshed (2006) stated that “floods are a more frequent source of catastrophic events than other types of disasters.” Recent decades have seen frequent and severe flooding (Wang et al., 2022). Between 1990 and 2020, there has been a notable rise in natural disasters, with flooding being the most frequent phenomenon (Abbas et al., 2023a; Rahman et al., 2023). The scientific community has warned that the increasing risk of climate change coupled with deforestation and low coping capacity would double the risk of global flooding (Ullah et al., 2020; Ullah et al., 2023) and increase the number of areas susceptible to flooding by 2050 (UNESCO, 2009). In the modern-day context, the demand for sustainable catastrophe management has emerged, and professionals across several disciplines, including researchers, geographers, climatologists, and regional planners, are actively involved in global projects aimed at regulating and mitigating the effects of disasters (Roy et al., 2020).
Pakistan is situated in a region that is highly vulnerable to natural and anthropogenic disasters, including floods (Rana and Routray, 2018; Khan et al., 2022a; Abbas et al., 2023a). Over the last few decades, 124 districts of the country have experienced a natural disaster of some kind, which has impacted more than 33 million people in total. The country’s lowlands are an integral part of the Indus River system (Abbas et al., 2023b; Hussain et al., 2023), which is a highly flood-prone area and has already been impacted by flooding (Rafiq and Blaschke, 2012; Abbas et al., 2022). A devastating flood struck the country after the intense and prolonged monsoon rains in 2010, leaving one-fifth of the area inundated with water (Shah et al., 2018; Ullah et al., 2018; Ullah et al., 2021). The recurrent floods indicate that the community, local government, and related institutions are not sufficiently prepared or equipped to handle the situation and that reforms must be implemented to ensure proper steps are taken to prevent them (Ross and Cross, 2010).
Khyber Pakhtunkhwa is one the major provinces of Pakistan that has seen several catastrophic floods in recent times, particularly in 2007, 2008, 2010, and 2012 (Shah et al., 2020). The province serves as a critical riverine flood route due to its hazard-prone rivers (i.e., River Swat and River Kabul) and tributaries (Khan et al., 2020; Mogebisa, 2021; Rebi et al., 2023). The Swat and Kabul Rivers and their tributaries frequently cause flooding in the district of Charsadda, one of the highly flood-prone districts in Pakistan, which results in significant human casualties, destruction of property and crops, disruption of daily life, and environmental degradation (Chitrali, 2010). In 2010, the Munda Headwork, a structure built by the British during their government in 1920, was seriously damaged due to flooding that affected a vast channel system, which supplied water to the plenty of agricultural land of Charsadda (Farooq et al., 2019). The settlements and population residing on the eastern side of Munda Headwork and the lower channel system originating from the Swat River saw severe consequences due to the devastating floods in 2010. This event led to a substantial loss of life, with hundreds of fatalities, and caused the displacement of a considerable portion of the affected population. Villagers who lived near the floodplain endured tremendous destruction, forcing most survivors to evacuate to nearby safe areas and take refuge in government schools and private facilities (Rahman et al., 2019).
This study aims to construct a flood risk index system, find the best indicators for assessing flood vulnerability, and evaluate the risk of flooding in Mirzadhare, Charsadda district, Khyber Pakhtunkhwa, Pakistan. The study presents an innovative approach for assessing the vulnerability of settlements to floods by utilising four indicators: population density, average land gross domestic product (GDP), settlement distance to the river, and land use and cover (LULC). The progressiveness of these indicators is highlighted in the discussion, as they account for physical and socioeconomic aspects that can influence vulnerability. Ruidas et al. (2022b) assessed flood vulnerability in the Goghat-I and II blocks of West Bengal—India, using a range of methodologies, such as multi-criteria decision analysis (MCDA), analytical hierarchy process (AHP), fuzzy logic, and an ensemRuidasble technique, all implemented within a geographic information system (GIS) framework. The AHP analysis is instrumental in establishing a hierarchical structure of the selected indicators, while the GIS-constructed maps visually represent the vulnerability of the target region, highlighting the most and least vulnerable areas (Das and Pal, 2020a). It has been widely employed across many disciplines such as economics, transportation, urban planning, resource allocation, and more recently, in the domain of flood risk management for decision-making purposes (Saaty, 1980). One advantage of employing the AHP is its ability to facilitate the participation of decision-makers or experts in expressing their viewpoints (Saaty, 1990; Das and Pal, 2020a). Additionally, AHP incorporates GIS techniques to enhance the decision-making process (Das and Pal, 2020b). AHP helps in the organization of criteria and sub-criteria, contributing to a structured evaluation framework (Das and Pal, 2020b). Lastly, AHP promotes consistency in judgment among decision-makers or experts (Chakrabortty et al., 2018). The AHP consists of three distinct stages. The initial stage involves the division of the overall objective into a hierarchical structure made up of interconnected categories. Subsequently, in the second stage, the criteria associated with each category are compared in pairs, leading to the creation of a comparison matrix. Finally, the individual assessments are aggregated to ascertain the relative weights of the criteria. The allocation of weights is a crucial component of the risk decision-making process (Boroushaki and Malczewski, 2010). Weights are utilized to assign significance or favor to particular criteria, however typically grounded in subjective judgment (Ullah and Zhang, 2020).
To evaluate the vulnerability of settlements to flooding, two methods were chosen: AHP analysis and the development of vulnerability maps through ArcGIS. The AHP analysis is instrumental in establishing a hierarchical structure of the selected indicators, while the GIS-constructed maps visually represent the vulnerability of the target region, highlighting the most and least vulnerable areas. The article provides an in-depth and comprehensive analysis of the chosen indicators, evaluation methods, and results, making this a valuable contribution to the field of flood vulnerability assessment. The key objective of the study is to map out flood susceptibility in the selected area, considering settlement zones, exposed infrastructure, and agricultural setups. The findings of this study can play a key role in highlighting susceptible hotspots, particularly during the monsoon season, with a potential risk of heavy flooding, resulting in substantial losses to both property and individuals. The findings of the study can help develop effective mitigation and control methods for monsoon rainfall-induced floods in the study area.
2 Study area
According to the district census report by the Government of Pakistan (GOP) (1998), Mirzadhare is a union council (UC) in the Charsadda district of Khyber Pakhtunkhwa, Pakistan. The district is composed of three tehsils: Charsadda, Tangi, and Shabqadar, and is bordered by Mohmand Agency, Malakand, Nowshehra, and Mardan to the West, North, South, and East, respectively. Mirzadhare is located between 34°15′21 North latitudes and 71°39′22 East longitudes, with a mean altitude of 1,040 feet (316 m). According to Hamidi et al. (2022), the total population of UC Mirzadhare in 2017 was 27,058. The soil in the district is particularly suitable for cultivating crops that require large amounts of water, such as wheat, maize, rice, tobacco, sugarcane, vegetables, and orchards of various fruits, including mangoes, grapes, peaches, apricots, and cherry plums. In Mirzadhare, all four seasons are experienced throughout the year, with winter beginning in mid-November and extending to March and summer starting in mid-May and ending in September. The mean maximum temperature in the summer is 40°C and the minimum is 25°C (Razi et al., 2014; Ullah et al., 2019; Hussain et al., 2023b). Additionally, the minimum temperature typically recorded during the winter is 4°C and the maximum is 18°C (GOP, 1998). The annual precipitation in Mirzadhare is approximately 1,590 mm. The study region receives heavy rainfall in the summer monsoon season that lasts from the end of June to the end of September.
Mirzadhare is located beside the Swat River’s flood-prone banks. Residents and their property are highly vulnerable. The region’s agricultural resources are heavily reliant on, thus exposing it to the potential damage posed by floods. Assessing the vulnerability to flood risk is essential because this could result in efficient mitigation, preparedness, and reaction to the flood hazard (Chitrali, 2010). Recent research studies investigated the consequences of floods, uncovering that unexpected land-use practices and river management techniques can result in a decline in the maintenance of natural water resources. Consequently, this phenomenon leads to an increase in both the magnitude and frequency of flooding incidents (Wooldridge et al., 2001). The risk posed by flood in the region escalates due to the intensified unplanned development and financial standing of those living in flood-impacted areas (Merz et al., 2013). Furthermore, the boundaries of the study area and village distributions are shown in Figure 1.
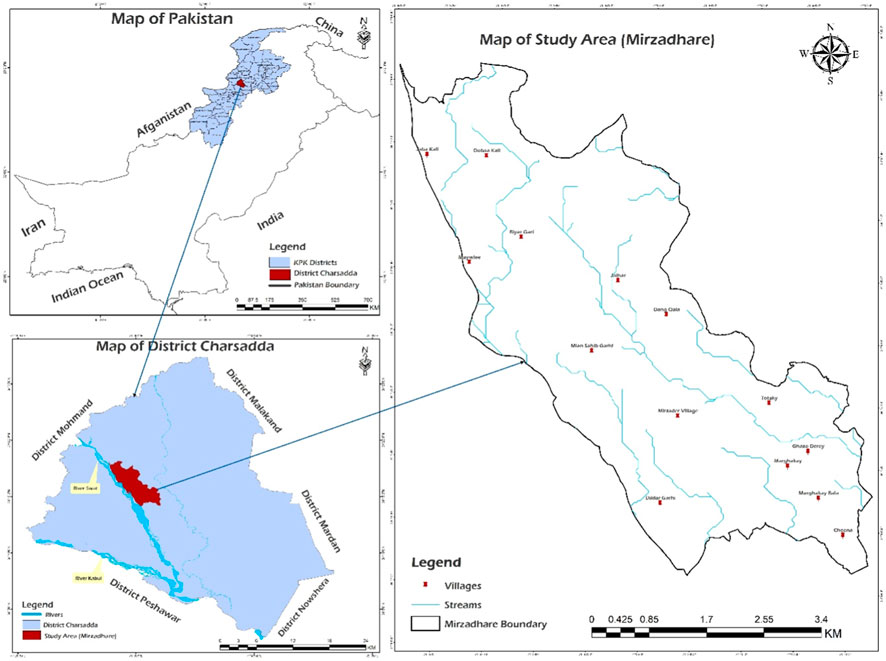
FIGURE 1. Location map of the study area.
3 Methods and materials
3.1 Vulnerability assessment
To evaluate the development of acceptable risk management plans at the grassroots level, covering physical, social, environmental, and economic factors, the vulnerability assessment recommends evaluating risks and threats at a community level (Hendricks et al., 2018). Flood vulnerability measures the level of proneness of any area, infrastructure, or ecosystem to flooding. It considers geography, land use, infrastructural resilience, and community preparation (Vignesh et al., 2021). Flood vulnerability must be understood for risk assessment, mitigation planning, and resilient methods to reduce flood damage to natural and built environments (Wang et al., 2022). Vulnerability is an essential concept in the human environment; its conceptualisation has been interpreted in many ways based on several indicators (Huo et al., 2020). Before assessing the vulnerability, some basic concepts need to be understood like risk, hazard, and exposure (Vignesh et al., 2021). Risk refers to the possibility of experiencing injury or incurring losses as a result of a specific event or activity, which is determined by the combination of the likelihood of its occurrence and the potential repercussions that may arise (Van Westen et al., 2009; Tayyab et al., 2021). A hazard refers to a source or circumstance that possesses the capacity to inflict harm, commonly linked to occurrences of either natural or human-induced origin, such as seismic activities, inundations, or incidents involving the release of hazardous substances (Chen et al., 2001; Wang et al., 2011). Exposure pertains to the extent to which individuals, resources, or systems are exposed to the potential consequences of a hazard, hence showing their level of sensitivity and susceptibility to harm (Yan and Xu, 2010; Shen et al., 2022). Furthermore, it assesses risk exposure and ongoing community monitoring (Fakhruddin et al., 2019). A community is typically defined in disaster risk assessment as a group of individuals inhabiting a particular geographical area, such as a household, a small town, or a neighbourhood in a city, and is usually impacted by its surroundings (Antronico et al., 2020). The responses of the community to any disaster might vary due to distinct variations in topography, coping capacity, knowledge, etc., which are influenced by the unique experiences they have had with different types of situations in their specific geographical locations (Huo and Li, 2013). The Asian Disaster Preparedness Center (ADPC) labels the risk assessment for any community as “the process of analysing the influential landscape, the degree of the detrimental effects of disasters on the community and their families over a prolonged duration.” They have further identified “the possibility of bearing the consequences of risk factors, like access to roads and bridges” (Van Westen et al., 2009). They categorise and outline the landscape of local risks regarding seasonal recurrence, location, the likelihood of initial warnings, and public awareness of the hazard (Huo et al., 2016). ADPC categorises and assesses the community’s susceptibility and level of resilience to emphasise vulnerable populations, such as women, men, children, aged people, and persons with disability (Zaman et al., 2020).
Vulnerability is an essential concept in the human environment; its conceptualisation has been interpreted in many ways based on several indicators (Huo et al., 2020). The word “vulnerability” has created essential links between different research communities, particularly disaster risk management (DRM) research (Birkmann, 2007; Burton et al., 2018) refer to vulnerability to only physical exposure, where vulnerability is described as a measure of the degree and type of exposure to the risk generated by different societies about hazards. Some studies found that vulnerability only refers to the susceptibility of a given system; the United Nations International Strategy for Disaster Reduction (UNISDR) views flood vulnerability as a human condition or process resulting from physical, social, economic, and environmental factors, which increase the susceptibility of a system to be damaged from the impact of a given hazard (UNISDR, 2004). Other authors, like Blaikie et al. (1994), relate the vulnerability of a system or a community only to its capacity to anticipate, cope with, resist, and recover from the impact of a hazard (Wisner et al., 2004). According to Pelling (2003), vulnerability “could potentially be damaging and destructive to avert prospective scenarios.” According to Uddin et al. (2019), the population’s sensitivity results from living in places that are vulnerable to natural disasters, while the Office of the United Nations Disaster Relief Co-Ordinator. (1982) defined vulnerability as “the identification of at-risk commodities, incidents of natural hazards of predetermined size.” Overpopulation and urbanisation widely affect the land use planning and pattern of the area, which bring dramatic changes in the climate and increase the area’s vulnerability level (Mu et al., 2021).
3.2 Analytical hierarchy process (AHP)
Saaty (1977) first developed AHP, a handy tool for prioritising and making decisions. It is a highly adaptable approach (Hussain et al., 2023). The AHP method has been extensively used in various fields, including economics, transport, planning, resource allocation, and, most recently, flood risk management when making decisions (Rahman et al., 2023). One of the benefits of utilising AHP is that it allows decision-makers or experts to share their opinion, integrates GIS, organises criteria and sub-criteria, and ensures uniformity in judgment (Ishizaka and Labib, 2009). The AHP process can be split down into three parts; the first step is dividing the goal into a hierarchy of related categories, the second step is comparing the criteria of each category in pairs to form a comparison matrix,
3.3 Vulnerability component of flood risk
According to Thieken et al. (2023), the probability that an unacceptably high water level would be reached constitutes flood risk. Flood risk is further defined by the Office of the Public Works and Local Government Dublin (UNESCO, 2009) as the sum of a flood-prone area’s hazard level, vulnerable circumstances, and exposure to that hazard. The following equation serves as an example of this concept.
This research attempts to integrate data about flooding dangers, exposure to a hazard incident, and vulnerability as per Eq. 1. The AHP technique is specifically tailored to evaluate the vulnerability aspect within the aforementioned equation. It leverages Analytic Hierarchy Process (AHP) to integrate the various components, and each component comprises several criteria, with each criterion encompassing multiple sub-criteria. First, the criteria of flood risk components are adopted from the study outline. Then, a hierarchy structure is used to evaluate flood vulnerability criteria are ranked based on the judgments of decision-makers through AHP pairwise comparisons (Kobayashi and Porter, 2012). The framework of the process is executed below (Figure 2).
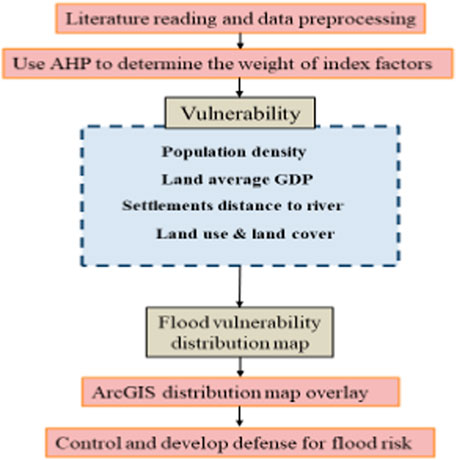
FIGURE 2. Technical framework for vulnerability assessment.
The selection of the above variables shown in Table 1 is based on their importance in the selected study area. As cited above, previous researchers also selected these variables to assess flood vulnerability. Each variable has its specific weightage for assessing flood vulnerability;
a. Distance to the river: Distance to the river is a central factor when assessing vulnerability to flood risk because it helps to determine how the people and their livelihoods are also exposed, how quickly floodwaters will reach a given area, and how much time is available for people living in the area to evacuate if necessary. Closer proximity to a river or other water source means a higher likelihood of flooding and vice versa, so it is essential to consider the distance to the river when assessing vulnerability.
b. Land use and land cover (LULC): LULC are also the main factors when assessing vulnerability to flood risk because they can affect the amount of water that can flow into an area. For example, if an area is covered in concrete or asphalt, there will be no or less infiltration and the water will not be able to absorb into the ground, which may lead to increased flooding and the area’s exposure level (Huo et al., 2019). On the other hand, if the land is covered in grass or vegetation, the infiltration rate will be high and the water will be more likely to absorb into the ground, reducing the risk of flood vulnerability.
c. Population Density: Population density is essential when assessing vulnerability to flood risk because higher population density means more people are exposed to flooding. This means that if flooding does occur, more people will feel the effects, which may lead to more destruction.
d. Land average gross domestic product (GDP): Land average GDP is also vital when assessing vulnerability to flood risk. Areas with higher average land GDP tend to have high exposure to flood and more resources available for flood prevention, such as better infrastructure and flood mitigation measures. This means that areas with higher average land GDP may have a lower risk of flooding and therefore, be less vulnerable to flood risk. Overall, distance to the river, land use and land cover, population density, and average land GDP are all essential factors to consider when assessing vulnerability to flood risk. These factors can help to determine how quickly floodwaters will reach a given area, how much water is available to absorb into the ground, how many people are exposed to the threat of flooding, and what resources are available for flood prevention. By considering all of these factors, we can better understand the potential flood risk and assess an area’s vulnerability.
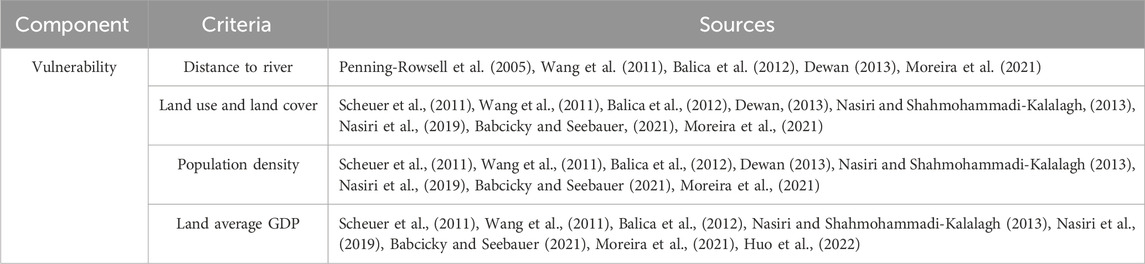
TABLE 1. Vulnerability indicators and reference sources.
3.4 Data collection and analysis
Both primary and secondary data were collected to fulfill the study’s objectives. Different methods and tools, including questionnaires, field observations, and focus group discussions, were used to conduct surveys among individuals from various professions, including farming, teaching, labor, commerce, and government and non-government authorities. Floods in the area were also found through field observation using the Garmin GPSMAP® 65s GPS and GIS tools. Additionally, photographs of land-use patterns and the extent of previous floods were taken using a camera. The quality of building materials and socioeconomic vulnerabilities, such as livable conditions, customs, house design, and local knowledge, were assessed during the field visit. A comprehensive and standardised questionnaire assessed the region’s potential for flooding and its susceptibility and capacity. To gather information on different variables related to the objectives, interviews were also conducted with local stakeholders, government and non-governmental organisations, such as the District Disaster Management Unit (DDMA), agricultural and livestock departments, educational departments and institutions, irrigation departments, construction and works departments, revenue departments, the office of the UC nazim, and commercial sectors. Additionally, a questionnaire was gathered from government and non-government employees of the Provincial Disaster Management Authority Khyber Pukhtunkhwa (PDMA-KP) to determine how they ranked various mitigation strategies and rated flood risk indicators in the study area.
Key informant interviews were conducted with the study area stakeholders and some officials of the PDMA-KP to determine the vulnerability to floods and capacity components. In the interviews, preset questions were posed. The data was collected in a notebook, and the records were retained for later manual reference. This assessed social, economic, and physical vulnerabilities and capacities. Half of the interviews were undertaken with local stakeholders engaged in diverse livelihoods, such as farming, business, and various other professions relevant to their means of sustenance and economic contributions. The remaining half of the interviews were conducted with departments from government and non-government organisations to assess the region’s capabilities and its exposure to the risk of flooding. Secondary data from various sources, including books, research reports, articles, and the relevant departments’ proceedings, were used to determine the area’s population. Information was gathered from the agriculture department to learn more about the farming methods used in the region. The rainfall and temperature data were obtained from the National Aeronautics and Space Administration (NASA) Earth Data and utilised to display how frequently floods occur. The district irrigation department provided information about the floods, including their history, frequency, and irrigation setup. The Geological Survey of Pakistan was consulted to get topographical information, such as contours, elevations, drainage maps, topographic sheets, and satellite pictures. We obtained population density, land usage, and physical layout data from the Local Government Office and the Revenue Department.
The AHP approach was utilized after the conclusion of the preparation of all thematic layers. To use the AHP to determine the weight of flood vulnerability indicators, first, we defined the criteria for the weighting. This included a list of all the required indicators of vulnerability and any other criteria that are important to consider (e.g., environmental impacts, economic impacts, etc.). After setting the criteria, the next step was to set up a pairwise comparison matrix, a table showing each criterion’s relative importance compared to the others. So weighting factor is selected from 1 to 9, as 1 presents an equal level of flood risk, while 3 shows a low level, 5 shows a result in the medium, 7 is a high level of flood risk, and 9 shows extremely high-level flood risk. Finally, the AHP assessments are integrated into a GIS environment using the weighted sum technique in ArcGIS software to create flood hazard and vulnerability maps.
A flood vulnerability map is generated based on flood hazard risk and exposure maps. For the analysis of primary data, descriptive and inferential statistics were used. MS Excel was used to analyse and calculate the data gathered from questionnaires. In addition, field observation and critical informant interview data were edited, summarised, and qualitatively narrated. While most of the qualitative data was presented in narrative style, the quantitative data was also presented in tables and graphs using Origin Pro software.
3.5 The normalisation of index factors
Flood vulnerability assessment is jointly determined by multiple indices with different dimensional units. To eliminate the influence of different dimensional units, each factor was normalised between [0, 1] as analysed by Wang et al. (2020) for studying the vegetation dynamics and their relationship with the climatic factors in the Qinling mountains of China. According to the different nature of indexes, they can be divided into positive and negative indexes (Qin et al., 2013).
A positive index means that the greater the value of the risk factor index.
A negative index means that the greater the value of the risk factor index
where,
This study assesses the vulnerability of the study area using four key variables: settlement’s distance to the river, population density, LULC practices, and regional average GDP. Proximity to rivers, verified through river network data and on-site surveys, indicates a higher risk for settlements near to river. Population density, tied to human settlements, plays a crucial role in determining flood risk and vulnerability, with higher-density areas facing increased potential for damage. Additionally, LULC practices are factored into flood risk assessment models for damage calculations which are discussed earlier in Section 3.3.
Additionally, other vulnerability factors must be evaluated to check and verify the main vulnerability index. This includes the type of crops grown in the region, disputes within the community, and causes of their vulnerability. This data was gathered by conducting interviews and surveys in the area and mapped distribution through ArcGIS in Figure 3.
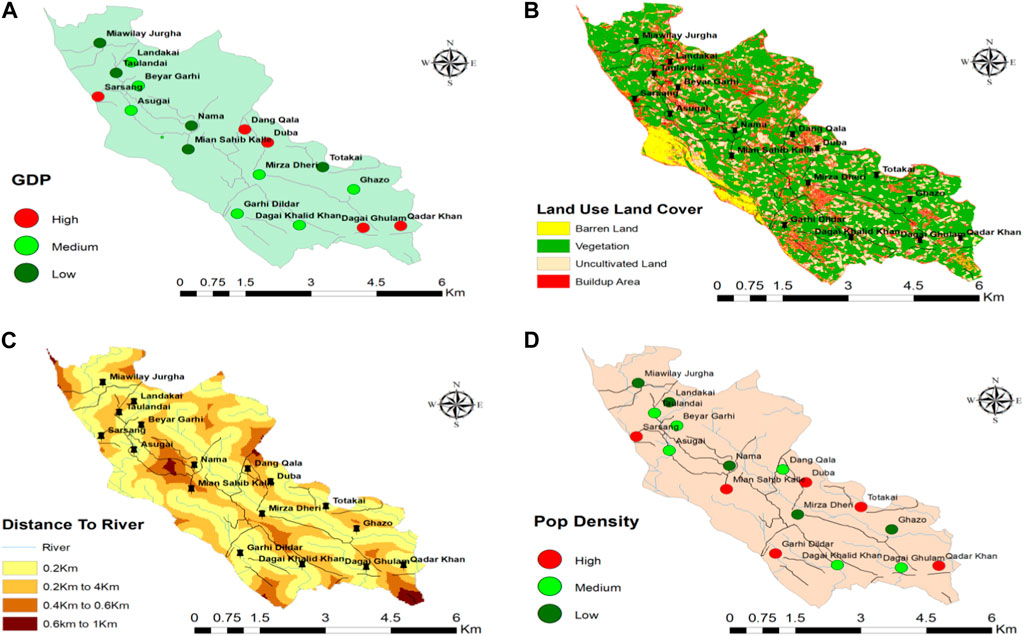
FIGURE 3. Distribution of flood vulnerability criteria where; (A) shows GDP, (B) shows Land use and Land cover, (C) shows Distance to river and (D) shows Population density.
For the AHP judgment, which is shown in Table 2 above, the appointments were taken from the staff of the PDMA-KP to discuss the criteria with them. Also, they were asked to rate the criteria and weigh the different indicators according to their experiences. The purpose of this meeting and interview was that they are the most relevant and working experts for flood risk and emergency management. The staff completed the pairwise comparison through the questionnaire based on the model shown in Figure 4. After completing the pairwise comparison judgement of the experts, each judgement was combined and allowed to specify a value for the final assessment result according to the geomatic means rules of Saaty (1990) as in the below equation;
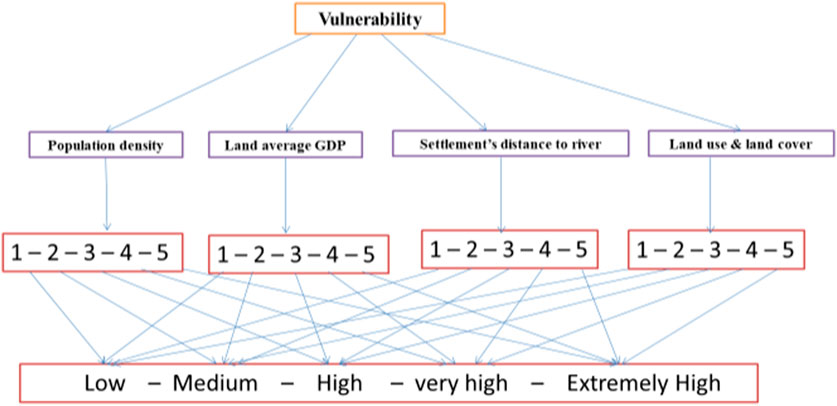
FIGURE 4. Decision hierarchy model for assessing the vulnerability of the area based on the model developed by Luu et al. (2018).
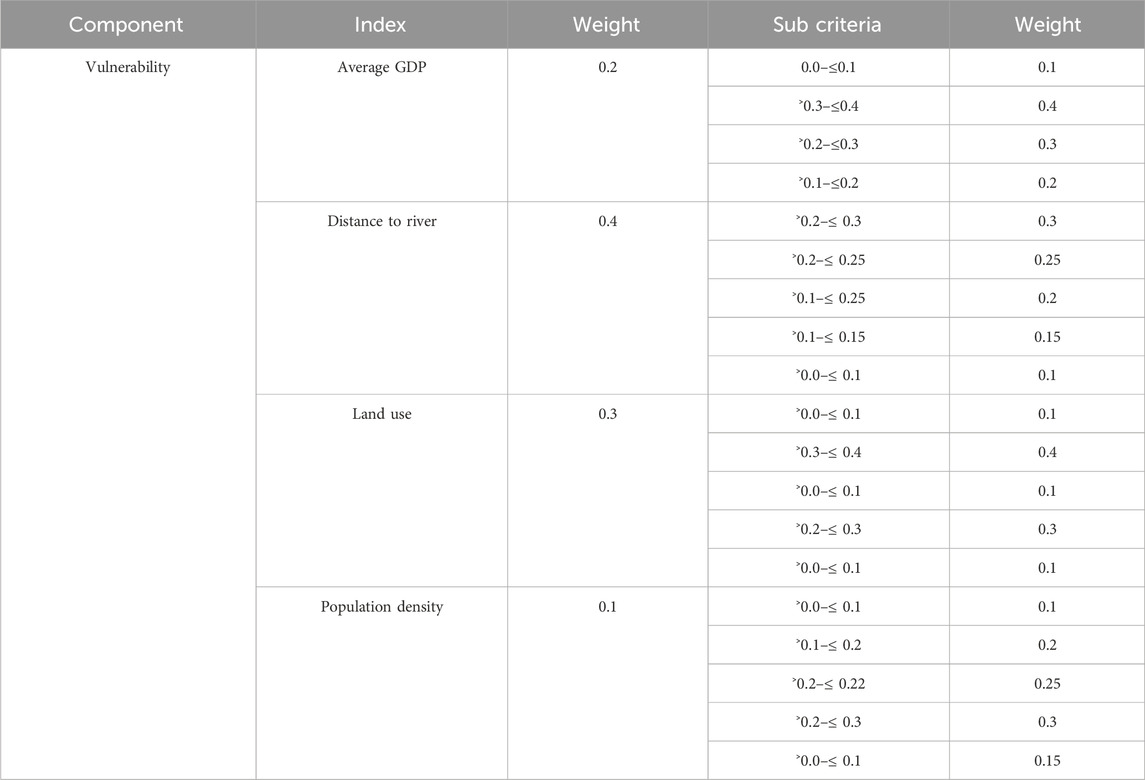
TABLE 2. Criteria of flood vulnerability assessment for the AHP pairwise comparison and weighting.
Where N is the number of decision-making experts and a1 12….aN 12 are the experts’ judgements. Through AHP, the weighted indicators of flood vulnerability are integrated into the GIS framework and developed flood vulnerability maps of the area.
4 Results
4.1 Spatial distribution of vulnerability
There are so many reasons for the area that make it vulnerable to flood, but the four important indicators selected in this study are encountered through AHP judgement, and a pairwise comparison was implemented to find the weight of each indicator, as shown in Figure 5. It shows the spatial pattern of vulnerability in the Mirzadher, through the integration of the variables, and the weight of the variable was normalised between 0 and 1. The weight for each indicator comes within the criteria of (0.0 to less than 0.2) are showing low risk; the values come in (0.2–0.3) are at a medium level, the values come in (0.3–0.4) are at a high level, and values fall in the criteria (0.4–0.5) is having their high level of vulnerability. As shown in Figure 5, the overall area is highly exposed and the vulnerability situation is high in the study area. Based on the history of the super floods in 2010, the two main village councils are more susceptible to flooding, which include the villages of Dang Qila, Sarasang, Jura, Mirzadhare, and Turlandi, as they are near the river and on the low-lying bank of the river. These villages are in the range of flood water and these villages have agricultural land with a high population density, which makes them highly susceptible to flood. Keeping in view the selected indicators, the analysis shows that when there is a flooding situation then the rate of vulnerability is high for the above-mentioned.
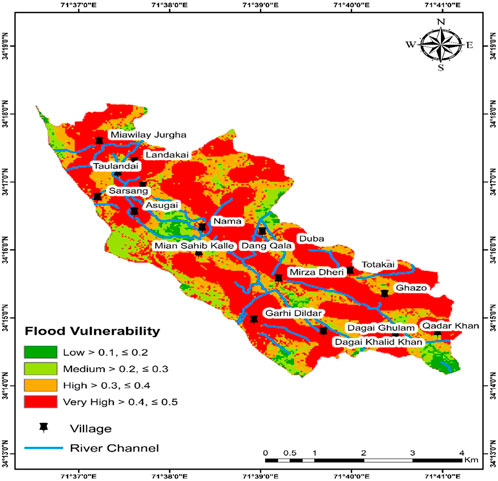
FIGURE 5. Vulnerability assessment of the study area.
As per the questionnaire outcome shown in Figure 5, the UC Mirzadhare has more inhabitants, so due to a higher population density, it is more vulnerable compared to other areas like Dagai, Qadar Khan Killy, Nama, and Landakay. During the interview, it was observed that most respondents agreed that the facilities and access to most of the livelihoods are also available in the study area; that’s why most people are interested in settling in the area near the market. So, overall these conditions lead the community towards high vulnerability due to the dense population. The field observation observed that most of the dwelling buildings and other setup was developed near the market, making the area more dense and populated. The decision-makers also analysed land use cover, but it was given a very high score based on the exposure level of settlements, LULC near the riverside keeps the area more susceptible. The leading indicator for weighting of the vulnerability is the distance of settlements and constructions to the river was also analysed and scored by the stakeholders of the relevant field. This indicator was highly rated as the experts agree that areas located in the proximity of the river are highly vulnerable compared to those at a high distance. As we have three village councils in Mirzadhare, the most susceptible and at a near distance are the village council Dang Qila villages and more vulnerable as well.
The results of the last indicator, i.e., the probabilistic degree of damage to buildings in the area, show that the likelihood of damage to housing is higher in the study area. The data collected through the questionnaire shows that most of the dwellings/buildings are made of very low-quality materials due to poverty alleviation in the studied community as the people cannot afford to use bricks and cement with steel, so they usually use stone with mud and building blocks, which are not floodproof and have a higher rate of damageability due to flood. During field visits, most of these buildings were found in the villages of Mian Sahib Killy, Mirzadhare, Dildar Gharhi, Sarasang, and Turlandi. On the contrary, the villages of Totaky, Duaba, Ghazo, and Dang Qila are located at a long distance from the river, with some elevation and cemented houses, which make them a low to medium level of vulnerability to floods.
4.2 Driving mechanism of vulnerability
Vulnerability depends on various social, economic, physical, and environmental factors. The social factors of vulnerability include the way of life, connections, consciousness, community links, and interactions. The physical indicators of vulnerability include proximity to the river, and building styles exist. Economic factors of susceptibility are income sources, business, agriculture, and other resources for generating income. According to qualitative data gathered in the research area, 30% of the population is unaware of the flood prevention measures in the region. Some concurred that they lack awareness of vulnerability mitigation, which would allow them to minimise the damage and control flooding.
Over 40% of the population lives where floodwater can enter and destroy their buildings. During the field observation, it was discovered that most buildings are close to the river bank and located in the flood zone. Most of the agricultural land is in flood zones on the right bank of the river. They build up and expand their land toward the river bank out of a desire for more agro income and greed for expanding agricultural land. The local population was exposed and made their land vulnerable to flooding due to this approach. People expanded their land toward the river bank out of a desire for more income from agriculture. Due to this approach, the local population is now exposed and made their land vulnerable to flooding. They built their homes close to fields near the river for easy access, which puts them at risk of flooding. The community members agreed that they lack any training in flood mitigation and knowledge of flood response. The community relies mostly on outside assistance for all pre and post-emergency operations, which increases its vulnerability.
Additionally, there are hardly any conflicts inside the community, which encourages residents to assist one another in case of a flood disaster. The position of the homes along the riverbank and the materials used to construct the homes are non-engineered structures which are some primary causes of vulnerability that all contribute to a high level of susceptibility. Safety zones are distributed in low, medium, high, and very high susceptibility areas (Figure 5). Most of the settlements on the river bank on the map are highly susceptible. In contrast, according to the recent flood in 2022 and the super flood in 2010 spatial extent, the communities within 1 km are considered highly vulnerable, while those within 2 km are considered less vulnerable.
5 Discussion
This research aims to assess the vulnerability of Mirzadhare area by analysing data on four variables: settlements’ river distance, LULC, area average GDP, and population density. Chakrabortty et al. (2018), Moreira et al. (2021), Wang et al. (2022), Nasiri and Shahmohammadi-Kalalagh (2013), found a direct relationship between flood vulnerability and settlement distance to the river. Settlements near the river are more vulnerable to flooding and will be negatively affected. The study results also show that villages and settlements within 1 km from the river are highly vulnerable in Mirzadhare. There is a lack of understanding of the local community and they are going to construct their settlements near to river in floodplain and keep their assets more exposed and susceptible to future flood risk. Based on the LULC pattern, it is observed that the land having natural vegetation has a strong direct relation with flood runoff, as it can affect the speed of water during the flood. The areas that have low vegetation are more susceptible to flooding and erosion. As shown in Figure 5, most of the areas near the river have less vegetation, which leads to higher susceptibility to flooding. Flood risk is strongly linked to the LULC pattern. Unplanned land use and urbanisation in Mirzadhare’s northwest floodplain make it vulnerable to future flooding. Urbanization is positively correlated with the growth of built-up areas and negatively correlated with the permeability of the land, suggesting a greater susceptibility to flooding. This further implies that urbanisation increases built-up areas and decreases land permeability, both of which contribute to heightened flood susceptibility. Unplanned LULC and unsustainable infrastructure development intensify the risk of flooding in flood-prone regions, particularly in urban areas (Ali et al. (2023). This direct relationship between vegetation cover and flood risk was also evaluated in the same manner by recent studies (Tanoue et al., 2016; Uddin et al., 2019; Sarkar and Mondal, 2020; Ullah and Zhang, 2020; Rahman et al., 2023). Area GDP also shows high susceptibility to flood as the area is dependent on agriculture and more than 40% of agricultural land is there on the riverside in the floodplain. Higher GDP locations developed in floodplains are more prone to floods and massive disruption without mitigation. In conclusion, while there is a straightforward correlation between a region’s GDP and its susceptibility to flooding, the relationship is intricate and multifaceted. The results also reveal that most of the GDP of Mirzadhare depends on the agriculture sector, which is based in the floodplain and shows higher susceptibility to flood. However, other elements, including social vulnerability, readiness, and availability of financial resources also play critical roles in determining the total impact of floods on a region’s economy as analyzed by recent studies (Wang et al., 2011; Chakrabortty et al., 2018; Vignesh et al., 2021). Recently, Ceesay (2020) shows that greater GDP may improve resources and resilience. However, GDP of our study region was dependent on agriculture sector, which is one of the most vulnerable sectors to flooding in Pakistan. This research shows that GDP coupled with other socioeconomic factors is critical when assessing and managing flood risk in a flood-prone region.
Ullah and Zhang (2020) and Luu et al. (2018) found a linear association between population density and flood vulnerability in high and low exposure rates. Population density and flood risk are strongly correlated, showing that higher population densities are often associated with higher flood vulnerability. The relationship between population density and flood vulnerability is very strong and typically viewed as positive, indicating that larger population densities are frequently linked to higher flood vulnerability in the area (Shen et al., 2022). This association can be explained by a number of factors; areas with higher population densities are more urbanized and have more structures, roads, and infrastructure. These factors increase impermeable surfaces, such as concrete and asphalt, which stop natural water infiltration and can lead to flooding in urban areas (Li et al., 2021). Socially vulnerable populations, such as low-income communities or marginalized groups, could be more concentrated in densely populated places (Tanoue et al., 2016; Sarkar and Mondal, 2020). Areas showing high population density in the floodplain are highly exposed and vulnerable to flood risk as shown in Figure 3D showing the population exposure to flood and Figure 5 shows a high level of vulnerability for the population settled in the floodplain. Effective urban planning, infrastructure investments for flood mitigation, early warning systems, and community readiness, for instance, can all work together to lessen flood susceptibility even in densely populated places as discussed in different research studies (Nasiri et al., 2019; Moreira et al., 2021). The core part of the flood risk assessment is the flood vulnerability assessment. The spatial flood risk assessment is a great tool to utilize when attempting to minimise flood risk, as it helps to pinpoint, which regions are at high, medium, and low levels of vulnerability as shown in Figure 5. Based on their historical context and current conditions, local stakeholders and the relevant authorities are contacted for primary data information and validation of the data. As shown in Figure 5, more than 50% of the study area is highly vulnerable and exposed to future flooding. This is the result of unplanned LULC, disturbance of natural vegetation and the clearing of land for agricultural activities, and the construction of buildings from low-quality materials in the floodplains.
The study uses an innovative method, distinguishing it from earlier studies in Khyber Pukhtunkhwa investigating flood vulnerability, particularly in Mirzadhare area, located along the Swat River Basin. This research provides precise and extensive field data for spatial analysis. Evaluation in a GIS platform developed a flood vulnerability map including exposure. DEM and flood depth with extent model were frequently employed to create flood-likelihood conditions when settlements moved farther towards the river. This study estimates flood hazards and susceptibility using flood mark data in the area based on the recent flood without hydraulic modelling for validation of the distance between the river and settlements. Flood susceptibility findings from this study can be used to create flood risk management plans for the neighborhood districts and other regions with the limitations of having the same topographic and climate conditions. Decision-makers can use flood vulnerability maps and results that could improve land use planning. The findings of this study will help groups implement their annual development goals to mitigate vulnerabilities to any future flooding.
6 Conclusion
To achieve the main objective of this research as to find the vulnerability of the area, the data about exposure and degree of susceptibility for several indicators are presented and analysed in this study. Based on the analysis’s above conclusion, some of the recommendations below are crucial for better flood control in the vulnerable areas of Mirzadhare.
(1) The vulnerable area index system’s design reveals the vulnerability level of the region. Women, children, the elderly, and individuals with disabilities are just a few of the area’s many vulnerable populations. Because they spent most of their time at home, disabled individuals and women were most commonly impacted when a flood occurred. The gov’t stakeholders suggested monitoring water levels to anticipate and prepare for any upcoming flooding. However, the important thing is to train the local people on how to respond in different pre-, during-, and post-stages of flooding.
(2) The vulnerable areas’ spatial distribution patterns reveal distinct flooding seasons. It is also suggested that the natural basin of the river should remain the same and that human encroachment should be controlled because it has been observed that the majority of the community members have altered that area of the river’s natural basin due to their encroachment for agricultural purposes, making their vulnerability high. Extensive agricultural practices should not be permitted in areas directly along the banks of rivers to limit flood damage to the agricultural sector, and activities with a high risk of flooding should not be permitted in risk zones.
(3) Various pertinent agencies involved in flood control, including the Federal Flood Commission and the Irrigation Department, must address the leading cause of flood susceptibility. To improve the locals’ ability to control flooding, provincial disaster management authorities must conduct inspections and training programs. Additionally, it is suggested that the local government implement some mitigating measures to build protective barriers along the riverbank, particularly in regions with a risk of water outbursts. Government and non-government organisations must invest in flood defenses such as levees, dams, or other structures to minimise the risk of flooding.
(4) The investigation of flood susceptibility at the local level provides valuable insights for developing customized risk management strategies in the neighborhoods across the entire district. Furthermore, these findings can be expanded to other districts with similar topographical characteristics. The flood vulnerability map can be utilized by decision-makers to inform strategic decision-making processes, particularly in the context of land use planning. The successful implementation of a comprehensive framework for regional-based flood vulnerability management in the future would necessitate the active collaboration and involvement of experts, stakeholders, and committees.
(5) In practical terms, this study provides relevant stakeholders with the necessary information and tools to effectively implement annual development plans aimed at limiting the risks associated with future flooding events. Collaboration plays a crucial role in facilitating the integration of insights into decision-making processes, hence promoting resilience and mitigating risks within the wider framework of managing flood vulnerability.
Data availability statement
The raw data supporting the conclusion of this article will be made available by the authors, without undue reservation.
Ethics statement
Ethical review and approval was not required for the study on human participants in accordance with the local legislation and institutional requirements. Written informed consent from the [patients/participants OR patients/participants legal guardian/next of kin] was not required to participate in this study in accordance with the national legislation and the institutional requirements.
Author contributions
MI: Conceptualization, Data curation, Investigation, Methodology, Writing–original draft. AH: Conceptualization, Methodology, Supervision, Writing–review and editing. WU: Conceptualization, Funding acquisition, Methodology, Writing–review and editing. SU: Methodology, Validation, Writing–review and editing. AA: Formal Analysis, Validation, Visualization, Writing–review and editing. FZ: Data curation, Software, Visualization, Writing–review and editing.
Funding
The authors declare financial support was received for the research, authorship, and/or publication of this article. This work was supported by the National Natural Science Foundation of China (Grant Nos 41877232 and 41790444); and the Chinese Academy of Sciences Strategic Leading Science and Technology Project (Class A) (XDA20030302). The authors acknowledge Rabdan Academy, United Arab Emirates (UAE) for supporting article processing charges (APC).
Acknowledgments
The authors acknowledge the National Disaster Management Authority (NDMA), Pakistan, and Provincial Disaster Management Authority (PDMA), Khyber Pakhtunkhwa, Pakistan for providing historical and spatial data on flood exposure and damages. The authors also acknowledge Rabdan Academy, United Arab Emirates (UAE) for supporting Article Processing Charges (APC). The authors are thankful to the Environmental Systems Research Institute (ESRI) for land use land/cover data. The authors are grateful to the reviewers for their insightful remarks for enlightening the manuscript.
Conflict of interest
The authors declare that the research was conducted in the absence of any commercial or financial relationships that could be construed as a potential conflict of interest.
Publisher’s note
All claims expressed in this article are solely those of the authors and do not necessarily represent those of their affiliated organizations, or those of the publisher, the editors and the reviewers. Any product that may be evaluated in this article, or claim that may be made by its manufacturer, is not guaranteed or endorsed by the publisher.
References
Abbas, A., Bhatti, A. S., Ullah, S., Ullah, W., Waseem, M., Zhao, C., et al. (2023a). Projection of precipitation extremes over South asia from CMIP6 GCMs. J. Arid. Land 15, 274–296. doi:10.1007/s40333-023-0050-3
Abbas, A., Ullah, S., Ullah, W., Waseem, M., Dou, X., Zhao, C., et al. (2022). Evaluation and projection of precipitation in Pakistan using the coupled model intercomparison project phase 6 model simulations. Int. J. Climatol. 42, 6665–6684. doi:10.1002/joc.7602
Abbas, A., Ullah, S., Ullah, W., Zhao, C., Karim, A., Waseem, M., et al. (2023b). Characteristics of winter precipitation over Pakistan and possible causes during 1981–2018. Water 15 (13), 2420. doi:10.3390/w15132420
Ali, A., Ullah, W., Khan, U. A., Ullah, S., Ali, A., Jan, M. A., et al. (2023). Assessment of multi-components and sectoral vulnerability to urban floods in Peshawar–Pakistan. Nat. Hazards Res. doi:10.1016/j.nhres.2023.12.012
Antronico, L., De Pascale, F., Coscarelli, R., and Gullà, G. (2020). Landslide risk perception, social vulnerability and community resilience: the case study of Maierato (Calabria, southern Italy). Int. J. Disaster Risk Reduct. 46, 101529. doi:10.1016/j.ijdrr.2020.101529
Asri, M. A., Awam, F. K., and Shamsudin, S. (2009). Floodplain management at tiram river watershed using web hiper 3+. Univ. Teknol. Malays. Available at: https://books.google.com/books?id=KRXTnQAACAAJ.
Babcicky, P., and Seebauer, S. (2021). People, not just places: expanding physical and social vulnerability indices by psychological indicators. J. Flood Risk Manag. 14 (4), e12752. doi:10.1111/jfr3.12752
Balica, S. F., Wright, N. G., and van der Meulen, F. (2012). A flood vulnerability index for coastal cities and its use in assessing climate change impacts. Nat. Hazards 64 (1), 73–105. doi:10.1007/s11069-012-0234-1
Birkmann, J. (2007). Measuring vulnerability to promote disaster-resilient societies. Meas. vulnerability Nat. hazards Towards disaster resilient Soc. 9. doi:10.35248/2157-7463.20.11.404
Blaikie, P., Immanuel, D., Wu, J., Li, N., Yajnik, V., and Margolis, B. (1994). A region in Shc distinct from the SH2 domain can bind tyrosine-phosphorylated growth factor receptors. J. Biol. Chem. 269 (51), 32031–32034. doi:10.1016/s0021-9258(18)31593-x
Boroushaki, S., and Malczewski, J. (2010). Using the fuzzy majority approach for GIS-based multicriteria group decision-making. Comput. Geosciences 36 (3), 302–312. doi:10.1016/j.cageo.2009.05.011
Burton, C., Rufat, S., and Tate, E. (2018). Social vulnerability. Vulnerability and resilience to natural hazards. Cambridge: University Press, 53–81.
Ceesay, E. (2020). Does flood disaster lessen GDP growth. Evid. Gambia’s Manuf. Agric. Sect. 11, 404. doi:10.35248/2157-7463.20.11.404
Chakrabortty, R., Pal, S. C., Malik, S., and Das, B. (2018). Modeling and mapping of groundwater potentiality zones using AHP and GIS technique: a case study of Raniganj Block, Paschim Bardhaman, West Bengal. Model. Earth Syst. Environ. 4, 1085–1110. doi:10.1007/s40808-018-0471-8
Chen, K., Blong, R. J., and Jacobson, C. (2001). MCE-RISK: integrating multicriteria evaluation and GIS for risk decision-making in natural hazards. Environ. Model. Softw. 16, 387–397. doi:10.1016/s1364-8152(01)00006-8
Das, B., and Pal, S. C. (2020a). Assessment of groundwater vulnerability to over-exploitation using MCDA, AHP, fuzzy logic and novel ensemble models: a case study of Goghat-I and II blocks of West Bengal, India. Environ. earth Sci. 79 (5), 104. doi:10.1007/s12665-020-8843-6
Das, B., and Pal, S. C. (2020b). Irrigation practices causing vulnerability of groundwater resources in water scarce Goghat-I and II Blocks of Hugli District using MCDA, AHP, Fuzzy logic and novel ensemble models. Adv. Space Res. 65 (12), 2733–2748. doi:10.1016/j.asr.2020.03.027
Dewan, A. (2013). Floods in a megacity: geospatial techniques in assessing hazards, risk and vulnerability (1 ed). Springer Dordrecht. doi:10.1007/978-94-007-5875-9
Fakhruddin, B. S., Reinen-Hamill, R., and Robertson, R. (2019). Extent and evaluation of vulnerability for disaster risk reduction of urban Nuku'alofa, Tonga. Prog. Disaster Sci. 2, 100017. doi:10.1016/j.pdisas.2019.100017
Farooq, M., Shafique, M., and Khattak, M. S. (2019). Flood hazard assessment and mapping of River Swat using HEC-RAS 2D model and high-resolution 12-m TanDEM-X DEM (WorldDEM). Nat. Hazards 97, 477–492. doi:10.1007/s11069-019-03638-9
Hamidi, A. R., Jing, L., Shahab, M., Azam, K., Atiq Ur Rehman Tariq, M., and Ng, A. W. (2022). Flood exposure and social vulnerability analysis in rural areas of developing countries: an empirical study of Charsadda District, Pakistan. Water 14 (7), 1176. doi:10.3390/w14071176
Hendricks, M. D., Meyer, M. A., Gharaibeh, N. G., Van Zandt, S., Masterson, J., Cooper, J. T., et al. (2018). The development of a participatory assessment technique for infrastructure: neighborhood-level monitoring towards sustainable infrastructure systems. Sustain. cities Soc. 38, 265–274. doi:10.1016/j.scs.2017.12.039
Huo, A., Huang, Z., Cheng, Y., and Van Liew, M. W. (2020). Comparison of two different approaches for sensitivity analysis in Heihe River basin (China). Water Supply 20 (1), 319–327. doi:10.2166/ws.2019.159
Huo, A., and Li, H. (2013). Assessment of climate change impact on the stream-flow in a typical debris flow watershed of Jianzhuangcuan catchment in Shaanxi Province, China. Environ. earth Sci. 69, 1931–1938. doi:10.1007/s12665-012-2025-0
Huo, A., Peng, J., Cheng, Y., Zheng, X., and Wen, Y. (2019). Temporal characteristics of the rainfall induced landslides in the Chinese loess plateau (China) recent advances in geo-environmental engineering, geomechanics and geotechnics, and geohazards: proceedings of the 1st springer conference of the arabian journal of geosciences (CAJG-1). Tunisia 2018. doi:10.1007/978-3-030-01665-4_98
Huo, A., Zhang, J., Qiao, C., Li, C., Xie, J., Wang, J., et al. (2014). Multispectral remote sensing inversion for city landscape water eutrophication based on Genetic Algorithm-Support Vector Machine. Water Qual. Res. J. Can. 49 (3), 285–293. doi:10.2166/wqrjc.2014.040
Huo, A., Zhao, Z., Luo, P., Zheng, C., Peng, J., and Abuarab, M. E.-S. (2022). Assessment of spatial heterogeneity of soil moisture in the critical zone of gully consolidation and highland protection. Water 14 (22), 3674. doi:10.3390/w14223674
Huo, A.-D., Dang, J., Song, J.-X., Chen, X. H., and Mao, H.-R. (2016). Simulation modeling for water governance in basins based on surface water and groundwater. Agric. Water Manag. 174, 22–29. doi:10.1016/j.agwat.2016.02.027
Hussain, A., Hussain, I., Ali, S., Ullah, W., Khan, F., Ullah, S., et al. (2023b). Spatiotemporal temperature trends over homogenous climatic regions of Pakistan during 1961–2017. Theor. Appl. Climatol. 153, 397–415. doi:10.1007/s00704-023-04484-3
Hussain, M., Tayyab, M., Ullah, K., Ullah, S., Rahman, Z. U., Zhang, J., et al. (2023). Development of a new integrated flood resilience model using machine learning with GIS-based multi-criteria decision analysis. Urban Clim. 50, 101589. doi:10.1016/j.uclim.2023.101589
Ishizaka, A., and Labib, A. (2009). Analytic hierarchy process and expert choice: benefits and limitations. OR Insight 22 (4), 201–220. doi:10.1057/ori.2009.10
Kafle, S. K., and Murshed, Z. (2006). Community-based disaster risk management for local authorities. Bangkok: Asian Disaster Preparedness Center, 19–27.
Khan, A. N., Khan, S. N., Ullah, S., Aqil, M., et al. (2016). Flood vulnerability assessment in union council, jahangira, district nowshera, Pakistan. J. Sci. Technol. 40, 21–30.
Khan, I., Ali, A., Waqas, T., Ullah, S., Ullah, S., Shah, A. A., et al. (2022a). Investing in disaster relief and recovery: a reactive approach of disaster management in Pakistan. Int. J. Disaster Risk Reduct. 75, 102975. doi:10.1016/j.ijdrr.2022.102975
Khan, I., Waqas, T., Samiullah, H., and Ullah, S. (2020). Precipitation variability and its trend detection for monitoring of drought hazard in northern mountainous region of Pakistan. Arab. J. Geosci. 13, 698–718. doi:10.1007/s12517-020-05700-4
Kobayashi, Y., and Porter, J. W. (2012). Flood risk management in the people's Republic of China: learning to live with flood risk. Asian development bank. Available at: https://books.google.com/books?id=GxI_CQAAQBAJ.
Koko, F. A., Yue, W., Abdullahi Abubakar, G., Hamed, R., and Noman Alabsi, A. A. (2021). Analyzing urban growth and land cover change scenario in Lagos, Nigeria using multi-temporal remote sensing data and GIS to mitigate flooding. Geomatics, Nat. Hazards Risk 12 (1), 631–652. doi:10.1080/19475705.2021.1887940
Li, G.-F., Xiang, X.-Y., Tong, Y.-Y., and Wang, H.-M. (2013). Impact assessment of urbanization on flood risk in the Yangtze River Delta. Stoch. Environ. Res. Risk Assess. 27 (7), 1683–1693. doi:10.1007/s00477-013-0706-1
Li, Z., Song, K., and Peng, L. (2021). Flood risk assessment under land use and climate change in Wuhan city of the Yangtze River Basin, China. Land 10 (8), 878. doi:10.3390/land10080878
Luu, C., Von Meding, J., and Kanjanabootra, S. (2018). Assessing flood hazard using flood marks and analytic hierarchy process approach: a case study for the 2013 flood event in Quang Nam, Vietnam. Nat. Hazards 90 (3), 1031–1050. doi:10.1007/s11069-017-3083-0
Merz, B., Kreibich, H., and Lall, U. (2013). Multi-variate flood damage assessment: a tree-based data-mining approach. Nat. Hazards Earth Syst. Sci. 13 (1), 53–64. doi:10.5194/nhess-13-53-2013
Mogebisa, T. (2021). Potential impacts of climate change on hydrological extremes in the incomati river basin faculty of science.
Moreira, L. L., de Brito, M. M., and Kobiyama, M. (2021). Review article: a systematic review and future prospects of flood vulnerability indices. Nat. Hazards Earth Syst. Sci. 21 (5), 1513–1530. doi:10.5194/nhess-21-1513-2021
Mu, D., Luo, P., Lyu, J., Zhou, M., Huo, A., Duan, W., et al. (2021). 2021/03/01 Impact of temporal rainfall patterns on flash floods in Hue City, Vietnam. J. Flood Risk Manag. 14 (1), e12668. doi:10.1111/jfr3.12668
Nasiri, H., and Shahmohammadi-Kalalagh, S. (2013). Flood vulnerability index as a knowledge base for flood risk assessment in urban area. J. Nov. Appl. Sci. 2 (8), 269–272.
Nasiri, H., Yusof, M. J. M., Ali, T. A. M., and Hussein, M. K. B. (2019). District flood vulnerability index: urban decision-making tool. Int. J. Environ. Sci. Technol. 16 (5), 2249–2258. doi:10.1007/s13762-018-1797-5
Office of the United Nations Disaster Relief Co-Ordinator (1982). Shelter after disaster: guidelines for assistance. UN .
Pelling, M. (2003). Natural disaster and development in a globalizing world. 1st edition ed. China: Routledge.
Penning-Rowsell, E., Floyd, P., Ramsbottom, D., and Surendran, S. (2005). Estimating injury and loss of life in floods: a deterministic framework. Nat. Hazards 36 (1), 43–64. doi:10.1007/s11069-004-4538-7
Qin, Y., Xu, X., Xu, K., Li, A., and Yang, D. (2013). Fuzzy evaluation system of agriculture drought disaster risk and its application. Trans. Chin. Soc. Agric. Eng. 29 (10), 83–91. doi:10.3969/j.issn.1002-6819.2013.10.012
Rafiq, L., and Blaschke, T. (2012). Disaster risk and vulnerability in Pakistan at a district level. Geomatics, Nat. Hazards Risk 3 (4), 324–341. doi:10.1080/19475705.2011.626083
Rahman, A., Mahmood, S., Dawood, M., Rahman, G., and Chen, F. (2019). Impact of climate change on flood factors and extent of damages in the Hindu Kush Region. Oxf. Res. Encycl. Nat. Hazard Sci. doi:10.1093/acrefore/9780199389407.013.316
Rahman, Z. U., Ullah, W., Bai, S., Ullah, S., Jan, M. A., Khan, M., et al. (2023). GIS-based flood susceptibility mapping using bivariate statistical model in Swat River Basin, Eastern Hindukush region, Pakistan. Front. Environ. Sci. 11. doi:10.3389/fenvs.2023.1178540
Rana, I. A., and Routray, J. K. (2018). Integrated methodology for flood risk assessment and application in urban communities of Pakistan. Nat. Hazards 91, 239–266. doi:10.1007/s11069-017-3124-8
Razi, M. F., Keremane, M. L., Ramadugu, C., Roose, M., Khan, I. A., and Lee, R. F. (2014). Detection of citrus huanglongbing-associated ‘Candidatus Liberibacter asiaticus’ in citrus and Diaphorina citri in Pakistan, seasonal variability, and implications for disease management. Phytopathology 104 (3), 257–268. doi:10.1094/phyto-08-13-0224-r
Rebi, A., Hussain, A., Hussain, I., Cao, J., Ullah, W., Abbas, H., et al. (2023). Spatiotemporal precipitation trends and associated large-scale teleconnections in northern Pakistan. Atmos. (Basel) 14, 871. doi:10.3390/atmos14050871
Ross, E., and Cross, T. (2010). Flood rapid assessment report KHYBER PAKHTOONKHWA: districts Charsadda, nowshera, pehsawar, and Swat. USA: N. D. M. Authority.
Rossi, F., and Villani, P. (1994). A project for regional analysis of floods in Italy. NATO ASI Ser. E Appl. Sci. 257, 193. doi:10.1007/978-94-011-1098-3_11
Roy, P., Pal, S. C., Chakrabortty, R., Chowdhuri, I., Malik, S., and Das, B. (2020). Threats of climate and land use change on future flood susceptibility. J. Clean. Prod. 272, 122757. doi:10.1016/j.jclepro.2020.122757
Ruidas, D., Chakrabortty, R., Islam, A. R. M. T., Saha, A., and Pal, S. C. (2022a). A novel hybrid of meta-optimization approach for flash flood-susceptibility assessment in a monsoon-dominated watershed, Eastern India. Environ. earth Sci. 81 (5), 145. doi:10.1007/s12665-022-10269-0
Ruidas, D., Saha, A., Islam, A. R. M. T., Costache, R., and Pal, S. C. (2022b). Hydrogeochemical characterization-based water resources vulnerability assessment in India’s first Ramsar site of Chilka lake. Mar. Pollut. Bull. 184, 114107. doi:10.1016/j.marpolbul.2022.114107
Saaty, T. L. (1977). A scaling method for priorities in hierarchical structures. J. Math. Psychol. 15 (3), 234–281. doi:10.1016/0022-2496(77)90033-5
Saaty, T. L. (1990). How to make a decision: the analytic hierarchy process. Eur. J. operational Res. 48 (1), 9–26. doi:10.1016/0377-2217(90)90057-i
Sarkar, D., and Mondal, P. (2020). Flood vulnerability mapping using frequency ratio (FR) model: a case study on Kulik river basin, Indo-Bangladesh Barind region. Appl. Water Sci. 10 (1), 17–13. doi:10.1007/s13201-019-1102-x
Scheuer, S., Haase, D., and Meyer, V. (2011). Exploring multicriteria flood vulnerability by integrating economic, social and ecological dimensions of flood risk and coping capacity: from a starting point view towards an end point view of vulnerability. Nat. Hazards 58 (2), 731–751. doi:10.1007/s11069-010-9666-7
Shah, A. A., Ye, J., Pan, L., Ullah, R., Shah, S. I. A., Fahad, S., et al. (2018). Schools’ flood emergency preparedness in Khyber Pakhtunkhwa province, Pakistan. Int. J. Disaster Risk Sci. 9, 181–194. doi:10.1007/s13753-018-0175-8
Shah, A. A., Ye, J., Shaw, R., Ullah, R., and Ali, M. (2020). Factors affecting flood-induced household vulnerability and health risks in Pakistan: the case of Khyber Pakhtunkhwa (KP) Province. Int. J. Disaster Risk Reduct. 42, 101341. doi:10.1016/j.ijdrr.2019.101341
Shen, L., Wen, J., Zhang, Y., Ullah, S., Cheng, J., and Meng, X. (2022). Changes in population exposure to extreme precipitation in the Yangtze River Delta, China. Clim. Serv. 27, 100317. doi:10.1016/j.cliser.2022.100317
Tanoue, M., Hirabayashi, Y., and Ikeuchi, H. (2016). Global-scale river flood vulnerability in the last 50 years. Sci. Rep. 6 (1), 36021. doi:10.1038/srep36021
Tayyab, M., Zhang, J., Hussain, M., Ullah, S., Liu, X., Khan, S. N., et al. (2021). GIS-based urban flood resilience assessment using urban flood resilience model: a case study of peshawar city, khyber Pakhtunkhwa, Pakistan. Remote Sens. (Basel) 13, 1864. doi:10.3390/rs13101864
Thieken, A., Merz, B., Kreibich, H., and Apel, H. (2023). Methods for flood risk assessment: concepts and challenges. Muscat–Sultanate of Oman: In International workshop on flash floods in urban areas, 1–12.
Uddin, M. N., Islam, A. S., Bala, S. K., Islam, G. T., Adhikary, S., Saha, D., et al. (2019). Mapping of climate vulnerability of the coastal region of Bangladesh using principal component analysis. Appl. Geogr. 102, 47–57. doi:10.1016/j.apgeog.2018.12.011
Ullah, K., and Zhang, J. (2020). GIS-based flood hazard mapping using relative frequency ratio method: a case study of Panjkora River Basin, eastern Hindu Kush, Pakistan. Plos one 15 (3), e0229153. doi:10.1371/journal.pone.0229153
Ullah, S., You, Q., Ali, A., Ullah, W., Jan, M. A., Zhang, Y., et al. (2019). Observed changes in maximum and minimum temperatures over China- Pakistan economic corridor during 1980–2016. Atmos. Res. 216, 37–51. doi:10.1016/j.atmosres.2018.09.020
Ullah, S., You, Q., Ullah, W., and Ali, A. (2018). Observed changes in precipitation in China-Pakistan economic corridor during 1980–2016. Atmos. Res. 210, 1–14. doi:10.1016/j.atmosres.2018.04.007
Ullah, S., You, Q., Zhang, Y., Bhatti, A. S., Ullah, W., Hagan, D. F. T., et al. (2020). Evaluation of CMIP5 models and projected changes in temperatures over South Asia under global warming of 1.5 oC, 2 oC, and 3 oC. Atmos. Res. 246, 105122. doi:10.1016/j.atmosres.2020.105122
Ullah, W., Karim, A., Ullah, S., Rehman, A., Bibi, T., Wang, G., et al. (2023). An increasing trend in daily monsoon precipitation extreme indices over Pakistan and its relationship with atmospheric circulations. Front. Environ. Sci. 11, 1228817. doi:10.3389/fenvs.2023.1228817
Ullah, W., Wang, G., Lou, D., Ullah, S., Bhatti, A. S., Ullah, S., et al. (2021). Large-scale atmospheric circulation patterns associated with extreme monsoon precipitation in Pakistan during 1981–2018. Atmos. Res. 253, 105489. doi:10.1016/j.atmosres.2021.105489
UNESCO (2009). Global trends in water-related disasters: an insight for policymakers. UNESCO. Available at: https://unesdoc.unesco.org/ark:/48223/pf0000184137_eng.
UNISDR (2004). Living with Risk: a global review of disaster reduction initiatives. Geneva, Switzerland: UN Publications.
Van Westen, C., Alkema, D., Damen, M., Kerle, N., and Kingma, N. (2009). Multi-hazard risk assessment, guide book. Distance education course, Faculty of Geo-Information Science and Earth Observation (ITC), University of Twente.
Vignesh, K. S., Anandakumar, I., Ranjan, R., and Borah, D. (2021). Flood vulnerability assessment using an integrated approach of multi-criteria decision-making model and geospatial techniques. Model. Earth Syst. Environ. 7 (2), 767–781. doi:10.1007/s40808-020-00997-2
Wang, B., Xu, G., Li, P., Li, Z., Zhang, Y., Cheng, Y., et al. (2020). Vegetation dynamics and their relationships with climatic factors in the Qinling Mountains of China. Ecol. Indic. 108, 105719. doi:10.1016/j.ecolind.2019.105719
Wang, X., Xia, J., Zhou, M., Deng, S., and Li, Q. (2022). Assessment of the joint impact of rainfall and river water level on urban flooding in Wuhan City, China. J. Hydrology 613, 128419. doi:10.1016/j.jhydrol.2022.128419
Wang, Y., Li, Z., Tang, Z., and Zeng, G. (2011). A GIS-based spatial multi-criteria approach for flood risk assessment in the dongting lake region, hunan, Central China. Water Resour. Manag. 25 (13), 3465–3484. doi:10.1007/s11269-011-9866-2
Wisner, B., Blaikie, P. M., Blaikie, P., Cannon, T., and Davis, I. (2004). At risk: natural hazards, people's vulnerability and disasters. China: Psychology Press.
Wooldridge, S., Kalma, J., and Kuczera, G. (2001, Parameterisation of a simple semi-distributed model for assessing the impact of land-use on hydrologic response. J. Hydrology, 254(1), 16–32. doi:10.1016/S0022-1694(01)00489-9
Yan, L., and Xu, X. (2010). Assessing the vulnerability of social–environmental system from the perspective of hazard, sensitivity, and resilience: a case study of Beijing, China. Environ. earth Sci. 61, 1179–1186. doi:10.1007/s12665-009-0440-7
Yu, Y., You, Q., Zuo, Z., Zhang, Y., Cai, Z., Li, W., et al. (2023). Compound climate extremes in China: trends, causes, and projections. Atmos. Res. 286, 106675. doi:10.1016/j.atmosres.2023.106675
Zaman, S., Sammonds, P., Ahmed, B., and Rahman, T. (2020). Disaster risk reduction in conflict contexts: lessons learned from the lived experiences of Rohingya refugees in Cox's Bazar, Bangladesh. Int. J. Disaster Risk Reduct. 50, 101694. doi:10.1016/j.ijdrr.2020.101694
Keywords: flood vulnerability assessment, GIS, analytical hierarchy process (AHP), Charsadda, Pakistan
Citation: Ibrahim M, Huo A, Ullah W, Ullah S, Ahmad A and Zhong F (2024) Flood vulnerability assessment in the flood prone area of Khyber Pakhtunkhwa, Pakistan. Front. Environ. Sci. 12:1303976. doi: 10.3389/fenvs.2024.1303976
Received: 28 September 2023; Accepted: 05 January 2024;
Published: 19 January 2024.
Edited by:
Heike Hartmann, Slippery Rock University of Pennsylvania, United StatesReviewed by:
Zhongfan Zhu, Beijing Normal University, ChinaSubodh Chandra Pal, University of Burdwan, India
Copyright © 2024 Ibrahim, Huo, Ullah, Ullah, Ahmad and Zhong. This is an open-access article distributed under the terms of the Creative Commons Attribution License (CC BY). The use, distribution or reproduction in other forums is permitted, provided the original author(s) and the copyright owner(s) are credited and that the original publication in this journal is cited, in accordance with accepted academic practice. No use, distribution or reproduction is permitted which does not comply with these terms.
*Correspondence: Aidi Huo, huoaidi@chd.edu.cn; Waheed Ullah, wullah@ra.ac.ae